American vs Immigrants from Scotland Single Mother Poverty
COMPARE
American
Immigrants from Scotland
Single Mother Poverty
Single Mother Poverty Comparison
Americans
Immigrants from Scotland
33.5%
SINGLE MOTHER POVERTY
0.0/ 100
METRIC RATING
303rd/ 347
METRIC RANK
27.6%
SINGLE MOTHER POVERTY
98.9/ 100
METRIC RATING
81st/ 347
METRIC RANK
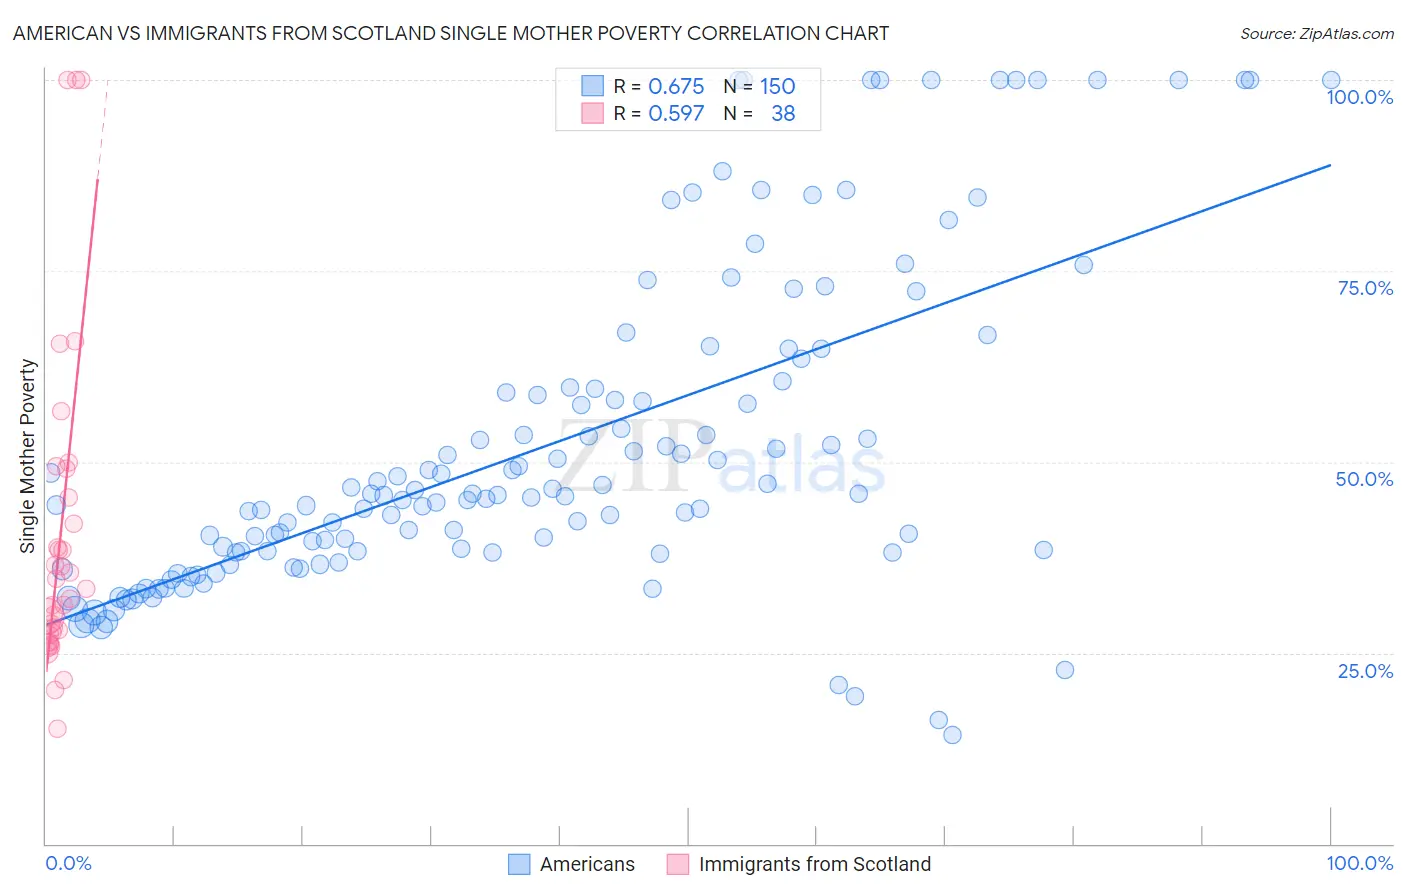
American vs Immigrants from Scotland Single Mother Poverty Correlation Chart
The statistical analysis conducted on geographies consisting of 551,658,648 people shows a significant positive correlation between the proportion of Americans and poverty level among single mothers in the United States with a correlation coefficient (R) of 0.675 and weighted average of 33.5%. Similarly, the statistical analysis conducted on geographies consisting of 192,448,213 people shows a substantial positive correlation between the proportion of Immigrants from Scotland and poverty level among single mothers in the United States with a correlation coefficient (R) of 0.597 and weighted average of 27.6%, a difference of 21.4%.
Single Mother Poverty Correlation Summary
| Measurement | American | Immigrants from Scotland |
| Minimum | 14.3% | 15.0% |
| Maximum | 100.0% | 100.0% |
| Range | 85.7% | 85.0% |
| Mean | 51.9% | 40.1% |
| Median | 45.5% | 32.7% |
| Interquartile 25% (IQ1) | 38.2% | 27.4% |
| Interquartile 75% (IQ3) | 59.6% | 45.3% |
| Interquartile Range (IQR) | 21.5% | 17.9% |
| Standard Deviation (Sample) | 21.0% | 21.1% |
| Standard Deviation (Population) | 20.9% | 20.8% |
Similar Demographics by Single Mother Poverty
Demographics Similar to Americans by Single Mother Poverty
In terms of single mother poverty, the demographic groups most similar to Americans are Mexican (33.6%, a difference of 0.10%), Immigrants from Central America (33.6%, a difference of 0.15%), Arapaho (33.4%, a difference of 0.26%), Immigrants from Somalia (33.4%, a difference of 0.41%), and Immigrants from Guatemala (33.3%, a difference of 0.65%).
| Demographics | Rating | Rank | Single Mother Poverty |
| Blackfeet | 0.0 /100 | #296 | Tragic 33.2% |
| Pennsylvania Germans | 0.0 /100 | #297 | Tragic 33.2% |
| Africans | 0.0 /100 | #298 | Tragic 33.3% |
| Immigrants | Guatemala | 0.0 /100 | #299 | Tragic 33.3% |
| Hispanics or Latinos | 0.0 /100 | #300 | Tragic 33.3% |
| Immigrants | Somalia | 0.0 /100 | #301 | Tragic 33.4% |
| Arapaho | 0.0 /100 | #302 | Tragic 33.4% |
| Americans | 0.0 /100 | #303 | Tragic 33.5% |
| Mexicans | 0.0 /100 | #304 | Tragic 33.6% |
| Immigrants | Central America | 0.0 /100 | #305 | Tragic 33.6% |
| Immigrants | Congo | 0.0 /100 | #306 | Tragic 33.8% |
| Comanche | 0.0 /100 | #307 | Tragic 33.9% |
| Immigrants | Mexico | 0.0 /100 | #308 | Tragic 34.0% |
| Potawatomi | 0.0 /100 | #309 | Tragic 34.1% |
| Hondurans | 0.0 /100 | #310 | Tragic 34.2% |
Demographics Similar to Immigrants from Scotland by Single Mother Poverty
In terms of single mother poverty, the demographic groups most similar to Immigrants from Scotland are Immigrants from Cameroon (27.6%, a difference of 0.12%), Greek (27.7%, a difference of 0.18%), Immigrants from Latvia (27.7%, a difference of 0.21%), Mongolian (27.7%, a difference of 0.21%), and Immigrants from Ukraine (27.7%, a difference of 0.30%).
| Demographics | Rating | Rank | Single Mother Poverty |
| Immigrants | Europe | 99.3 /100 | #74 | Exceptional 27.4% |
| Immigrants | Sweden | 99.2 /100 | #75 | Exceptional 27.5% |
| Peruvians | 99.2 /100 | #76 | Exceptional 27.5% |
| Immigrants | Peru | 99.2 /100 | #77 | Exceptional 27.5% |
| Immigrants | North Macedonia | 99.2 /100 | #78 | Exceptional 27.5% |
| Immigrants | Italy | 99.1 /100 | #79 | Exceptional 27.5% |
| Taiwanese | 99.1 /100 | #80 | Exceptional 27.5% |
| Immigrants | Scotland | 98.9 /100 | #81 | Exceptional 27.6% |
| Immigrants | Cameroon | 98.8 /100 | #82 | Exceptional 27.6% |
| Greeks | 98.7 /100 | #83 | Exceptional 27.7% |
| Immigrants | Latvia | 98.7 /100 | #84 | Exceptional 27.7% |
| Mongolians | 98.7 /100 | #85 | Exceptional 27.7% |
| Immigrants | Ukraine | 98.6 /100 | #86 | Exceptional 27.7% |
| Afghans | 98.5 /100 | #87 | Exceptional 27.7% |
| Ethiopians | 98.4 /100 | #88 | Exceptional 27.7% |