American vs Slovak Single Mother Poverty
COMPARE
American
Slovak
Single Mother Poverty
Single Mother Poverty Comparison
Americans
Slovaks
33.5%
SINGLE MOTHER POVERTY
0.0/ 100
METRIC RATING
303rd/ 347
METRIC RANK
30.4%
SINGLE MOTHER POVERTY
2.8/ 100
METRIC RATING
238th/ 347
METRIC RANK
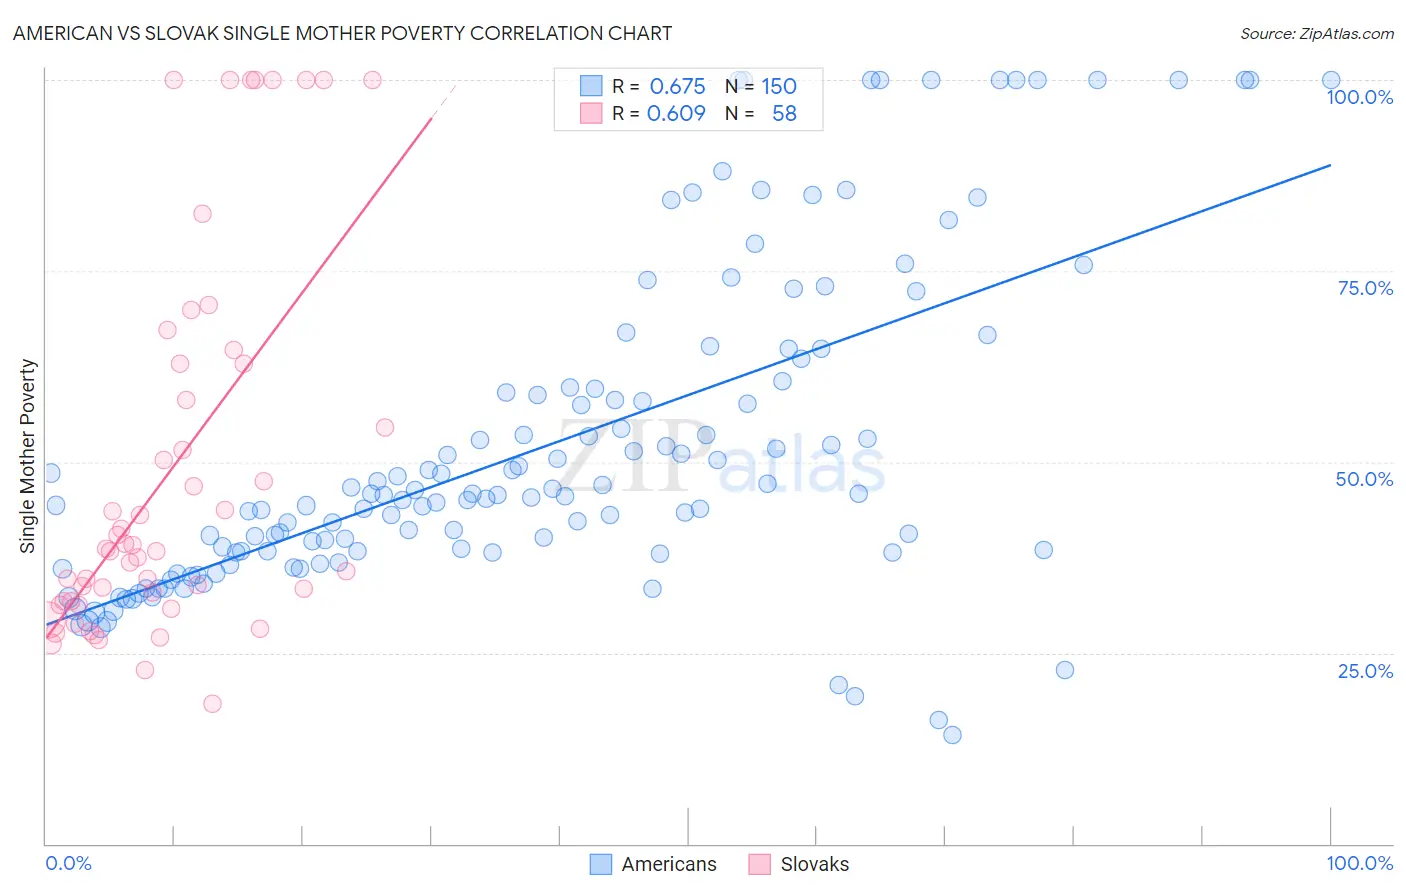
American vs Slovak Single Mother Poverty Correlation Chart
The statistical analysis conducted on geographies consisting of 551,658,648 people shows a significant positive correlation between the proportion of Americans and poverty level among single mothers in the United States with a correlation coefficient (R) of 0.675 and weighted average of 33.5%. Similarly, the statistical analysis conducted on geographies consisting of 384,889,889 people shows a significant positive correlation between the proportion of Slovaks and poverty level among single mothers in the United States with a correlation coefficient (R) of 0.609 and weighted average of 30.4%, a difference of 10.2%.
Single Mother Poverty Correlation Summary
| Measurement | American | Slovak |
| Minimum | 14.3% | 18.3% |
| Maximum | 100.0% | 100.0% |
| Range | 85.7% | 81.7% |
| Mean | 51.9% | 48.7% |
| Median | 45.5% | 38.4% |
| Interquartile 25% (IQ1) | 38.2% | 31.7% |
| Interquartile 75% (IQ3) | 59.6% | 62.8% |
| Interquartile Range (IQR) | 21.5% | 31.1% |
| Standard Deviation (Sample) | 21.0% | 24.5% |
| Standard Deviation (Population) | 20.9% | 24.3% |
Similar Demographics by Single Mother Poverty
Demographics Similar to Americans by Single Mother Poverty
In terms of single mother poverty, the demographic groups most similar to Americans are Mexican (33.6%, a difference of 0.10%), Immigrants from Central America (33.6%, a difference of 0.15%), Arapaho (33.4%, a difference of 0.26%), Immigrants from Somalia (33.4%, a difference of 0.41%), and Immigrants from Guatemala (33.3%, a difference of 0.65%).
| Demographics | Rating | Rank | Single Mother Poverty |
| Blackfeet | 0.0 /100 | #296 | Tragic 33.2% |
| Pennsylvania Germans | 0.0 /100 | #297 | Tragic 33.2% |
| Africans | 0.0 /100 | #298 | Tragic 33.3% |
| Immigrants | Guatemala | 0.0 /100 | #299 | Tragic 33.3% |
| Hispanics or Latinos | 0.0 /100 | #300 | Tragic 33.3% |
| Immigrants | Somalia | 0.0 /100 | #301 | Tragic 33.4% |
| Arapaho | 0.0 /100 | #302 | Tragic 33.4% |
| Americans | 0.0 /100 | #303 | Tragic 33.5% |
| Mexicans | 0.0 /100 | #304 | Tragic 33.6% |
| Immigrants | Central America | 0.0 /100 | #305 | Tragic 33.6% |
| Immigrants | Congo | 0.0 /100 | #306 | Tragic 33.8% |
| Comanche | 0.0 /100 | #307 | Tragic 33.9% |
| Immigrants | Mexico | 0.0 /100 | #308 | Tragic 34.0% |
| Potawatomi | 0.0 /100 | #309 | Tragic 34.1% |
| Hondurans | 0.0 /100 | #310 | Tragic 34.2% |
Demographics Similar to Slovaks by Single Mother Poverty
In terms of single mother poverty, the demographic groups most similar to Slovaks are Immigrants from St. Vincent and the Grenadines (30.4%, a difference of 0.11%), Welsh (30.4%, a difference of 0.16%), Immigrants from Grenada (30.3%, a difference of 0.23%), Immigrants from Middle Africa (30.3%, a difference of 0.25%), and Immigrants from Nicaragua (30.3%, a difference of 0.25%).
| Demographics | Rating | Rank | Single Mother Poverty |
| Dutch | 4.3 /100 | #231 | Tragic 30.2% |
| Alaskan Athabascans | 4.1 /100 | #232 | Tragic 30.3% |
| Immigrants | Middle Africa | 3.5 /100 | #233 | Tragic 30.3% |
| Immigrants | Nicaragua | 3.5 /100 | #234 | Tragic 30.3% |
| Immigrants | Grenada | 3.4 /100 | #235 | Tragic 30.3% |
| Welsh | 3.2 /100 | #236 | Tragic 30.4% |
| Immigrants | St. Vincent and the Grenadines | 3.1 /100 | #237 | Tragic 30.4% |
| Slovaks | 2.8 /100 | #238 | Tragic 30.4% |
| Immigrants | Portugal | 2.1 /100 | #239 | Tragic 30.5% |
| Salvadorans | 1.8 /100 | #240 | Tragic 30.6% |
| Immigrants | Laos | 1.8 /100 | #241 | Tragic 30.6% |
| Immigrants | Burma/Myanmar | 1.7 /100 | #242 | Tragic 30.6% |
| Bermudans | 1.6 /100 | #243 | Tragic 30.6% |
| French | 1.3 /100 | #244 | Tragic 30.7% |
| Barbadians | 1.3 /100 | #245 | Tragic 30.7% |