Carpatho Rusyn vs Cypriot Single Mother Poverty

COMPARE

Carpatho Rusyn
Race
Ancestry
AfghanAfricanAlaska NativeAlaskan AthabascanAlbanianAleutAlsatianAmericanApacheArabArapahoArgentineanArmenianAssyrian/Chaldean/SyriacAustralianAustrianBahamianBangladeshiBarbadianBasqueBelgianBelizeanBermudanBhutaneseBlackfeetBolivianBrazilianBritishBritish West IndianBulgarianBurmeseCajunCambodianCanadianCape VerdeanCarpatho RusynCelticCentral AmericanCentral American IndianCherokeeCheyenneChickasawChileanChineseChippewaChoctawColombianColvilleComancheCosta RicanCreeCreekCroatianCrowCubanCzechCzechoslovakianDanishDelawareDominicanDutchDutch West IndianEastern EuropeanEcuadorianEgyptianEnglishEstonianEthiopianEuropeanFijianFilipinoFinnishFrenchFrench American IndianFrench CanadianGermanGerman RussianGhanaianGreekGuamanian/ChamorroGuatemalanGuyaneseHaitianHmongHonduranHopiHoumaHungarianIcelanderIndian (Asian)IndonesianInupiatIranianIraqiIrishIroquoisIsraeliItalianJamaicanJapaneseJordanianKenyanKiowaKoreanLaotianLatvianLebaneseLiberianLithuanianLumbeeLuxembourgerMacedonianMalaysianMalteseMarshalleseMenomineeMexicanMexican American IndianMongolianMoroccanNative HawaiianNavajoNepaleseNew ZealanderNicaraguanNigerianNorthern EuropeanNorwegianOkinawanOsageOttawaPaiutePakistaniPalestinianPanamanianParaguayanPennsylvania GermanPeruvianPimaPolishPortuguesePotawatomiPuebloPuerto RicanPuget Sound SalishRomanianRussianSalvadoranSamoanScandinavianScotch-IrishScottishSeminoleSenegaleseSerbianShoshoneSierra LeoneanSiouxSlavicSlovakSloveneSomaliSouth AfricanSouth AmericanSouth American IndianSoviet UnionSpaniardSpanishSpanish AmericanSpanish American IndianSri LankanSubsaharan AfricanSudaneseSwedishSwissSyrianTaiwaneseThaiTlingit-HaidaTohono O'OdhamTonganTrinidadian and TobagonianTsimshianTurkishU.S. Virgin IslanderUgandanUkrainianUruguayanUteVenezuelanVietnameseWelshWest IndianYakamaYaquiYugoslavianYumanYup'ikZimbabwean
Immigration
NonimmigrantsImmigrantsAfghanistanAfricaAlbaniaArgentinaArmeniaAsiaAustraliaAustriaBahamasBangladeshBarbadosBelarusBelgiumBelizeBoliviaBosnia and HerzegovinaBrazilBulgariaBurma/MyanmarCabo VerdeCambodiaCameroonCanadaCaribbeanCentral AmericaChileChinaColombiaCongoCosta RicaCroatiaCubaCzechoslovakiaDenmarkDominicaDominican RepublicEastern AfricaEastern AsiaEastern EuropeEcuadorEgyptEl SalvadorEnglandEritreaEthiopiaEuropeFijiFranceGermanyGhanaGreeceGrenadaGuatemalaGuyanaHaitiHondurasHong KongHungaryIndiaIndonesiaIranIraqIrelandIsraelItalyJamaicaJapanJordanKazakhstanKenyaKoreaKuwaitLaosLatin AmericaLatviaLebanonLiberiaLithuaniaMalaysiaMexicoMicronesiaMiddle AfricaMoldovaMoroccoNepalNetherlandsNicaraguaNigeriaNorth AmericaNorth MacedoniaNorthern AfricaNorthern EuropeNorwayOceaniaPakistanPanamaPeruPhilippinesPolandPortugalRomaniaRussiaSaudi ArabiaScotlandSenegalSerbiaSierra LeoneSingaporeSomaliaSouth AfricaSouth AmericaSouth Central AsiaSouth Eastern AsiaSouthern EuropeSpainSri LankaSt. Vincent and the GrenadinesSudanSwedenSwitzerlandSyriaTaiwanThailandTrinidad and TobagoTurkeyUgandaUkraineUruguayUzbekistanVenezuelaVietnamWest IndiesWestern AfricaWestern AsiaWestern EuropeYemenZaireZimbabweAzores
Cypriot
Race
Ancestry
AfghanAfricanAlaska NativeAlaskan AthabascanAlbanianAleutAlsatianAmericanApacheArabArapahoArgentineanArmenianAssyrian/Chaldean/SyriacAustralianAustrianBahamianBangladeshiBarbadianBasqueBelgianBelizeanBermudanBhutaneseBlackfeetBolivianBrazilianBritishBritish West IndianBulgarianBurmeseCajunCambodianCanadianCape VerdeanCelticCentral AmericanCentral American IndianCherokeeCheyenneChickasawChileanChineseChippewaChoctawColombianColvilleComancheCosta RicanCreeCreekCroatianCrowCubanCypriotCzechCzechoslovakianDanishDelawareDominicanDutchDutch West IndianEastern EuropeanEcuadorianEgyptianEnglishEstonianEthiopianEuropeanFijianFilipinoFinnishFrenchFrench American IndianFrench CanadianGermanGerman RussianGhanaianGreekGuamanian/ChamorroGuatemalanGuyaneseHaitianHmongHonduranHopiHoumaHungarianIcelanderIndian (Asian)IndonesianInupiatIranianIraqiIrishIroquoisIsraeliItalianJamaicanJapaneseJordanianKenyanKiowaKoreanLaotianLatvianLebaneseLiberianLithuanianLumbeeLuxembourgerMacedonianMalaysianMalteseMarshalleseMenomineeMexicanMexican American IndianMongolianMoroccanNative HawaiianNavajoNepaleseNew ZealanderNicaraguanNigerianNorthern EuropeanNorwegianOkinawanOsageOttawaPaiutePakistaniPalestinianPanamanianParaguayanPennsylvania GermanPeruvianPimaPolishPortuguesePotawatomiPuebloPuerto RicanPuget Sound SalishRomanianRussianSalvadoranSamoanScandinavianScotch-IrishScottishSeminoleSenegaleseSerbianShoshoneSierra LeoneanSiouxSlavicSlovakSloveneSomaliSouth AfricanSouth AmericanSouth American IndianSoviet UnionSpaniardSpanishSpanish AmericanSpanish American IndianSri LankanSubsaharan AfricanSudaneseSwedishSwissSyrianTaiwaneseThaiTlingit-HaidaTohono O'OdhamTonganTrinidadian and TobagonianTsimshianTurkishU.S. Virgin IslanderUgandanUkrainianUruguayanUteVenezuelanVietnameseWelshWest IndianYakamaYaquiYugoslavianYumanYup'ikZimbabwean
Immigration
NonimmigrantsImmigrantsAfghanistanAfricaAlbaniaArgentinaArmeniaAsiaAustraliaAustriaBahamasBangladeshBarbadosBelarusBelgiumBelizeBoliviaBosnia and HerzegovinaBrazilBulgariaBurma/MyanmarCabo VerdeCambodiaCameroonCanadaCaribbeanCentral AmericaChileChinaColombiaCongoCosta RicaCroatiaCubaCzechoslovakiaDenmarkDominicaDominican RepublicEastern AfricaEastern AsiaEastern EuropeEcuadorEgyptEl SalvadorEnglandEritreaEthiopiaEuropeFijiFranceGermanyGhanaGreeceGrenadaGuatemalaGuyanaHaitiHondurasHong KongHungaryIndiaIndonesiaIranIraqIrelandIsraelItalyJamaicaJapanJordanKazakhstanKenyaKoreaKuwaitLaosLatin AmericaLatviaLebanonLiberiaLithuaniaMalaysiaMexicoMicronesiaMiddle AfricaMoldovaMoroccoNepalNetherlandsNicaraguaNigeriaNorth AmericaNorth MacedoniaNorthern AfricaNorthern EuropeNorwayOceaniaPakistanPanamaPeruPhilippinesPolandPortugalRomaniaRussiaSaudi ArabiaScotlandSenegalSerbiaSierra LeoneSingaporeSomaliaSouth AfricaSouth AmericaSouth Central AsiaSouth Eastern AsiaSouthern EuropeSpainSri LankaSt. Vincent and the GrenadinesSudanSwedenSwitzerlandSyriaTaiwanThailandTrinidad and TobagoTurkeyUgandaUkraineUruguayUzbekistanVenezuelaVietnamWest IndiesWestern AfricaWestern AsiaWestern EuropeYemenZaireZimbabweAzores
Single Mother Poverty
Income
Poverty
Unemployment
Labor Participation
Family Structure
Vehicle Availability
Education Level
Disability

Single Mother Poverty Comparison

Carpatho Rusyns

Cypriots

Average
Exceptional
29.1%
SINGLE MOTHER POVERTY
53.8/ 100
METRIC RATING
172nd/ 347
METRIC RANK
28.3%
SINGLE MOTHER POVERTY
92.3/ 100
METRIC RATING
120th/ 347
METRIC RANK

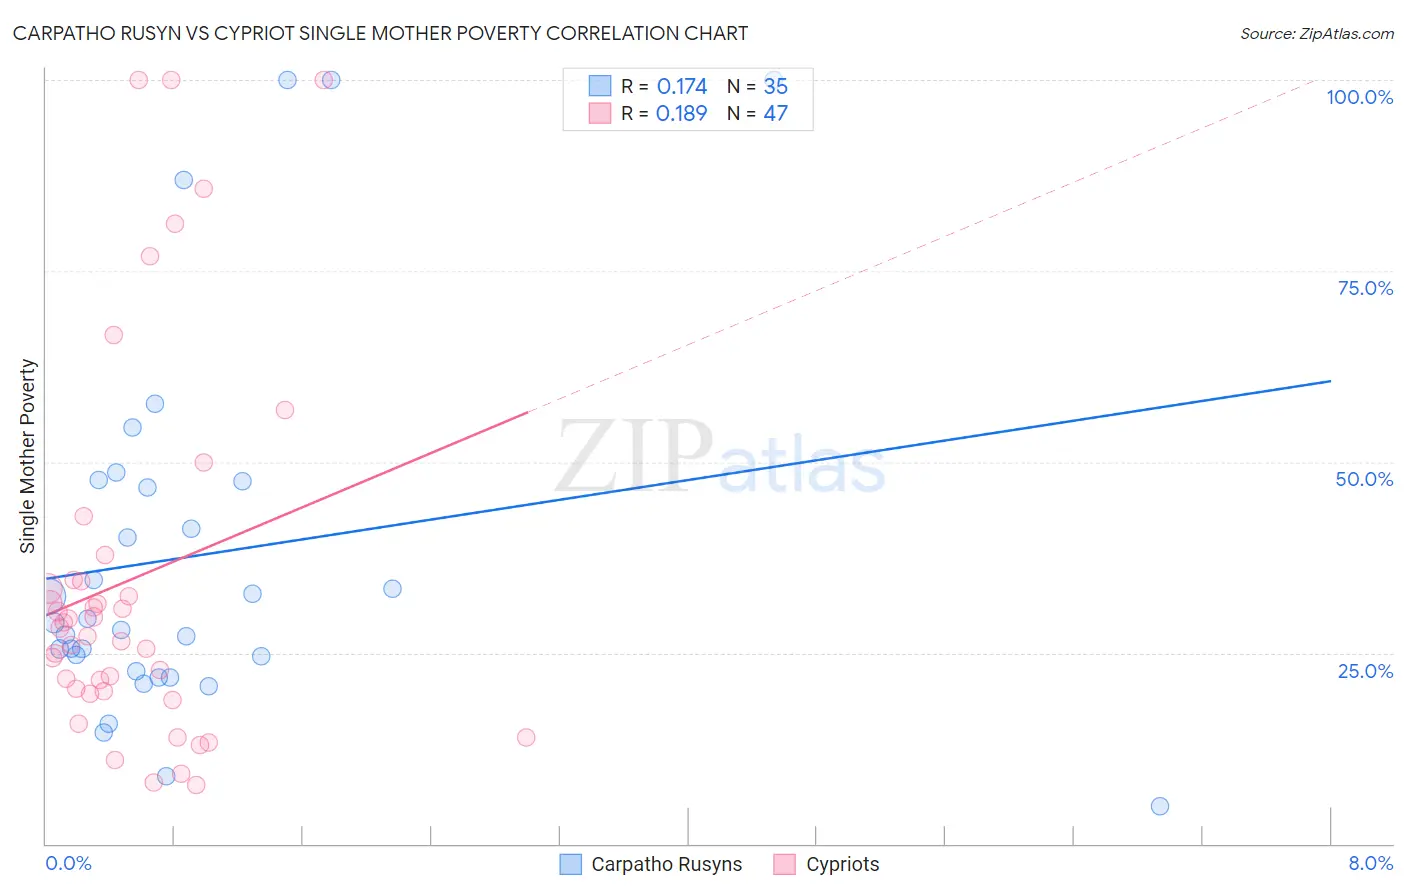
Carpatho Rusyn vs Cypriot Single Mother Poverty Correlation Chart

The statistical analysis conducted on geographies consisting of 58,401,773 people shows a poor positive correlation between the proportion of Carpatho Rusyns and poverty level among single mothers in the United States with a correlation coefficient (R) of 0.174 and weighted average of 29.1%. Similarly, the statistical analysis conducted on geographies consisting of 61,106,831 people shows a poor positive correlation between the proportion of Cypriots and poverty level among single mothers in the United States with a correlation coefficient (R) of 0.189 and weighted average of 28.3%, a difference of 2.9%.
Carpatho Rusyn vs Cypriot Single Mother Poverty

Single Mother Poverty Correlation Summary

MeasurementCarpatho RusynCypriot
Minimum4.9%7.7%
Maximum100.0%100.0%
Range95.1%92.3%
Mean37.8%34.7%
Median28.9%28.2%
Interquartile 25% (IQ1)22.6%20.0%
Interquartile 75% (IQ3)47.5%34.6%
Interquartile Range (IQR)25.0%14.7%
Standard Deviation (Sample)24.7%24.8%
Standard Deviation (Population)24.3%24.5%

Similar Demographics by Single Mother Poverty

Demographics Similar to Carpatho Rusyns by Single Mother Poverty

In terms of single mother poverty, the demographic groups most similar to Carpatho Rusyns are New Zealander (29.1%, a difference of 0.060%), Puget Sound Salish (29.1%, a difference of 0.060%), British (29.2%, a difference of 0.16%), Immigrants from Uruguay (29.1%, a difference of 0.17%), and European (29.1%, a difference of 0.18%).
DemographicsRating | RankSingle Mother Poverty
Arabs
60.7
/100
|
#165
Good
29.0%
Inupiat
60.4
/100
|
#166
Good
29.0%
Costa Ricans
58.4
/100
|
#167
Average
29.0%
Europeans
57.6
/100
|
#168
Average
29.1%
Immigrants | Uruguay
57.2
/100
|
#169
Average
29.1%
New Zealanders
55.1
/100
|
#170
Average
29.1%
Puget Sound Salish
55.1
/100
|
#171
Average
29.1%
Carpatho Rusyns
53.8
/100
|
#172
Average
29.1%
British
50.6
/100
|
#173
Average
29.2%
Immigrants | Saudi Arabia
50.0
/100
|
#174
Average
29.2%
Immigrants | Costa Rica
48.8
/100
|
#175
Average
29.2%
Hawaiians
47.8
/100
|
#176
Average
29.2%
Immigrants | Bosnia and Herzegovina
45.1
/100
|
#177
Average
29.2%
South American Indians
43.2
/100
|
#178
Average
29.3%
Immigrants | Uzbekistan
42.6
/100
|
#179
Average
29.3%

Demographics Similar to Cypriots by Single Mother Poverty

In terms of single mother poverty, the demographic groups most similar to Cypriots are Immigrants from Syria (28.3%, a difference of 0.020%), Brazilian (28.3%, a difference of 0.030%), Australian (28.3%, a difference of 0.040%), Immigrants from Afghanistan (28.3%, a difference of 0.040%), and Immigrants from Uganda (28.3%, a difference of 0.050%).
DemographicsRating | RankSingle Mother Poverty
Immigrants | South Africa
93.2
/100
|
#113
Exceptional
28.3%
Immigrants | Western Asia
92.7
/100
|
#114
Exceptional
28.3%
Immigrants | Kuwait
92.7
/100
|
#115
Exceptional
28.3%
Immigrants | Uganda
92.5
/100
|
#116
Exceptional
28.3%
Australians
92.5
/100
|
#117
Exceptional
28.3%
Brazilians
92.4
/100
|
#118
Exceptional
28.3%
Immigrants | Syria
92.4
/100
|
#119
Exceptional
28.3%
Cypriots
92.3
/100
|
#120
Exceptional
28.3%
Immigrants | Afghanistan
92.1
/100
|
#121
Exceptional
28.3%
Colombians
91.8
/100
|
#122
Exceptional
28.3%
Uruguayans
91.7
/100
|
#123
Exceptional
28.3%
Immigrants | Switzerland
91.7
/100
|
#124
Exceptional
28.3%
Kenyans
90.9
/100
|
#125
Exceptional
28.4%
Immigrants | Chile
90.8
/100
|
#126
Exceptional
28.4%
Poles
90.8
/100
|
#127
Exceptional
28.4%