Alsatian vs Guamanian/Chamorro Disability Age 65 to 74
COMPARE
Alsatian
Guamanian/Chamorro
Disability Age 65 to 74
Disability Age 65 to 74 Comparison
Alsatians
Guamanians/Chamorros
22.8%
DISABILITY AGE 65 TO 74
83.7/ 100
METRIC RATING
146th/ 347
METRIC RANK
25.3%
DISABILITY AGE 65 TO 74
0.3/ 100
METRIC RATING
257th/ 347
METRIC RANK
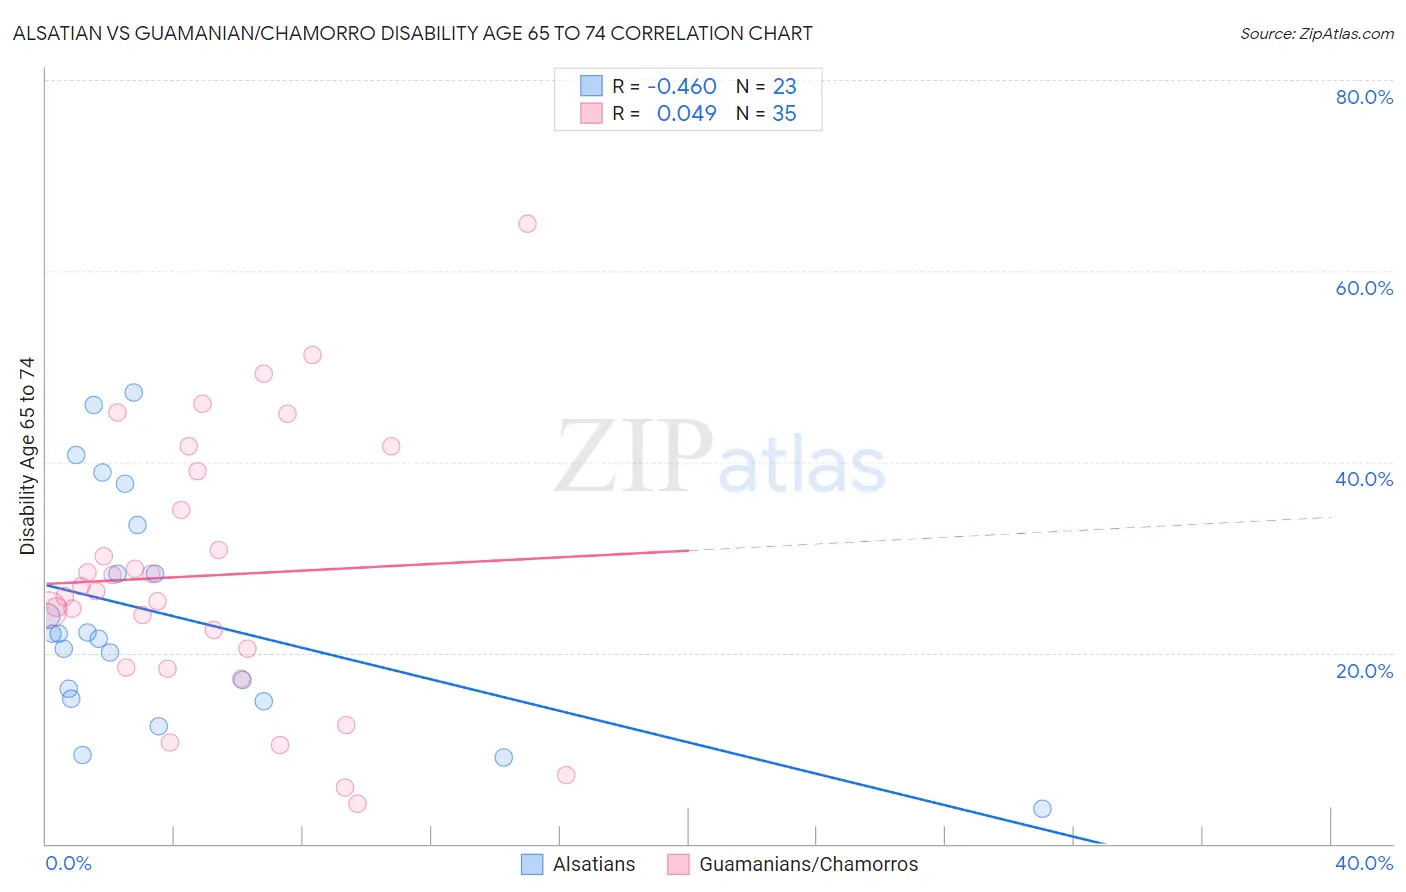
Alsatian vs Guamanian/Chamorro Disability Age 65 to 74 Correlation Chart
The statistical analysis conducted on geographies consisting of 82,675,825 people shows a moderate negative correlation between the proportion of Alsatians and percentage of population with a disability between the ages 65 and 75 in the United States with a correlation coefficient (R) of -0.460 and weighted average of 22.8%. Similarly, the statistical analysis conducted on geographies consisting of 221,467,649 people shows no correlation between the proportion of Guamanians/Chamorros and percentage of population with a disability between the ages 65 and 75 in the United States with a correlation coefficient (R) of 0.049 and weighted average of 25.3%, a difference of 11.0%.
Disability Age 65 to 74 Correlation Summary
| Measurement | Alsatian | Guamanian/Chamorro |
| Minimum | 3.7% | 4.2% |
| Maximum | 47.3% | 65.0% |
| Range | 43.7% | 60.8% |
| Mean | 23.9% | 28.1% |
| Median | 22.0% | 26.4% |
| Interquartile 25% (IQ1) | 15.2% | 18.5% |
| Interquartile 75% (IQ3) | 33.3% | 39.0% |
| Interquartile Range (IQR) | 18.2% | 20.5% |
| Standard Deviation (Sample) | 12.0% | 14.0% |
| Standard Deviation (Population) | 11.7% | 13.8% |
Similar Demographics by Disability Age 65 to 74
Demographics Similar to Alsatians by Disability Age 65 to 74
In terms of disability age 65 to 74, the demographic groups most similar to Alsatians are Immigrants from Uganda (22.8%, a difference of 0.030%), Danish (22.8%, a difference of 0.070%), Immigrants from Uzbekistan (22.8%, a difference of 0.070%), Arab (22.8%, a difference of 0.12%), and Immigrants from Ethiopia (22.7%, a difference of 0.18%).
| Demographics | Rating | Rank | Disability Age 65 to 74 |
| Immigrants | Syria | 85.8 /100 | #139 | Excellent 22.7% |
| Ugandans | 85.4 /100 | #140 | Excellent 22.7% |
| Belgians | 85.3 /100 | #141 | Excellent 22.7% |
| Immigrants | Ethiopia | 85.3 /100 | #142 | Excellent 22.7% |
| Arabs | 84.8 /100 | #143 | Excellent 22.8% |
| Danes | 84.4 /100 | #144 | Excellent 22.8% |
| Immigrants | Uganda | 84.0 /100 | #145 | Excellent 22.8% |
| Alsatians | 83.7 /100 | #146 | Excellent 22.8% |
| Immigrants | Uzbekistan | 83.1 /100 | #147 | Excellent 22.8% |
| New Zealanders | 79.9 /100 | #148 | Good 22.9% |
| Swiss | 79.7 /100 | #149 | Good 22.9% |
| Canadians | 77.7 /100 | #150 | Good 22.9% |
| Immigrants | Morocco | 77.6 /100 | #151 | Good 22.9% |
| Finns | 76.5 /100 | #152 | Good 22.9% |
| Slavs | 75.2 /100 | #153 | Good 23.0% |
Demographics Similar to Guamanians/Chamorros by Disability Age 65 to 74
In terms of disability age 65 to 74, the demographic groups most similar to Guamanians/Chamorros are Marshallese (25.3%, a difference of 0.060%), Immigrants from Cambodia (25.3%, a difference of 0.15%), Immigrants from Somalia (25.2%, a difference of 0.17%), Malaysian (25.4%, a difference of 0.47%), and Cape Verdean (25.4%, a difference of 0.55%).
| Demographics | Rating | Rank | Disability Age 65 to 74 |
| Salvadorans | 0.8 /100 | #250 | Tragic 25.0% |
| Immigrants | Nonimmigrants | 0.7 /100 | #251 | Tragic 25.0% |
| Immigrants | El Salvador | 0.6 /100 | #252 | Tragic 25.1% |
| Sub-Saharan Africans | 0.6 /100 | #253 | Tragic 25.1% |
| Somalis | 0.6 /100 | #254 | Tragic 25.1% |
| Central Americans | 0.5 /100 | #255 | Tragic 25.1% |
| Immigrants | Somalia | 0.4 /100 | #256 | Tragic 25.2% |
| Guamanians/Chamorros | 0.3 /100 | #257 | Tragic 25.3% |
| Marshallese | 0.3 /100 | #258 | Tragic 25.3% |
| Immigrants | Cambodia | 0.3 /100 | #259 | Tragic 25.3% |
| Malaysians | 0.2 /100 | #260 | Tragic 25.4% |
| Cape Verdeans | 0.2 /100 | #261 | Tragic 25.4% |
| Samoans | 0.2 /100 | #262 | Tragic 25.4% |
| Iroquois | 0.2 /100 | #263 | Tragic 25.4% |
| Hawaiians | 0.2 /100 | #264 | Tragic 25.5% |