African vs Bermudan Family Poverty
COMPARE
African
Bermudan
Family Poverty
Family Poverty Comparison
Africans
Bermudans
11.8%
FAMILY POVERTY
0.0/ 100
METRIC RATING
303rd/ 347
METRIC RANK
9.9%
FAMILY POVERTY
5.3/ 100
METRIC RATING
220th/ 347
METRIC RANK
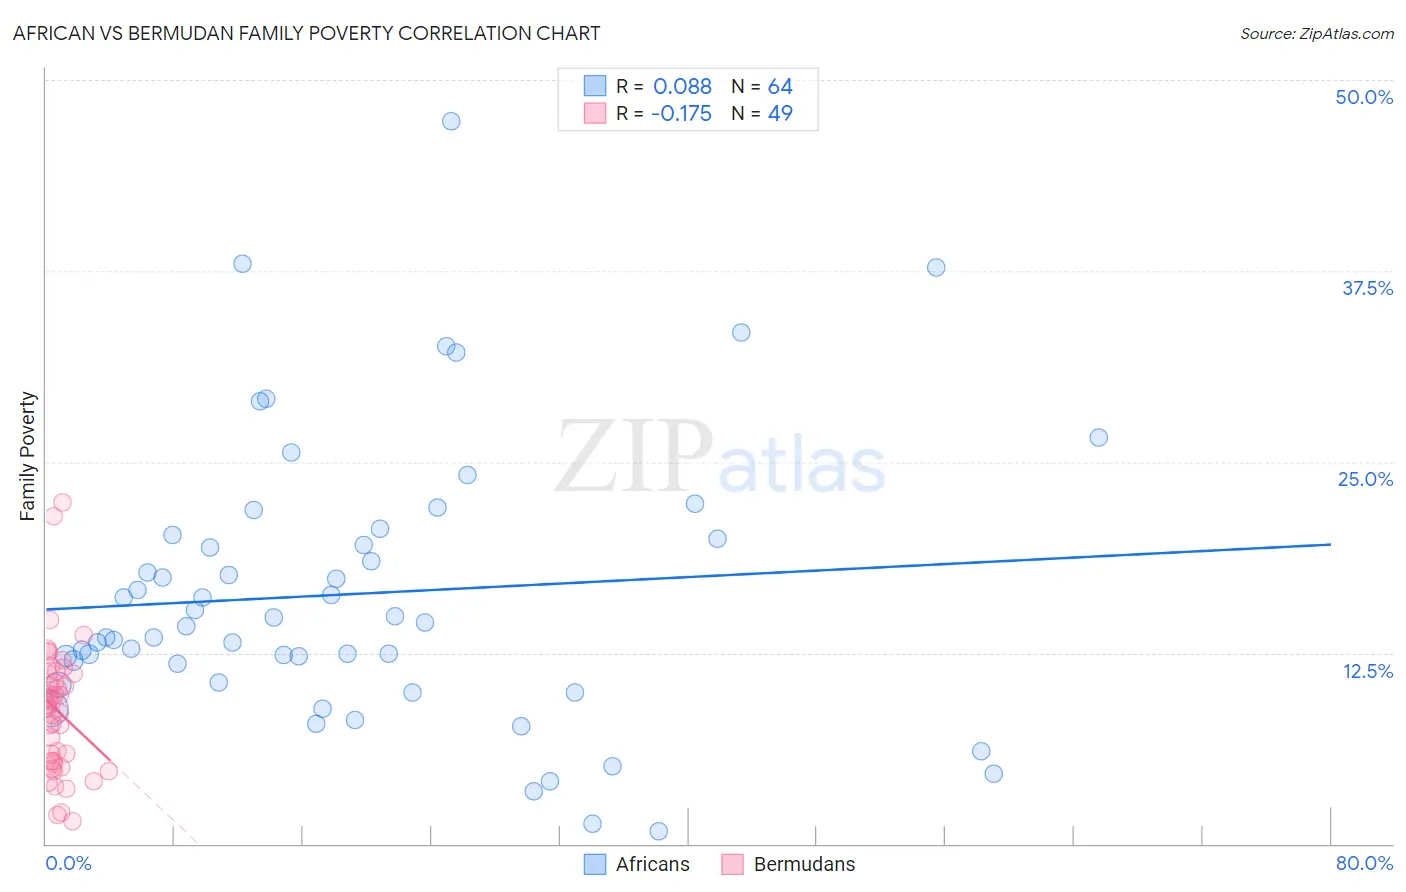
African vs Bermudan Family Poverty Correlation Chart
The statistical analysis conducted on geographies consisting of 468,652,941 people shows a slight positive correlation between the proportion of Africans and poverty level among families in the United States with a correlation coefficient (R) of 0.088 and weighted average of 11.8%. Similarly, the statistical analysis conducted on geographies consisting of 55,709,742 people shows a poor negative correlation between the proportion of Bermudans and poverty level among families in the United States with a correlation coefficient (R) of -0.175 and weighted average of 9.9%, a difference of 19.4%.
Family Poverty Correlation Summary
| Measurement | African | Bermudan |
| Minimum | 0.78% | 1.5% |
| Maximum | 47.3% | 22.4% |
| Range | 46.5% | 20.8% |
| Mean | 16.4% | 8.7% |
| Median | 14.4% | 9.0% |
| Interquartile 25% (IQ1) | 11.2% | 5.3% |
| Interquartile 75% (IQ3) | 20.1% | 11.1% |
| Interquartile Range (IQR) | 9.0% | 5.8% |
| Standard Deviation (Sample) | 9.2% | 4.3% |
| Standard Deviation (Population) | 9.1% | 4.2% |
Similar Demographics by Family Poverty
Demographics Similar to Africans by Family Poverty
In terms of family poverty, the demographic groups most similar to Africans are Immigrants from Latin America (11.8%, a difference of 0.19%), Mexican (11.8%, a difference of 0.37%), Guatemalan (11.7%, a difference of 0.50%), Bahamian (11.7%, a difference of 0.54%), and Immigrants from Bangladesh (11.7%, a difference of 0.80%).
| Demographics | Rating | Rank | Family Poverty |
| Choctaw | 0.0 /100 | #296 | Tragic 11.6% |
| Creek | 0.0 /100 | #297 | Tragic 11.7% |
| Immigrants | Senegal | 0.0 /100 | #298 | Tragic 11.7% |
| Dutch West Indians | 0.0 /100 | #299 | Tragic 11.7% |
| Immigrants | Bangladesh | 0.0 /100 | #300 | Tragic 11.7% |
| Bahamians | 0.0 /100 | #301 | Tragic 11.7% |
| Guatemalans | 0.0 /100 | #302 | Tragic 11.7% |
| Africans | 0.0 /100 | #303 | Tragic 11.8% |
| Immigrants | Latin America | 0.0 /100 | #304 | Tragic 11.8% |
| Mexicans | 0.0 /100 | #305 | Tragic 11.8% |
| Cajuns | 0.0 /100 | #306 | Tragic 11.9% |
| Immigrants | Congo | 0.0 /100 | #307 | Tragic 11.9% |
| Seminole | 0.0 /100 | #308 | Tragic 11.9% |
| Hispanics or Latinos | 0.0 /100 | #309 | Tragic 12.0% |
| Immigrants | Guatemala | 0.0 /100 | #310 | Tragic 12.0% |
Demographics Similar to Bermudans by Family Poverty
In terms of family poverty, the demographic groups most similar to Bermudans are Immigrants from Eritrea (9.9%, a difference of 0.060%), Panamanian (9.8%, a difference of 0.18%), Immigrants from Cambodia (9.9%, a difference of 0.27%), Japanese (9.9%, a difference of 0.31%), and American (9.8%, a difference of 0.50%).
| Demographics | Rating | Rank | Family Poverty |
| Osage | 8.0 /100 | #213 | Tragic 9.7% |
| Immigrants | Micronesia | 6.7 /100 | #214 | Tragic 9.8% |
| Immigrants | Nonimmigrants | 6.7 /100 | #215 | Tragic 9.8% |
| Moroccans | 6.5 /100 | #216 | Tragic 9.8% |
| Americans | 6.2 /100 | #217 | Tragic 9.8% |
| Panamanians | 5.6 /100 | #218 | Tragic 9.8% |
| Immigrants | Eritrea | 5.4 /100 | #219 | Tragic 9.9% |
| Bermudans | 5.3 /100 | #220 | Tragic 9.9% |
| Immigrants | Cambodia | 4.8 /100 | #221 | Tragic 9.9% |
| Japanese | 4.8 /100 | #222 | Tragic 9.9% |
| Immigrants | Africa | 4.3 /100 | #223 | Tragic 9.9% |
| Marshallese | 3.9 /100 | #224 | Tragic 9.9% |
| Immigrants | Immigrants | 3.6 /100 | #225 | Tragic 10.0% |
| Ottawa | 3.3 /100 | #226 | Tragic 10.0% |
| Immigrants | Armenia | 3.3 /100 | #227 | Tragic 10.0% |