Washington, PA Map & Demographics
Washington Map
Washington Overview
$27,628
PER CAPITA INCOME
$65,500
AVG FAMILY INCOME
$50,548
AVG HOUSEHOLD INCOME
19.8%
WAGE / INCOME GAP [ % ]
80.2¢/ $1
WAGE / INCOME GAP [ $ ]
0.40
INEQUALITY / GINI INDEX
13,358
TOTAL POPULATION
6,763
MALE POPULATION
6,595
FEMALE POPULATION
102.55
MALES / 100 FEMALES
97.52
FEMALES / 100 MALES
37.7
MEDIAN AGE
2.9
AVG FAMILY SIZE
2.0
AVG HOUSEHOLD SIZE
7,219
LABOR FORCE [ PEOPLE ]
63.2%
PERCENT IN LABOR FORCE
8.5%
UNEMPLOYMENT RATE
Washington Zip Codes
Income in Washington
Income Overview in Washington
Per Capita Income in Washington is $27,628, while median incomes of families and households are $65,500 and $50,548 respectively.
| Characteristic | Number | Measure |
| Per Capita Income | 13,358 | $27,628 |
| Median Family Income | 2,552 | $65,500 |
| Mean Family Income | 2,552 | $75,757 |
| Median Household Income | 5,896 | $50,548 |
| Mean Household Income | 5,896 | $59,722 |
| Income Deficit | 2,552 | $0 |
| Wage / Income Gap (%) | 13,358 | 19.78% |
| Wage / Income Gap ($) | 13,358 | 80.22¢ per $1 |
| Gini / Inequality Index | 13,358 | 0.40 |
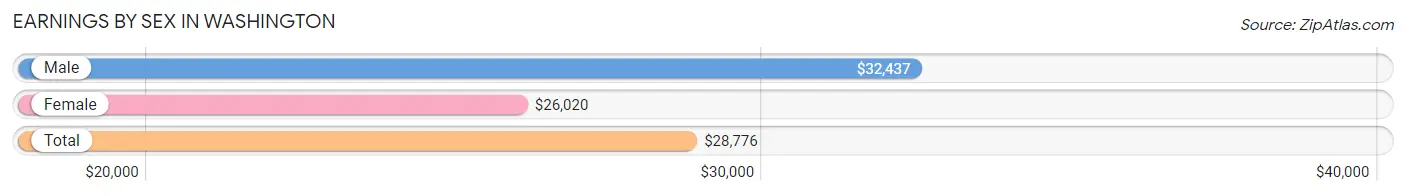
Earnings by Sex in Washington
Average Earnings in Washington are $28,776, $32,437 for men and $26,020 for women, a difference of 19.8%.
| Sex | Number | Average Earnings |
| Male | 4,303 (52.5%) | $32,437 |
| Female | 3,888 (47.5%) | $26,020 |
| Total | 8,191 (100.0%) | $28,776 |
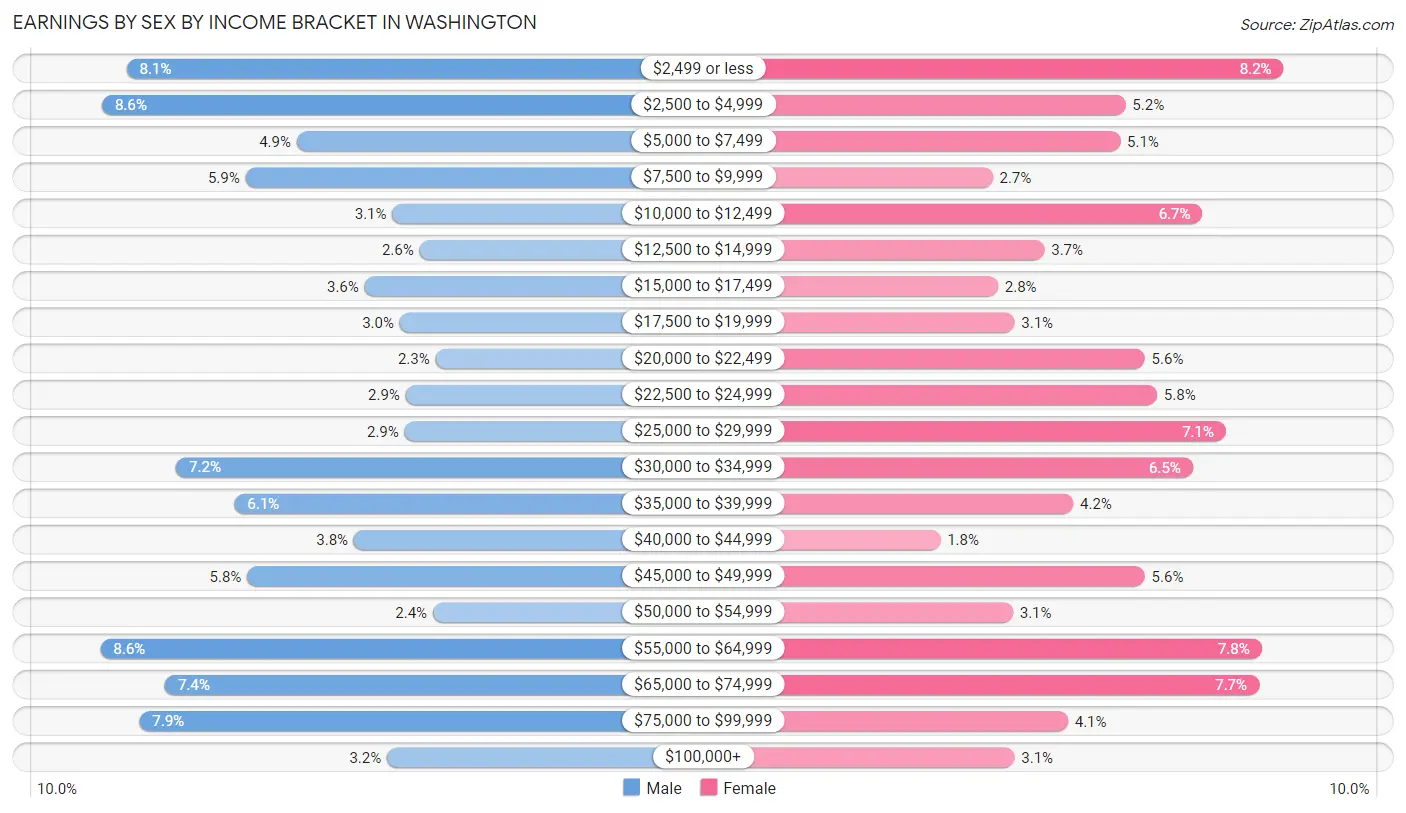
Earnings by Sex by Income Bracket in Washington
The most common earnings brackets in Washington are $55,000 to $64,999 for men (369 | 8.6%) and $2,499 or less for women (318 | 8.2%).
| Income | Male | Female |
| $2,499 or less | 348 (8.1%) | 318 (8.2%) |
| $2,500 to $4,999 | 368 (8.6%) | 203 (5.2%) |
| $5,000 to $7,499 | 211 (4.9%) | 199 (5.1%) |
| $7,500 to $9,999 | 252 (5.9%) | 106 (2.7%) |
| $10,000 to $12,499 | 134 (3.1%) | 259 (6.7%) |
| $12,500 to $14,999 | 112 (2.6%) | 144 (3.7%) |
| $15,000 to $17,499 | 156 (3.6%) | 110 (2.8%) |
| $17,500 to $19,999 | 128 (3.0%) | 122 (3.1%) |
| $20,000 to $22,499 | 99 (2.3%) | 217 (5.6%) |
| $22,500 to $24,999 | 123 (2.9%) | 226 (5.8%) |
| $25,000 to $29,999 | 124 (2.9%) | 276 (7.1%) |
| $30,000 to $34,999 | 308 (7.2%) | 252 (6.5%) |
| $35,000 to $39,999 | 261 (6.1%) | 165 (4.2%) |
| $40,000 to $44,999 | 165 (3.8%) | 68 (1.8%) |
| $45,000 to $49,999 | 251 (5.8%) | 217 (5.6%) |
| $50,000 to $54,999 | 101 (2.4%) | 121 (3.1%) |
| $55,000 to $64,999 | 369 (8.6%) | 302 (7.8%) |
| $65,000 to $74,999 | 317 (7.4%) | 300 (7.7%) |
| $75,000 to $99,999 | 338 (7.9%) | 161 (4.1%) |
| $100,000+ | 138 (3.2%) | 122 (3.1%) |
| Total | 4,303 (100.0%) | 3,888 (100.0%) |
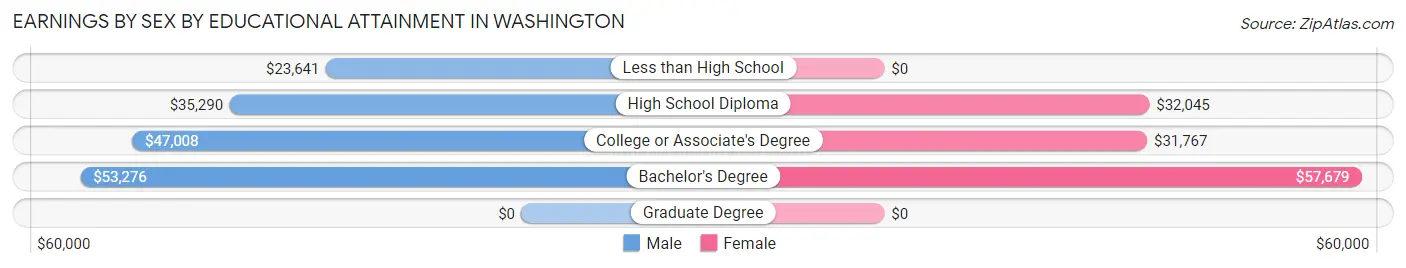
Earnings by Sex by Educational Attainment in Washington
Average earnings in Washington are $40,010 for men and $33,381 for women, a difference of 16.6%. Men with an educational attainment of bachelor's degree enjoy the highest average annual earnings of $53,276, while those with less than high school education earn the least with $23,641. Women with an educational attainment of bachelor's degree earn the most with the average annual earnings of $57,679, while those with college or associate's degree education have the smallest earnings of $31,767.
| Educational Attainment | Male Income | Female Income |
| Less than High School | $23,641 | $0 |
| High School Diploma | $35,290 | $32,045 |
| College or Associate's Degree | $47,008 | $31,767 |
| Bachelor's Degree | $53,276 | $57,679 |
| Graduate Degree | - | - |
| Total | $40,010 | $33,381 |
Family Income in Washington
Family Income Brackets in Washington
According to the Washington family income data, there are 472 families falling into the $100,000 to $149,999 income range, which is the most common income bracket and makes up 18.5% of all families. Conversely, the $10,000 to $14,999 income bracket is the least frequent group with only 33 families (1.3%) belonging to this category.
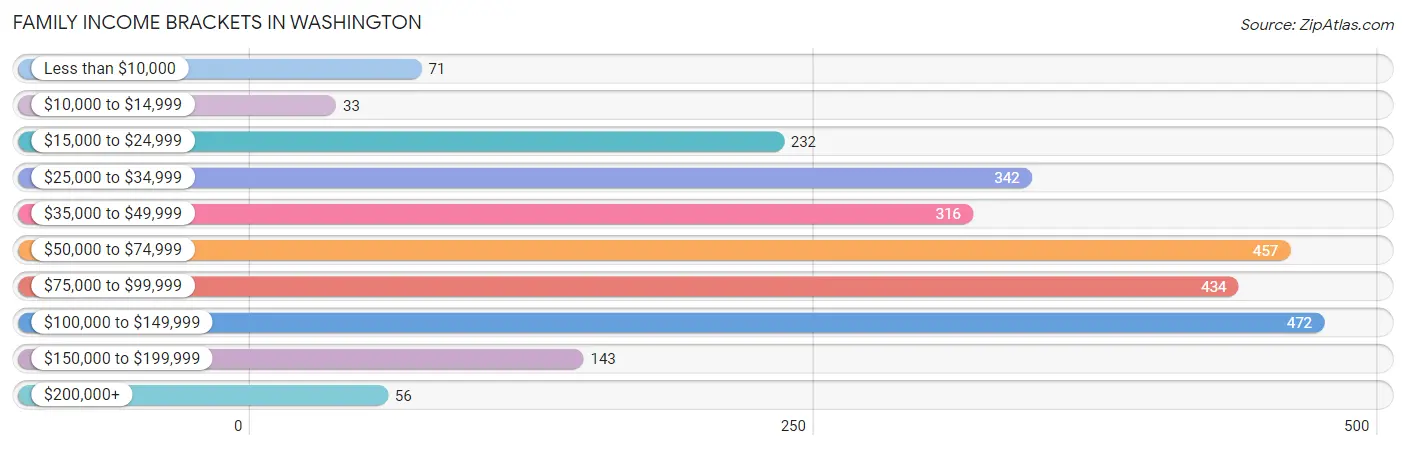
| Income Bracket | # Families | % Families |
| Less than $10,000 | 71 | 2.8% |
| $10,000 to $14,999 | 33 | 1.3% |
| $15,000 to $24,999 | 232 | 9.1% |
| $25,000 to $34,999 | 342 | 13.4% |
| $35,000 to $49,999 | 316 | 12.4% |
| $50,000 to $74,999 | 457 | 17.9% |
| $75,000 to $99,999 | 434 | 17.0% |
| $100,000 to $149,999 | 472 | 18.5% |
| $150,000 to $199,999 | 143 | 5.6% |
| $200,000+ | 56 | 2.2% |
Family Income by Famaliy Size in Washington
5-person families (123 | 4.8%) account for the highest median family income in Washington with $89,766 per family, while 2-person families (1,487 | 58.3%) have the highest median income of $30,408 per family member.
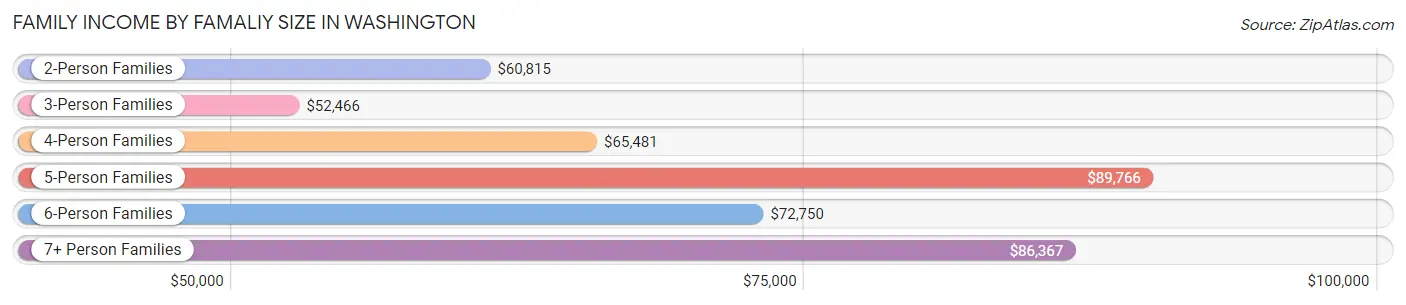
| Income Bracket | # Families | Median Income |
| 2-Person Families | 1,487 (58.3%) | $60,815 |
| 3-Person Families | 423 (16.6%) | $52,466 |
| 4-Person Families | 445 (17.4%) | $65,481 |
| 5-Person Families | 123 (4.8%) | $89,766 |
| 6-Person Families | 27 (1.1%) | $72,750 |
| 7+ Person Families | 47 (1.8%) | $86,367 |
| Total | 2,552 (100.0%) | $65,500 |
Family Income by Number of Earners in Washington
The median family income in Washington is $65,500, with families comprising 3+ earners (262) having the highest median family income of $114,833, while families with 1 earner (1,156) have the lowest median family income of $37,400, accounting for 10.3% and 45.3% of families, respectively.
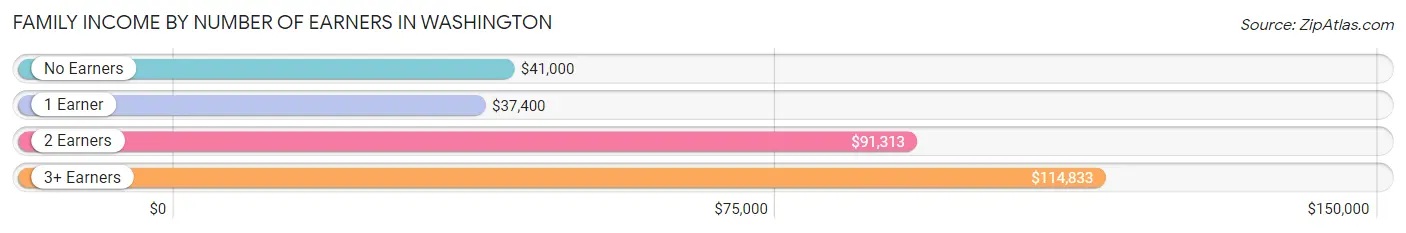
| Number of Earners | # Families | Median Income |
| No Earners | 216 (8.5%) | $41,000 |
| 1 Earner | 1,156 (45.3%) | $37,400 |
| 2 Earners | 918 (36.0%) | $91,313 |
| 3+ Earners | 262 (10.3%) | $114,833 |
| Total | 2,552 (100.0%) | $65,500 |
Household Income in Washington
Household Income Brackets in Washington
With 1,256 households falling in the category, the $50,000 to $74,999 income range is the most frequent in Washington, accounting for 21.3% of all households. In contrast, only 53 households (0.9%) fall into the $200,000+ income bracket, making it the least populous group.
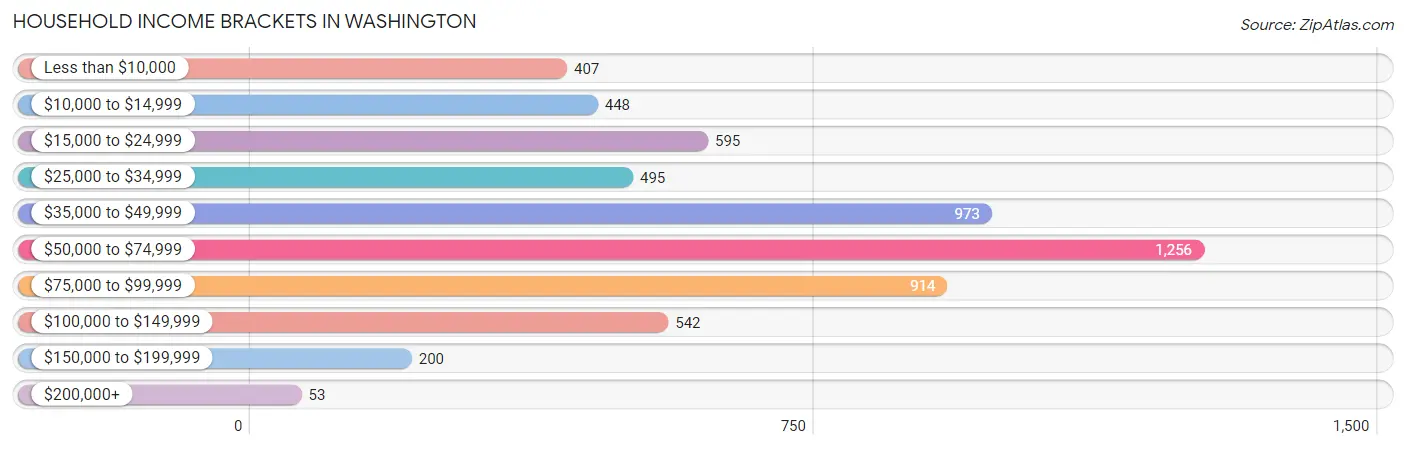
| Income Bracket | # Households | % Households |
| Less than $10,000 | 407 | 6.9% |
| $10,000 to $14,999 | 448 | 7.6% |
| $15,000 to $24,999 | 595 | 10.1% |
| $25,000 to $34,999 | 495 | 8.4% |
| $35,000 to $49,999 | 973 | 16.5% |
| $50,000 to $74,999 | 1,256 | 21.3% |
| $75,000 to $99,999 | 914 | 15.5% |
| $100,000 to $149,999 | 542 | 9.2% |
| $150,000 to $199,999 | 200 | 3.4% |
| $200,000+ | 53 | 0.9% |
Household Income by Householder Age in Washington
The median household income in Washington is $50,548, with the highest median household income of $60,893 found in the 25 to 44 years age bracket for the primary householder. A total of 1,661 households (28.2%) fall into this category. Meanwhile, the 65+ years age bracket for the primary householder has the lowest median household income of $43,014, with 1,446 households (24.5%) in this group.
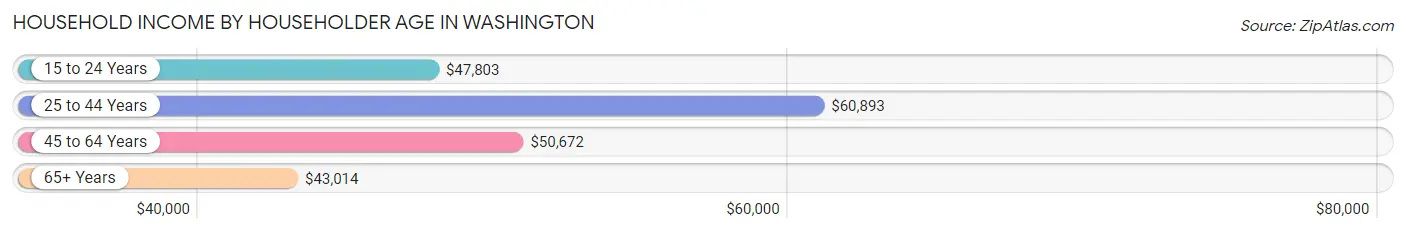
| Income Bracket | # Households | Median Income |
| 15 to 24 Years | 316 (5.4%) | $47,803 |
| 25 to 44 Years | 1,661 (28.2%) | $60,893 |
| 45 to 64 Years | 2,473 (41.9%) | $50,672 |
| 65+ Years | 1,446 (24.5%) | $43,014 |
| Total | 5,896 (100.0%) | $50,548 |
Poverty in Washington
Income Below Poverty by Sex and Age in Washington
With 18.3% poverty level for males and 20.5% for females among the residents of Washington, 12 to 14 year old males and 5 year old females are the most vulnerable to poverty, with 60 males (47.6%) and 35 females (52.2%) in their respective age groups living below the poverty level.
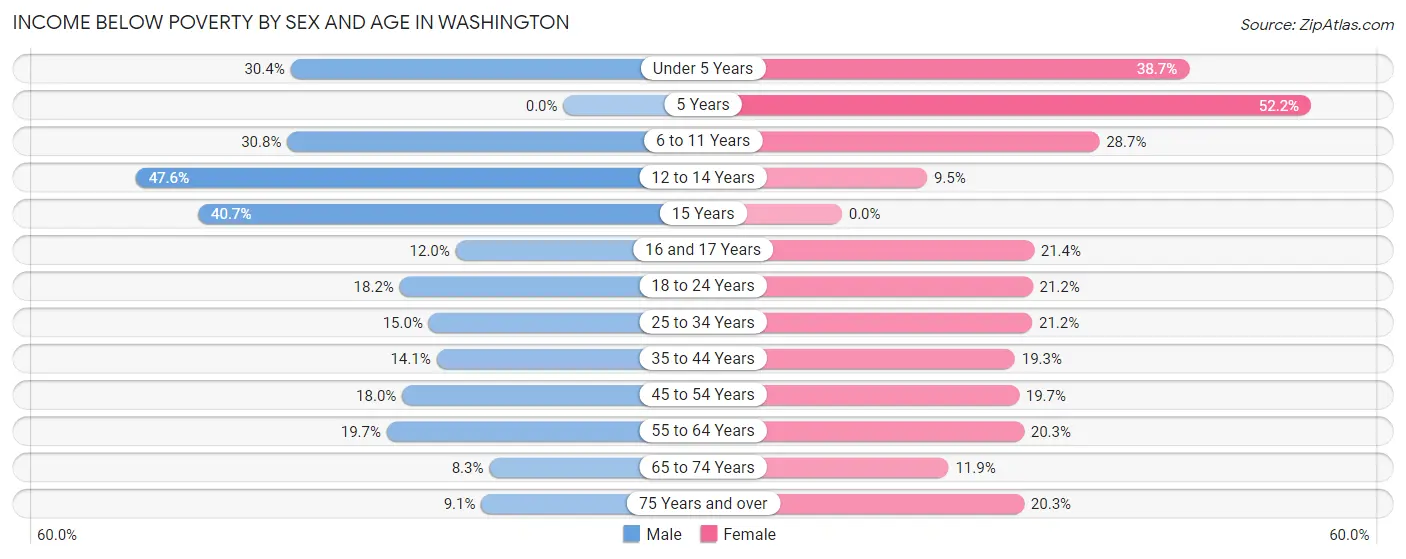
| Age Bracket | Male | Female |
| Under 5 Years | 117 (30.4%) | 128 (38.7%) |
| 5 Years | 0 (0.0%) | 35 (52.2%) |
| 6 to 11 Years | 103 (30.7%) | 84 (28.7%) |
| 12 to 14 Years | 60 (47.6%) | 13 (9.5%) |
| 15 Years | 24 (40.7%) | 0 (0.0%) |
| 16 and 17 Years | 15 (12.0%) | 31 (21.4%) |
| 18 to 24 Years | 128 (18.2%) | 89 (21.2%) |
| 25 to 34 Years | 143 (15.0%) | 146 (21.2%) |
| 35 to 44 Years | 88 (14.1%) | 127 (19.3%) |
| 45 to 54 Years | 156 (17.9%) | 206 (19.7%) |
| 55 to 64 Years | 161 (19.7%) | 193 (20.3%) |
| 65 to 74 Years | 51 (8.3%) | 79 (11.9%) |
| 75 Years and over | 17 (9.1%) | 103 (20.3%) |
| Total | 1,063 (18.3%) | 1,234 (20.5%) |
Income Above Poverty by Sex and Age in Washington
According to the poverty statistics in Washington, males aged 5 years and females aged 15 years are the age groups that are most secure financially, with 100.0% of males and 100.0% of females in these age groups living above the poverty line.
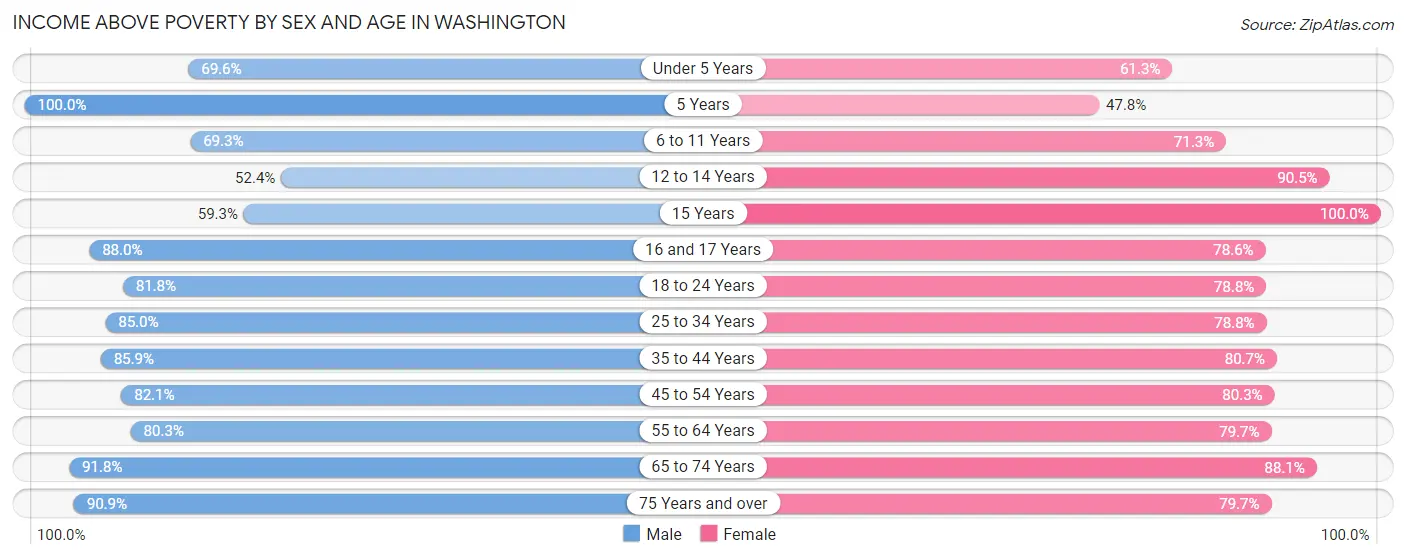
| Age Bracket | Male | Female |
| Under 5 Years | 268 (69.6%) | 203 (61.3%) |
| 5 Years | 19 (100.0%) | 32 (47.8%) |
| 6 to 11 Years | 232 (69.3%) | 209 (71.3%) |
| 12 to 14 Years | 66 (52.4%) | 124 (90.5%) |
| 15 Years | 35 (59.3%) | 107 (100.0%) |
| 16 and 17 Years | 110 (88.0%) | 114 (78.6%) |
| 18 to 24 Years | 574 (81.8%) | 330 (78.8%) |
| 25 to 34 Years | 811 (85.0%) | 543 (78.8%) |
| 35 to 44 Years | 535 (85.9%) | 532 (80.7%) |
| 45 to 54 Years | 713 (82.1%) | 839 (80.3%) |
| 55 to 64 Years | 658 (80.3%) | 759 (79.7%) |
| 65 to 74 Years | 567 (91.7%) | 586 (88.1%) |
| 75 Years and over | 169 (90.9%) | 405 (79.7%) |
| Total | 4,757 (81.7%) | 4,783 (79.5%) |
Income Below Poverty Among Married-Couple Families in Washington
The poverty statistics for married-couple families in Washington show that 7.3% or 98 of the total 1,340 families live below the poverty line. Families with 3 or 4 children have the highest poverty rate of 9.7%, comprising of 7 families. On the other hand, families with 5 or more children have the lowest poverty rate of 0.0%, which includes 0 families.
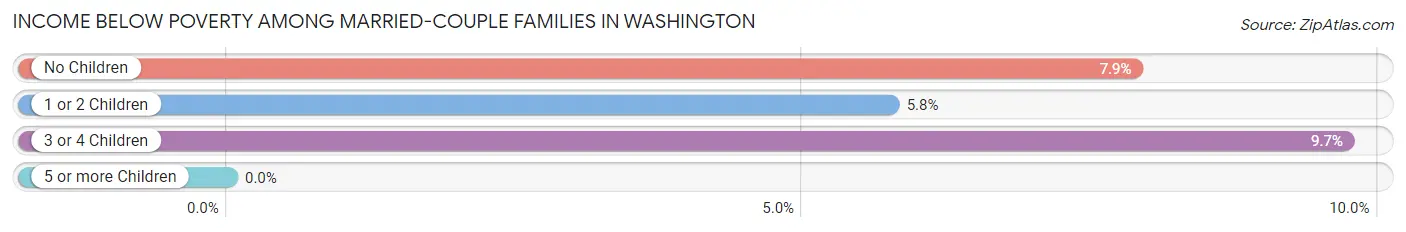
| Children | Above Poverty | Below Poverty |
| No Children | 795 (92.1%) | 68 (7.9%) |
| 1 or 2 Children | 376 (94.2%) | 23 (5.8%) |
| 3 or 4 Children | 65 (90.3%) | 7 (9.7%) |
| 5 or more Children | 6 (100.0%) | 0 (0.0%) |
| Total | 1,242 (92.7%) | 98 (7.3%) |
Income Below Poverty Among Single-Parent Households in Washington
According to the poverty data in Washington, 16.9% or 45 single-father households and 19.8% or 187 single-mother households are living below the poverty line. Among single-father households, those with 1 or 2 children have the highest poverty rate, with 37 households (77.1%) experiencing poverty. Likewise, among single-mother households, those with 3 or 4 children have the highest poverty rate, with 87 households (51.5%) falling below the poverty line.
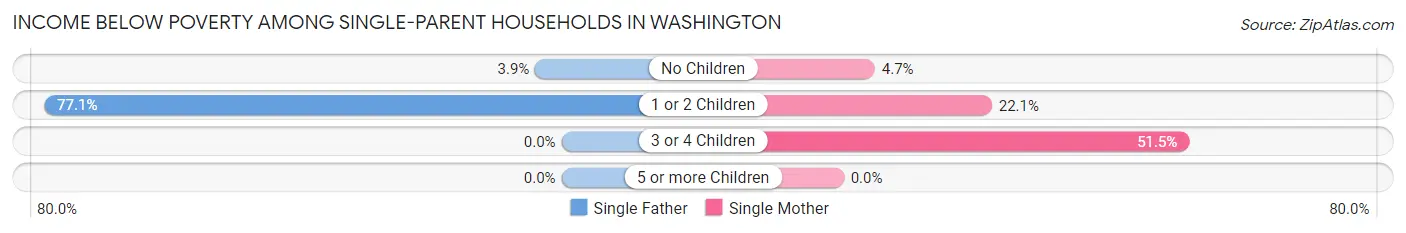
| Children | Single Father | Single Mother |
| No Children | 8 (3.9%) | 19 (4.6%) |
| 1 or 2 Children | 37 (77.1%) | 81 (22.1%) |
| 3 or 4 Children | 0 (0.0%) | 87 (51.5%) |
| 5 or more Children | 0 (0.0%) | 0 (0.0%) |
| Total | 45 (16.9%) | 187 (19.8%) |
Income Below Poverty Among Married-Couple vs Single-Parent Households in Washington
The poverty data for Washington shows that 98 of the married-couple family households (7.3%) and 232 of the single-parent households (19.1%) are living below the poverty level. Within the married-couple family households, those with 3 or 4 children have the highest poverty rate, with 7 households (9.7%) falling below the poverty line. Among the single-parent households, those with 3 or 4 children have the highest poverty rate, with 87 household (47.3%) living below poverty.
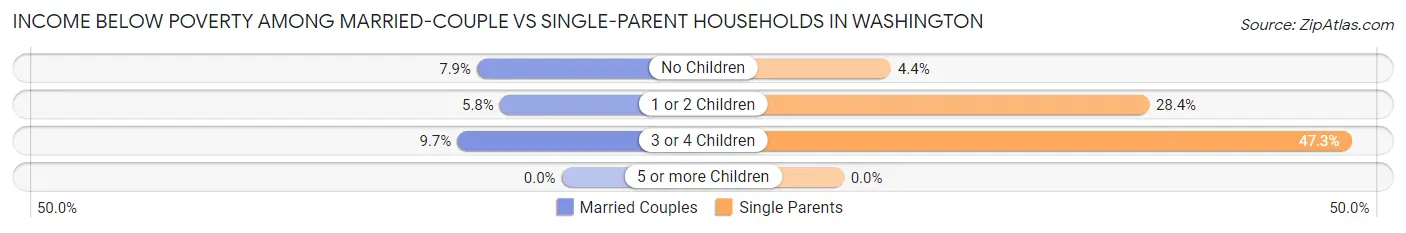
| Children | Married-Couple Families | Single-Parent Households |
| No Children | 68 (7.9%) | 27 (4.4%) |
| 1 or 2 Children | 23 (5.8%) | 118 (28.4%) |
| 3 or 4 Children | 7 (9.7%) | 87 (47.3%) |
| 5 or more Children | 0 (0.0%) | 0 (0.0%) |
| Total | 98 (7.3%) | 232 (19.1%) |
Race in Washington
The most populous races in Washington are White / Caucasian (9,987 | 74.8%), Black / African American (1,827 | 13.7%), and Two or more Races (1,069 | 8.0%).
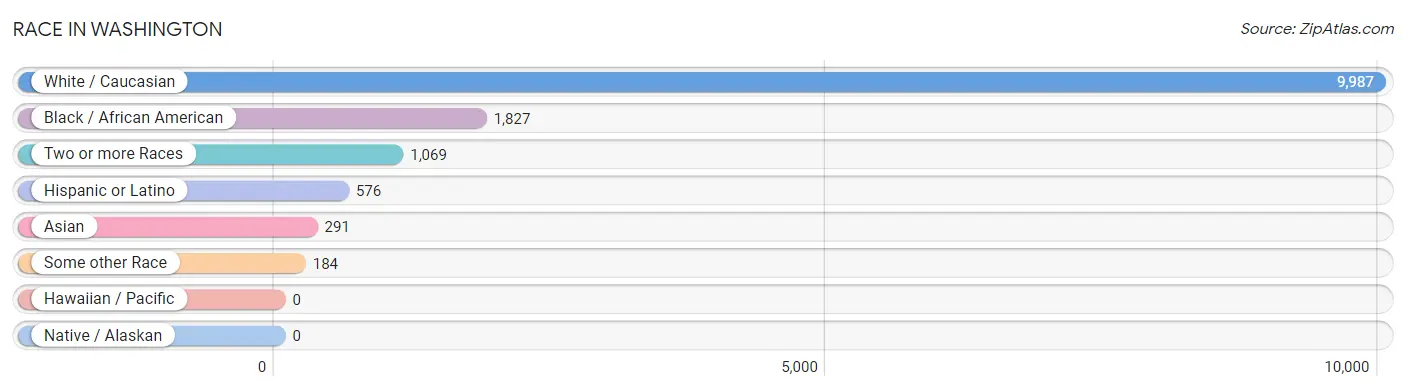
| Race | # Population | % Population |
| Asian | 291 | 2.2% |
| Black / African American | 1,827 | 13.7% |
| Hawaiian / Pacific | 0 | 0.0% |
| Hispanic or Latino | 576 | 4.3% |
| Native / Alaskan | 0 | 0.0% |
| White / Caucasian | 9,987 | 74.8% |
| Two or more Races | 1,069 | 8.0% |
| Some other Race | 184 | 1.4% |
| Total | 13,358 | 100.0% |
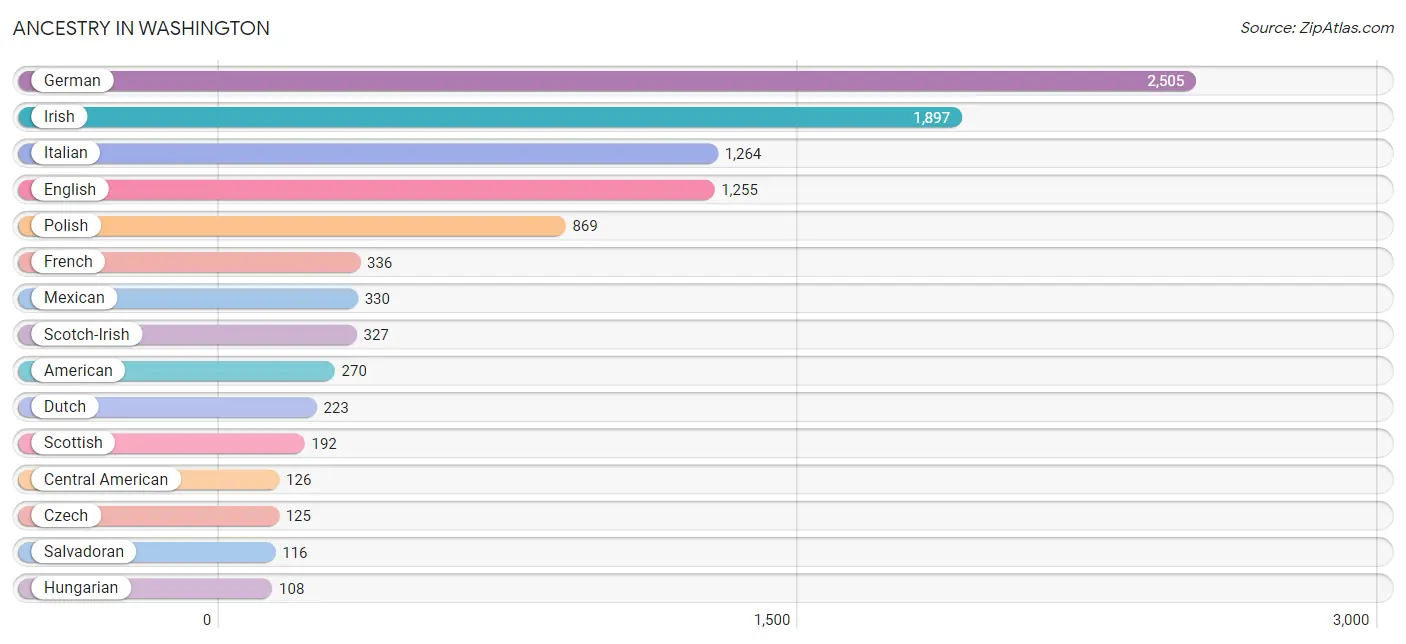
Ancestry in Washington
The most populous ancestries reported in Washington are German (2,505 | 18.8%), Irish (1,897 | 14.2%), Italian (1,264 | 9.5%), English (1,255 | 9.4%), and Polish (869 | 6.5%), together accounting for 58.3% of all Washington residents.
| Ancestry | # Population | % Population |
| African | 16 | 0.1% |
| American | 270 | 2.0% |
| Arab | 59 | 0.4% |
| Armenian | 9 | 0.1% |
| Austrian | 43 | 0.3% |
| Belgian | 5 | 0.0% |
| Blackfeet | 17 | 0.1% |
| Bolivian | 22 | 0.2% |
| British | 51 | 0.4% |
| British West Indian | 4 | 0.0% |
| Burmese | 28 | 0.2% |
| Cambodian | 5 | 0.0% |
| Central American | 126 | 0.9% |
| Cherokee | 29 | 0.2% |
| Croatian | 50 | 0.4% |
| Czech | 125 | 0.9% |
| Czechoslovakian | 52 | 0.4% |
| Dominican | 41 | 0.3% |
| Dutch | 223 | 1.7% |
| Eastern European | 29 | 0.2% |
| English | 1,255 | 9.4% |
| European | 19 | 0.1% |
| Filipino | 8 | 0.1% |
| French | 336 | 2.5% |
| French Canadian | 9 | 0.1% |
| German | 2,505 | 18.8% |
| Greek | 23 | 0.2% |
| Guatemalan | 10 | 0.1% |
| Hungarian | 108 | 0.8% |
| Indian (Asian) | 7 | 0.1% |
| Irish | 1,897 | 14.2% |
| Iroquois | 5 | 0.0% |
| Italian | 1,264 | 9.5% |
| Jamaican | 21 | 0.2% |
| Korean | 38 | 0.3% |
| Lebanese | 32 | 0.2% |
| Liberian | 8 | 0.1% |
| Lithuanian | 55 | 0.4% |
| Mexican | 330 | 2.5% |
| Nigerian | 6 | 0.0% |
| Northern European | 17 | 0.1% |
| Pakistani | 50 | 0.4% |
| Pennsylvania German | 8 | 0.1% |
| Polish | 869 | 6.5% |
| Puerto Rican | 13 | 0.1% |
| Romanian | 5 | 0.0% |
| Russian | 73 | 0.5% |
| Salvadoran | 116 | 0.9% |
| Scotch-Irish | 327 | 2.5% |
| Scottish | 192 | 1.4% |
| Serbian | 22 | 0.2% |
| Slavic | 28 | 0.2% |
| Slovak | 98 | 0.7% |
| Slovene | 59 | 0.4% |
| South American | 22 | 0.2% |
| Spanish | 44 | 0.3% |
| Sri Lankan | 9 | 0.1% |
| Subsaharan African | 30 | 0.2% |
| Swedish | 91 | 0.7% |
| Swiss | 5 | 0.0% |
| Syrian | 27 | 0.2% |
| Thai | 54 | 0.4% |
| Ukrainian | 37 | 0.3% |
| Welsh | 50 | 0.4% |
| Yugoslavian | 10 | 0.1% | View All 65 Rows |
Immigrants in Washington
The most numerous immigrant groups reported in Washington came from Asia (234 | 1.8%), South Central Asia (137 | 1.0%), Latin America (116 | 0.9%), Central America (94 | 0.7%), and Mexico (84 | 0.6%), together accounting for 5.0% of all Washington residents.
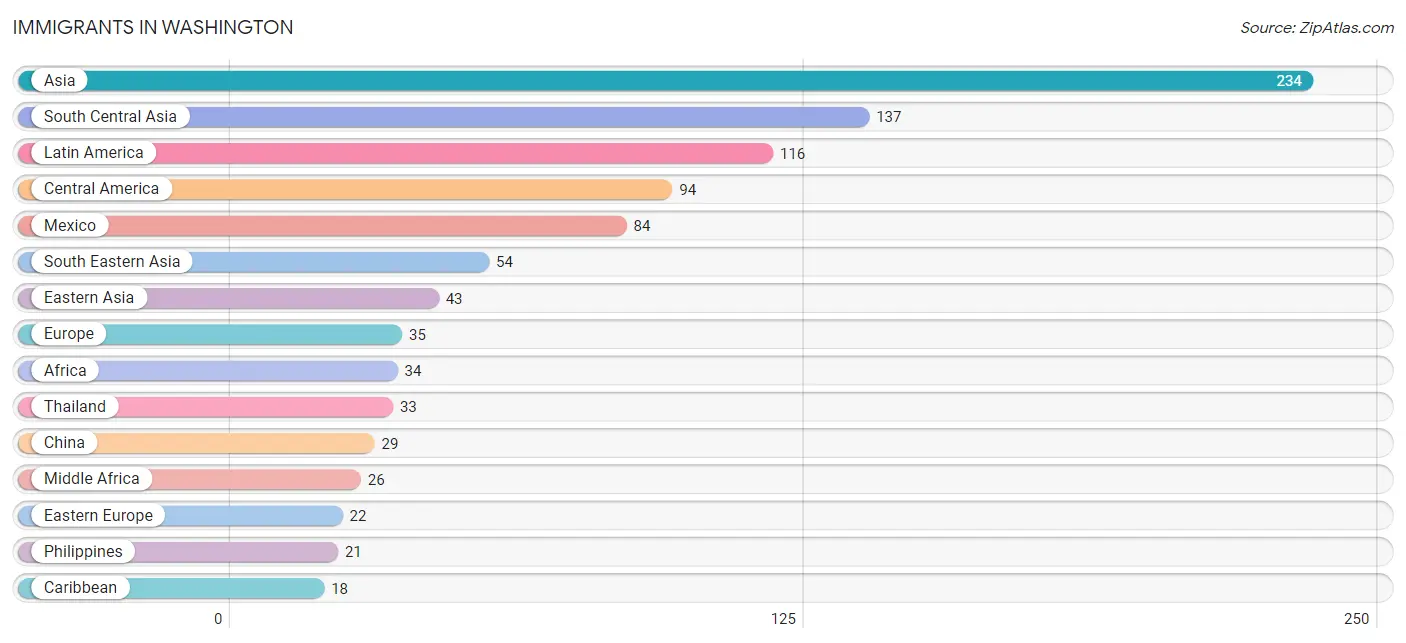
| Immigration Origin | # Population | % Population |
| Africa | 34 | 0.3% |
| Asia | 234 | 1.8% |
| Caribbean | 18 | 0.1% |
| Central America | 94 | 0.7% |
| Chile | 4 | 0.0% |
| China | 29 | 0.2% |
| Congo | 15 | 0.1% |
| Dominican Republic | 5 | 0.0% |
| Eastern Asia | 43 | 0.3% |
| Eastern Europe | 22 | 0.2% |
| England | 13 | 0.1% |
| Europe | 35 | 0.3% |
| Guatemala | 10 | 0.1% |
| Jamaica | 13 | 0.1% |
| Korea | 9 | 0.1% |
| Latin America | 116 | 0.9% |
| Liberia | 8 | 0.1% |
| Mexico | 84 | 0.6% |
| Middle Africa | 26 | 0.2% |
| Northern Europe | 13 | 0.1% |
| Pakistan | 17 | 0.1% |
| Philippines | 21 | 0.2% |
| Romania | 5 | 0.0% |
| Russia | 17 | 0.1% |
| South America | 4 | 0.0% |
| South Central Asia | 137 | 1.0% |
| South Eastern Asia | 54 | 0.4% |
| Thailand | 33 | 0.3% |
| Western Africa | 8 | 0.1% | View All 29 Rows |
Sex and Age in Washington
Sex and Age in Washington
The most populous age groups in Washington are 20 to 24 Years (881 | 13.0%) for men and 55 to 59 Years (667 | 10.1%) for women.
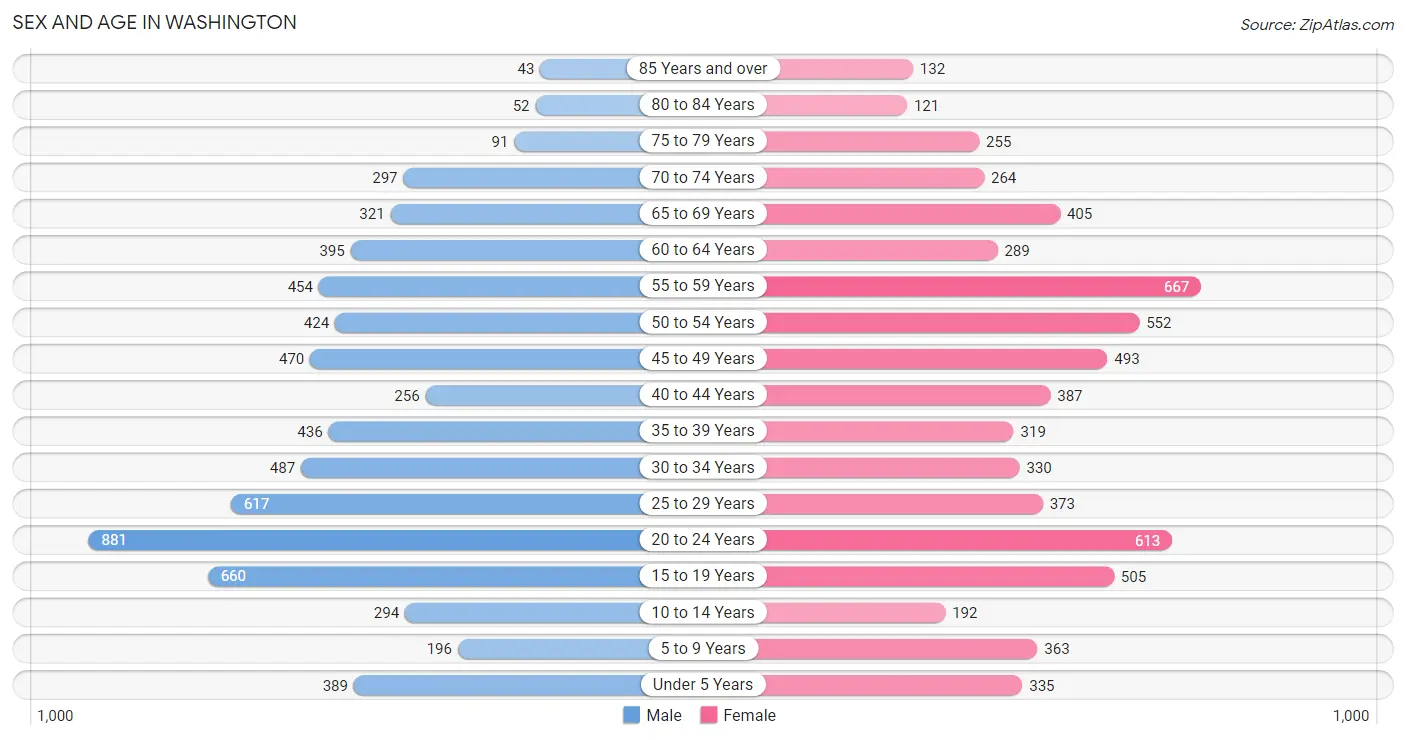
| Age Bracket | Male | Female |
| Under 5 Years | 389 (5.8%) | 335 (5.1%) |
| 5 to 9 Years | 196 (2.9%) | 363 (5.5%) |
| 10 to 14 Years | 294 (4.3%) | 192 (2.9%) |
| 15 to 19 Years | 660 (9.8%) | 505 (7.7%) |
| 20 to 24 Years | 881 (13.0%) | 613 (9.3%) |
| 25 to 29 Years | 617 (9.1%) | 373 (5.7%) |
| 30 to 34 Years | 487 (7.2%) | 330 (5.0%) |
| 35 to 39 Years | 436 (6.5%) | 319 (4.8%) |
| 40 to 44 Years | 256 (3.8%) | 387 (5.9%) |
| 45 to 49 Years | 470 (7.0%) | 493 (7.5%) |
| 50 to 54 Years | 424 (6.3%) | 552 (8.4%) |
| 55 to 59 Years | 454 (6.7%) | 667 (10.1%) |
| 60 to 64 Years | 395 (5.8%) | 289 (4.4%) |
| 65 to 69 Years | 321 (4.8%) | 405 (6.1%) |
| 70 to 74 Years | 297 (4.4%) | 264 (4.0%) |
| 75 to 79 Years | 91 (1.3%) | 255 (3.9%) |
| 80 to 84 Years | 52 (0.8%) | 121 (1.8%) |
| 85 Years and over | 43 (0.6%) | 132 (2.0%) |
| Total | 6,763 (100.0%) | 6,595 (100.0%) |
Families and Households in Washington
Median Family Size in Washington
The median family size in Washington is 2.88 persons per family, with single female/mother families (945 | 37.0%) accounting for the largest median family size of 2.94 persons per family. On the other hand, single male/father families (267 | 10.5%) represent the smallest median family size with 2.48 persons per family.
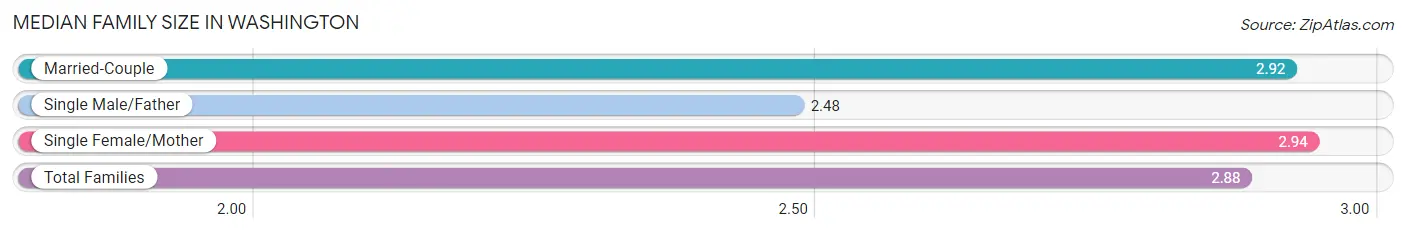
| Family Type | # Families | Family Size |
| Married-Couple | 1,340 (52.5%) | 2.92 |
| Single Male/Father | 267 (10.5%) | 2.48 |
| Single Female/Mother | 945 (37.0%) | 2.94 |
| Total Families | 2,552 (100.0%) | 2.88 |
Median Household Size in Washington
The median household size in Washington is 1.97 persons per household, with single female/mother households (945 | 16.0%) accounting for the largest median household size of 3.21 persons per household. non-family households (3,344 | 56.7%) represent the smallest median household size with 1.17 persons per household.
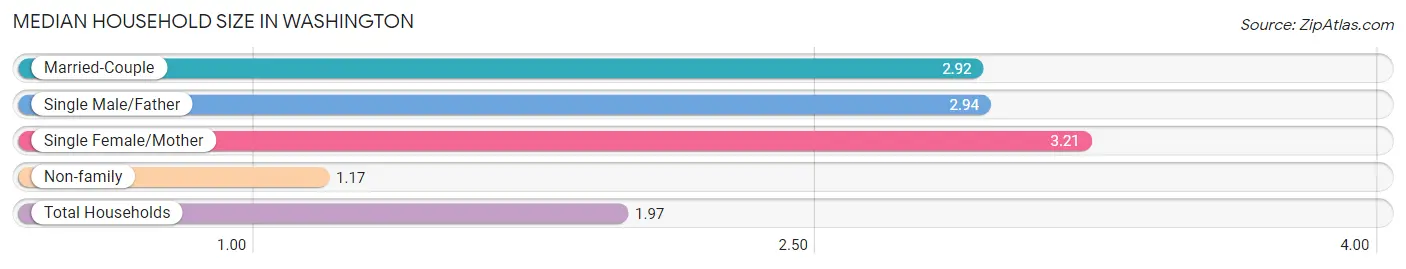
| Household Type | # Households | Household Size |
| Married-Couple | 1,340 (22.7%) | 2.92 |
| Single Male/Father | 267 (4.5%) | 2.94 |
| Single Female/Mother | 945 (16.0%) | 3.21 |
| Non-family | 3,344 (56.7%) | 1.17 |
| Total Households | 5,896 (100.0%) | 1.97 |
Household Size by Marriage Status in Washington
Out of a total of 5,896 households in Washington, 2,552 (43.3%) are family households, while 3,344 (56.7%) are nonfamily households. The most numerous type of family households are 2-person households, comprising 1,291, and the most common type of nonfamily households are 1-person households, comprising 2,873.
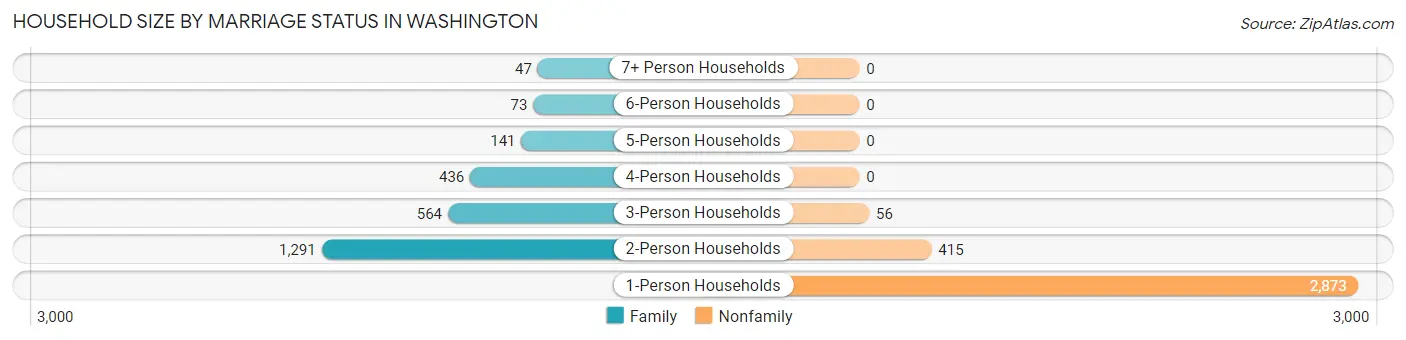
| Household Size | Family Households | Nonfamily Households |
| 1-Person Households | - | 2,873 (48.7%) |
| 2-Person Households | 1,291 (21.9%) | 415 (7.0%) |
| 3-Person Households | 564 (9.6%) | 56 (0.9%) |
| 4-Person Households | 436 (7.4%) | 0 (0.0%) |
| 5-Person Households | 141 (2.4%) | 0 (0.0%) |
| 6-Person Households | 73 (1.2%) | 0 (0.0%) |
| 7+ Person Households | 47 (0.8%) | 0 (0.0%) |
| Total | 2,552 (43.3%) | 3,344 (56.7%) |
Female Fertility in Washington
Fertility by Age in Washington
Average fertility rate in Washington is 32.0 births per 1,000 women. Women in the age bracket of 20 to 34 years have the highest fertility rate with 65.0 births per 1,000 women. Women in the age bracket of 20 to 34 years acount for 85.0% of all women with births.
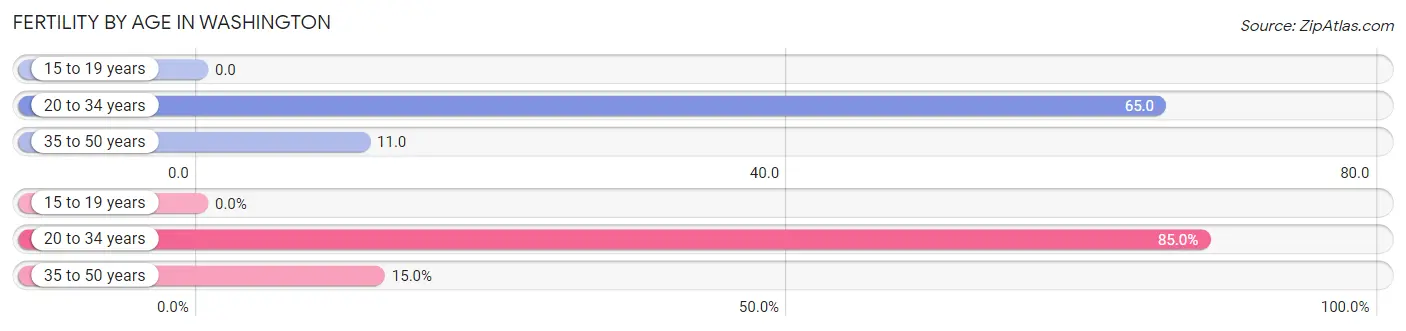
| Age Bracket | Women with Births | Births / 1,000 Women |
| 15 to 19 years | 0 (0.0%) | 0.0 |
| 20 to 34 years | 85 (85.0%) | 65.0 |
| 35 to 50 years | 15 (15.0%) | 11.0 |
| Total | 100 (100.0%) | 32.0 |
Fertility by Age by Marriage Status in Washington
59.0% of women with births (100) in Washington are married. The highest percentage of unmarried women with births falls into 35 to 50 years age bracket with 100.0% of them unmarried at the time of birth, while the lowest percentage of unmarried women with births belong to 20 to 34 years age bracket with 30.6% of them unmarried.
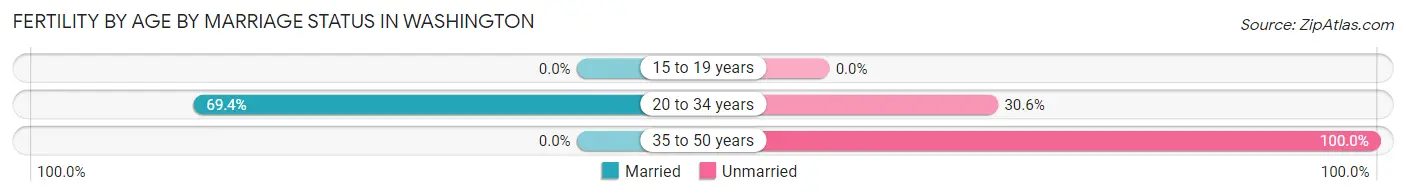
| Age Bracket | Married | Unmarried |
| 15 to 19 years | 0 (0.0%) | 0 (0.0%) |
| 20 to 34 years | 59 (69.4%) | 26 (30.6%) |
| 35 to 50 years | 0 (0.0%) | 15 (100.0%) |
| Total | 59 (59.0%) | 41 (41.0%) |
Fertility by Education in Washington
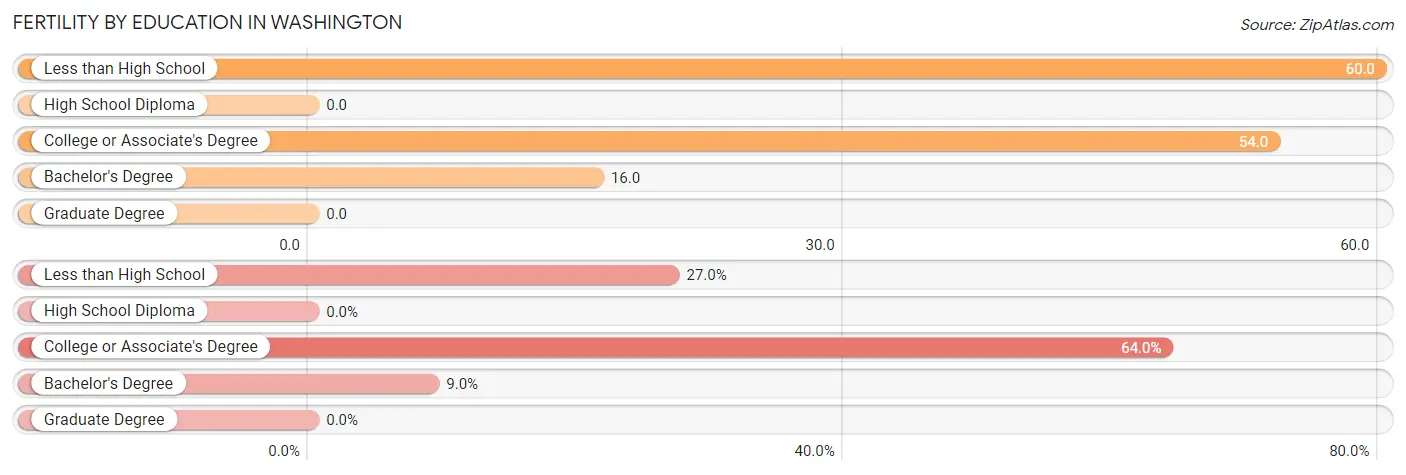
| Educational Attainment | Women with Births | Births / 1,000 Women |
| Less than High School | 27 (27.0%) | 60.0 |
| High School Diploma | 0 (0.0%) | 0.0 |
| College or Associate's Degree | 64 (64.0%) | 54.0 |
| Bachelor's Degree | 9 (9.0%) | 16.0 |
| Graduate Degree | 0 (0.0%) | 0.0 |
| Total | 100 (100.0%) | 32.0 |
Fertility by Education by Marriage Status in Washington
41.0% of women with births in Washington are unmarried. Women with the educational attainment of less than high school are most likely to be married with 100.0% of them married at childbirth, while women with the educational attainment of college or associate's degree are least likely to be married with 64.1% of them unmarried at childbirth.
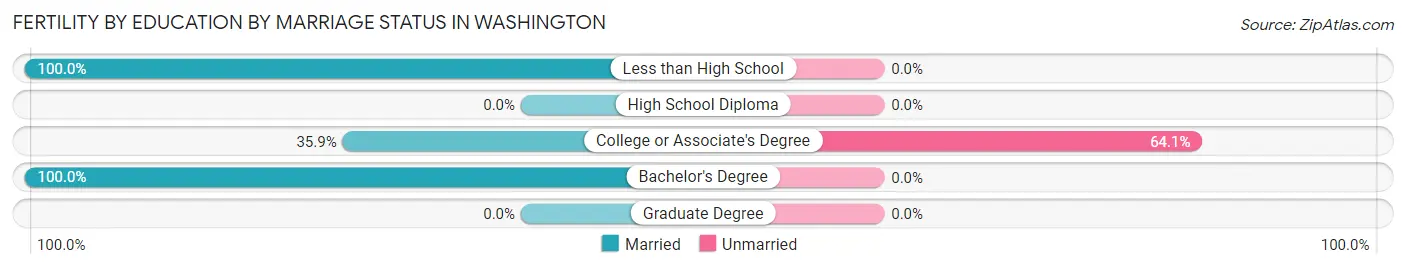
| Educational Attainment | Married | Unmarried |
| Less than High School | 27 (100.0%) | 0 (0.0%) |
| High School Diploma | 0 (0.0%) | 0 (0.0%) |
| College or Associate's Degree | 23 (35.9%) | 41 (64.1%) |
| Bachelor's Degree | 9 (100.0%) | 0 (0.0%) |
| Graduate Degree | 0 (0.0%) | 0 (0.0%) |
| Total | 59 (59.0%) | 41 (41.0%) |
Employment Characteristics in Washington
Employment by Class of Employer in Washington
Among the 6,383 employed individuals in Washington, private company employees (4,606 | 72.2%), not-for-profit organizations (1,156 | 18.1%), and self-employed (not incorporated) (239 | 3.7%) make up the most common classes of employment.
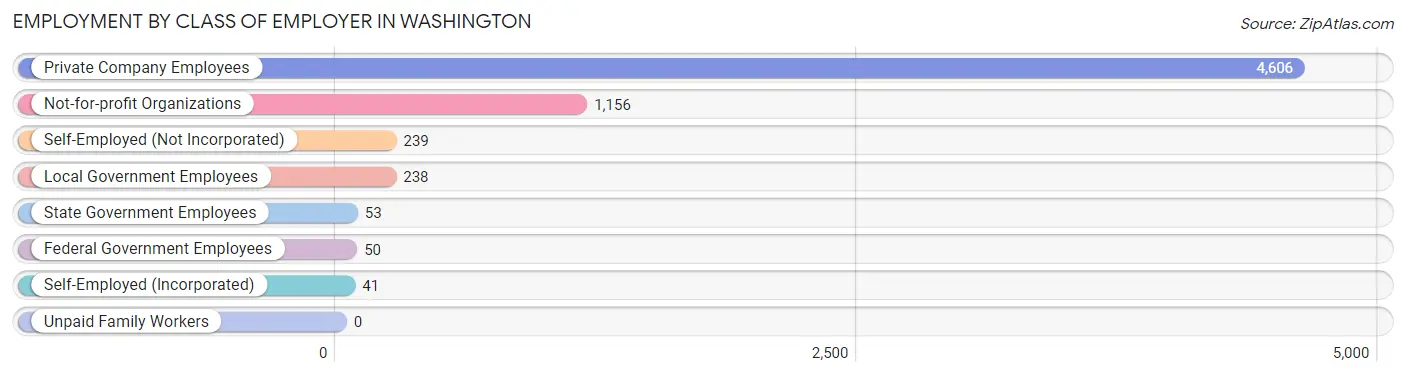
| Employer Class | # Employees | % Employees |
| Private Company Employees | 4,606 | 72.2% |
| Self-Employed (Incorporated) | 41 | 0.6% |
| Self-Employed (Not Incorporated) | 239 | 3.7% |
| Not-for-profit Organizations | 1,156 | 18.1% |
| Local Government Employees | 238 | 3.7% |
| State Government Employees | 53 | 0.8% |
| Federal Government Employees | 50 | 0.8% |
| Unpaid Family Workers | 0 | 0.0% |
| Total | 6,383 | 100.0% |
Employment Status by Age in Washington
According to the labor force statistics for Washington, out of the total population over 16 years of age (11,422), 63.2% or 7,219 individuals are in the labor force, with 8.5% or 614 of them unemployed. The age group with the highest labor force participation rate is 25 to 29 years, with 83.3% or 825 individuals in the labor force. Within the labor force, the 65 to 74 years age range has the highest percentage of unemployed individuals, with 19.7% or 97 of them being unemployed.
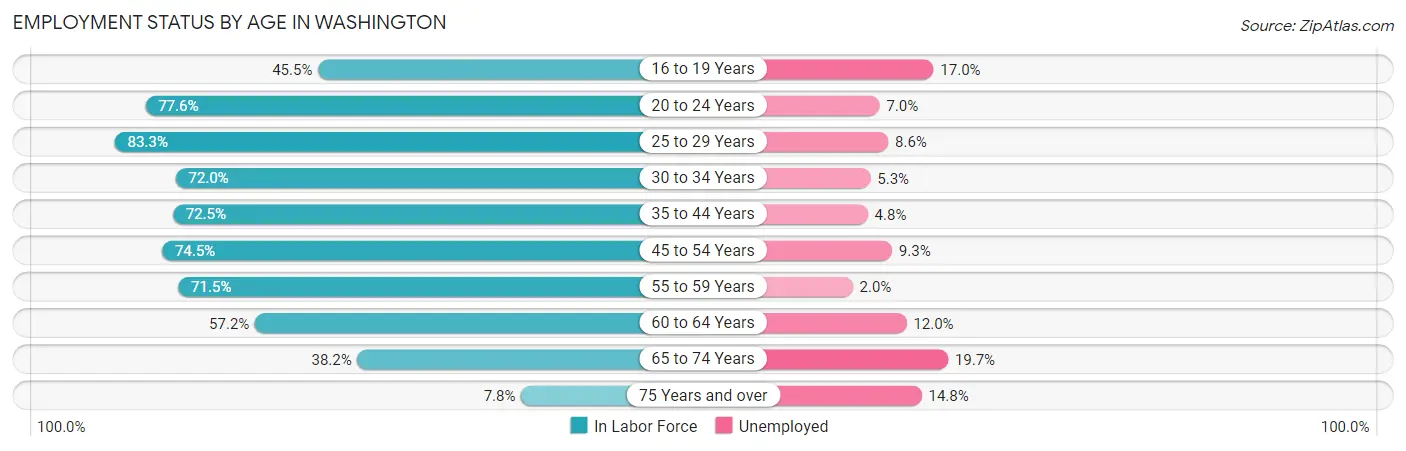
| Age Bracket | In Labor Force | Unemployed |
| 16 to 19 Years | 454 (45.5%) | 77 (17.0%) |
| 20 to 24 Years | 1,159 (77.6%) | 81 (7.0%) |
| 25 to 29 Years | 825 (83.3%) | 71 (8.6%) |
| 30 to 34 Years | 588 (72.0%) | 31 (5.3%) |
| 35 to 44 Years | 1,014 (72.5%) | 49 (4.8%) |
| 45 to 54 Years | 1,445 (74.5%) | 134 (9.3%) |
| 55 to 59 Years | 802 (71.5%) | 16 (2.0%) |
| 60 to 64 Years | 391 (57.2%) | 47 (12.0%) |
| 65 to 74 Years | 492 (38.2%) | 97 (19.7%) |
| 75 Years and over | 54 (7.8%) | 8 (14.8%) |
| Total | 7,219 (63.2%) | 614 (8.5%) |
Employment Status by Educational Attainment in Washington
According to labor force statistics for Washington, 72.9% of individuals (5,066) out of the total population between 25 and 64 years of age (6,949) are in the labor force, with 6.9% or 350 of them being unemployed. The group with the highest labor force participation rate are those with the educational attainment of bachelor's degree or higher, with 90.0% or 1,070 individuals in the labor force. Within the labor force, individuals with high school diploma education have the highest percentage of unemployment, with 10.6% or 196 of them being unemployed.
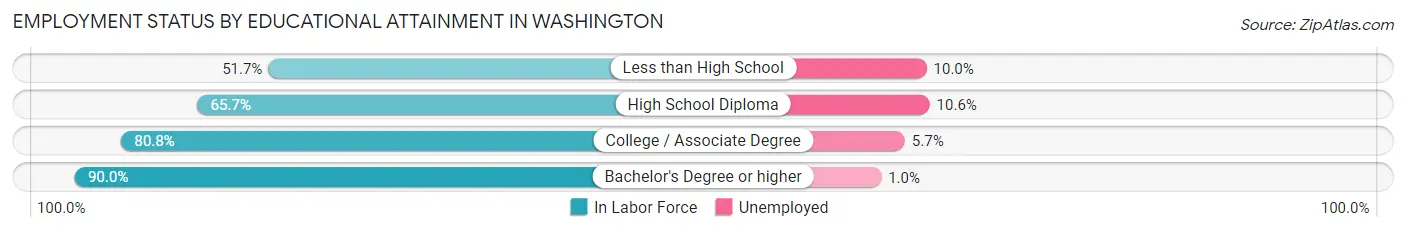
| Educational Attainment | In Labor Force | Unemployed |
| Less than High School | 419 (51.7%) | 81 (10.0%) |
| High School Diploma | 1,850 (65.7%) | 298 (10.6%) |
| College / Associate Degree | 1,723 (80.8%) | 122 (5.7%) |
| Bachelor's Degree or higher | 1,070 (90.0%) | 12 (1.0%) |
| Total | 5,066 (72.9%) | 479 (6.9%) |
Employment Occupations by Sex in Washington
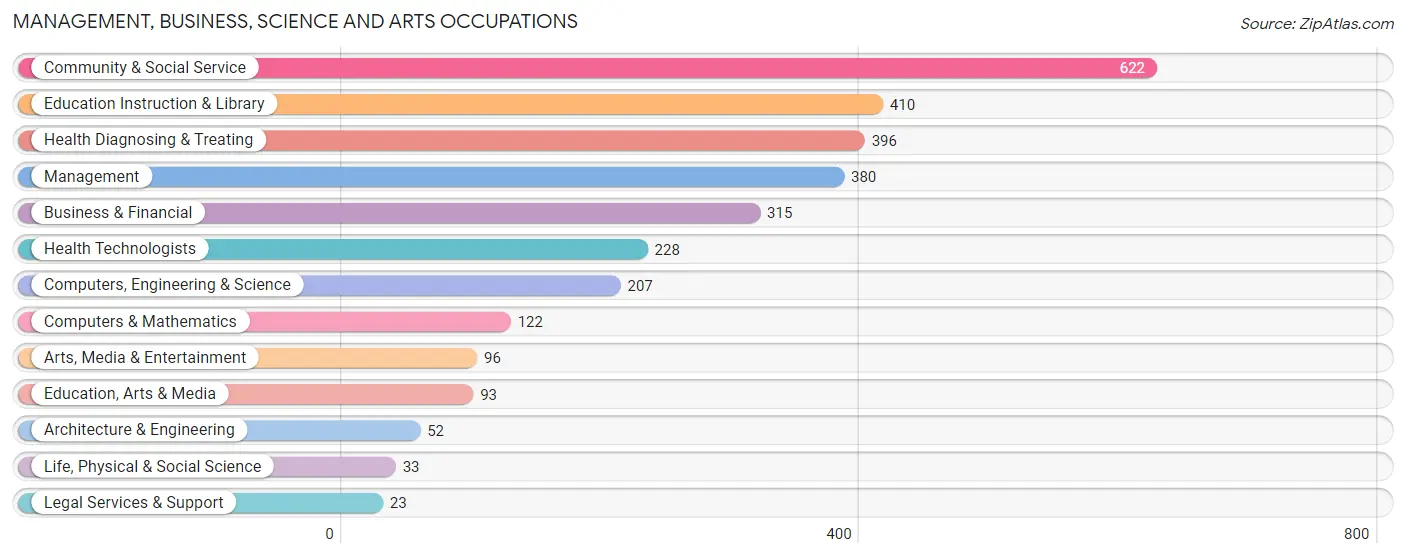
Management, Business, Science and Arts Occupations
The most common Management, Business, Science and Arts occupations in Washington are Community & Social Service (622 | 9.4%), Education Instruction & Library (410 | 6.2%), Health Diagnosing & Treating (396 | 6.0%), Management (380 | 5.8%), and Business & Financial (315 | 4.8%).
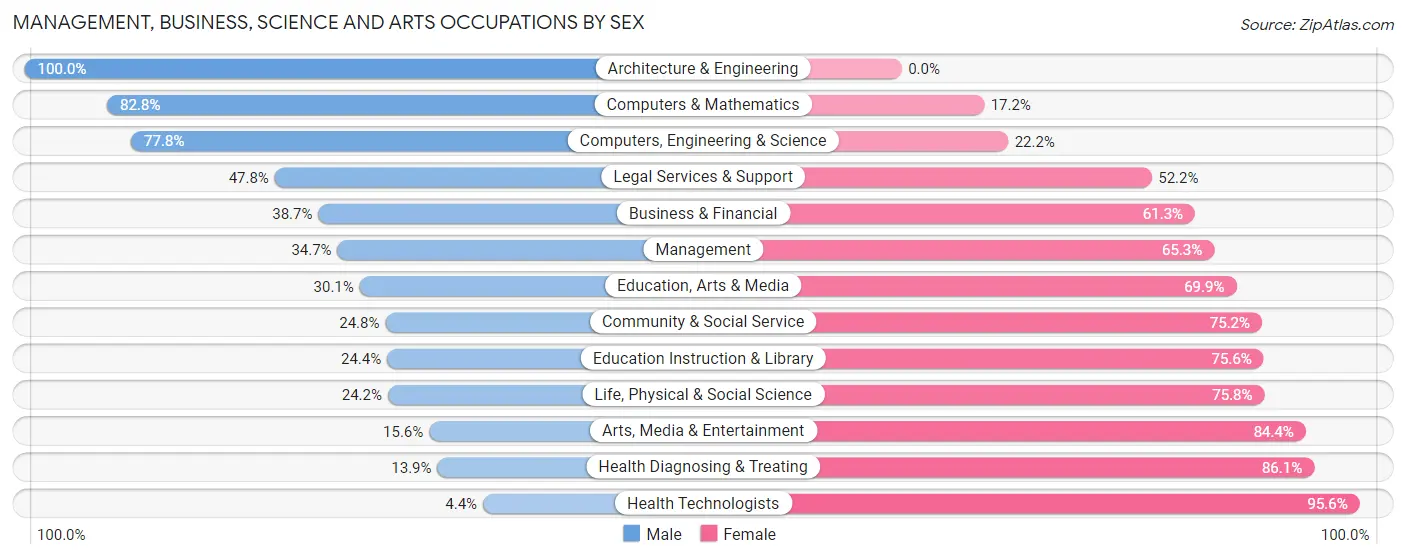
Management, Business, Science and Arts Occupations by Sex
Within the Management, Business, Science and Arts occupations in Washington, the most male-oriented occupations are Architecture & Engineering (100.0%), Computers & Mathematics (82.8%), and Computers, Engineering & Science (77.8%), while the most female-oriented occupations are Health Technologists (95.6%), Health Diagnosing & Treating (86.1%), and Arts, Media & Entertainment (84.4%).
| Occupation | Male | Female |
| Management | 132 (34.7%) | 248 (65.3%) |
| Business & Financial | 122 (38.7%) | 193 (61.3%) |
| Computers, Engineering & Science | 161 (77.8%) | 46 (22.2%) |
| Computers & Mathematics | 101 (82.8%) | 21 (17.2%) |
| Architecture & Engineering | 52 (100.0%) | 0 (0.0%) |
| Life, Physical & Social Science | 8 (24.2%) | 25 (75.8%) |
| Community & Social Service | 154 (24.8%) | 468 (75.2%) |
| Education, Arts & Media | 28 (30.1%) | 65 (69.9%) |
| Legal Services & Support | 11 (47.8%) | 12 (52.2%) |
| Education Instruction & Library | 100 (24.4%) | 310 (75.6%) |
| Arts, Media & Entertainment | 15 (15.6%) | 81 (84.4%) |
| Health Diagnosing & Treating | 55 (13.9%) | 341 (86.1%) |
| Health Technologists | 10 (4.4%) | 218 (95.6%) |
| Total (Category) | 624 (32.5%) | 1,296 (67.5%) |
| Total (Overall) | 3,329 (50.4%) | 3,282 (49.6%) |
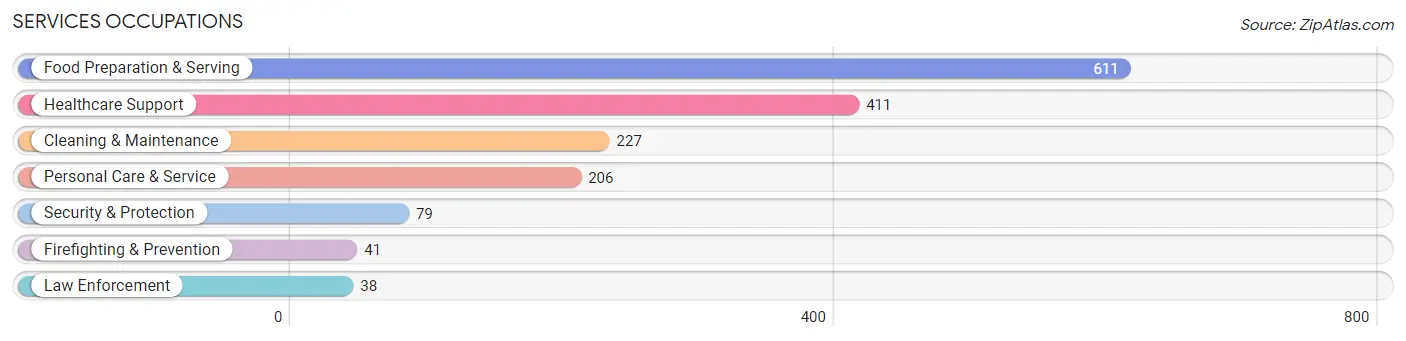
Services Occupations
The most common Services occupations in Washington are Food Preparation & Serving (611 | 9.2%), Healthcare Support (411 | 6.2%), Cleaning & Maintenance (227 | 3.4%), Personal Care & Service (206 | 3.1%), and Security & Protection (79 | 1.2%).
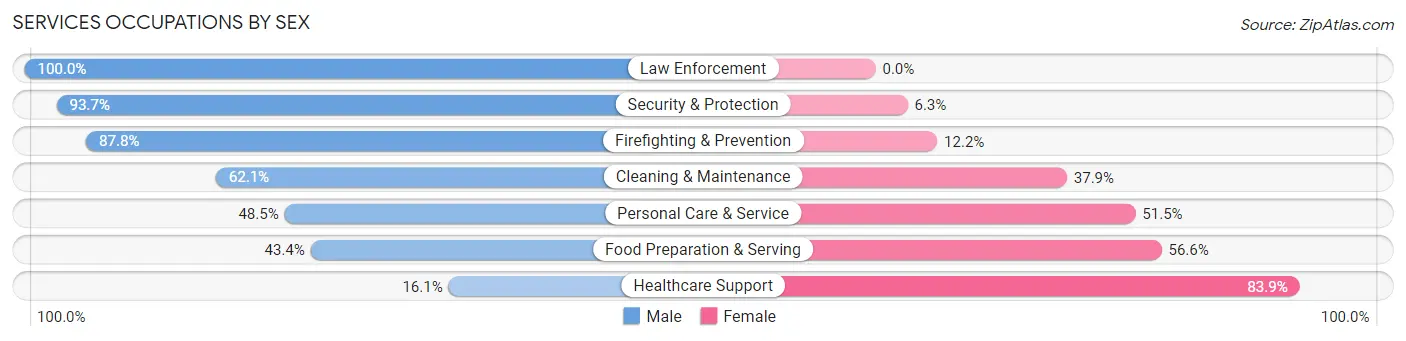
Services Occupations by Sex
Within the Services occupations in Washington, the most male-oriented occupations are Law Enforcement (100.0%), Security & Protection (93.7%), and Firefighting & Prevention (87.8%), while the most female-oriented occupations are Healthcare Support (83.9%), Food Preparation & Serving (56.6%), and Personal Care & Service (51.5%).
| Occupation | Male | Female |
| Healthcare Support | 66 (16.1%) | 345 (83.9%) |
| Security & Protection | 74 (93.7%) | 5 (6.3%) |
| Firefighting & Prevention | 36 (87.8%) | 5 (12.2%) |
| Law Enforcement | 38 (100.0%) | 0 (0.0%) |
| Food Preparation & Serving | 265 (43.4%) | 346 (56.6%) |
| Cleaning & Maintenance | 141 (62.1%) | 86 (37.9%) |
| Personal Care & Service | 100 (48.5%) | 106 (51.5%) |
| Total (Category) | 646 (42.1%) | 888 (57.9%) |
| Total (Overall) | 3,329 (50.4%) | 3,282 (49.6%) |
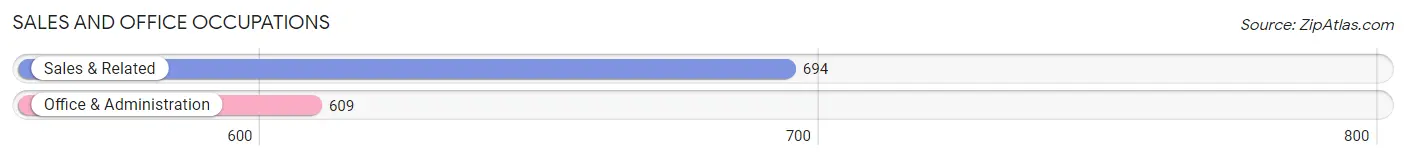
Sales and Office Occupations
The most common Sales and Office occupations in Washington are Sales & Related (694 | 10.5%), and Office & Administration (609 | 9.2%).
Sales and Office Occupations by Sex
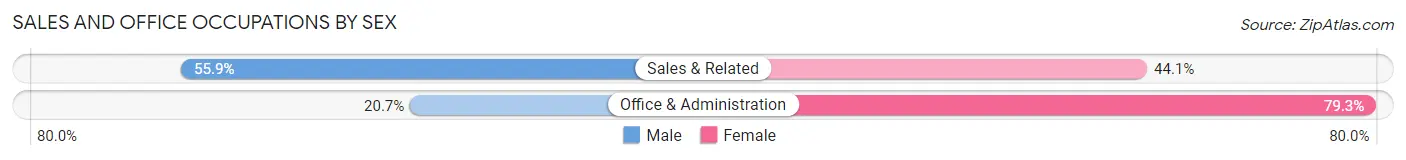
| Occupation | Male | Female |
| Sales & Related | 388 (55.9%) | 306 (44.1%) |
| Office & Administration | 126 (20.7%) | 483 (79.3%) |
| Total (Category) | 514 (39.5%) | 789 (60.6%) |
| Total (Overall) | 3,329 (50.4%) | 3,282 (49.6%) |
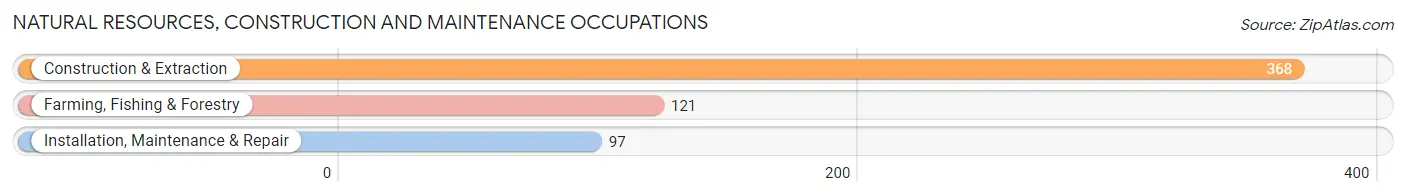
Natural Resources, Construction and Maintenance Occupations
The most common Natural Resources, Construction and Maintenance occupations in Washington are Construction & Extraction (368 | 5.6%), Farming, Fishing & Forestry (121 | 1.8%), and Installation, Maintenance & Repair (97 | 1.5%).
Natural Resources, Construction and Maintenance Occupations by Sex
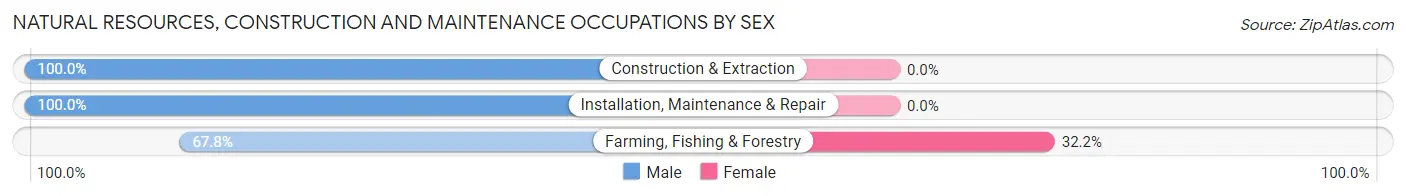
| Occupation | Male | Female |
| Farming, Fishing & Forestry | 82 (67.8%) | 39 (32.2%) |
| Construction & Extraction | 368 (100.0%) | 0 (0.0%) |
| Installation, Maintenance & Repair | 97 (100.0%) | 0 (0.0%) |
| Total (Category) | 547 (93.3%) | 39 (6.7%) |
| Total (Overall) | 3,329 (50.4%) | 3,282 (49.6%) |
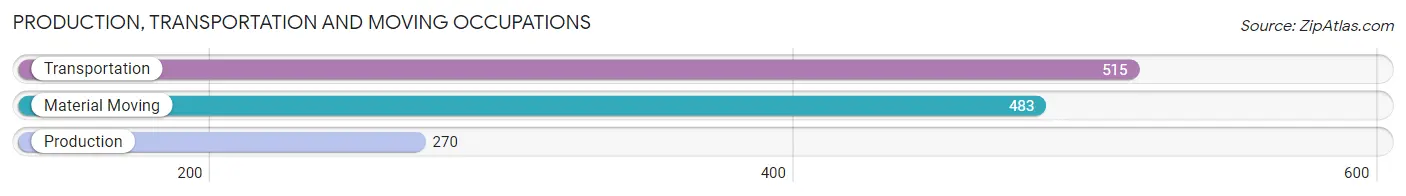
Production, Transportation and Moving Occupations
The most common Production, Transportation and Moving occupations in Washington are Transportation (515 | 7.8%), Material Moving (483 | 7.3%), and Production (270 | 4.1%).
Production, Transportation and Moving Occupations by Sex
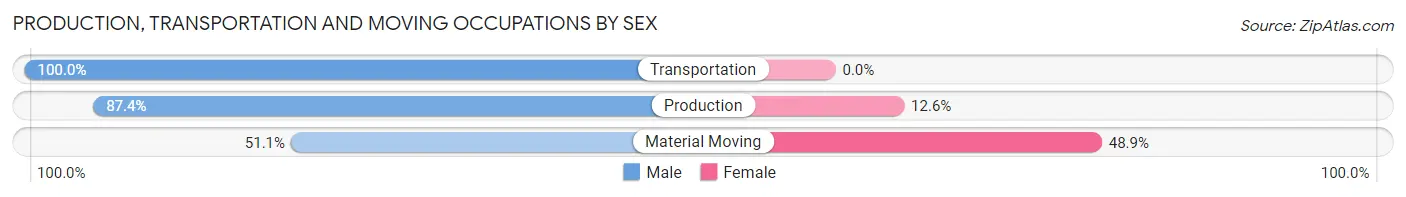
| Occupation | Male | Female |
| Production | 236 (87.4%) | 34 (12.6%) |
| Transportation | 515 (100.0%) | 0 (0.0%) |
| Material Moving | 247 (51.1%) | 236 (48.9%) |
| Total (Category) | 998 (78.7%) | 270 (21.3%) |
| Total (Overall) | 3,329 (50.4%) | 3,282 (49.6%) |
Employment Industries by Sex in Washington
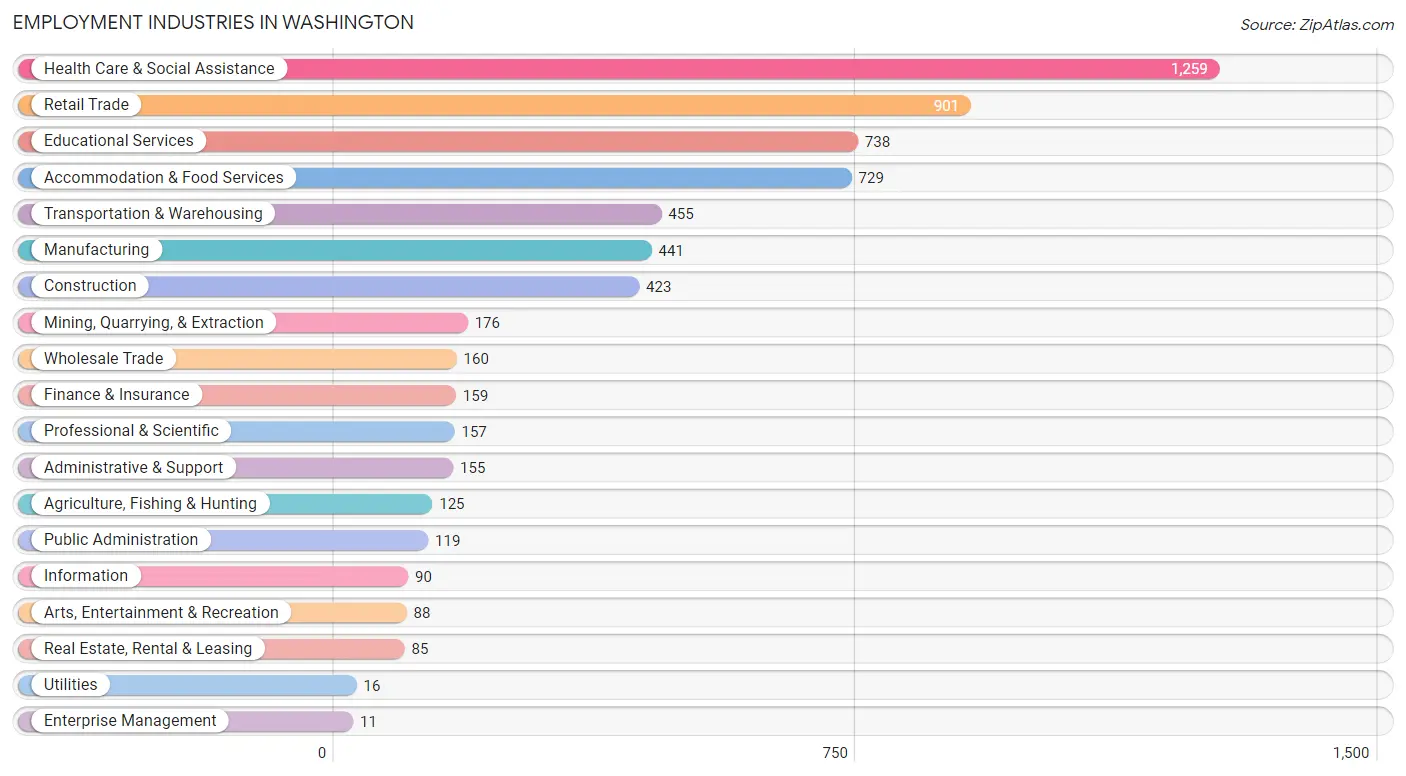
Employment Industries in Washington
The major employment industries in Washington include Health Care & Social Assistance (1,259 | 19.0%), Retail Trade (901 | 13.6%), Educational Services (738 | 11.2%), Accommodation & Food Services (729 | 11.0%), and Transportation & Warehousing (455 | 6.9%).
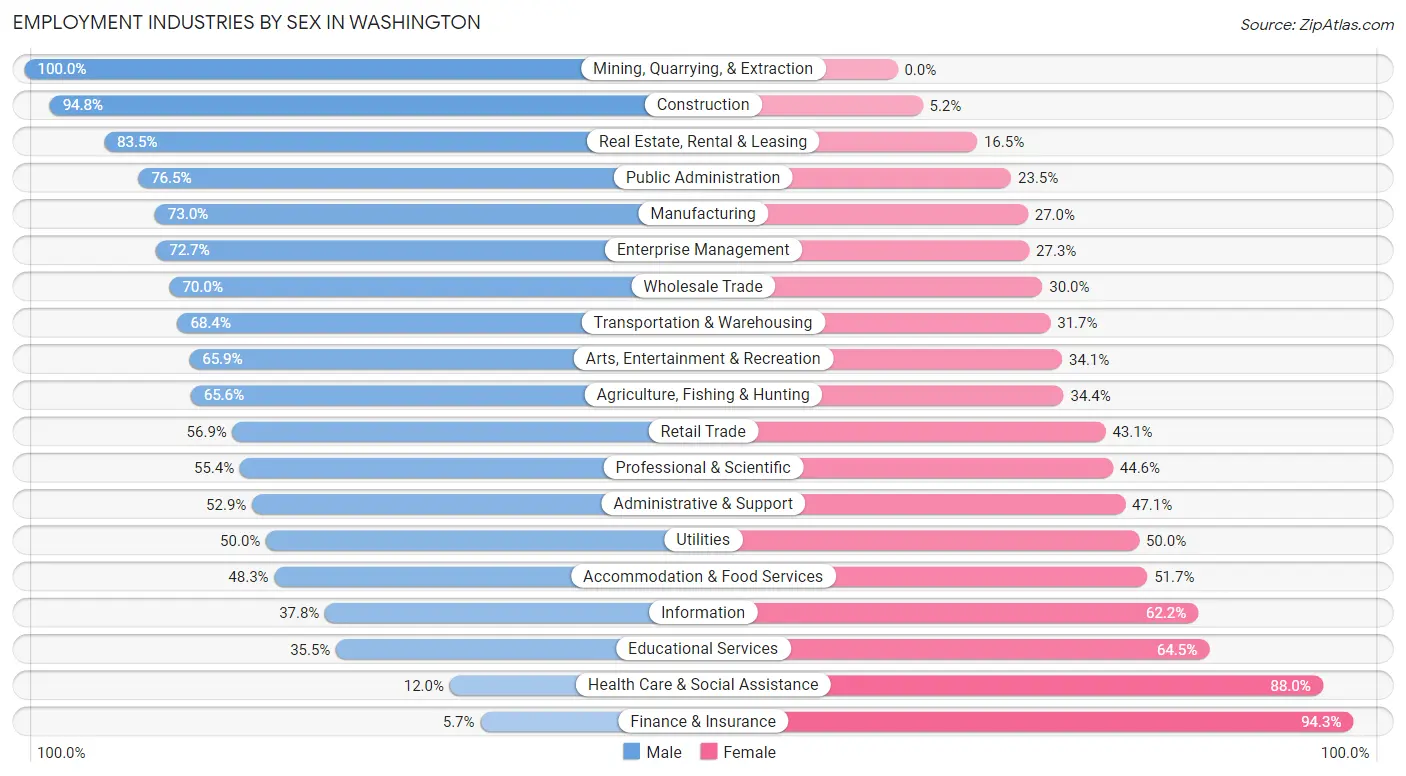
Employment Industries by Sex in Washington
The Washington industries that see more men than women are Mining, Quarrying, & Extraction (100.0%), Construction (94.8%), and Real Estate, Rental & Leasing (83.5%), whereas the industries that tend to have a higher number of women are Finance & Insurance (94.3%), Health Care & Social Assistance (88.0%), and Educational Services (64.5%).
| Industry | Male | Female |
| Agriculture, Fishing & Hunting | 82 (65.6%) | 43 (34.4%) |
| Mining, Quarrying, & Extraction | 176 (100.0%) | 0 (0.0%) |
| Construction | 401 (94.8%) | 22 (5.2%) |
| Manufacturing | 322 (73.0%) | 119 (27.0%) |
| Wholesale Trade | 112 (70.0%) | 48 (30.0%) |
| Retail Trade | 513 (56.9%) | 388 (43.1%) |
| Transportation & Warehousing | 311 (68.3%) | 144 (31.7%) |
| Utilities | 8 (50.0%) | 8 (50.0%) |
| Information | 34 (37.8%) | 56 (62.2%) |
| Finance & Insurance | 9 (5.7%) | 150 (94.3%) |
| Real Estate, Rental & Leasing | 71 (83.5%) | 14 (16.5%) |
| Professional & Scientific | 87 (55.4%) | 70 (44.6%) |
| Enterprise Management | 8 (72.7%) | 3 (27.3%) |
| Administrative & Support | 82 (52.9%) | 73 (47.1%) |
| Educational Services | 262 (35.5%) | 476 (64.5%) |
| Health Care & Social Assistance | 151 (12.0%) | 1,108 (88.0%) |
| Arts, Entertainment & Recreation | 58 (65.9%) | 30 (34.1%) |
| Accommodation & Food Services | 352 (48.3%) | 377 (51.7%) |
| Public Administration | 91 (76.5%) | 28 (23.5%) |
| Total | 3,329 (50.4%) | 3,282 (49.6%) |
Education in Washington
School Enrollment in Washington
The most common levels of schooling among the 3,156 students in Washington are college / undergraduate (1,514 | 48.0%), high school (473 | 15.0%), and middle school (439 | 13.9%).
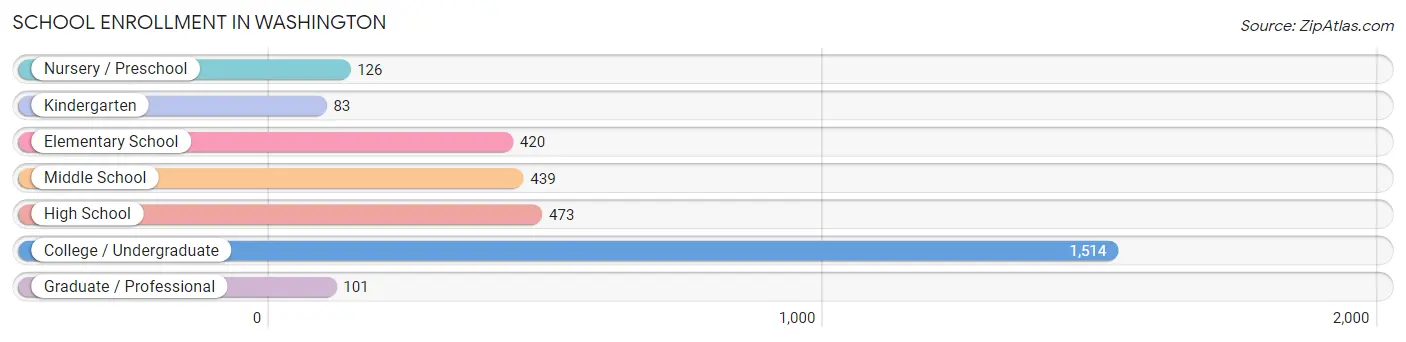
| School Level | # Students | % Students |
| Nursery / Preschool | 126 | 4.0% |
| Kindergarten | 83 | 2.6% |
| Elementary School | 420 | 13.3% |
| Middle School | 439 | 13.9% |
| High School | 473 | 15.0% |
| College / Undergraduate | 1,514 | 48.0% |
| Graduate / Professional | 101 | 3.2% |
| Total | 3,156 | 100.0% |
School Enrollment by Age by Funding Source in Washington
Out of a total of 3,156 students who are enrolled in schools in Washington, 1,045 (33.1%) attend a private institution, while the remaining 2,111 (66.9%) are enrolled in public schools. The age group of 20 to 24 year olds has the highest likelihood of being enrolled in private schools, with 463 (57.9% in the age bracket) enrolled. Conversely, the age group of 3 to 4 year olds has the lowest likelihood of being enrolled in a private school, with 96 (92.3% in the age bracket) attending a public institution.
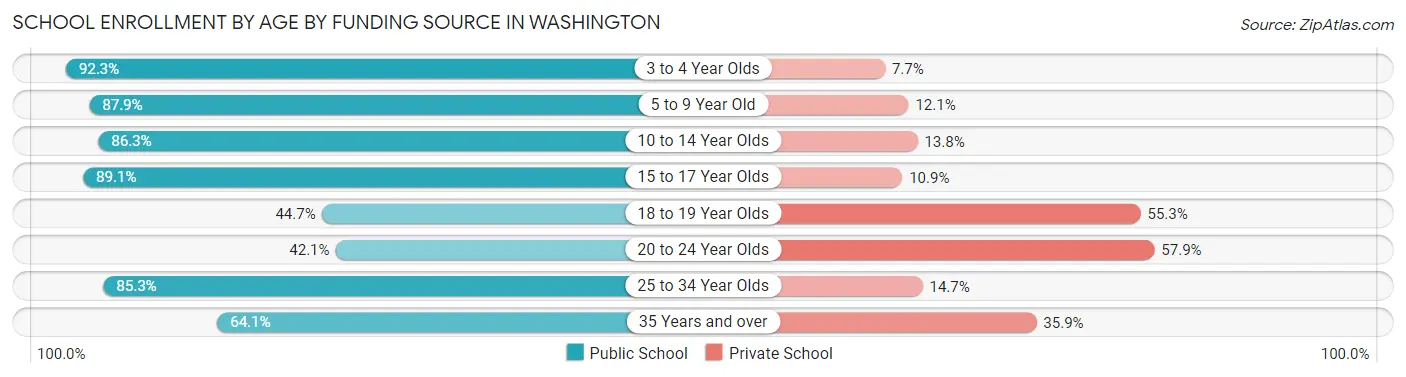
| Age Bracket | Public School | Private School |
| 3 to 4 Year Olds | 96 (92.3%) | 8 (7.7%) |
| 5 to 9 Year Old | 430 (87.9%) | 59 (12.1%) |
| 10 to 14 Year Olds | 389 (86.3%) | 62 (13.8%) |
| 15 to 17 Year Olds | 400 (89.1%) | 49 (10.9%) |
| 18 to 19 Year Olds | 287 (44.7%) | 355 (55.3%) |
| 20 to 24 Year Olds | 337 (42.1%) | 463 (57.9%) |
| 25 to 34 Year Olds | 122 (85.3%) | 21 (14.7%) |
| 35 Years and over | 50 (64.1%) | 28 (35.9%) |
| Total | 2,111 (66.9%) | 1,045 (33.1%) |
Educational Attainment by Field of Study in Washington
Education (592 | 29.9%), science & technology (416 | 21.0%), business (224 | 11.3%), communications (139 | 7.0%), and psychology (138 | 7.0%) are the most common fields of study among 1,977 individuals in Washington who have obtained a bachelor's degree or higher.
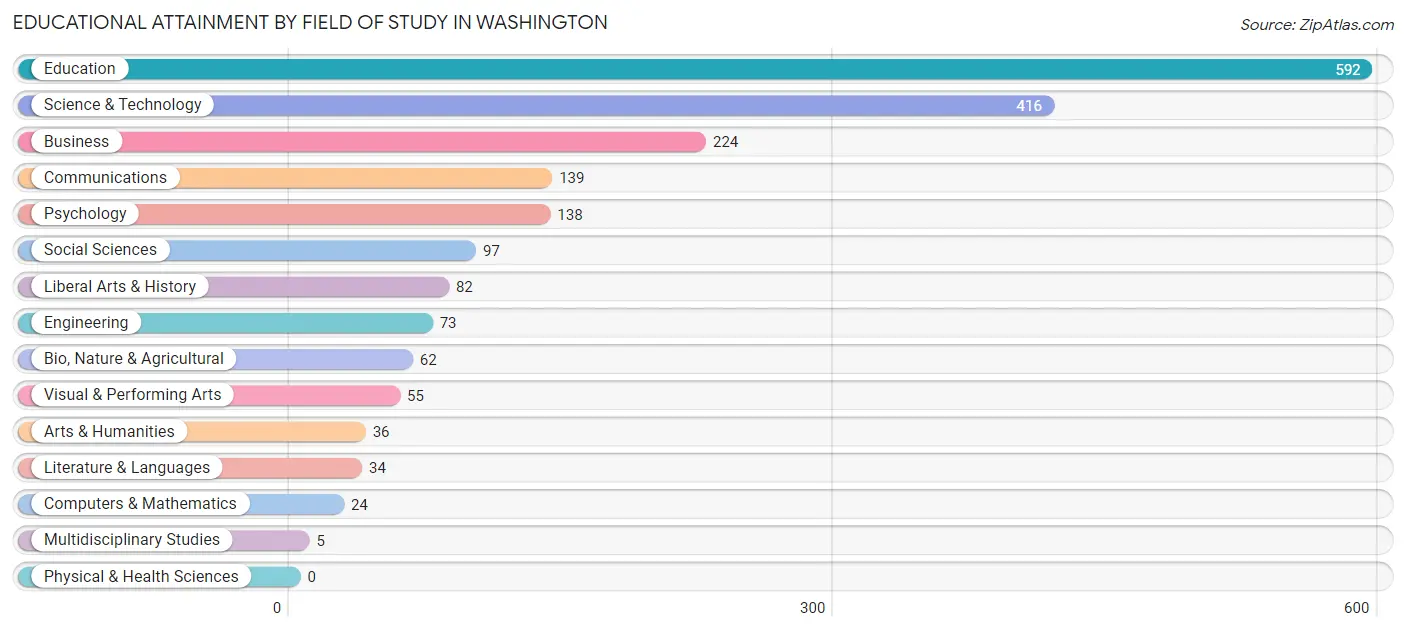
| Field of Study | # Graduates | % Graduates |
| Computers & Mathematics | 24 | 1.2% |
| Bio, Nature & Agricultural | 62 | 3.1% |
| Physical & Health Sciences | 0 | 0.0% |
| Psychology | 138 | 7.0% |
| Social Sciences | 97 | 4.9% |
| Engineering | 73 | 3.7% |
| Multidisciplinary Studies | 5 | 0.3% |
| Science & Technology | 416 | 21.0% |
| Business | 224 | 11.3% |
| Education | 592 | 29.9% |
| Literature & Languages | 34 | 1.7% |
| Liberal Arts & History | 82 | 4.2% |
| Visual & Performing Arts | 55 | 2.8% |
| Communications | 139 | 7.0% |
| Arts & Humanities | 36 | 1.8% |
| Total | 1,977 | 100.0% |
Transportation & Commute in Washington
Vehicle Availability by Sex in Washington
The most prevalent vehicle ownership categories in Washington are males with 1 vehicle (1,123, accounting for 37.8%) and females with 1 vehicle (1,102, making up 40.1%).
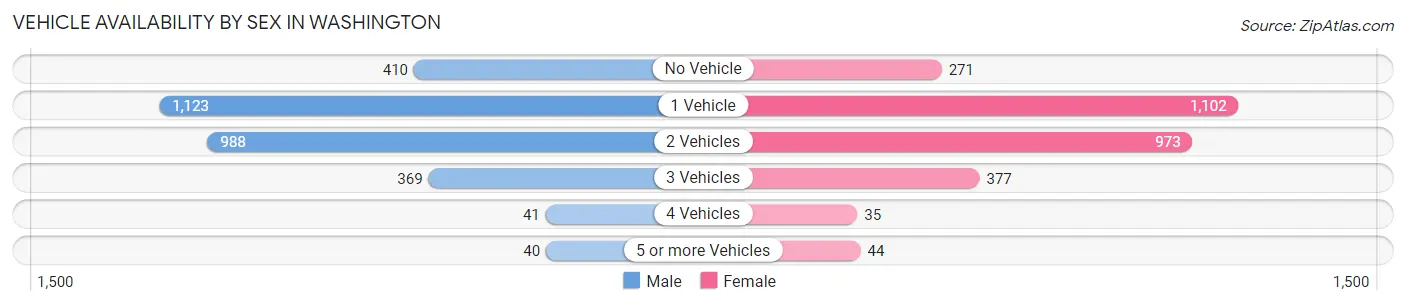
| Vehicles Available | Male | Female |
| No Vehicle | 410 (13.8%) | 271 (9.7%) |
| 1 Vehicle | 1,123 (37.8%) | 1,102 (39.3%) |
| 2 Vehicles | 988 (33.3%) | 973 (34.7%) |
| 3 Vehicles | 369 (12.4%) | 377 (13.5%) |
| 4 Vehicles | 41 (1.4%) | 35 (1.3%) |
| 5 or more Vehicles | 40 (1.3%) | 44 (1.6%) |
| Total | 2,971 (100.0%) | 2,802 (100.0%) |
Commute Time in Washington
The most frequently occuring commute durations in Washington are 5 to 9 minutes (1,324 commuters, 22.0%), 10 to 14 minutes (1,006 commuters, 16.7%), and 30 to 34 minutes (697 commuters, 11.6%).
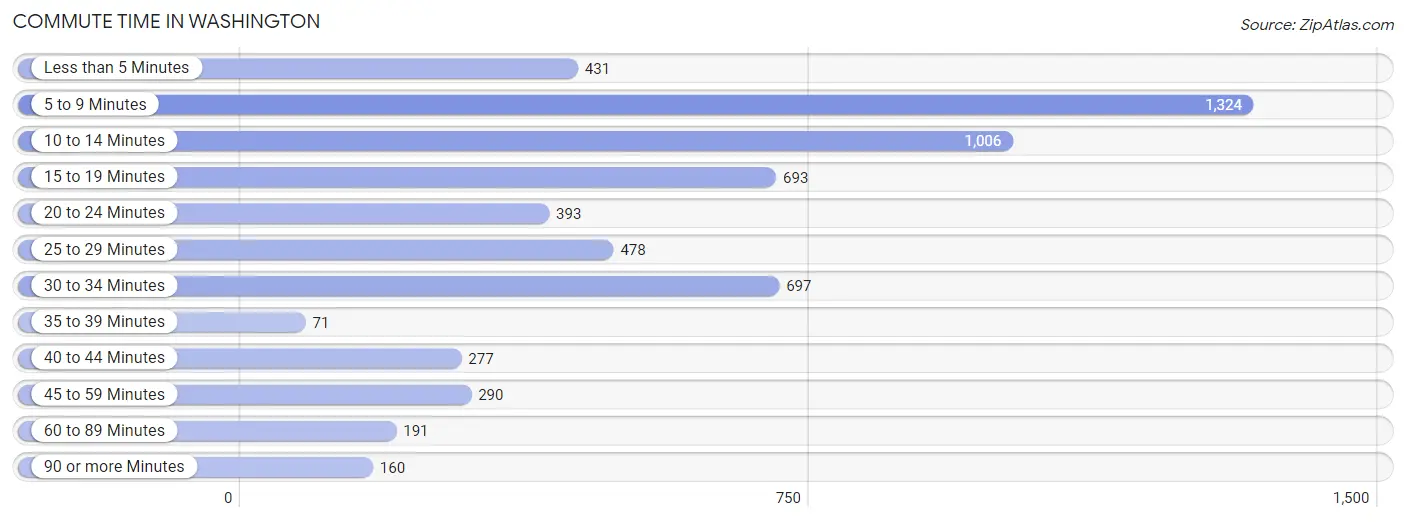
| Commute Time | # Commuters | % Commuters |
| Less than 5 Minutes | 431 | 7.2% |
| 5 to 9 Minutes | 1,324 | 22.0% |
| 10 to 14 Minutes | 1,006 | 16.7% |
| 15 to 19 Minutes | 693 | 11.5% |
| 20 to 24 Minutes | 393 | 6.5% |
| 25 to 29 Minutes | 478 | 8.0% |
| 30 to 34 Minutes | 697 | 11.6% |
| 35 to 39 Minutes | 71 | 1.2% |
| 40 to 44 Minutes | 277 | 4.6% |
| 45 to 59 Minutes | 290 | 4.8% |
| 60 to 89 Minutes | 191 | 3.2% |
| 90 or more Minutes | 160 | 2.7% |
Commute Time by Sex in Washington
The most common commute times in Washington are 30 to 34 minutes (533 commuters, 17.7%) for males and 5 to 9 minutes (878 commuters, 29.3%) for females.
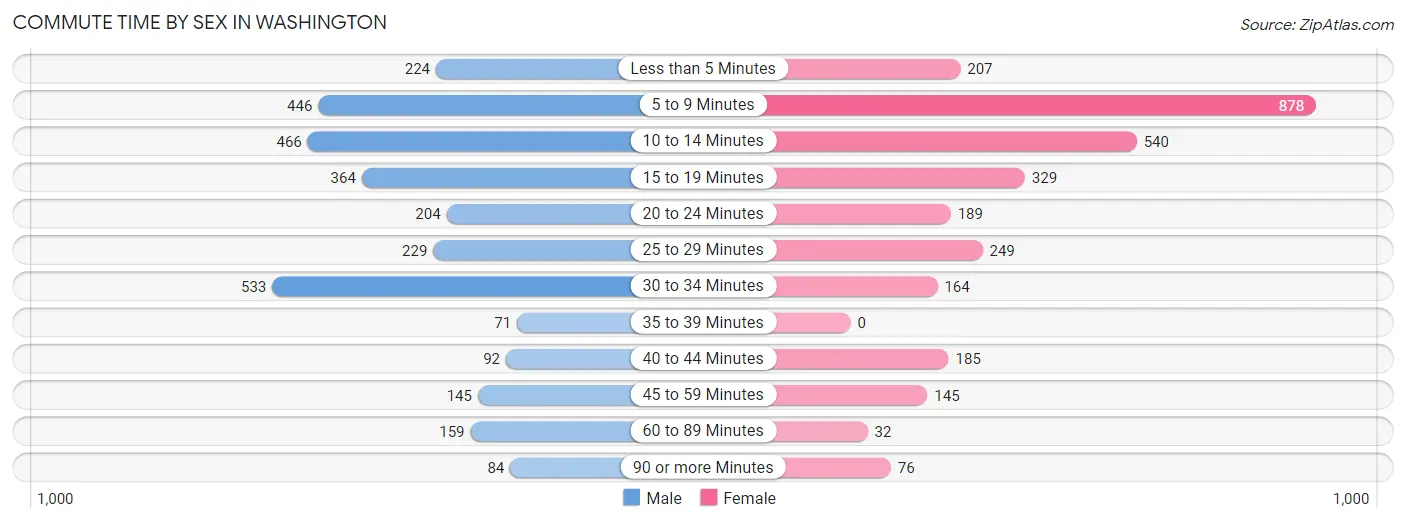
| Commute Time | Male | Female |
| Less than 5 Minutes | 224 (7.4%) | 207 (6.9%) |
| 5 to 9 Minutes | 446 (14.8%) | 878 (29.3%) |
| 10 to 14 Minutes | 466 (15.4%) | 540 (18.0%) |
| 15 to 19 Minutes | 364 (12.1%) | 329 (11.0%) |
| 20 to 24 Minutes | 204 (6.8%) | 189 (6.3%) |
| 25 to 29 Minutes | 229 (7.6%) | 249 (8.3%) |
| 30 to 34 Minutes | 533 (17.7%) | 164 (5.5%) |
| 35 to 39 Minutes | 71 (2.4%) | 0 (0.0%) |
| 40 to 44 Minutes | 92 (3.0%) | 185 (6.2%) |
| 45 to 59 Minutes | 145 (4.8%) | 145 (4.8%) |
| 60 to 89 Minutes | 159 (5.3%) | 32 (1.1%) |
| 90 or more Minutes | 84 (2.8%) | 76 (2.5%) |
Time of Departure to Work by Sex in Washington
The most frequent times of departure to work in Washington are 12:00 PM to 3:59 PM (493, 16.3%) for males and 12:00 PM to 3:59 PM (576, 19.2%) for females.
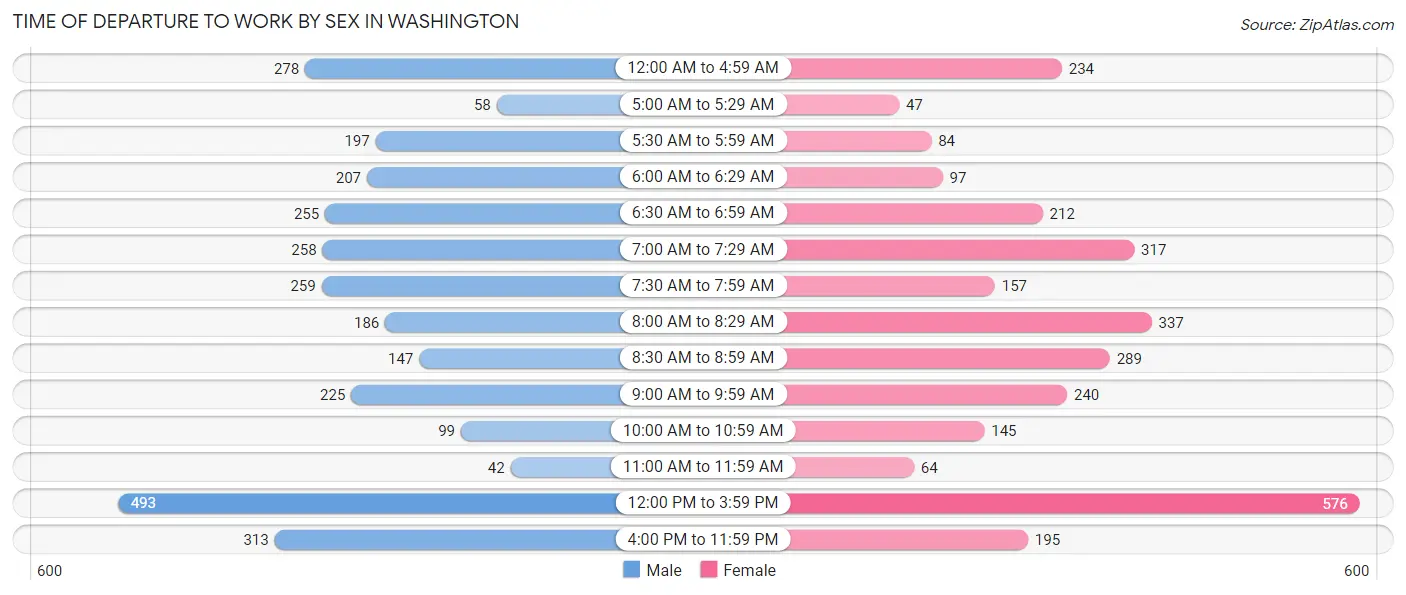
| Time of Departure | Male | Female |
| 12:00 AM to 4:59 AM | 278 (9.2%) | 234 (7.8%) |
| 5:00 AM to 5:29 AM | 58 (1.9%) | 47 (1.6%) |
| 5:30 AM to 5:59 AM | 197 (6.5%) | 84 (2.8%) |
| 6:00 AM to 6:29 AM | 207 (6.9%) | 97 (3.2%) |
| 6:30 AM to 6:59 AM | 255 (8.5%) | 212 (7.1%) |
| 7:00 AM to 7:29 AM | 258 (8.6%) | 317 (10.6%) |
| 7:30 AM to 7:59 AM | 259 (8.6%) | 157 (5.2%) |
| 8:00 AM to 8:29 AM | 186 (6.2%) | 337 (11.3%) |
| 8:30 AM to 8:59 AM | 147 (4.9%) | 289 (9.7%) |
| 9:00 AM to 9:59 AM | 225 (7.5%) | 240 (8.0%) |
| 10:00 AM to 10:59 AM | 99 (3.3%) | 145 (4.8%) |
| 11:00 AM to 11:59 AM | 42 (1.4%) | 64 (2.1%) |
| 12:00 PM to 3:59 PM | 493 (16.3%) | 576 (19.2%) |
| 4:00 PM to 11:59 PM | 313 (10.4%) | 195 (6.5%) |
| Total | 3,017 (100.0%) | 2,994 (100.0%) |
Housing Occupancy in Washington
Occupancy by Ownership in Washington
Of the total 5,896 dwellings in Washington, owner-occupied units account for 2,654 (45.0%), while renter-occupied units make up 3,242 (55.0%).
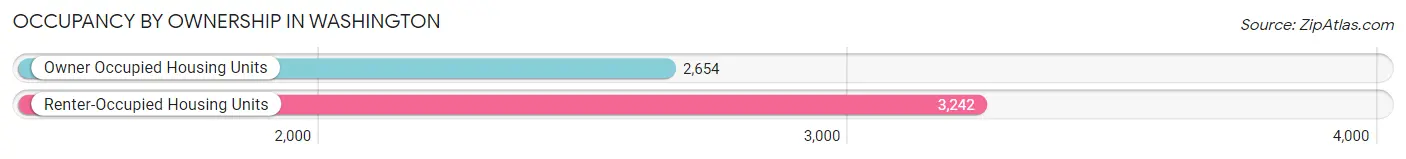
| Occupancy | # Housing Units | % Housing Units |
| Owner Occupied Housing Units | 2,654 | 45.0% |
| Renter-Occupied Housing Units | 3,242 | 55.0% |
| Total Occupied Housing Units | 5,896 | 100.0% |
Occupancy by Household Size in Washington
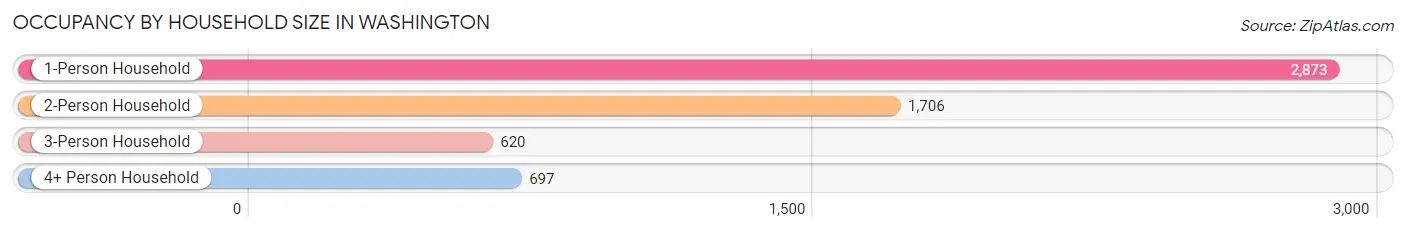
| Household Size | # Housing Units | % Housing Units |
| 1-Person Household | 2,873 | 48.7% |
| 2-Person Household | 1,706 | 28.9% |
| 3-Person Household | 620 | 10.5% |
| 4+ Person Household | 697 | 11.8% |
| Total Housing Units | 5,896 | 100.0% |
Occupancy by Ownership by Household Size in Washington
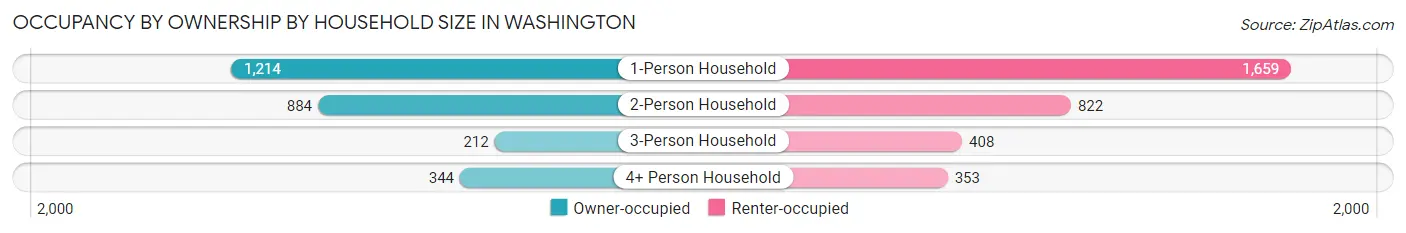
| Household Size | Owner-occupied | Renter-occupied |
| 1-Person Household | 1,214 (42.3%) | 1,659 (57.7%) |
| 2-Person Household | 884 (51.8%) | 822 (48.2%) |
| 3-Person Household | 212 (34.2%) | 408 (65.8%) |
| 4+ Person Household | 344 (49.3%) | 353 (50.6%) |
| Total Housing Units | 2,654 (45.0%) | 3,242 (55.0%) |
Occupancy by Educational Attainment in Washington
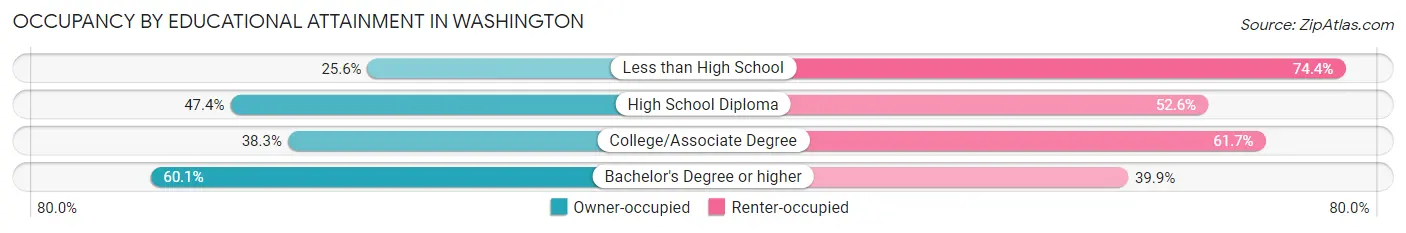
| Household Size | Owner-occupied | Renter-occupied |
| Less than High School | 154 (25.6%) | 447 (74.4%) |
| High School Diploma | 1,005 (47.4%) | 1,116 (52.6%) |
| College/Associate Degree | 722 (38.3%) | 1,165 (61.7%) |
| Bachelor's Degree or higher | 773 (60.1%) | 514 (39.9%) |
Occupancy by Age of Householder in Washington
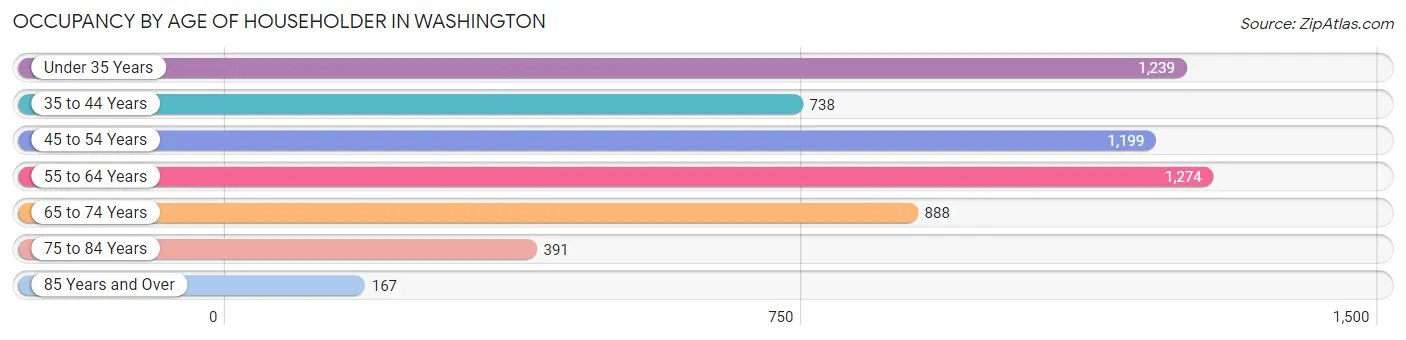
| Age Bracket | # Households | % Households |
| Under 35 Years | 1,239 | 21.0% |
| 35 to 44 Years | 738 | 12.5% |
| 45 to 54 Years | 1,199 | 20.3% |
| 55 to 64 Years | 1,274 | 21.6% |
| 65 to 74 Years | 888 | 15.1% |
| 75 to 84 Years | 391 | 6.6% |
| 85 Years and Over | 167 | 2.8% |
| Total | 5,896 | 100.0% |
Housing Finances in Washington
Median Income by Occupancy in Washington
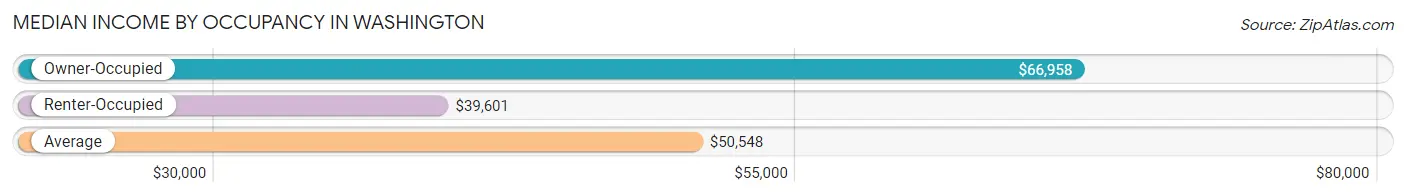
| Occupancy Type | # Households | Median Income |
| Owner-Occupied | 2,654 (45.0%) | $66,958 |
| Renter-Occupied | 3,242 (55.0%) | $39,601 |
| Average | 5,896 (100.0%) | $50,548 |
Occupancy by Householder Income Bracket in Washington
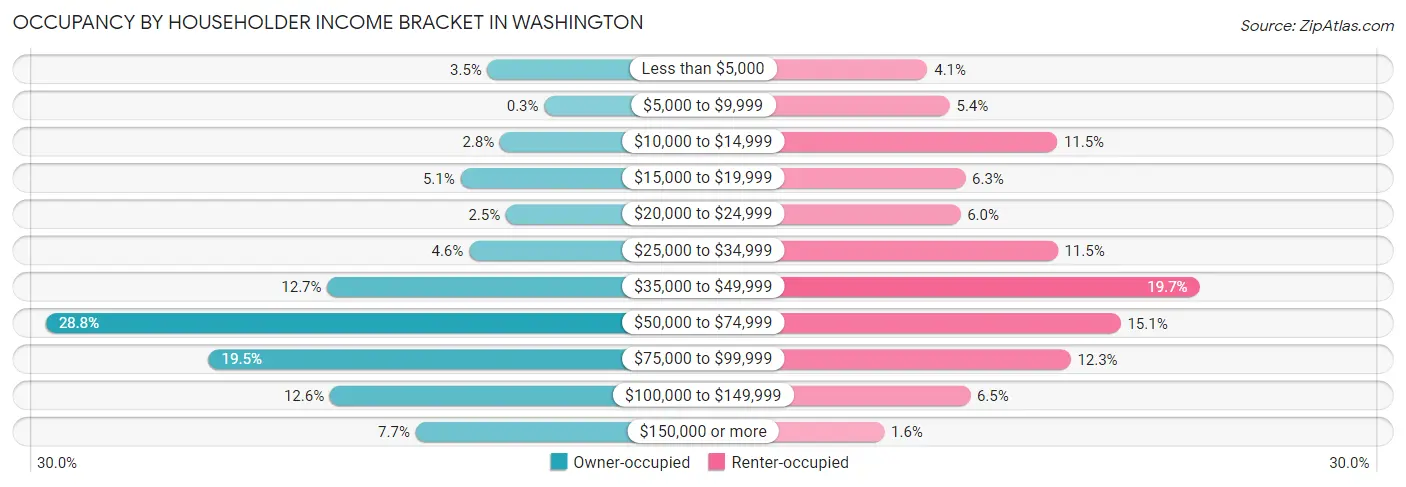
| Income Bracket | Owner-occupied | Renter-occupied |
| Less than $5,000 | 94 (3.5%) | 133 (4.1%) |
| $5,000 to $9,999 | 8 (0.3%) | 174 (5.4%) |
| $10,000 to $14,999 | 75 (2.8%) | 373 (11.5%) |
| $15,000 to $19,999 | 135 (5.1%) | 203 (6.3%) |
| $20,000 to $24,999 | 66 (2.5%) | 194 (6.0%) |
| $25,000 to $34,999 | 122 (4.6%) | 374 (11.5%) |
| $35,000 to $49,999 | 337 (12.7%) | 637 (19.7%) |
| $50,000 to $74,999 | 764 (28.8%) | 491 (15.1%) |
| $75,000 to $99,999 | 517 (19.5%) | 398 (12.3%) |
| $100,000 to $149,999 | 333 (12.6%) | 212 (6.5%) |
| $150,000 or more | 203 (7.6%) | 53 (1.6%) |
| Total | 2,654 (100.0%) | 3,242 (100.0%) |
Monthly Housing Cost Tiers in Washington
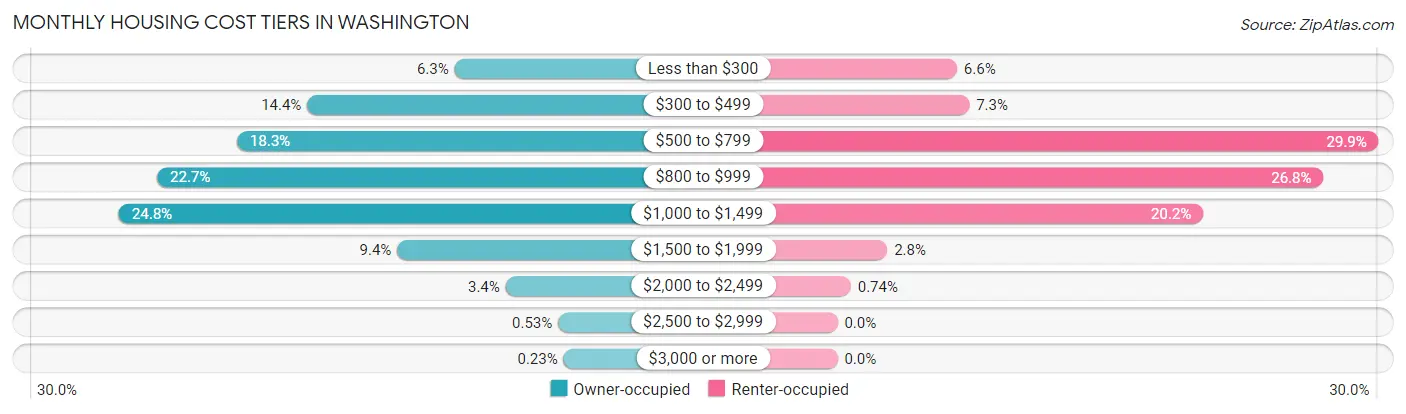
| Monthly Cost | Owner-occupied | Renter-occupied |
| Less than $300 | 166 (6.2%) | 214 (6.6%) |
| $300 to $499 | 382 (14.4%) | 236 (7.3%) |
| $500 to $799 | 485 (18.3%) | 969 (29.9%) |
| $800 to $999 | 602 (22.7%) | 870 (26.8%) |
| $1,000 to $1,499 | 658 (24.8%) | 655 (20.2%) |
| $1,500 to $1,999 | 250 (9.4%) | 89 (2.8%) |
| $2,000 to $2,499 | 91 (3.4%) | 24 (0.7%) |
| $2,500 to $2,999 | 14 (0.5%) | 0 (0.0%) |
| $3,000 or more | 6 (0.2%) | 0 (0.0%) |
| Total | 2,654 (100.0%) | 3,242 (100.0%) |
Physical Housing Characteristics in Washington
Housing Structures in Washington
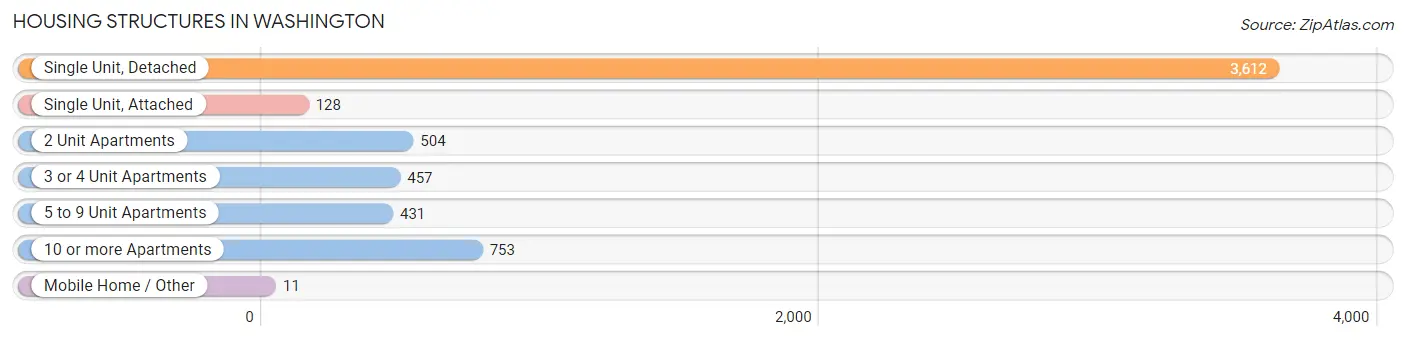
| Structure Type | # Housing Units | % Housing Units |
| Single Unit, Detached | 3,612 | 61.3% |
| Single Unit, Attached | 128 | 2.2% |
| 2 Unit Apartments | 504 | 8.6% |
| 3 or 4 Unit Apartments | 457 | 7.7% |
| 5 to 9 Unit Apartments | 431 | 7.3% |
| 10 or more Apartments | 753 | 12.8% |
| Mobile Home / Other | 11 | 0.2% |
| Total | 5,896 | 100.0% |
Housing Structures by Occupancy in Washington
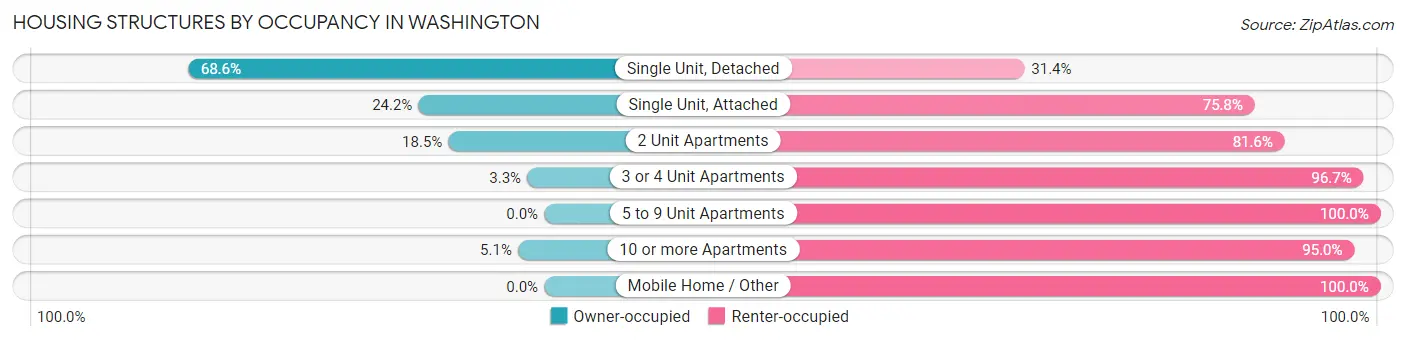
| Structure Type | Owner-occupied | Renter-occupied |
| Single Unit, Detached | 2,477 (68.6%) | 1,135 (31.4%) |
| Single Unit, Attached | 31 (24.2%) | 97 (75.8%) |
| 2 Unit Apartments | 93 (18.4%) | 411 (81.6%) |
| 3 or 4 Unit Apartments | 15 (3.3%) | 442 (96.7%) |
| 5 to 9 Unit Apartments | 0 (0.0%) | 431 (100.0%) |
| 10 or more Apartments | 38 (5.1%) | 715 (95.0%) |
| Mobile Home / Other | 0 (0.0%) | 11 (100.0%) |
| Total | 2,654 (45.0%) | 3,242 (55.0%) |
Housing Structures by Number of Rooms in Washington
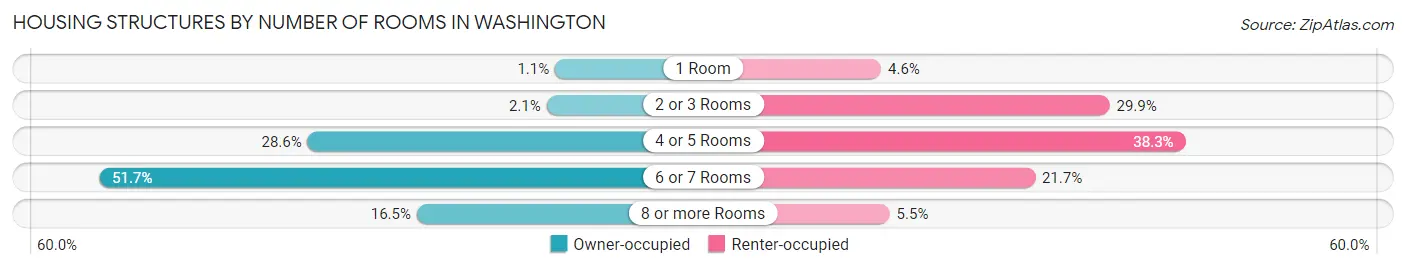
| Number of Rooms | Owner-occupied | Renter-occupied |
| 1 Room | 30 (1.1%) | 148 (4.6%) |
| 2 or 3 Rooms | 55 (2.1%) | 970 (29.9%) |
| 4 or 5 Rooms | 759 (28.6%) | 1,243 (38.3%) |
| 6 or 7 Rooms | 1,373 (51.7%) | 702 (21.6%) |
| 8 or more Rooms | 437 (16.5%) | 179 (5.5%) |
| Total | 2,654 (100.0%) | 3,242 (100.0%) |
Housing Structure by Heating Type in Washington
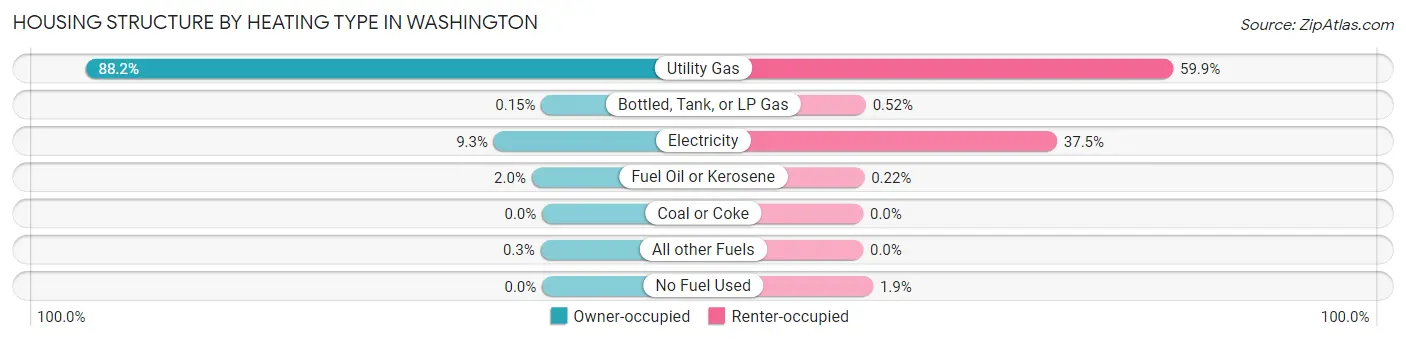
| Heating Type | Owner-occupied | Renter-occupied |
| Utility Gas | 2,341 (88.2%) | 1,942 (59.9%) |
| Bottled, Tank, or LP Gas | 4 (0.2%) | 17 (0.5%) |
| Electricity | 248 (9.3%) | 1,214 (37.4%) |
| Fuel Oil or Kerosene | 53 (2.0%) | 7 (0.2%) |
| Coal or Coke | 0 (0.0%) | 0 (0.0%) |
| All other Fuels | 8 (0.3%) | 0 (0.0%) |
| No Fuel Used | 0 (0.0%) | 62 (1.9%) |
| Total | 2,654 (100.0%) | 3,242 (100.0%) |
Household Vehicle Usage in Washington
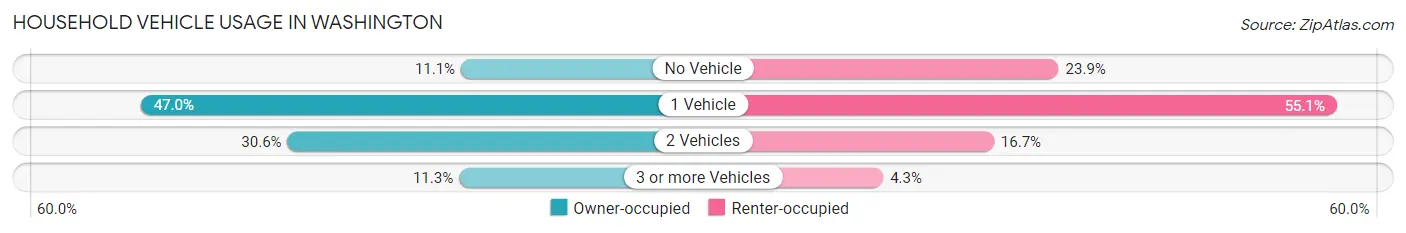
| Vehicles per Household | Owner-occupied | Renter-occupied |
| No Vehicle | 295 (11.1%) | 776 (23.9%) |
| 1 Vehicle | 1,247 (47.0%) | 1,786 (55.1%) |
| 2 Vehicles | 811 (30.6%) | 541 (16.7%) |
| 3 or more Vehicles | 301 (11.3%) | 139 (4.3%) |
| Total | 2,654 (100.0%) | 3,242 (100.0%) |
Real Estate & Mortgages in Washington
Real Estate and Mortgage Overview in Washington
| Characteristic | Without Mortgage | With Mortgage |
| Housing Units | 1,006 | 1,648 |
| Median Property Value | $99,700 | $113,900 |
| Median Household Income | $51,250 | $162 |
| Monthly Housing Costs | $481 | $6 |
| Real Estate Taxes | $1,627 | $18 |
Property Value by Mortgage Status in Washington
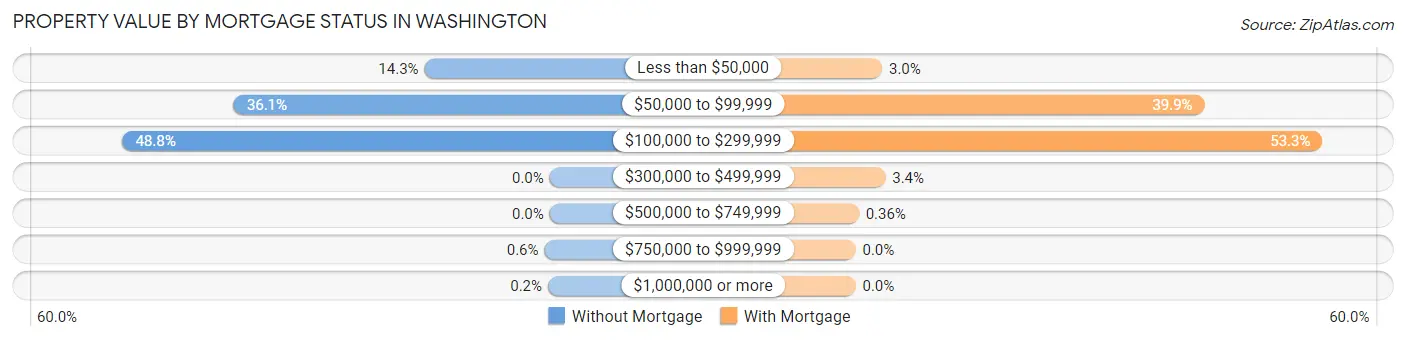
| Property Value | Without Mortgage | With Mortgage |
| Less than $50,000 | 144 (14.3%) | 50 (3.0%) |
| $50,000 to $99,999 | 363 (36.1%) | 657 (39.9%) |
| $100,000 to $299,999 | 491 (48.8%) | 879 (53.3%) |
| $300,000 to $499,999 | 0 (0.0%) | 56 (3.4%) |
| $500,000 to $749,999 | 0 (0.0%) | 6 (0.4%) |
| $750,000 to $999,999 | 6 (0.6%) | 0 (0.0%) |
| $1,000,000 or more | 2 (0.2%) | 0 (0.0%) |
| Total | 1,006 (100.0%) | 1,648 (100.0%) |
Household Income by Mortgage Status in Washington
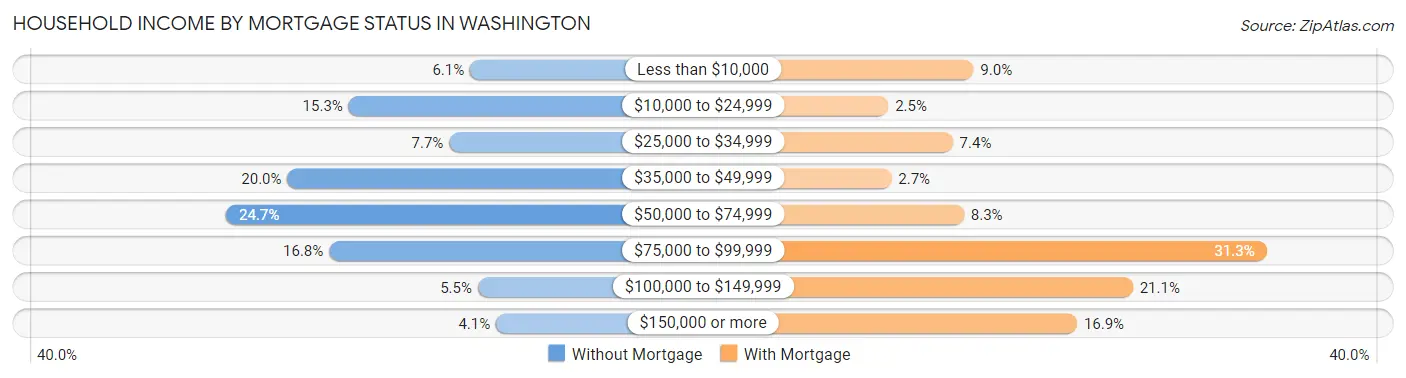
| Household Income | Without Mortgage | With Mortgage |
| Less than $10,000 | 61 (6.1%) | 148 (9.0%) |
| $10,000 to $24,999 | 154 (15.3%) | 41 (2.5%) |
| $25,000 to $34,999 | 77 (7.6%) | 122 (7.4%) |
| $35,000 to $49,999 | 201 (20.0%) | 45 (2.7%) |
| $50,000 to $74,999 | 248 (24.6%) | 136 (8.3%) |
| $75,000 to $99,999 | 169 (16.8%) | 516 (31.3%) |
| $100,000 to $149,999 | 55 (5.5%) | 348 (21.1%) |
| $150,000 or more | 41 (4.1%) | 278 (16.9%) |
| Total | 1,006 (100.0%) | 1,648 (100.0%) |
Property Value to Household Income Ratio in Washington
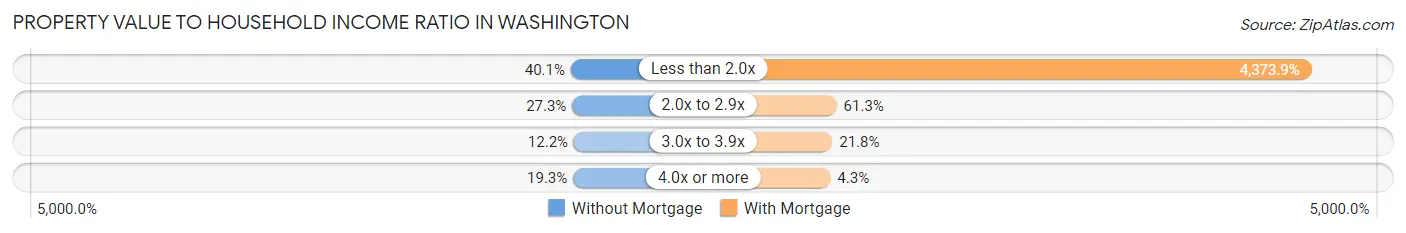
| Value-to-Income Ratio | Without Mortgage | With Mortgage |
| Less than 2.0x | 403 (40.1%) | 72,081 (4,373.9%) |
| 2.0x to 2.9x | 275 (27.3%) | 1,010 (61.3%) |
| 3.0x to 3.9x | 123 (12.2%) | 359 (21.8%) |
| 4.0x or more | 194 (19.3%) | 71 (4.3%) |
| Total | 1,006 (100.0%) | 1,648 (100.0%) |
Real Estate Taxes by Mortgage Status in Washington
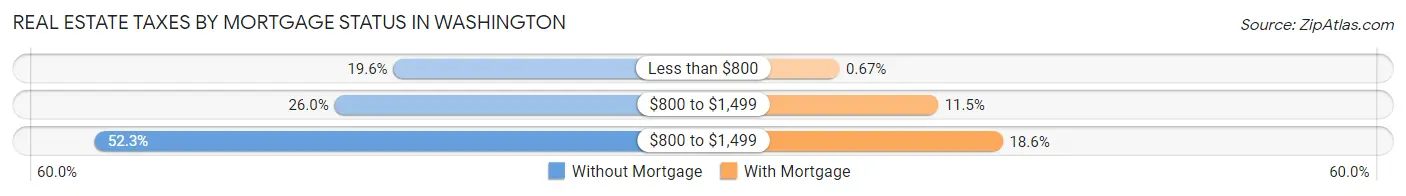
| Property Taxes | Without Mortgage | With Mortgage |
| Less than $800 | 197 (19.6%) | 11 (0.7%) |
| $800 to $1,499 | 262 (26.0%) | 189 (11.5%) |
| $800 to $1,499 | 526 (52.3%) | 306 (18.6%) |
| Total | 1,006 (100.0%) | 1,648 (100.0%) |
Health & Disability in Washington
Health Insurance Coverage by Age in Washington
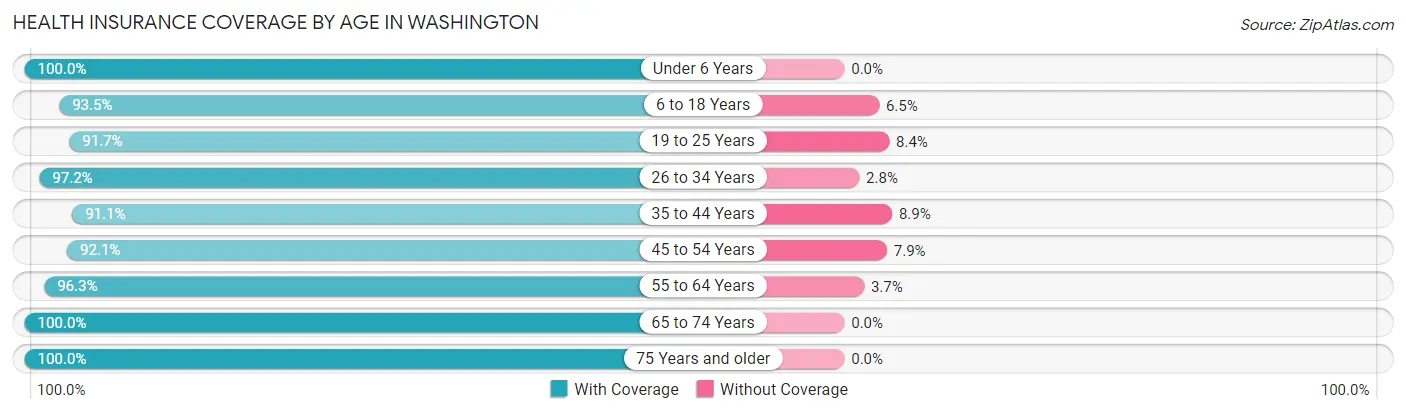
| Age Bracket | With Coverage | Without Coverage |
| Under 6 Years | 816 (100.0%) | 0 (0.0%) |
| 6 to 18 Years | 1,563 (93.5%) | 108 (6.5%) |
| 19 to 25 Years | 1,909 (91.6%) | 174 (8.4%) |
| 26 to 34 Years | 1,439 (97.2%) | 41 (2.8%) |
| 35 to 44 Years | 1,168 (91.1%) | 114 (8.9%) |
| 45 to 54 Years | 1,762 (92.1%) | 152 (7.9%) |
| 55 to 64 Years | 1,706 (96.3%) | 65 (3.7%) |
| 65 to 74 Years | 1,283 (100.0%) | 0 (0.0%) |
| 75 Years and older | 694 (100.0%) | 0 (0.0%) |
| Total | 12,340 (95.0%) | 654 (5.0%) |
Health Insurance Coverage by Citizenship Status in Washington
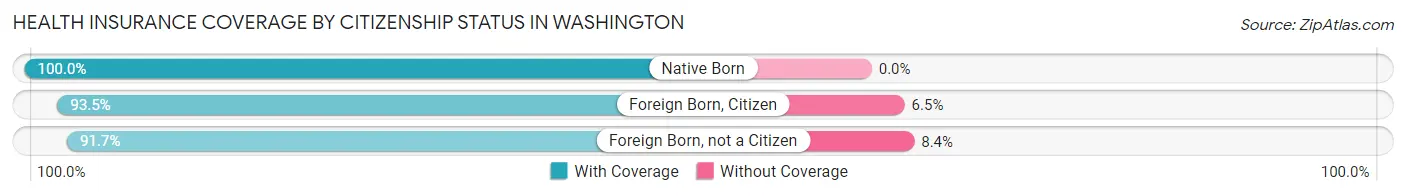
| Citizenship Status | With Coverage | Without Coverage |
| Native Born | 816 (100.0%) | 0 (0.0%) |
| Foreign Born, Citizen | 1,563 (93.5%) | 108 (6.5%) |
| Foreign Born, not a Citizen | 1,909 (91.6%) | 174 (8.4%) |
Health Insurance Coverage by Household Income in Washington
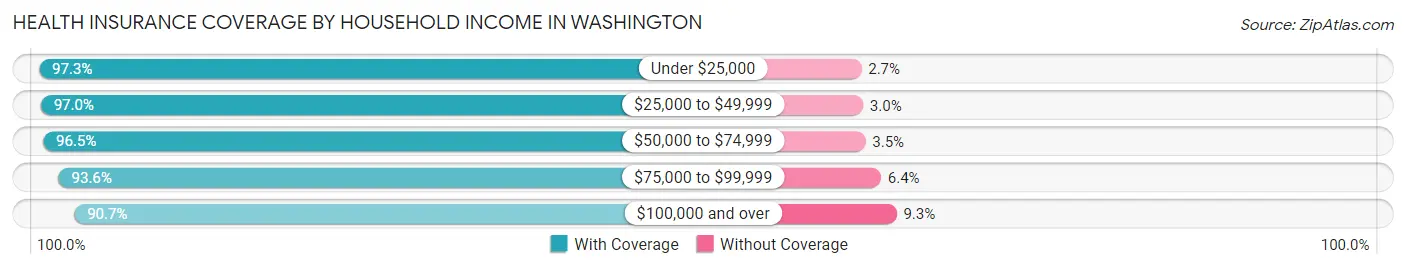
| Household Income | With Coverage | Without Coverage |
| Under $25,000 | 1,938 (97.3%) | 54 (2.7%) |
| $25,000 to $49,999 | 2,731 (97.0%) | 85 (3.0%) |
| $50,000 to $74,999 | 2,309 (96.5%) | 83 (3.5%) |
| $75,000 to $99,999 | 1,760 (93.6%) | 120 (6.4%) |
| $100,000 and over | 2,322 (90.7%) | 238 (9.3%) |
Public vs Private Health Insurance Coverage by Age in Washington
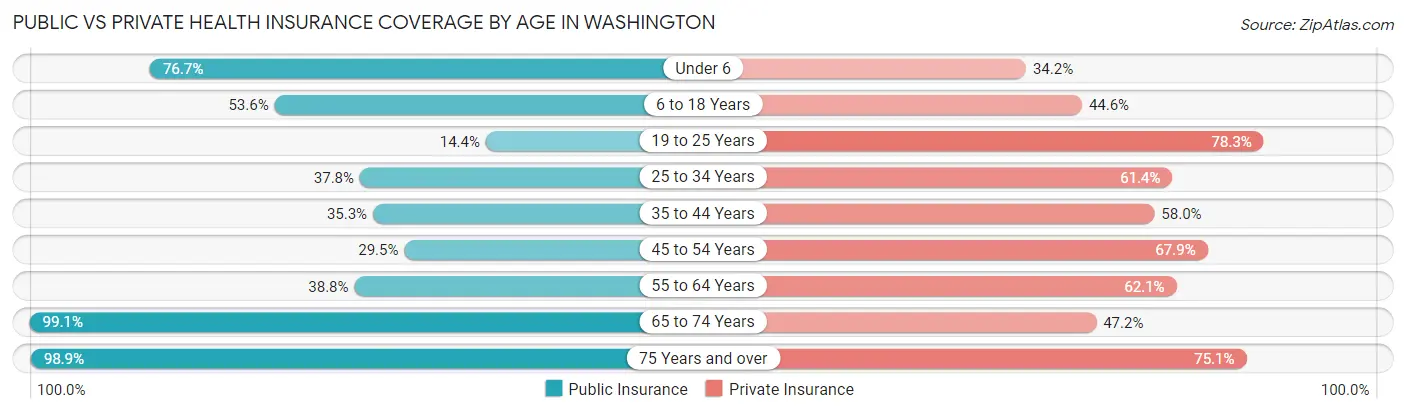
| Age Bracket | Public Insurance | Private Insurance |
| Under 6 | 626 (76.7%) | 279 (34.2%) |
| 6 to 18 Years | 896 (53.6%) | 745 (44.6%) |
| 19 to 25 Years | 300 (14.4%) | 1,631 (78.3%) |
| 25 to 34 Years | 559 (37.8%) | 908 (61.4%) |
| 35 to 44 Years | 453 (35.3%) | 744 (58.0%) |
| 45 to 54 Years | 565 (29.5%) | 1,299 (67.9%) |
| 55 to 64 Years | 687 (38.8%) | 1,100 (62.1%) |
| 65 to 74 Years | 1,271 (99.1%) | 606 (47.2%) |
| 75 Years and over | 686 (98.9%) | 521 (75.1%) |
| Total | 6,043 (46.5%) | 7,833 (60.3%) |
Disability Status by Sex by Age in Washington
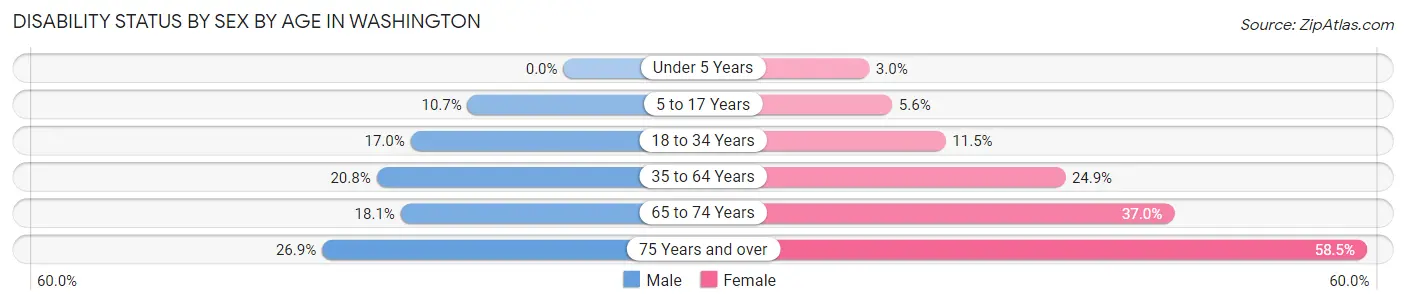
| Age Bracket | Male | Female |
| Under 5 Years | 0 (0.0%) | 10 (3.0%) |
| 5 to 17 Years | 73 (10.7%) | 45 (5.6%) |
| 18 to 34 Years | 390 (17.0%) | 179 (11.5%) |
| 35 to 64 Years | 481 (20.8%) | 660 (24.8%) |
| 65 to 74 Years | 112 (18.1%) | 246 (37.0%) |
| 75 Years and over | 50 (26.9%) | 297 (58.5%) |
Disability Class by Sex by Age in Washington
Disability Class: Hearing Difficulty
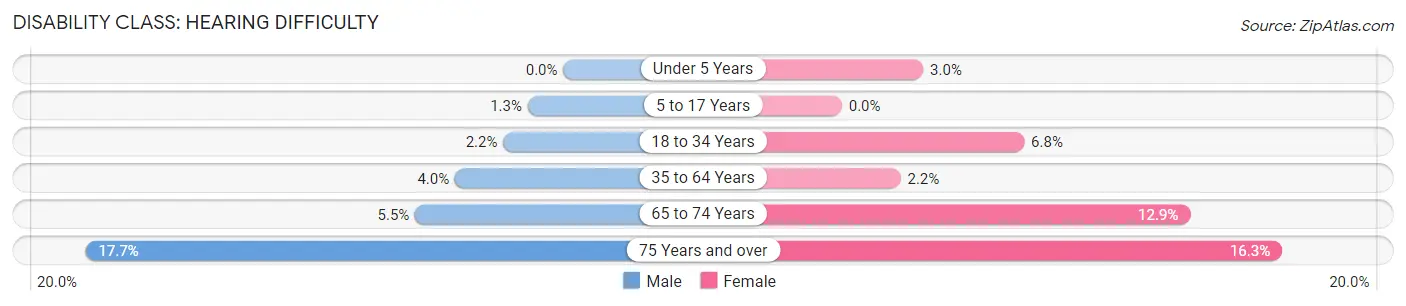
| Age Bracket | Male | Female |
| Under 5 Years | 0 (0.0%) | 10 (3.0%) |
| 5 to 17 Years | 9 (1.3%) | 0 (0.0%) |
| 18 to 34 Years | 51 (2.2%) | 105 (6.8%) |
| 35 to 64 Years | 93 (4.0%) | 58 (2.2%) |
| 65 to 74 Years | 34 (5.5%) | 86 (12.9%) |
| 75 Years and over | 33 (17.7%) | 83 (16.3%) |
Disability Class: Vision Difficulty
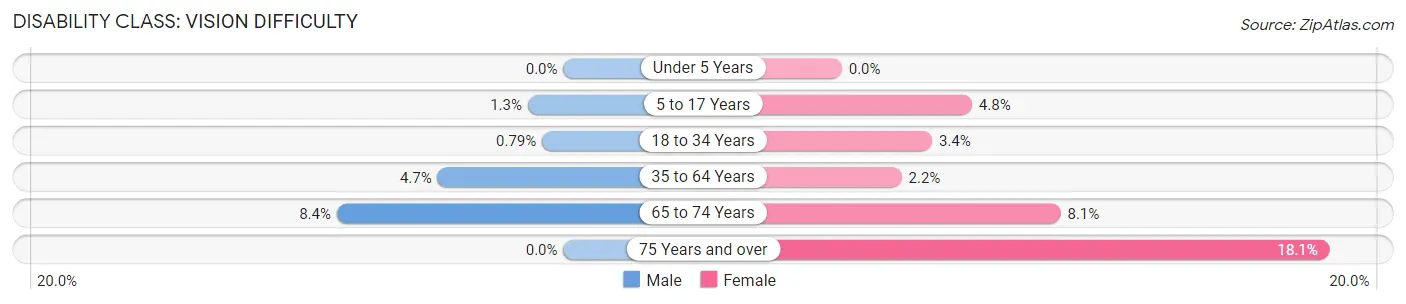
| Age Bracket | Male | Female |
| Under 5 Years | 0 (0.0%) | 0 (0.0%) |
| 5 to 17 Years | 9 (1.3%) | 39 (4.8%) |
| 18 to 34 Years | 18 (0.8%) | 52 (3.4%) |
| 35 to 64 Years | 108 (4.7%) | 59 (2.2%) |
| 65 to 74 Years | 52 (8.4%) | 54 (8.1%) |
| 75 Years and over | 0 (0.0%) | 92 (18.1%) |
Disability Class: Cognitive Difficulty
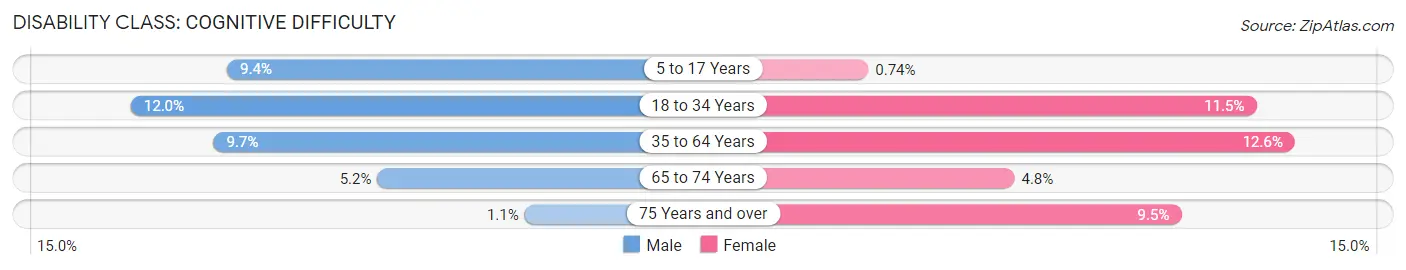
| Age Bracket | Male | Female |
| 5 to 17 Years | 64 (9.4%) | 6 (0.7%) |
| 18 to 34 Years | 276 (12.0%) | 179 (11.5%) |
| 35 to 64 Years | 225 (9.7%) | 335 (12.6%) |
| 65 to 74 Years | 32 (5.2%) | 32 (4.8%) |
| 75 Years and over | 2 (1.1%) | 48 (9.5%) |
Disability Class: Ambulatory Difficulty
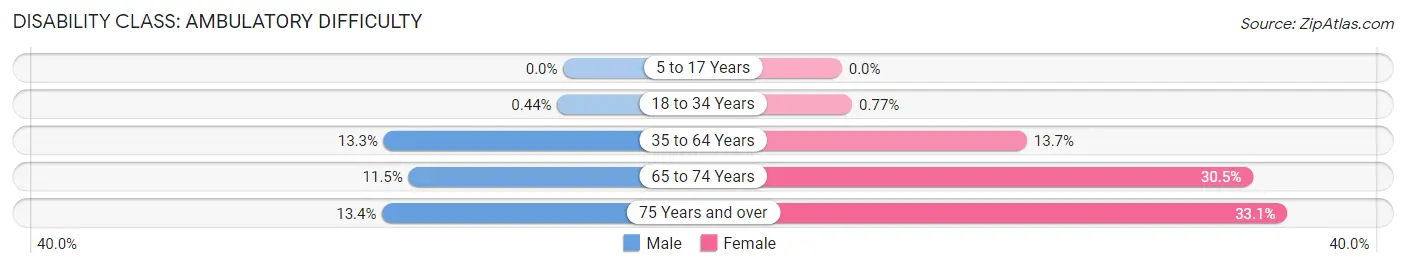
| Age Bracket | Male | Female |
| 5 to 17 Years | 0 (0.0%) | 0 (0.0%) |
| 18 to 34 Years | 10 (0.4%) | 12 (0.8%) |
| 35 to 64 Years | 308 (13.3%) | 365 (13.7%) |
| 65 to 74 Years | 71 (11.5%) | 203 (30.5%) |
| 75 Years and over | 25 (13.4%) | 168 (33.1%) |
Disability Class: Self-Care Difficulty
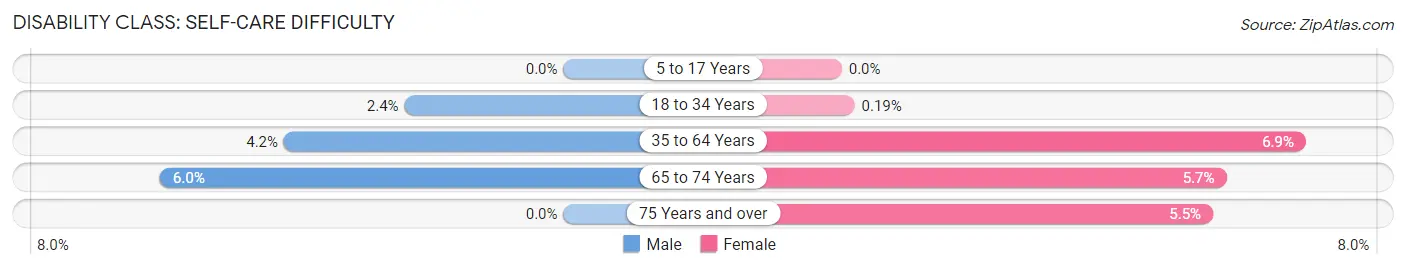
| Age Bracket | Male | Female |
| 5 to 17 Years | 0 (0.0%) | 0 (0.0%) |
| 18 to 34 Years | 54 (2.4%) | 3 (0.2%) |
| 35 to 64 Years | 96 (4.2%) | 183 (6.9%) |
| 65 to 74 Years | 37 (6.0%) | 38 (5.7%) |
| 75 Years and over | 0 (0.0%) | 28 (5.5%) |
Technology Access in Washington
Computing Device Access in Washington
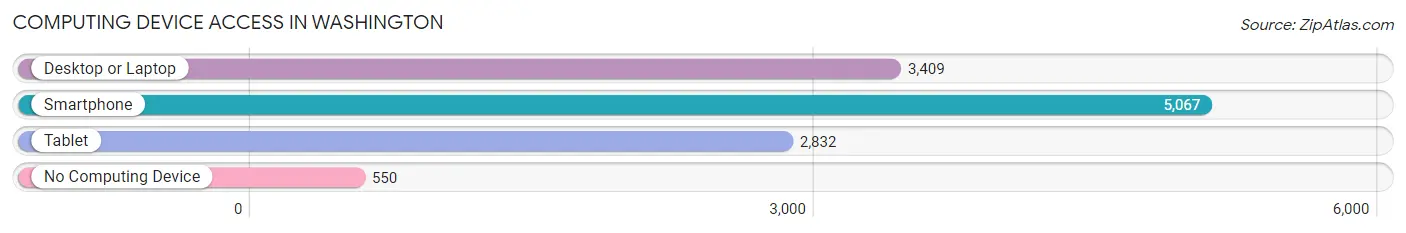
| Device Type | # Households | % Households |
| Desktop or Laptop | 3,409 | 57.8% |
| Smartphone | 5,067 | 85.9% |
| Tablet | 2,832 | 48.0% |
| No Computing Device | 550 | 9.3% |
| Total | 5,896 | 100.0% |
Internet Access in Washington
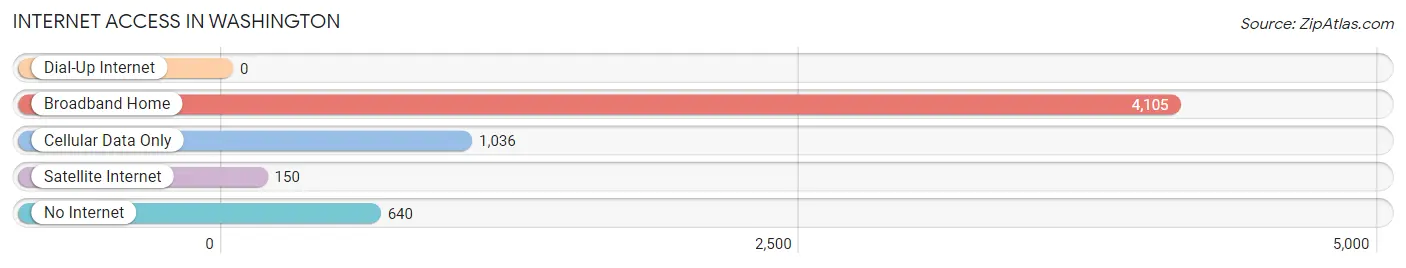
| Internet Type | # Households | % Households |
| Dial-Up Internet | 0 | 0.0% |
| Broadband Home | 4,105 | 69.6% |
| Cellular Data Only | 1,036 | 17.6% |
| Satellite Internet | 150 | 2.5% |
| No Internet | 640 | 10.8% |
| Total | 5,896 | 100.0% |
Washington Summary
Washington, Pennsylvania is a city located in the southwestern corner of the state, about 25 miles south of Pittsburgh. It is the county seat of Washington County and is part of the Pittsburgh metropolitan area. The city has a population of approximately 13,663 people, according to the 2010 census.
History
Washington, Pennsylvania was founded in 1781 by William Crawford, a Revolutionary War veteran. The city was named after George Washington, the first president of the United States. The city was incorporated in 1810 and was the first county seat of Washington County.
The city was an important center of industry during the 19th century. It was home to several iron and steel mills, as well as a glass factory. The city was also a major hub for the Pennsylvania Canal, which connected the city to Pittsburgh and other cities in the region.
The city was also an important center of the Underground Railroad, with several safe houses located in the city. During the Civil War, the city was a major supply center for the Union Army.
Geography
Washington, Pennsylvania is located in the southwestern corner of the state, about 25 miles south of Pittsburgh. The city is situated on the banks of the Monongahela River and is surrounded by rolling hills and forests. The city has a total area of 4.2 square miles, all of which is land.
The city has a humid continental climate, with hot summers and cold winters. The average annual temperature is around 50 degrees Fahrenheit. The average annual precipitation is around 40 inches.
Economy
Washington, Pennsylvania is a major center of industry and commerce in the region. The city is home to several large companies, including a steel mill, a glass factory, and a paper mill. The city is also home to several smaller businesses, including restaurants, retail stores, and professional services.
The city is also home to several educational institutions, including Washington & Jefferson College and the Washington County Career and Technology Center.
Demographics
According to the 2010 census, the population of Washington, Pennsylvania was 13,663. The racial makeup of the city was 91.3% White, 4.7% African American, 0.3% Native American, 0.7% Asian, 0.1% Pacific Islander, and 2.9% from other races. Hispanic or Latino of any race were 2.3% of the population.
The median household income in the city was $37,945, and the median family income was $45,945. The per capita income was $20,845. About 14.3% of the population was below the poverty line.
Common Questions
What is Per Capita Income in Washington?
Per Capita income in Washington is $27,628.
What is the Median Family Income in Washington?
Median Family Income in Washington is $65,500.
What is the Median Household income in Washington?
Median Household Income in Washington is $50,548.
What is Income or Wage Gap in Washington?
Income or Wage Gap in Washington is 19.8%.
Women in Washington earn 80.2 cents for every dollar earned by a man.
What is Inequality or Gini Index in Washington?
Inequality or Gini Index in Washington is 0.40.
What is the Total Population of Washington?
Total Population of Washington is 13,358.
What is the Total Male Population of Washington?
Total Male Population of Washington is 6,763.
What is the Total Female Population of Washington?
Total Female Population of Washington is 6,595.
What is the Ratio of Males per 100 Females in Washington?
There are 102.55 Males per 100 Females in Washington.
What is the Ratio of Females per 100 Males in Washington?
There are 97.52 Females per 100 Males in Washington.
What is the Median Population Age in Washington?
Median Population Age in Washington is 37.7 Years.
What is the Average Family Size in Washington
Average Family Size in Washington is 2.9 People.
What is the Average Household Size in Washington
Average Household Size in Washington is 2.0 People.
How Large is the Labor Force in Washington?
There are 7,219 People in the Labor Forcein in Washington.
What is the Percentage of People in the Labor Force in Washington?
63.2% of People are in the Labor Force in Washington.
What is the Unemployment Rate in Washington?
Unemployment Rate in Washington is 8.5%.