Sunbury, PA Map & Demographics
Sunbury Map
Sunbury Overview
$24,586
PER CAPITA INCOME
$54,619
AVG FAMILY INCOME
$42,238
AVG HOUSEHOLD INCOME
24.9%
WAGE / INCOME GAP [ % ]
75.1¢/ $1
WAGE / INCOME GAP [ $ ]
$8,834
FAMILY INCOME DEFICIT
0.45
INEQUALITY / GINI INDEX
9,680
TOTAL POPULATION
4,323
MALE POPULATION
5,357
FEMALE POPULATION
80.70
MALES / 100 FEMALES
123.92
FEMALES / 100 MALES
40.4
MEDIAN AGE
2.8
AVG FAMILY SIZE
2.3
AVG HOUSEHOLD SIZE
4,437
LABOR FORCE [ PEOPLE ]
57.4%
PERCENT IN LABOR FORCE
5.5%
UNEMPLOYMENT RATE
Sunbury Zip Codes
Sunbury Area Codes
Income in Sunbury
Income Overview in Sunbury
Per Capita Income in Sunbury is $24,586, while median incomes of families and households are $54,619 and $42,238 respectively.
| Characteristic | Number | Measure |
| Per Capita Income | 9,680 | $24,586 |
| Median Family Income | 2,554 | $54,619 |
| Mean Family Income | 2,554 | $69,500 |
| Median Household Income | 4,160 | $42,238 |
| Mean Household Income | 4,160 | $56,639 |
| Income Deficit | 2,554 | $8,834 |
| Wage / Income Gap (%) | 9,680 | 24.93% |
| Wage / Income Gap ($) | 9,680 | 75.07¢ per $1 |
| Gini / Inequality Index | 9,680 | 0.45 |
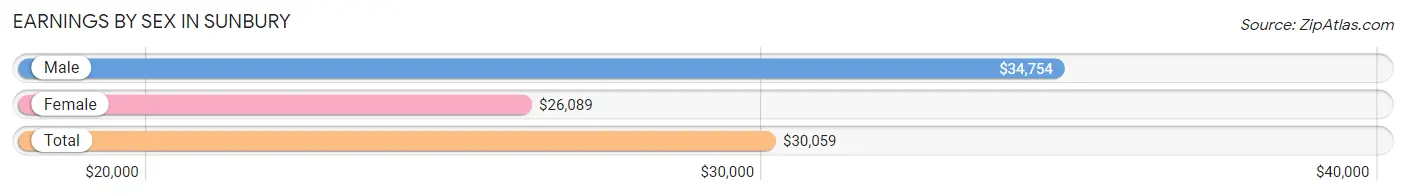
Earnings by Sex in Sunbury
Average Earnings in Sunbury are $30,059, $34,754 for men and $26,089 for women, a difference of 24.9%.
| Sex | Number | Average Earnings |
| Male | 2,129 (47.3%) | $34,754 |
| Female | 2,368 (52.7%) | $26,089 |
| Total | 4,497 (100.0%) | $30,059 |
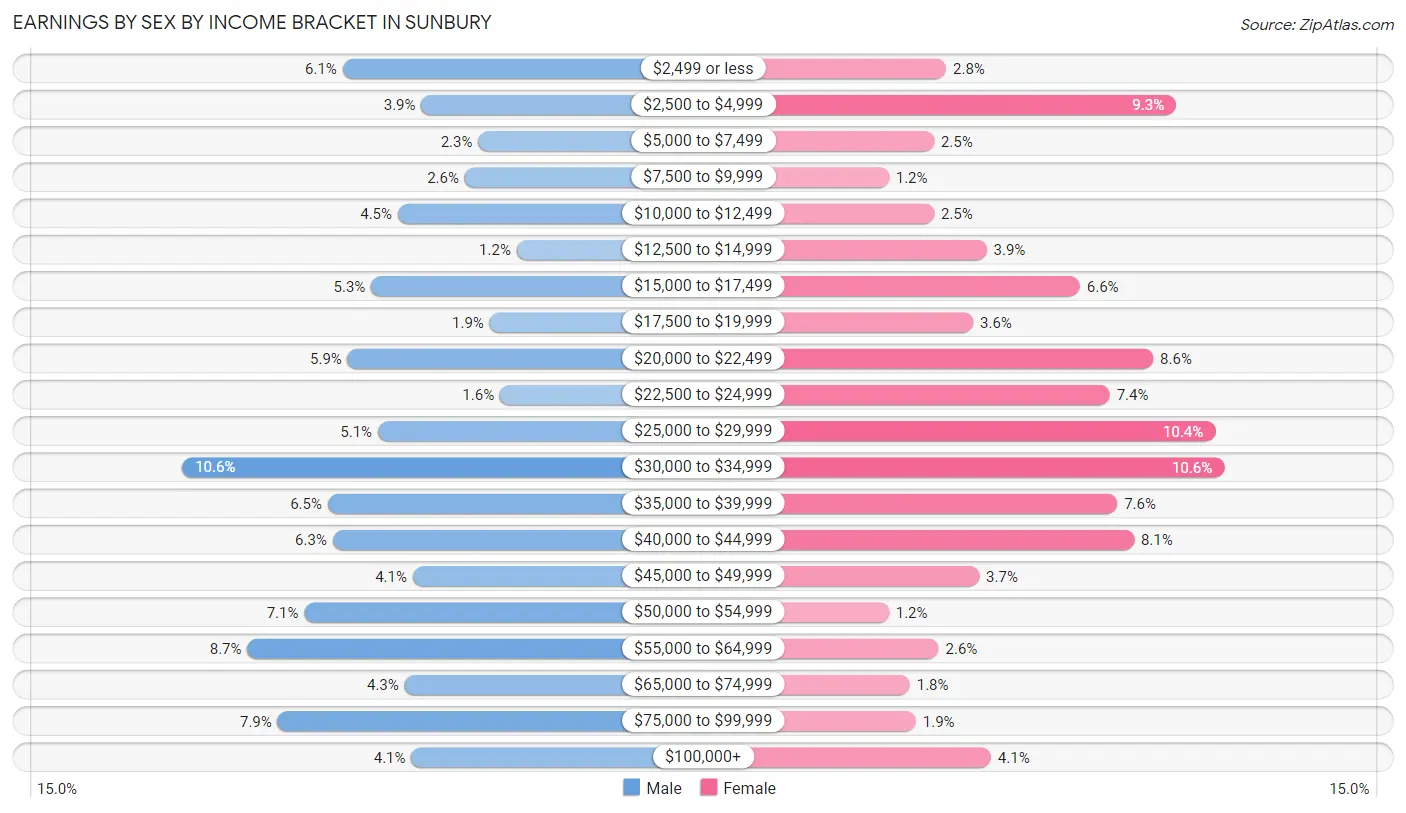
Earnings by Sex by Income Bracket in Sunbury
The most common earnings brackets in Sunbury are $30,000 to $34,999 for men (225 | 10.6%) and $30,000 to $34,999 for women (251 | 10.6%).
| Income | Male | Female |
| $2,499 or less | 129 (6.1%) | 66 (2.8%) |
| $2,500 to $4,999 | 82 (3.8%) | 219 (9.2%) |
| $5,000 to $7,499 | 48 (2.2%) | 58 (2.5%) |
| $7,500 to $9,999 | 56 (2.6%) | 28 (1.2%) |
| $10,000 to $12,499 | 96 (4.5%) | 58 (2.5%) |
| $12,500 to $14,999 | 25 (1.2%) | 93 (3.9%) |
| $15,000 to $17,499 | 112 (5.3%) | 155 (6.6%) |
| $17,500 to $19,999 | 41 (1.9%) | 84 (3.5%) |
| $20,000 to $22,499 | 126 (5.9%) | 204 (8.6%) |
| $22,500 to $24,999 | 35 (1.6%) | 175 (7.4%) |
| $25,000 to $29,999 | 108 (5.1%) | 245 (10.3%) |
| $30,000 to $34,999 | 225 (10.6%) | 251 (10.6%) |
| $35,000 to $39,999 | 138 (6.5%) | 180 (7.6%) |
| $40,000 to $44,999 | 135 (6.3%) | 191 (8.1%) |
| $45,000 to $49,999 | 87 (4.1%) | 88 (3.7%) |
| $50,000 to $54,999 | 152 (7.1%) | 28 (1.2%) |
| $55,000 to $64,999 | 186 (8.7%) | 61 (2.6%) |
| $65,000 to $74,999 | 92 (4.3%) | 42 (1.8%) |
| $75,000 to $99,999 | 168 (7.9%) | 46 (1.9%) |
| $100,000+ | 88 (4.1%) | 96 (4.1%) |
| Total | 2,129 (100.0%) | 2,368 (100.0%) |
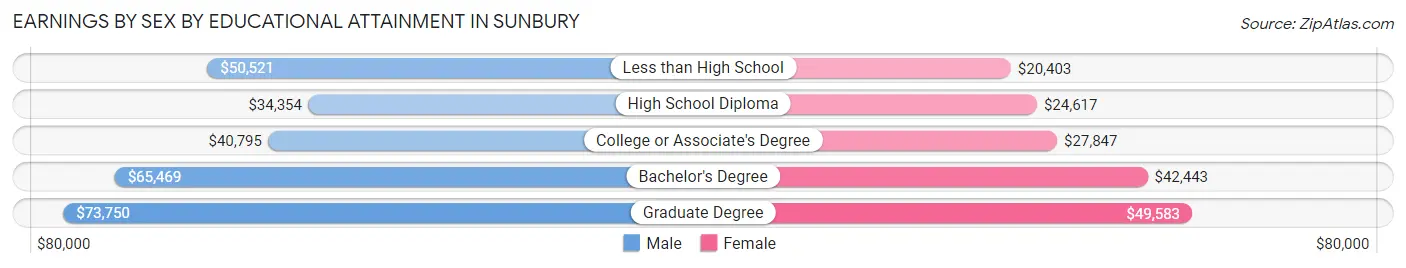
Earnings by Sex by Educational Attainment in Sunbury
Average earnings in Sunbury are $38,443 for men and $28,336 for women, a difference of 26.3%. Men with an educational attainment of graduate degree enjoy the highest average annual earnings of $73,750, while those with high school diploma education earn the least with $34,354. Women with an educational attainment of graduate degree earn the most with the average annual earnings of $49,583, while those with less than high school education have the smallest earnings of $20,403.
| Educational Attainment | Male Income | Female Income |
| Less than High School | $50,521 | $20,403 |
| High School Diploma | $34,354 | $24,617 |
| College or Associate's Degree | $40,795 | $27,847 |
| Bachelor's Degree | $65,469 | $42,443 |
| Graduate Degree | $73,750 | $49,583 |
| Total | $38,443 | $28,336 |
Family Income in Sunbury
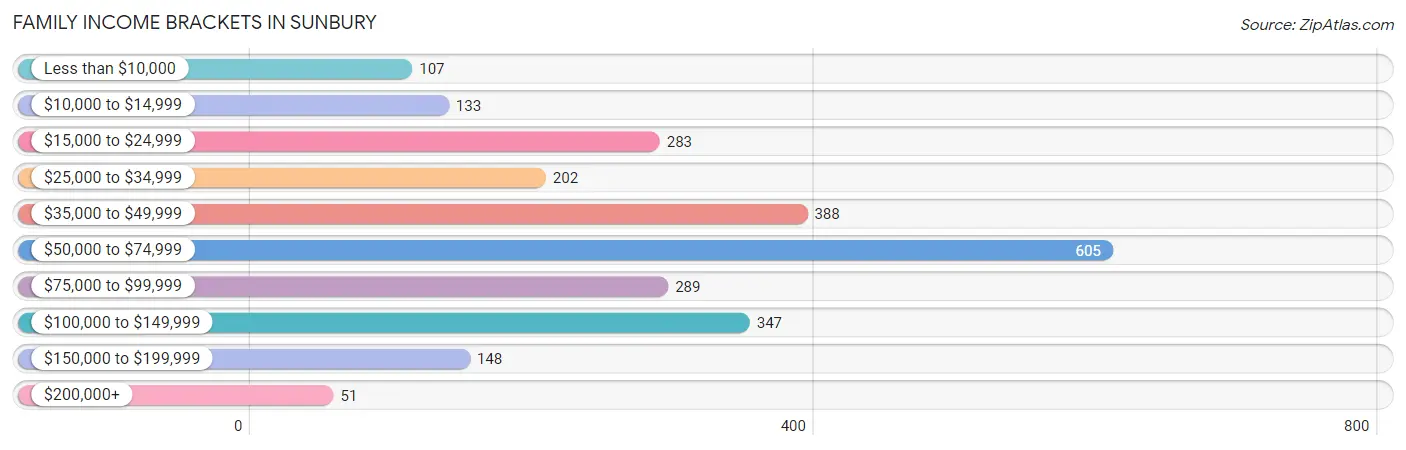
Family Income Brackets in Sunbury
According to the Sunbury family income data, there are 605 families falling into the $50,000 to $74,999 income range, which is the most common income bracket and makes up 23.7% of all families. Conversely, the $200,000+ income bracket is the least frequent group with only 51 families (2.0%) belonging to this category.
| Income Bracket | # Families | % Families |
| Less than $10,000 | 107 | 4.2% |
| $10,000 to $14,999 | 133 | 5.2% |
| $15,000 to $24,999 | 283 | 11.1% |
| $25,000 to $34,999 | 202 | 7.9% |
| $35,000 to $49,999 | 388 | 15.2% |
| $50,000 to $74,999 | 605 | 23.7% |
| $75,000 to $99,999 | 289 | 11.3% |
| $100,000 to $149,999 | 347 | 13.6% |
| $150,000 to $199,999 | 148 | 5.8% |
| $200,000+ | 51 | 2.0% |
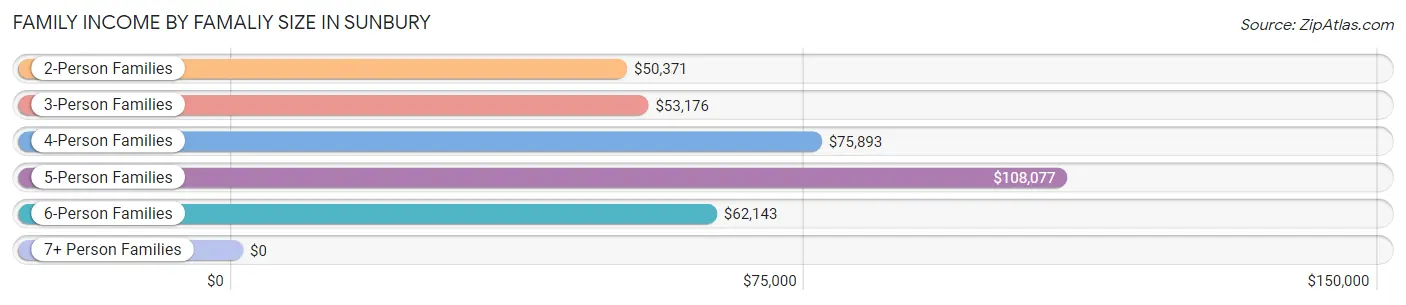
Family Income by Famaliy Size in Sunbury
5-person families (62 | 2.4%) account for the highest median family income in Sunbury with $108,077 per family, while 2-person families (1,428 | 55.9%) have the highest median income of $25,186 per family member.
| Income Bracket | # Families | Median Income |
| 2-Person Families | 1,428 (55.9%) | $50,371 |
| 3-Person Families | 610 (23.9%) | $53,176 |
| 4-Person Families | 348 (13.6%) | $75,893 |
| 5-Person Families | 62 (2.4%) | $108,077 |
| 6-Person Families | 76 (3.0%) | $62,143 |
| 7+ Person Families | 30 (1.2%) | $0 |
| Total | 2,554 (100.0%) | $54,619 |
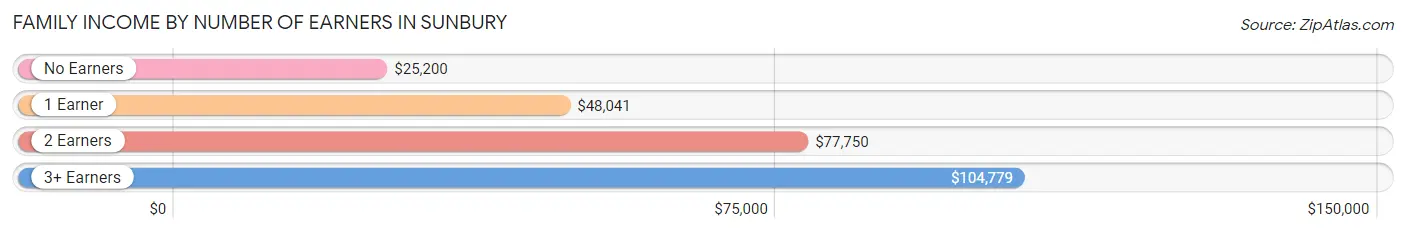
Family Income by Number of Earners in Sunbury
The median family income in Sunbury is $54,619, with families comprising 3+ earners (297) having the highest median family income of $104,779, while families with no earners (526) have the lowest median family income of $25,200, accounting for 11.6% and 20.6% of families, respectively.
| Number of Earners | # Families | Median Income |
| No Earners | 526 (20.6%) | $25,200 |
| 1 Earner | 1,018 (39.9%) | $48,041 |
| 2 Earners | 713 (27.9%) | $77,750 |
| 3+ Earners | 297 (11.6%) | $104,779 |
| Total | 2,554 (100.0%) | $54,619 |
Household Income in Sunbury
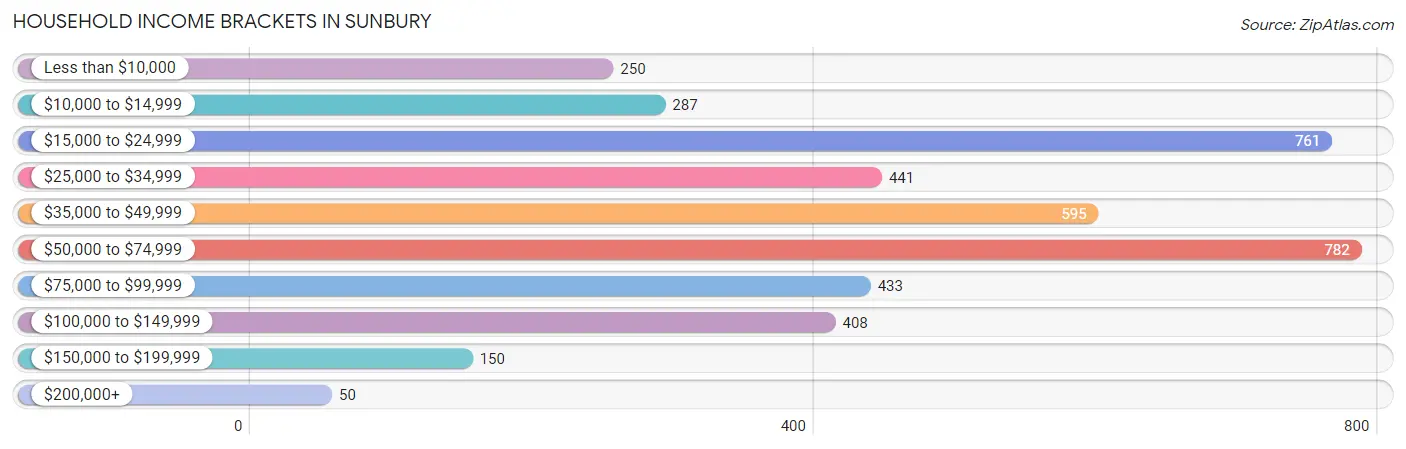
Household Income Brackets in Sunbury
With 782 households falling in the category, the $50,000 to $74,999 income range is the most frequent in Sunbury, accounting for 18.8% of all households. In contrast, only 50 households (1.2%) fall into the $200,000+ income bracket, making it the least populous group.
| Income Bracket | # Households | % Households |
| Less than $10,000 | 250 | 6.0% |
| $10,000 to $14,999 | 287 | 6.9% |
| $15,000 to $24,999 | 761 | 18.3% |
| $25,000 to $34,999 | 441 | 10.6% |
| $35,000 to $49,999 | 595 | 14.3% |
| $50,000 to $74,999 | 782 | 18.8% |
| $75,000 to $99,999 | 433 | 10.4% |
| $100,000 to $149,999 | 408 | 9.8% |
| $150,000 to $199,999 | 150 | 3.6% |
| $200,000+ | 50 | 1.2% |
Household Income by Householder Age in Sunbury
The median household income in Sunbury is $42,238, with the highest median household income of $54,356 found in the 45 to 64 years age bracket for the primary householder. A total of 1,489 households (35.8%) fall into this category. Meanwhile, the 65+ years age bracket for the primary householder has the lowest median household income of $22,446, with 1,331 households (32.0%) in this group.
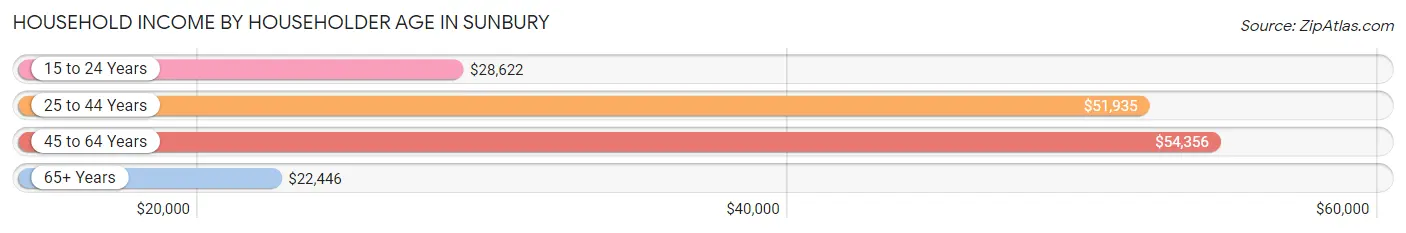
| Income Bracket | # Households | Median Income |
| 15 to 24 Years | 232 (5.6%) | $28,622 |
| 25 to 44 Years | 1,108 (26.6%) | $51,935 |
| 45 to 64 Years | 1,489 (35.8%) | $54,356 |
| 65+ Years | 1,331 (32.0%) | $22,446 |
| Total | 4,160 (100.0%) | $42,238 |
Poverty in Sunbury
Income Below Poverty by Sex and Age in Sunbury
With 20.1% poverty level for males and 18.6% for females among the residents of Sunbury, under 5 year old males and 25 to 34 year old females are the most vulnerable to poverty, with 141 males (45.8%) and 196 females (29.4%) in their respective age groups living below the poverty level.
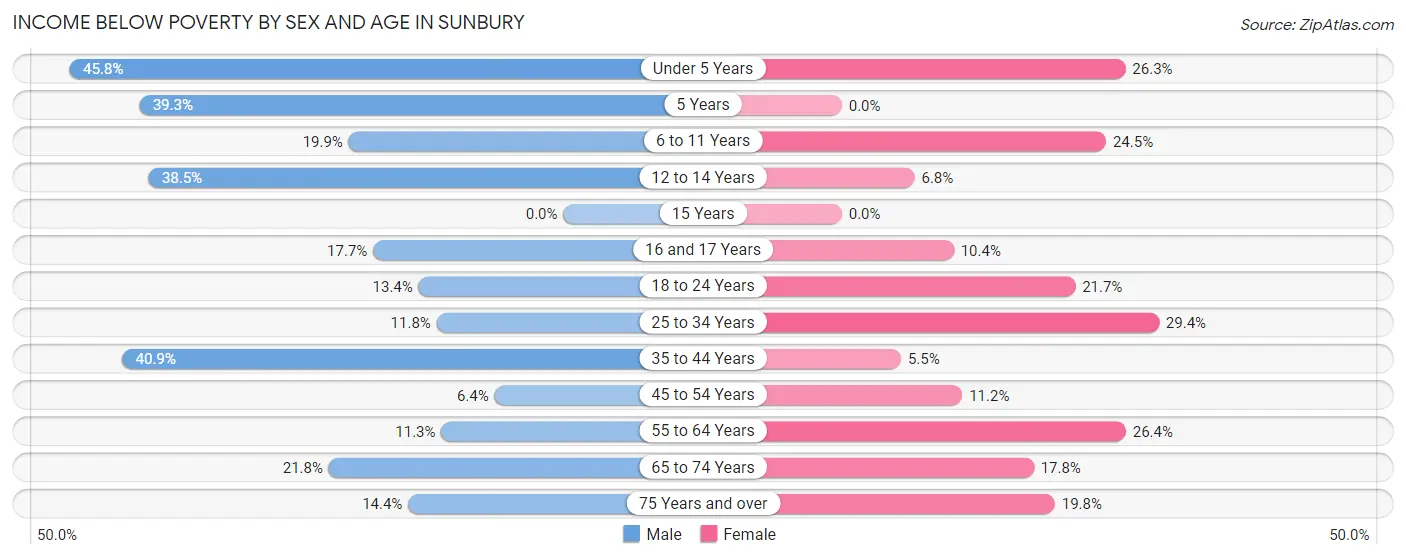
| Age Bracket | Male | Female |
| Under 5 Years | 141 (45.8%) | 45 (26.3%) |
| 5 Years | 57 (39.3%) | 0 (0.0%) |
| 6 to 11 Years | 52 (19.9%) | 89 (24.5%) |
| 12 to 14 Years | 60 (38.5%) | 11 (6.8%) |
| 15 Years | 0 (0.0%) | 0 (0.0%) |
| 16 and 17 Years | 9 (17.6%) | 16 (10.4%) |
| 18 to 24 Years | 54 (13.4%) | 120 (21.7%) |
| 25 to 34 Years | 72 (11.8%) | 196 (29.4%) |
| 35 to 44 Years | 155 (40.9%) | 25 (5.5%) |
| 45 to 54 Years | 33 (6.4%) | 73 (11.2%) |
| 55 to 64 Years | 61 (11.3%) | 184 (26.4%) |
| 65 to 74 Years | 123 (21.8%) | 91 (17.8%) |
| 75 Years and over | 37 (14.4%) | 104 (19.8%) |
| Total | 854 (20.1%) | 954 (18.6%) |
Income Above Poverty by Sex and Age in Sunbury
According to the poverty statistics in Sunbury, males aged 15 years and females aged 5 years are the age groups that are most secure financially, with 100.0% of males and 100.0% of females in these age groups living above the poverty line.
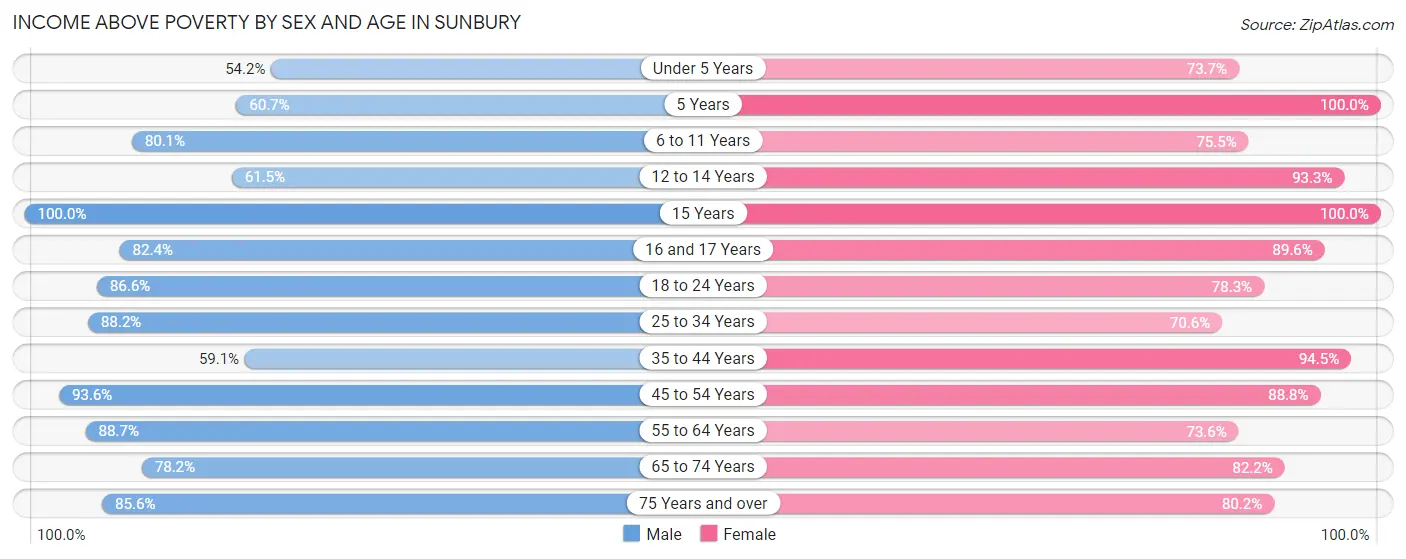
| Age Bracket | Male | Female |
| Under 5 Years | 167 (54.2%) | 126 (73.7%) |
| 5 Years | 88 (60.7%) | 199 (100.0%) |
| 6 to 11 Years | 209 (80.1%) | 274 (75.5%) |
| 12 to 14 Years | 96 (61.5%) | 152 (93.2%) |
| 15 Years | 51 (100.0%) | 16 (100.0%) |
| 16 and 17 Years | 42 (82.4%) | 138 (89.6%) |
| 18 to 24 Years | 348 (86.6%) | 434 (78.3%) |
| 25 to 34 Years | 540 (88.2%) | 470 (70.6%) |
| 35 to 44 Years | 224 (59.1%) | 430 (94.5%) |
| 45 to 54 Years | 484 (93.6%) | 580 (88.8%) |
| 55 to 64 Years | 478 (88.7%) | 514 (73.6%) |
| 65 to 74 Years | 442 (78.2%) | 420 (82.2%) |
| 75 Years and over | 220 (85.6%) | 422 (80.2%) |
| Total | 3,389 (79.9%) | 4,175 (81.4%) |
Income Below Poverty Among Married-Couple Families in Sunbury
The poverty statistics for married-couple families in Sunbury show that 2.5% or 32 of the total 1,285 families live below the poverty line. Families with 1 or 2 children have the highest poverty rate of 3.2%, comprising of 9 families. On the other hand, families with 3 or 4 children have the lowest poverty rate of 0.0%, which includes 0 families.
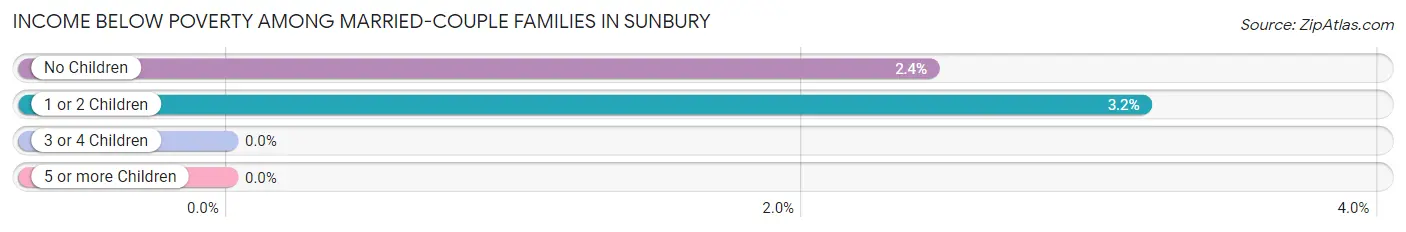
| Children | Above Poverty | Below Poverty |
| No Children | 918 (97.6%) | 23 (2.4%) |
| 1 or 2 Children | 274 (96.8%) | 9 (3.2%) |
| 3 or 4 Children | 51 (100.0%) | 0 (0.0%) |
| 5 or more Children | 10 (100.0%) | 0 (0.0%) |
| Total | 1,253 (97.5%) | 32 (2.5%) |
Income Below Poverty Among Single-Parent Households in Sunbury
According to the poverty data in Sunbury, 51.7% or 152 single-father households and 25.6% or 250 single-mother households are living below the poverty line. Among single-father households, those with 5 or more children have the highest poverty rate, with 11 households (100.0%) experiencing poverty. Likewise, among single-mother households, those with 3 or 4 children have the highest poverty rate, with 84 households (69.4%) falling below the poverty line.
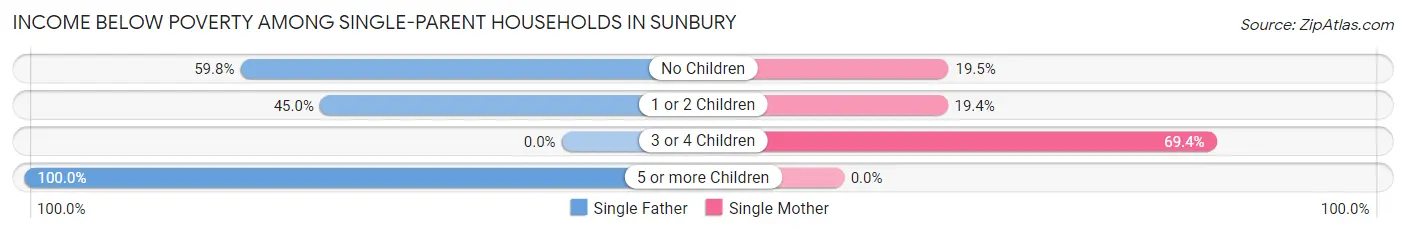
| Children | Single Father | Single Mother |
| No Children | 73 (59.8%) | 77 (19.5%) |
| 1 or 2 Children | 68 (45.0%) | 89 (19.4%) |
| 3 or 4 Children | 0 (0.0%) | 84 (69.4%) |
| 5 or more Children | 11 (100.0%) | 0 (0.0%) |
| Total | 152 (51.7%) | 250 (25.6%) |
Income Below Poverty Among Married-Couple vs Single-Parent Households in Sunbury
The poverty data for Sunbury shows that 32 of the married-couple family households (2.5%) and 402 of the single-parent households (31.7%) are living below the poverty level. Within the married-couple family households, those with 1 or 2 children have the highest poverty rate, with 9 households (3.2%) falling below the poverty line. Among the single-parent households, those with 5 or more children have the highest poverty rate, with 11 household (100.0%) living below poverty.
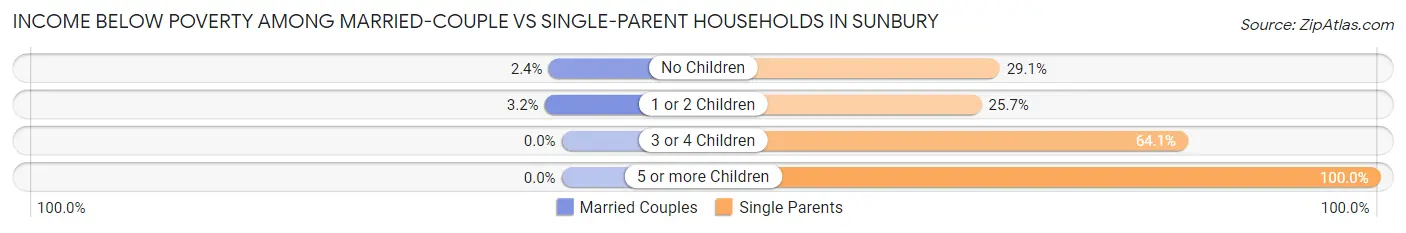
| Children | Married-Couple Families | Single-Parent Households |
| No Children | 23 (2.4%) | 150 (29.1%) |
| 1 or 2 Children | 9 (3.2%) | 157 (25.7%) |
| 3 or 4 Children | 0 (0.0%) | 84 (64.1%) |
| 5 or more Children | 0 (0.0%) | 11 (100.0%) |
| Total | 32 (2.5%) | 402 (31.7%) |
Race in Sunbury
The most populous races in Sunbury are White / Caucasian (8,510 | 87.9%), Hispanic or Latino (881 | 9.1%), and Some other Race (521 | 5.4%).
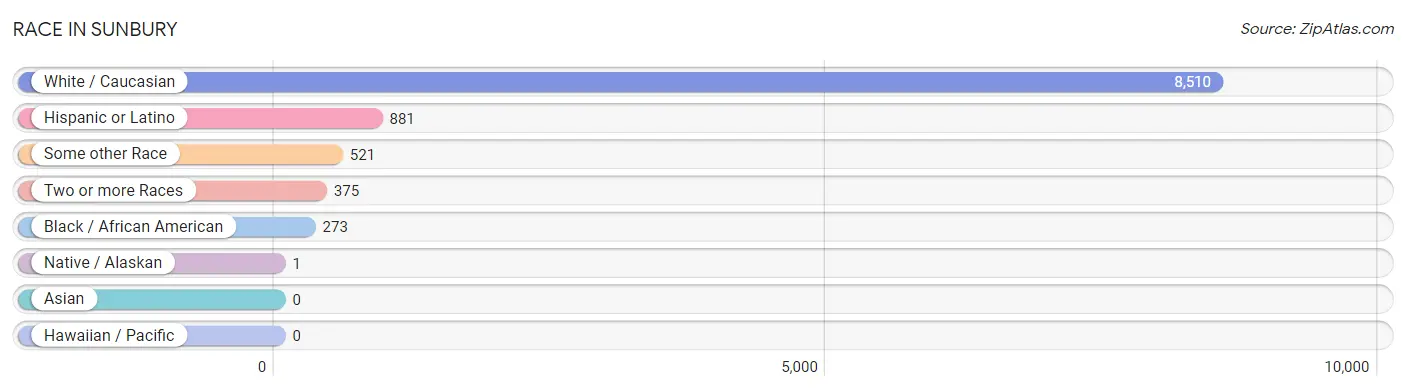
| Race | # Population | % Population |
| Asian | 0 | 0.0% |
| Black / African American | 273 | 2.8% |
| Hawaiian / Pacific | 0 | 0.0% |
| Hispanic or Latino | 881 | 9.1% |
| Native / Alaskan | 1 | 0.0% |
| White / Caucasian | 8,510 | 87.9% |
| Two or more Races | 375 | 3.9% |
| Some other Race | 521 | 5.4% |
| Total | 9,680 | 100.0% |
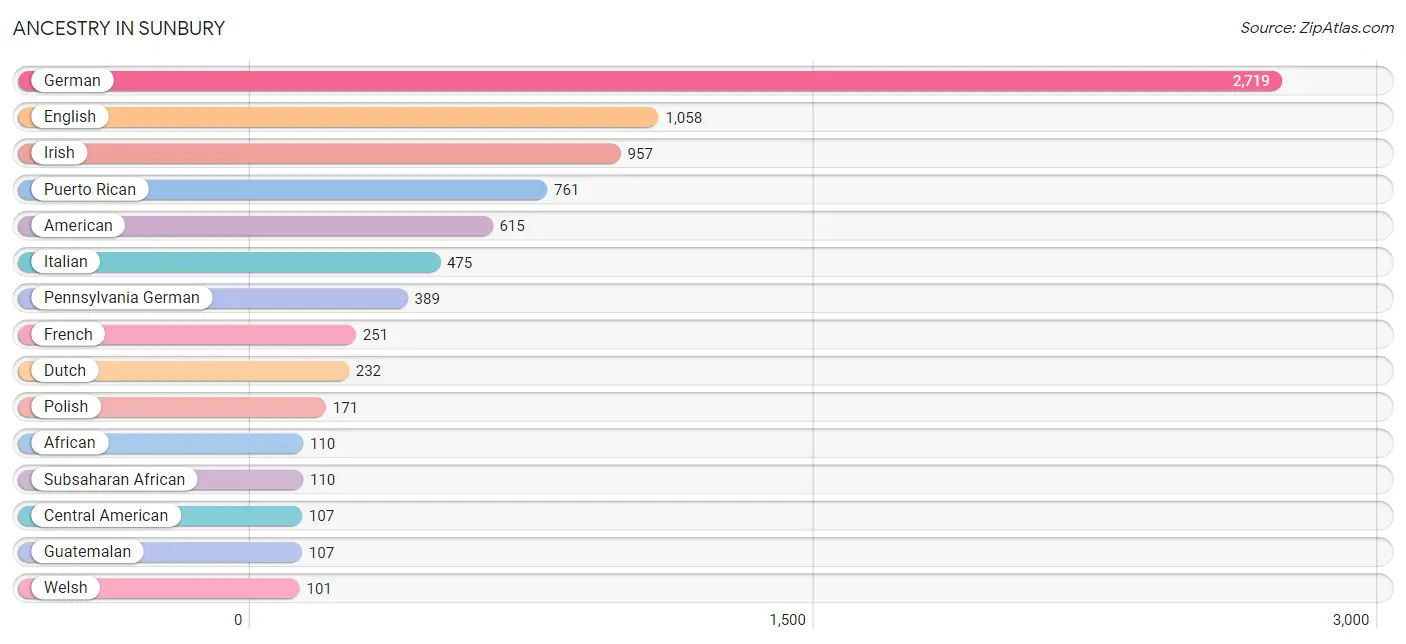
Ancestry in Sunbury
The most populous ancestries reported in Sunbury are German (2,719 | 28.1%), English (1,058 | 10.9%), Irish (957 | 9.9%), Puerto Rican (761 | 7.9%), and American (615 | 6.4%), together accounting for 63.1% of all Sunbury residents.
| Ancestry | # Population | % Population |
| African | 110 | 1.1% |
| American | 615 | 6.4% |
| Austrian | 8 | 0.1% |
| Blackfeet | 4 | 0.0% |
| British | 15 | 0.2% |
| Celtic | 10 | 0.1% |
| Central American | 107 | 1.1% |
| Cherokee | 7 | 0.1% |
| Comanche | 8 | 0.1% |
| Cuban | 4 | 0.0% |
| Danish | 46 | 0.5% |
| Dutch | 232 | 2.4% |
| Eastern European | 55 | 0.6% |
| English | 1,058 | 10.9% |
| European | 31 | 0.3% |
| French | 251 | 2.6% |
| French Canadian | 7 | 0.1% |
| German | 2,719 | 28.1% |
| Guatemalan | 107 | 1.1% |
| Indian (Asian) | 18 | 0.2% |
| Irish | 957 | 9.9% |
| Italian | 475 | 4.9% |
| Jamaican | 4 | 0.0% |
| Korean | 18 | 0.2% |
| Mexican | 9 | 0.1% |
| Norwegian | 10 | 0.1% |
| Pennsylvania German | 389 | 4.0% |
| Polish | 171 | 1.8% |
| Portuguese | 13 | 0.1% |
| Puerto Rican | 761 | 7.9% |
| Scandinavian | 9 | 0.1% |
| Scotch-Irish | 24 | 0.3% |
| Scottish | 51 | 0.5% |
| Sioux | 6 | 0.1% |
| Subsaharan African | 110 | 1.1% |
| Swedish | 49 | 0.5% |
| Swiss | 8 | 0.1% |
| Ukrainian | 30 | 0.3% |
| Welsh | 101 | 1.0% | View All 39 Rows |
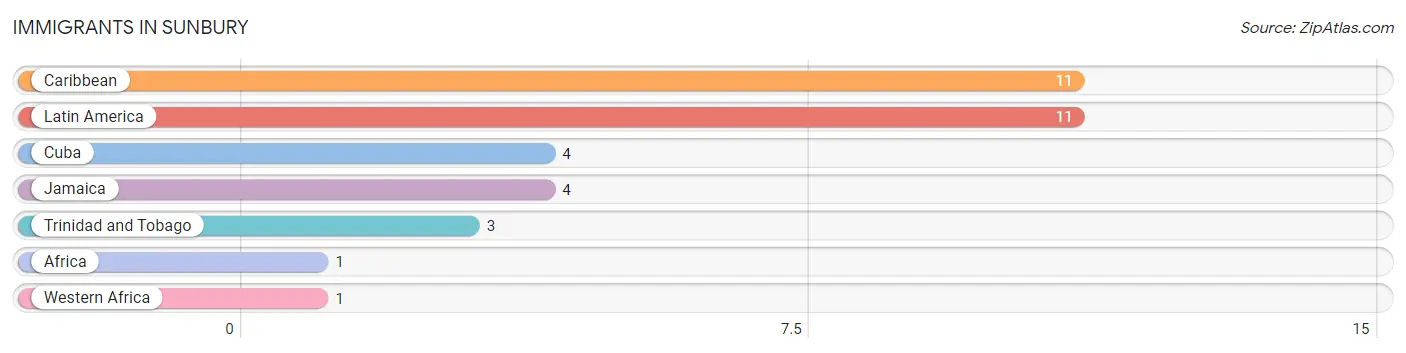
Immigrants in Sunbury
The most numerous immigrant groups reported in Sunbury came from Caribbean (11 | 0.1%), Latin America (11 | 0.1%), Cuba (4 | 0.0%), Jamaica (4 | 0.0%), and Trinidad and Tobago (3 | 0.0%), together accounting for 0.3% of all Sunbury residents.
| Immigration Origin | # Population | % Population |
| Africa | 1 | 0.0% |
| Caribbean | 11 | 0.1% |
| Cuba | 4 | 0.0% |
| Jamaica | 4 | 0.0% |
| Latin America | 11 | 0.1% |
| Trinidad and Tobago | 3 | 0.0% |
| Western Africa | 1 | 0.0% | View All 7 Rows |
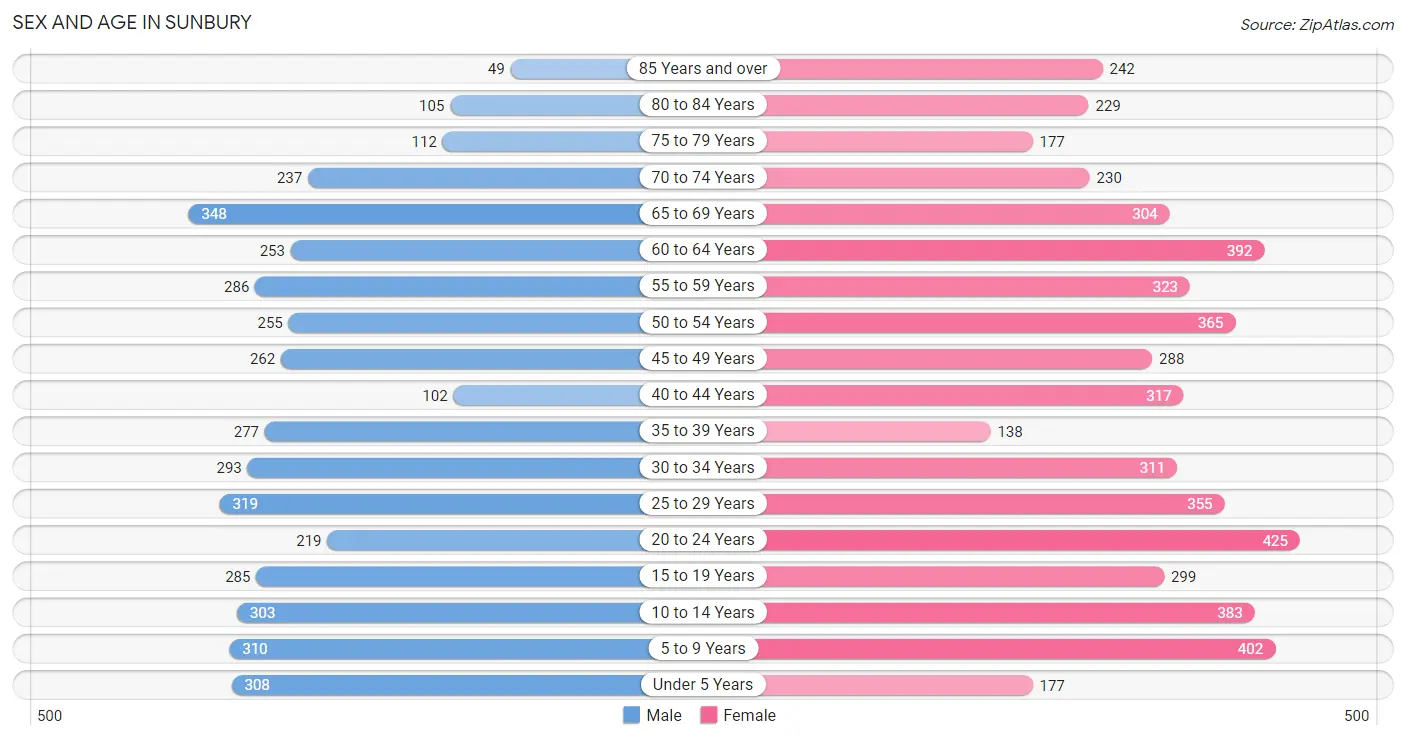
Sex and Age in Sunbury
Sex and Age in Sunbury
The most populous age groups in Sunbury are 65 to 69 Years (348 | 8.1%) for men and 20 to 24 Years (425 | 7.9%) for women.
| Age Bracket | Male | Female |
| Under 5 Years | 308 (7.1%) | 177 (3.3%) |
| 5 to 9 Years | 310 (7.2%) | 402 (7.5%) |
| 10 to 14 Years | 303 (7.0%) | 383 (7.1%) |
| 15 to 19 Years | 285 (6.6%) | 299 (5.6%) |
| 20 to 24 Years | 219 (5.1%) | 425 (7.9%) |
| 25 to 29 Years | 319 (7.4%) | 355 (6.6%) |
| 30 to 34 Years | 293 (6.8%) | 311 (5.8%) |
| 35 to 39 Years | 277 (6.4%) | 138 (2.6%) |
| 40 to 44 Years | 102 (2.4%) | 317 (5.9%) |
| 45 to 49 Years | 262 (6.1%) | 288 (5.4%) |
| 50 to 54 Years | 255 (5.9%) | 365 (6.8%) |
| 55 to 59 Years | 286 (6.6%) | 323 (6.0%) |
| 60 to 64 Years | 253 (5.9%) | 392 (7.3%) |
| 65 to 69 Years | 348 (8.1%) | 304 (5.7%) |
| 70 to 74 Years | 237 (5.5%) | 230 (4.3%) |
| 75 to 79 Years | 112 (2.6%) | 177 (3.3%) |
| 80 to 84 Years | 105 (2.4%) | 229 (4.3%) |
| 85 Years and over | 49 (1.1%) | 242 (4.5%) |
| Total | 4,323 (100.0%) | 5,357 (100.0%) |
Families and Households in Sunbury
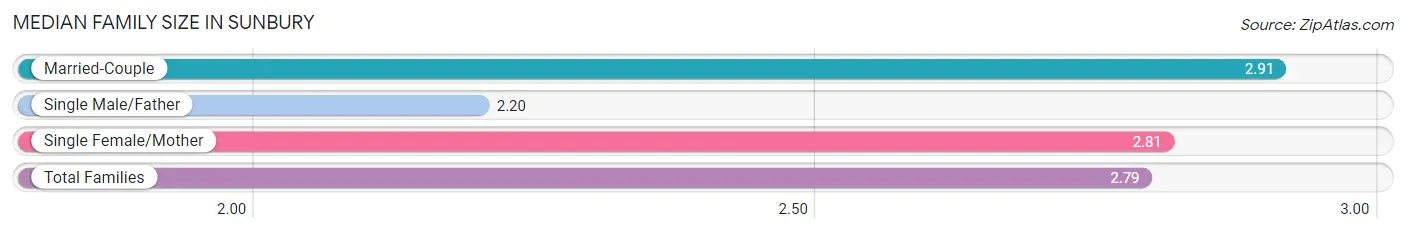
Median Family Size in Sunbury
The median family size in Sunbury is 2.79 persons per family, with married-couple families (1,285 | 50.3%) accounting for the largest median family size of 2.91 persons per family. On the other hand, single male/father families (294 | 11.5%) represent the smallest median family size with 2.20 persons per family.
| Family Type | # Families | Family Size |
| Married-Couple | 1,285 (50.3%) | 2.91 |
| Single Male/Father | 294 (11.5%) | 2.20 |
| Single Female/Mother | 975 (38.2%) | 2.81 |
| Total Families | 2,554 (100.0%) | 2.79 |
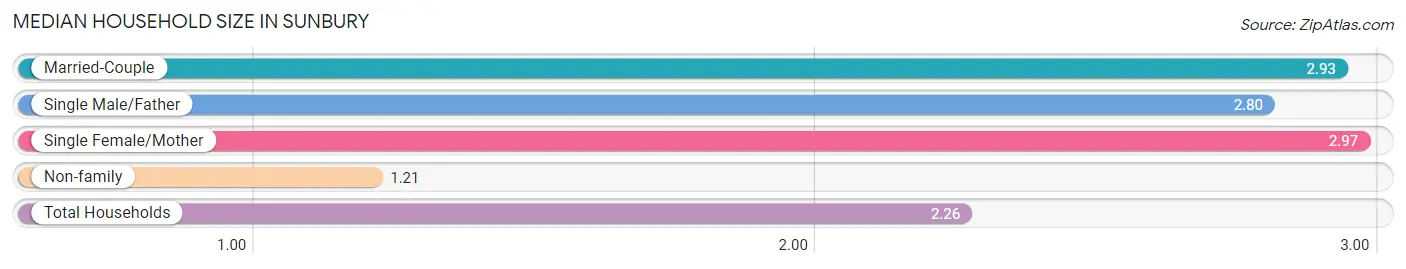
Median Household Size in Sunbury
The median household size in Sunbury is 2.26 persons per household, with single female/mother households (975 | 23.4%) accounting for the largest median household size of 2.97 persons per household. non-family households (1,606 | 38.6%) represent the smallest median household size with 1.21 persons per household.
| Household Type | # Households | Household Size |
| Married-Couple | 1,285 (30.9%) | 2.93 |
| Single Male/Father | 294 (7.1%) | 2.80 |
| Single Female/Mother | 975 (23.4%) | 2.97 |
| Non-family | 1,606 (38.6%) | 1.21 |
| Total Households | 4,160 (100.0%) | 2.26 |
Household Size by Marriage Status in Sunbury
Out of a total of 4,160 households in Sunbury, 2,554 (61.4%) are family households, while 1,606 (38.6%) are nonfamily households. The most numerous type of family households are 2-person households, comprising 1,307, and the most common type of nonfamily households are 1-person households, comprising 1,316.
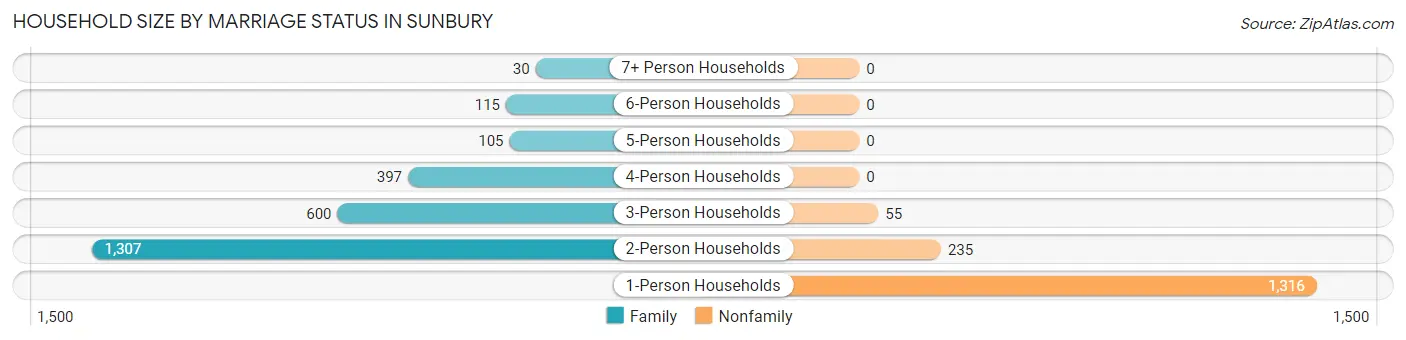
| Household Size | Family Households | Nonfamily Households |
| 1-Person Households | - | 1,316 (31.6%) |
| 2-Person Households | 1,307 (31.4%) | 235 (5.7%) |
| 3-Person Households | 600 (14.4%) | 55 (1.3%) |
| 4-Person Households | 397 (9.5%) | 0 (0.0%) |
| 5-Person Households | 105 (2.5%) | 0 (0.0%) |
| 6-Person Households | 115 (2.8%) | 0 (0.0%) |
| 7+ Person Households | 30 (0.7%) | 0 (0.0%) |
| Total | 2,554 (61.4%) | 1,606 (38.6%) |
Female Fertility in Sunbury
Fertility by Age in Sunbury
Average fertility rate in Sunbury is 49.0 births per 1,000 women. Women in the age bracket of 20 to 34 years have the highest fertility rate with 99.0 births per 1,000 women. Women in the age bracket of 20 to 34 years acount for 100.0% of all women with births.
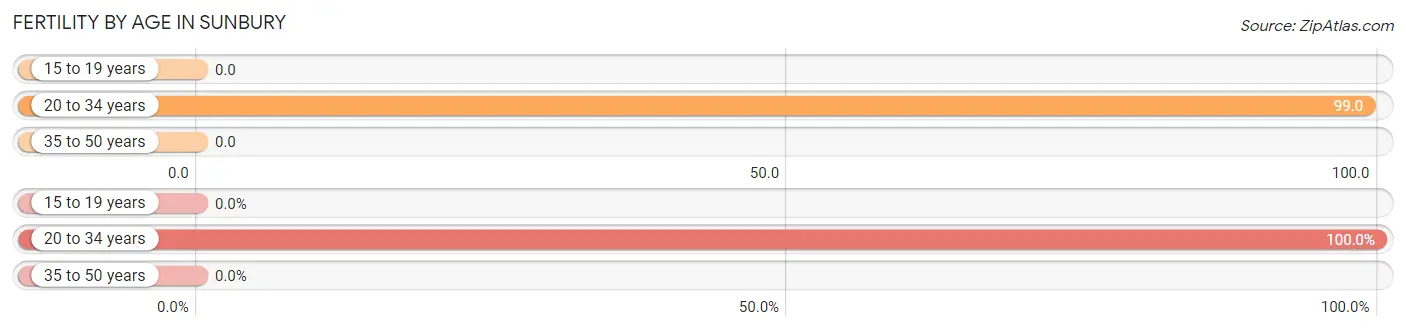
| Age Bracket | Women with Births | Births / 1,000 Women |
| 15 to 19 years | 0 (0.0%) | 0.0 |
| 20 to 34 years | 108 (100.0%) | 99.0 |
| 35 to 50 years | 0 (0.0%) | 0.0 |
| Total | 108 (100.0%) | 49.0 |
Fertility by Age by Marriage Status in Sunbury
49.1% of women with births (108) in Sunbury are married. The highest percentage of unmarried women with births falls into 20 to 34 years age bracket with 50.9% of them unmarried at the time of birth, while the lowest percentage of unmarried women with births belong to 20 to 34 years age bracket with 50.9% of them unmarried.
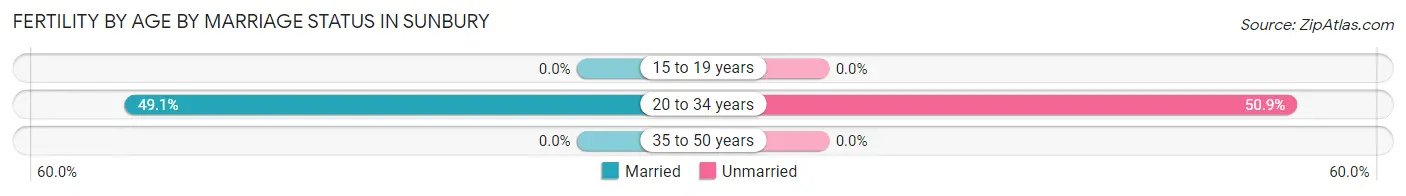
| Age Bracket | Married | Unmarried |
| 15 to 19 years | 0 (0.0%) | 0 (0.0%) |
| 20 to 34 years | 53 (49.1%) | 55 (50.9%) |
| 35 to 50 years | 0 (0.0%) | 0 (0.0%) |
| Total | 53 (49.1%) | 55 (50.9%) |
Fertility by Education in Sunbury
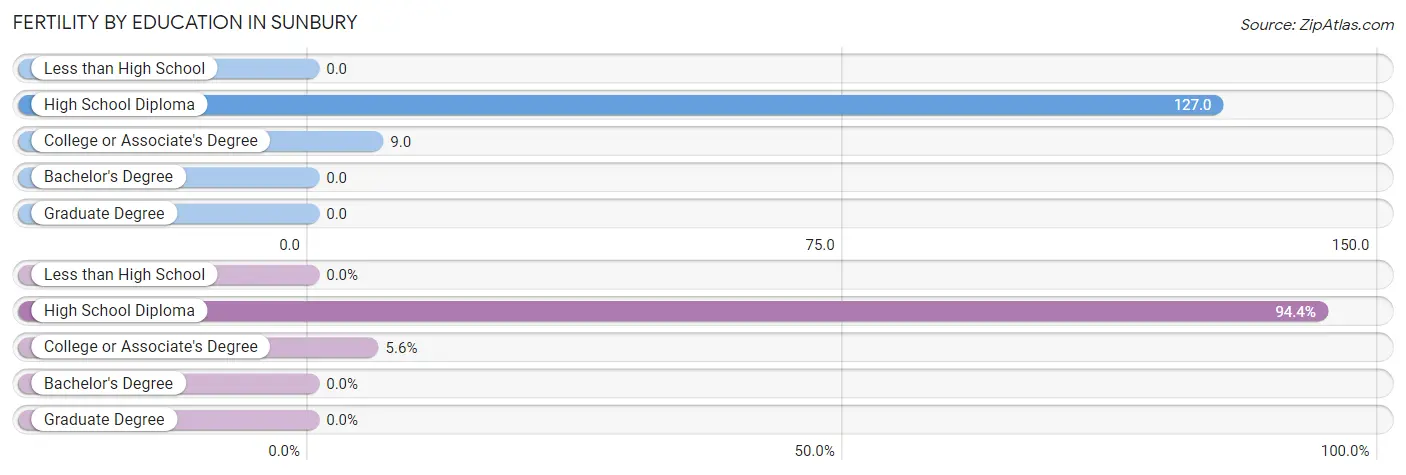
| Educational Attainment | Women with Births | Births / 1,000 Women |
| Less than High School | 0 (0.0%) | 0.0 |
| High School Diploma | 102 (94.4%) | 127.0 |
| College or Associate's Degree | 6 (5.6%) | 9.0 |
| Bachelor's Degree | 0 (0.0%) | 0.0 |
| Graduate Degree | 0 (0.0%) | 0.0 |
| Total | 108 (100.0%) | 49.0 |
Fertility by Education by Marriage Status in Sunbury
50.9% of women with births in Sunbury are unmarried. Women with the educational attainment of college or associate's degree are most likely to be married with 100.0% of them married at childbirth, while women with the educational attainment of high school diploma are least likely to be married with 53.9% of them unmarried at childbirth.
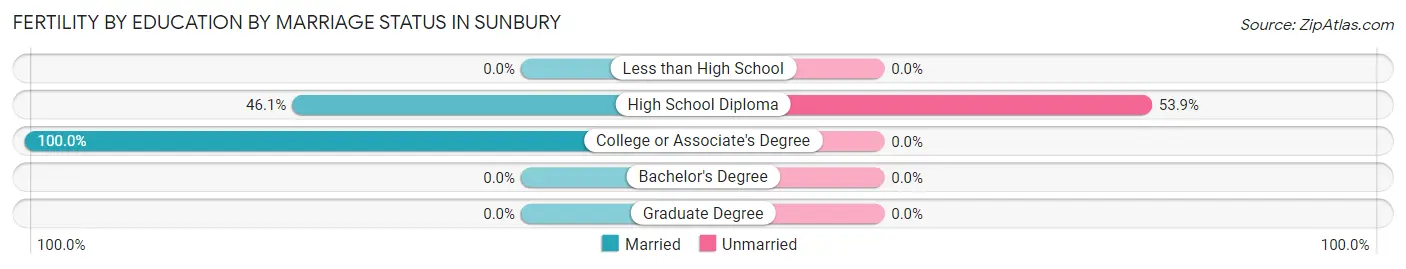
| Educational Attainment | Married | Unmarried |
| Less than High School | 0 (0.0%) | 0 (0.0%) |
| High School Diploma | 47 (46.1%) | 55 (53.9%) |
| College or Associate's Degree | 6 (100.0%) | 0 (0.0%) |
| Bachelor's Degree | 0 (0.0%) | 0 (0.0%) |
| Graduate Degree | 0 (0.0%) | 0 (0.0%) |
| Total | 53 (49.1%) | 55 (50.9%) |
Employment Characteristics in Sunbury
Employment by Class of Employer in Sunbury
Among the 4,154 employed individuals in Sunbury, private company employees (3,221 | 77.5%), not-for-profit organizations (457 | 11.0%), and local government employees (114 | 2.7%) make up the most common classes of employment.
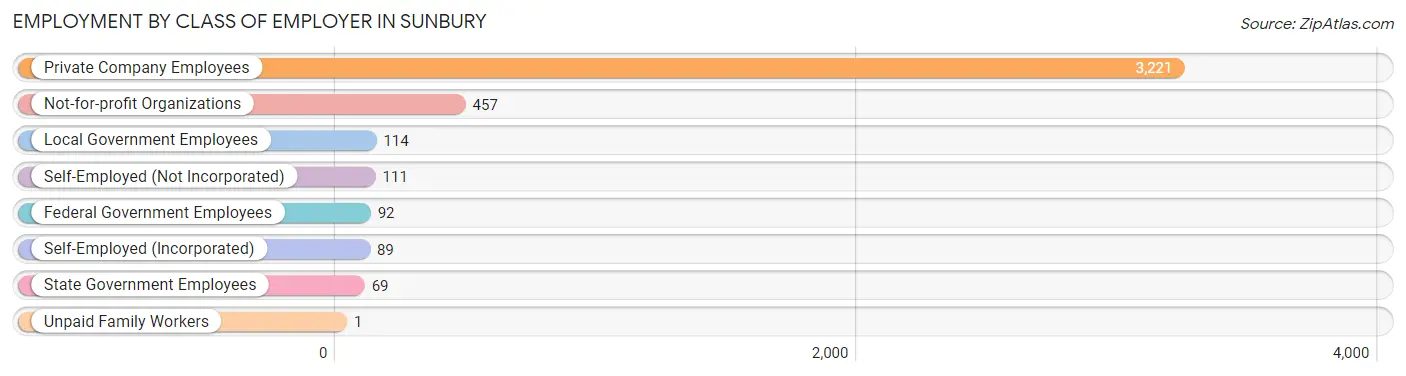
| Employer Class | # Employees | % Employees |
| Private Company Employees | 3,221 | 77.5% |
| Self-Employed (Incorporated) | 89 | 2.1% |
| Self-Employed (Not Incorporated) | 111 | 2.7% |
| Not-for-profit Organizations | 457 | 11.0% |
| Local Government Employees | 114 | 2.7% |
| State Government Employees | 69 | 1.7% |
| Federal Government Employees | 92 | 2.2% |
| Unpaid Family Workers | 1 | 0.0% |
| Total | 4,154 | 100.0% |
Employment Status by Age in Sunbury
According to the labor force statistics for Sunbury, out of the total population over 16 years of age (7,730), 57.4% or 4,437 individuals are in the labor force, with 5.5% or 244 of them unemployed. The age group with the highest labor force participation rate is 25 to 29 years, with 88.4% or 596 individuals in the labor force. Within the labor force, the 16 to 19 years age range has the highest percentage of unemployed individuals, with 12.5% or 39 of them being unemployed.
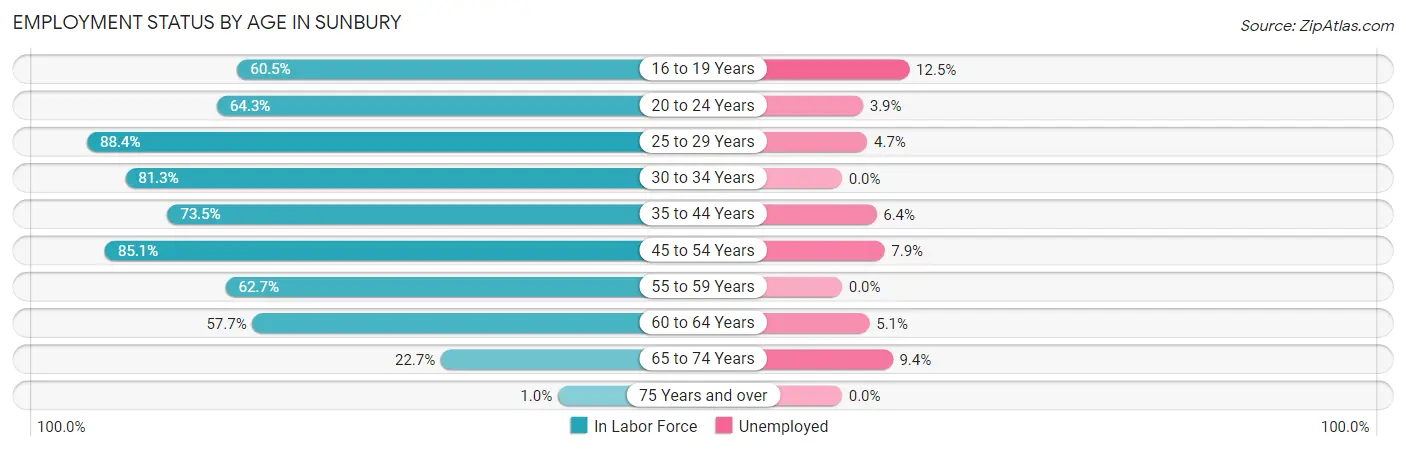
| Age Bracket | In Labor Force | Unemployed |
| 16 to 19 Years | 313 (60.5%) | 39 (12.5%) |
| 20 to 24 Years | 414 (64.3%) | 16 (3.9%) |
| 25 to 29 Years | 596 (88.4%) | 28 (4.7%) |
| 30 to 34 Years | 491 (81.3%) | 0 (0.0%) |
| 35 to 44 Years | 613 (73.5%) | 39 (6.4%) |
| 45 to 54 Years | 996 (85.1%) | 79 (7.9%) |
| 55 to 59 Years | 382 (62.7%) | 0 (0.0%) |
| 60 to 64 Years | 372 (57.7%) | 19 (5.1%) |
| 65 to 74 Years | 254 (22.7%) | 24 (9.4%) |
| 75 Years and over | 9 (1.0%) | 0 (0.0%) |
| Total | 4,437 (57.4%) | 244 (5.5%) |
Employment Status by Educational Attainment in Sunbury
According to labor force statistics for Sunbury, 76.1% of individuals (3,452) out of the total population between 25 and 64 years of age (4,536) are in the labor force, with 4.8% or 166 of them being unemployed. The group with the highest labor force participation rate are those with the educational attainment of bachelor's degree or higher, with 96.4% or 458 individuals in the labor force. Within the labor force, individuals with college / associate degree education have the highest percentage of unemployment, with 9.1% or 75 of them being unemployed.
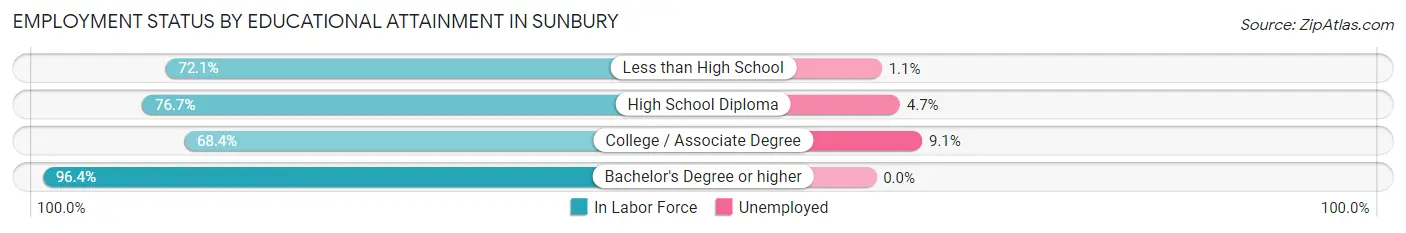
| Educational Attainment | In Labor Force | Unemployed |
| Less than High School | 354 (72.1%) | 5 (1.1%) |
| High School Diploma | 1,818 (76.7%) | 111 (4.7%) |
| College / Associate Degree | 821 (68.4%) | 109 (9.1%) |
| Bachelor's Degree or higher | 458 (96.4%) | 0 (0.0%) |
| Total | 3,452 (76.1%) | 218 (4.8%) |
Employment Occupations by Sex in Sunbury
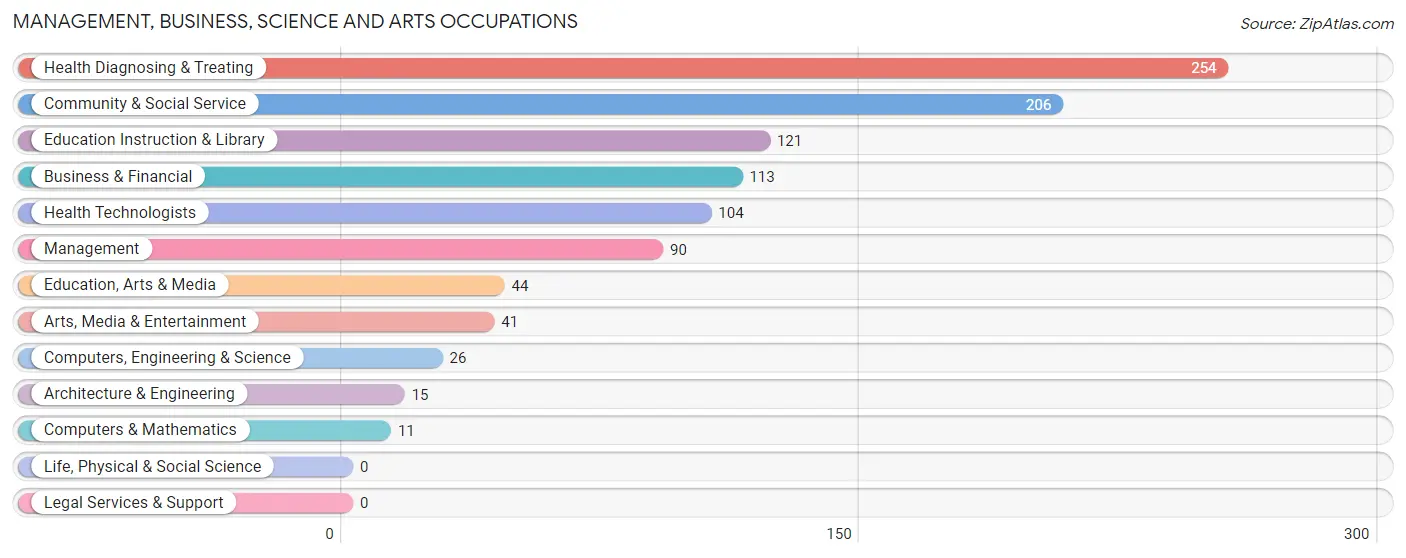
Management, Business, Science and Arts Occupations
The most common Management, Business, Science and Arts occupations in Sunbury are Health Diagnosing & Treating (254 | 6.0%), Community & Social Service (206 | 4.9%), Education Instruction & Library (121 | 2.9%), Business & Financial (113 | 2.7%), and Health Technologists (104 | 2.5%).
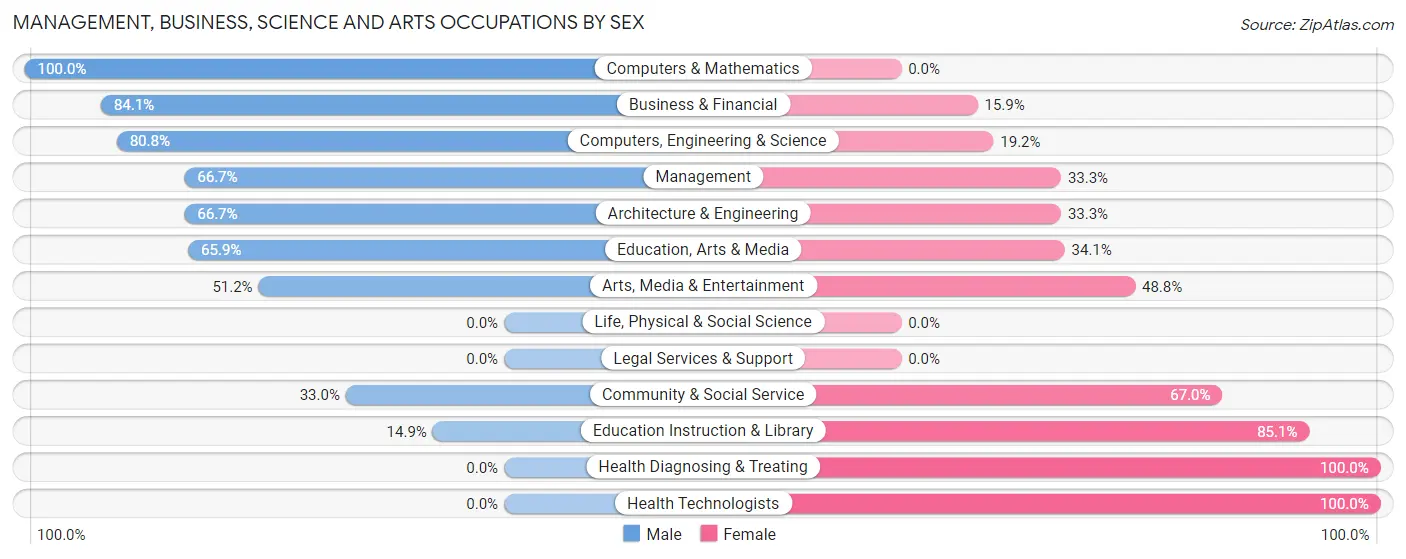
Management, Business, Science and Arts Occupations by Sex
Within the Management, Business, Science and Arts occupations in Sunbury, the most male-oriented occupations are Computers & Mathematics (100.0%), Business & Financial (84.1%), and Computers, Engineering & Science (80.8%), while the most female-oriented occupations are Health Diagnosing & Treating (100.0%), Health Technologists (100.0%), and Education Instruction & Library (85.1%).
| Occupation | Male | Female |
| Management | 60 (66.7%) | 30 (33.3%) |
| Business & Financial | 95 (84.1%) | 18 (15.9%) |
| Computers, Engineering & Science | 21 (80.8%) | 5 (19.2%) |
| Computers & Mathematics | 11 (100.0%) | 0 (0.0%) |
| Architecture & Engineering | 10 (66.7%) | 5 (33.3%) |
| Life, Physical & Social Science | 0 (0.0%) | 0 (0.0%) |
| Community & Social Service | 68 (33.0%) | 138 (67.0%) |
| Education, Arts & Media | 29 (65.9%) | 15 (34.1%) |
| Legal Services & Support | 0 (0.0%) | 0 (0.0%) |
| Education Instruction & Library | 18 (14.9%) | 103 (85.1%) |
| Arts, Media & Entertainment | 21 (51.2%) | 20 (48.8%) |
| Health Diagnosing & Treating | 0 (0.0%) | 254 (100.0%) |
| Health Technologists | 0 (0.0%) | 104 (100.0%) |
| Total (Category) | 244 (35.4%) | 445 (64.6%) |
| Total (Overall) | 1,955 (46.6%) | 2,241 (53.4%) |
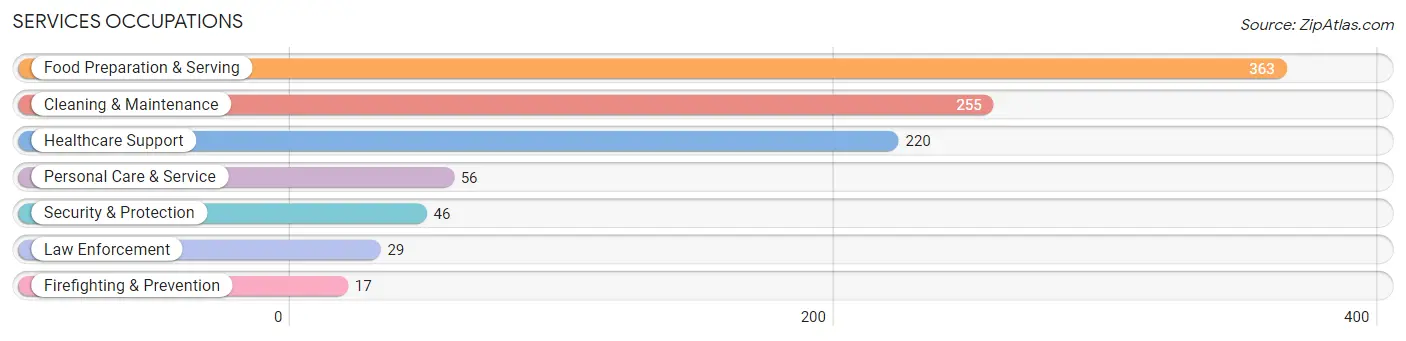
Services Occupations
The most common Services occupations in Sunbury are Food Preparation & Serving (363 | 8.6%), Cleaning & Maintenance (255 | 6.1%), Healthcare Support (220 | 5.2%), Personal Care & Service (56 | 1.3%), and Security & Protection (46 | 1.1%).
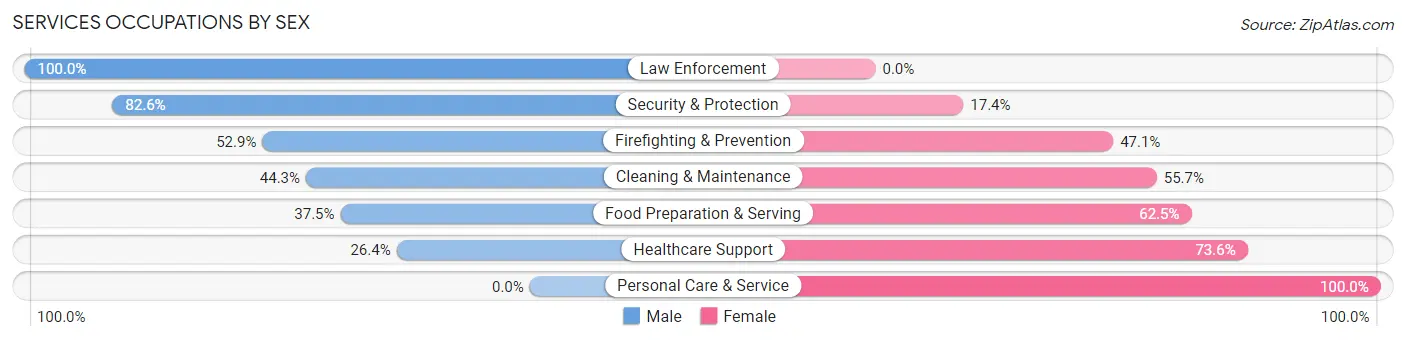
Services Occupations by Sex
Within the Services occupations in Sunbury, the most male-oriented occupations are Law Enforcement (100.0%), Security & Protection (82.6%), and Firefighting & Prevention (52.9%), while the most female-oriented occupations are Personal Care & Service (100.0%), Healthcare Support (73.6%), and Food Preparation & Serving (62.5%).
| Occupation | Male | Female |
| Healthcare Support | 58 (26.4%) | 162 (73.6%) |
| Security & Protection | 38 (82.6%) | 8 (17.4%) |
| Firefighting & Prevention | 9 (52.9%) | 8 (47.1%) |
| Law Enforcement | 29 (100.0%) | 0 (0.0%) |
| Food Preparation & Serving | 136 (37.5%) | 227 (62.5%) |
| Cleaning & Maintenance | 113 (44.3%) | 142 (55.7%) |
| Personal Care & Service | 0 (0.0%) | 56 (100.0%) |
| Total (Category) | 345 (36.7%) | 595 (63.3%) |
| Total (Overall) | 1,955 (46.6%) | 2,241 (53.4%) |
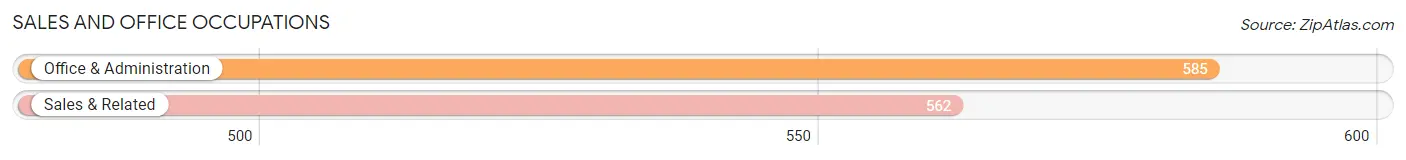
Sales and Office Occupations
The most common Sales and Office occupations in Sunbury are Office & Administration (585 | 13.9%), and Sales & Related (562 | 13.4%).
Sales and Office Occupations by Sex
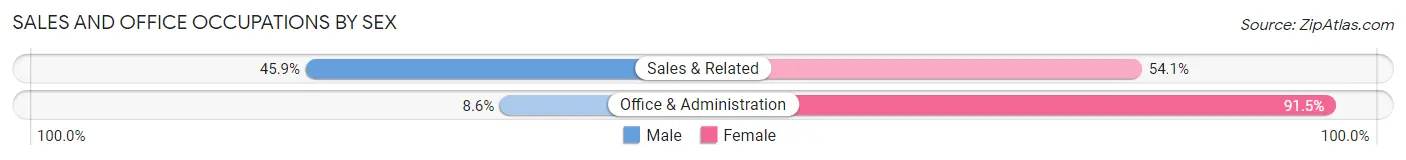
| Occupation | Male | Female |
| Sales & Related | 258 (45.9%) | 304 (54.1%) |
| Office & Administration | 50 (8.6%) | 535 (91.4%) |
| Total (Category) | 308 (26.9%) | 839 (73.2%) |
| Total (Overall) | 1,955 (46.6%) | 2,241 (53.4%) |
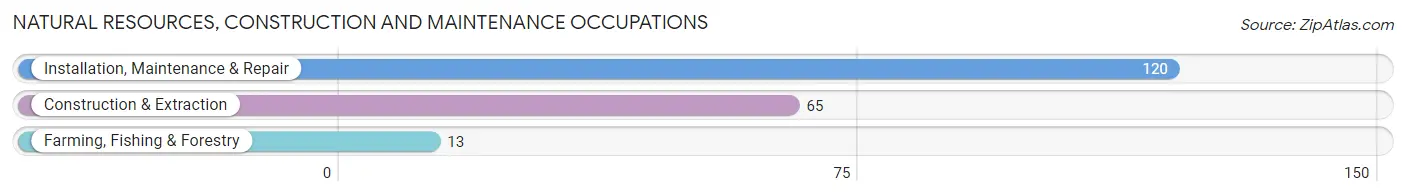
Natural Resources, Construction and Maintenance Occupations
The most common Natural Resources, Construction and Maintenance occupations in Sunbury are Installation, Maintenance & Repair (120 | 2.9%), Construction & Extraction (65 | 1.5%), and Farming, Fishing & Forestry (13 | 0.3%).
Natural Resources, Construction and Maintenance Occupations by Sex
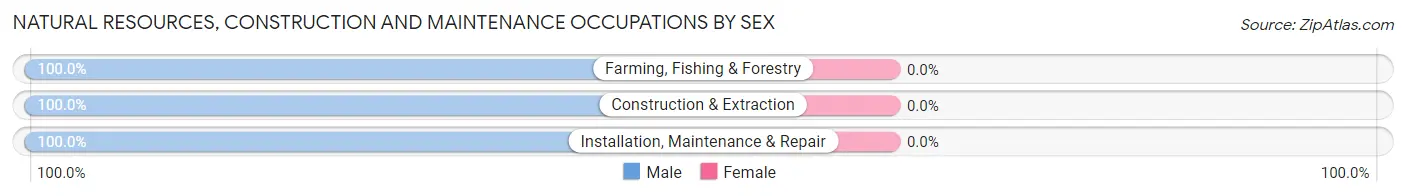
| Occupation | Male | Female |
| Farming, Fishing & Forestry | 13 (100.0%) | 0 (0.0%) |
| Construction & Extraction | 65 (100.0%) | 0 (0.0%) |
| Installation, Maintenance & Repair | 120 (100.0%) | 0 (0.0%) |
| Total (Category) | 198 (100.0%) | 0 (0.0%) |
| Total (Overall) | 1,955 (46.6%) | 2,241 (53.4%) |
Production, Transportation and Moving Occupations
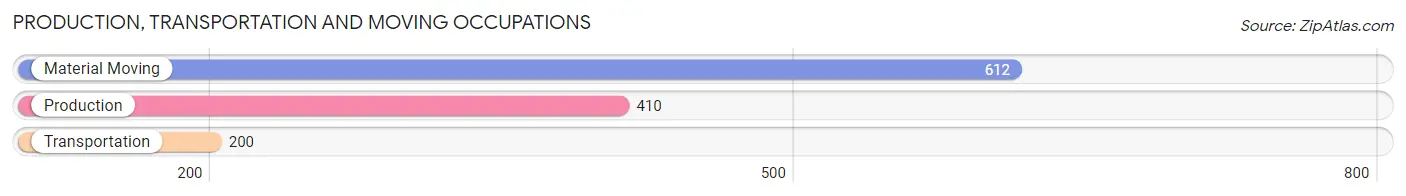
The most common Production, Transportation and Moving occupations in Sunbury are Material Moving (612 | 14.6%), Production (410 | 9.8%), and Transportation (200 | 4.8%).
Production, Transportation and Moving Occupations by Sex
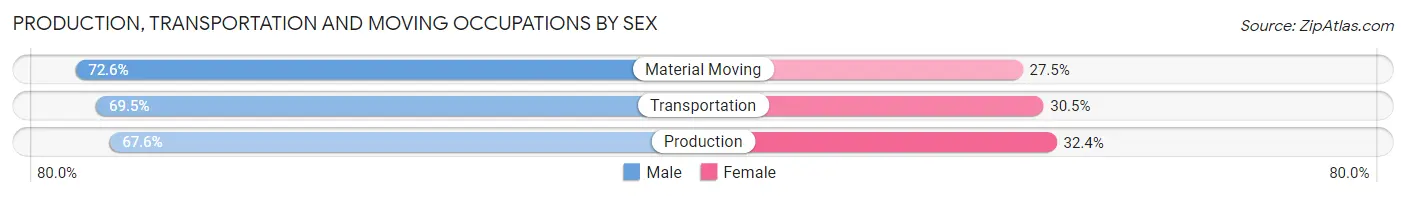
| Occupation | Male | Female |
| Production | 277 (67.6%) | 133 (32.4%) |
| Transportation | 139 (69.5%) | 61 (30.5%) |
| Material Moving | 444 (72.6%) | 168 (27.5%) |
| Total (Category) | 860 (70.4%) | 362 (29.6%) |
| Total (Overall) | 1,955 (46.6%) | 2,241 (53.4%) |
Employment Industries by Sex in Sunbury
Employment Industries in Sunbury
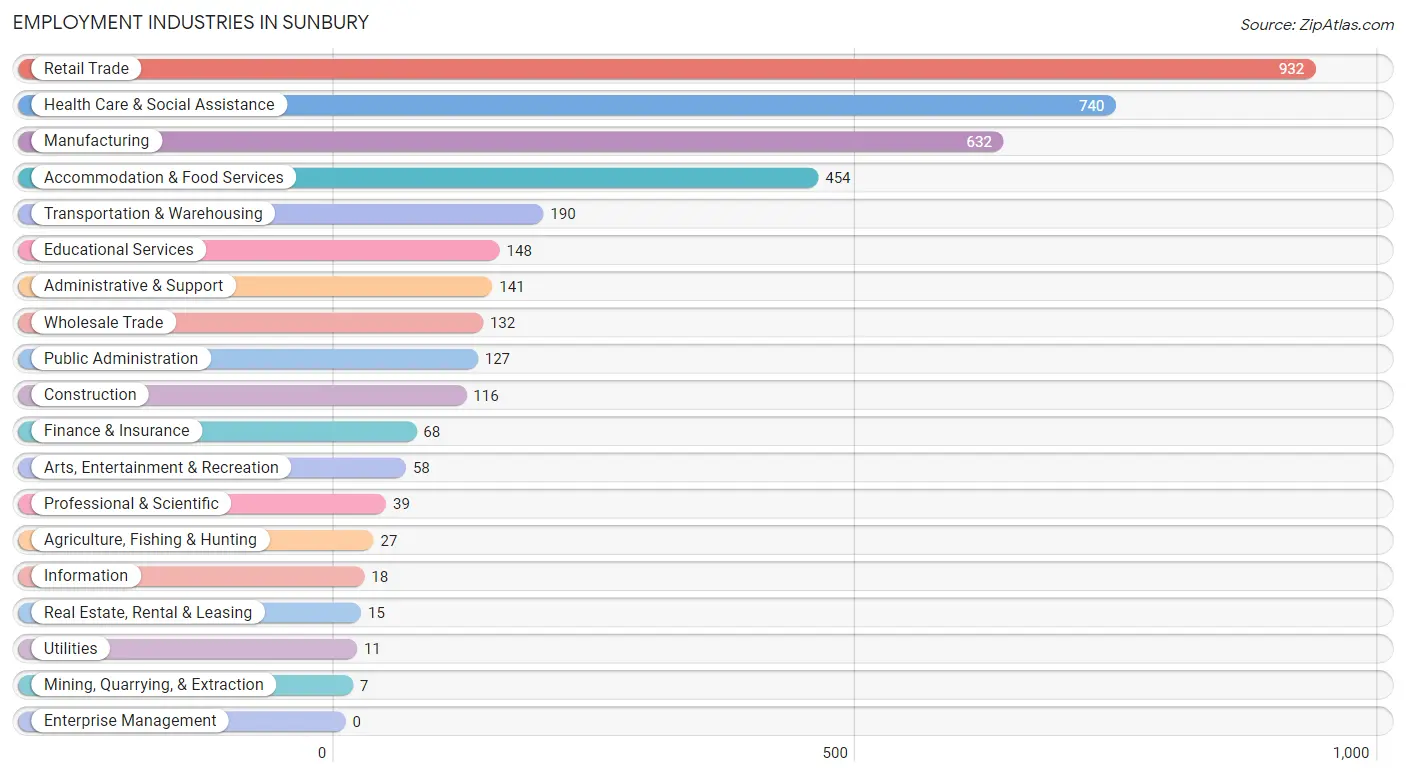
The major employment industries in Sunbury include Retail Trade (932 | 22.2%), Health Care & Social Assistance (740 | 17.6%), Manufacturing (632 | 15.1%), Accommodation & Food Services (454 | 10.8%), and Transportation & Warehousing (190 | 4.5%).
Employment Industries by Sex in Sunbury
The Sunbury industries that see more men than women are Agriculture, Fishing & Hunting (100.0%), Mining, Quarrying, & Extraction (100.0%), and Utilities (100.0%), whereas the industries that tend to have a higher number of women are Health Care & Social Assistance (85.7%), Finance & Insurance (75.0%), and Educational Services (73.7%).
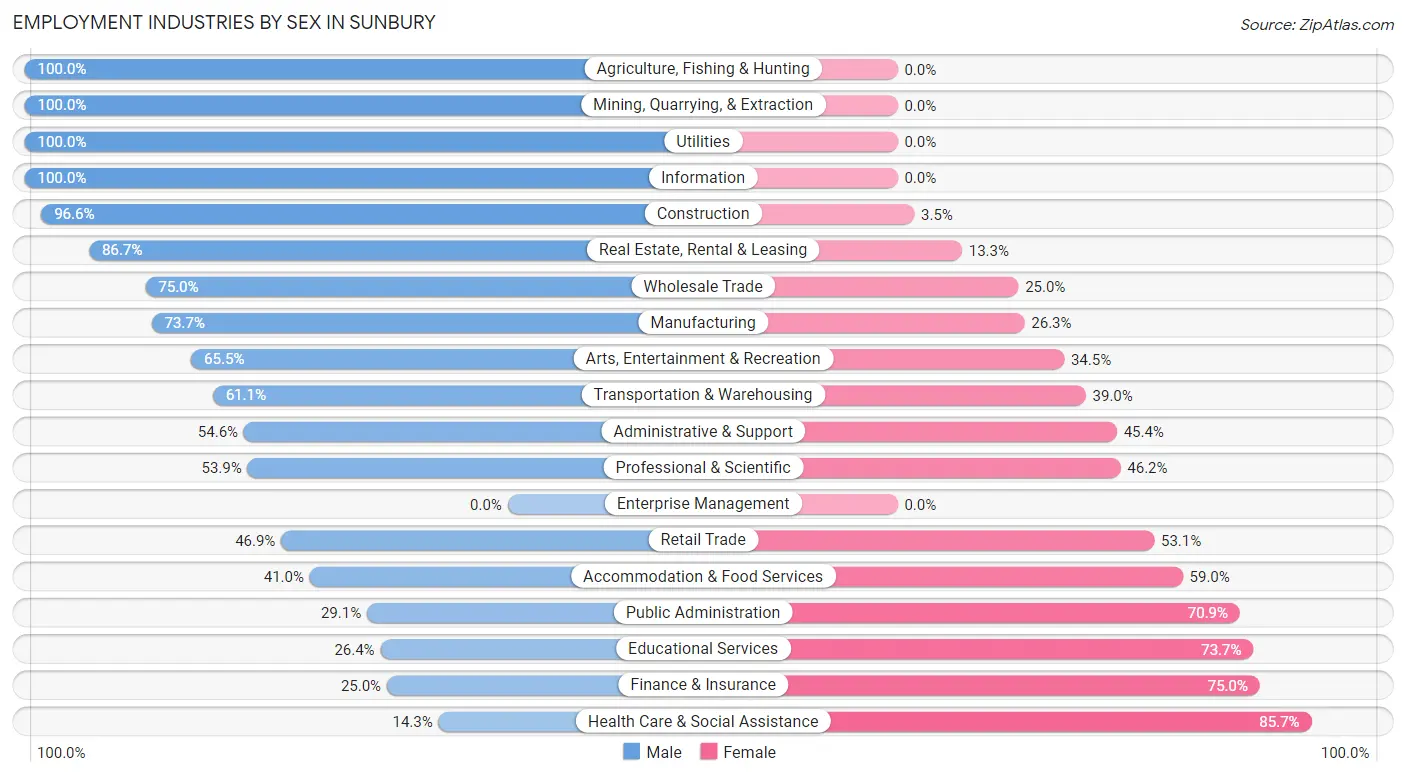
| Industry | Male | Female |
| Agriculture, Fishing & Hunting | 27 (100.0%) | 0 (0.0%) |
| Mining, Quarrying, & Extraction | 7 (100.0%) | 0 (0.0%) |
| Construction | 112 (96.6%) | 4 (3.5%) |
| Manufacturing | 466 (73.7%) | 166 (26.3%) |
| Wholesale Trade | 99 (75.0%) | 33 (25.0%) |
| Retail Trade | 437 (46.9%) | 495 (53.1%) |
| Transportation & Warehousing | 116 (61.1%) | 74 (39.0%) |
| Utilities | 11 (100.0%) | 0 (0.0%) |
| Information | 18 (100.0%) | 0 (0.0%) |
| Finance & Insurance | 17 (25.0%) | 51 (75.0%) |
| Real Estate, Rental & Leasing | 13 (86.7%) | 2 (13.3%) |
| Professional & Scientific | 21 (53.8%) | 18 (46.2%) |
| Enterprise Management | 0 (0.0%) | 0 (0.0%) |
| Administrative & Support | 77 (54.6%) | 64 (45.4%) |
| Educational Services | 39 (26.4%) | 109 (73.7%) |
| Health Care & Social Assistance | 106 (14.3%) | 634 (85.7%) |
| Arts, Entertainment & Recreation | 38 (65.5%) | 20 (34.5%) |
| Accommodation & Food Services | 186 (41.0%) | 268 (59.0%) |
| Public Administration | 37 (29.1%) | 90 (70.9%) |
| Total | 1,955 (46.6%) | 2,241 (53.4%) |
Education in Sunbury
School Enrollment in Sunbury
The most common levels of schooling among the 2,135 students in Sunbury are elementary school (496 | 23.2%), middle school (486 | 22.8%), and high school (425 | 19.9%).
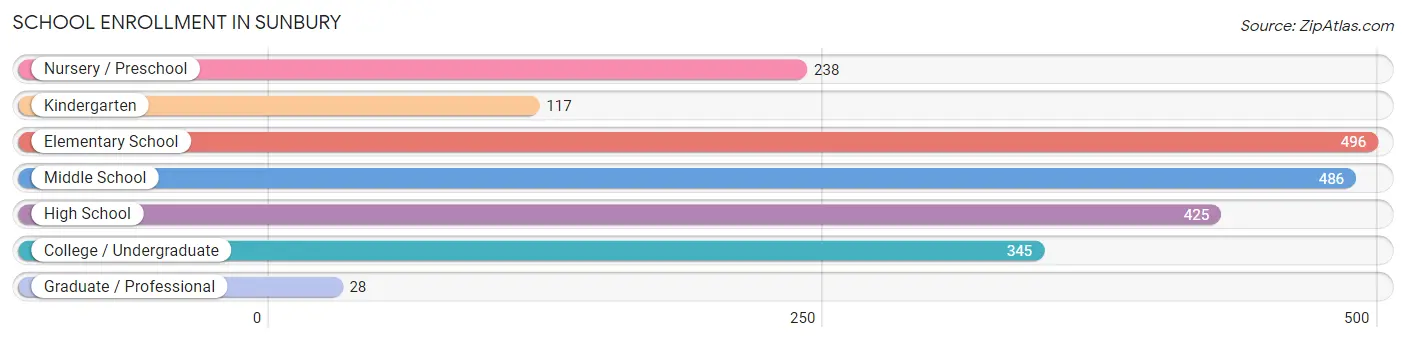
| School Level | # Students | % Students |
| Nursery / Preschool | 238 | 11.2% |
| Kindergarten | 117 | 5.5% |
| Elementary School | 496 | 23.2% |
| Middle School | 486 | 22.8% |
| High School | 425 | 19.9% |
| College / Undergraduate | 345 | 16.2% |
| Graduate / Professional | 28 | 1.3% |
| Total | 2,135 | 100.0% |
School Enrollment by Age by Funding Source in Sunbury
Out of a total of 2,135 students who are enrolled in schools in Sunbury, 246 (11.5%) attend a private institution, while the remaining 1,889 (88.5%) are enrolled in public schools. The age group of 18 to 19 year olds has the highest likelihood of being enrolled in private schools, with 42 (26.8% in the age bracket) enrolled. Conversely, the age group of 3 to 4 year olds has the lowest likelihood of being enrolled in a private school, with 52 (100.0% in the age bracket) attending a public institution.
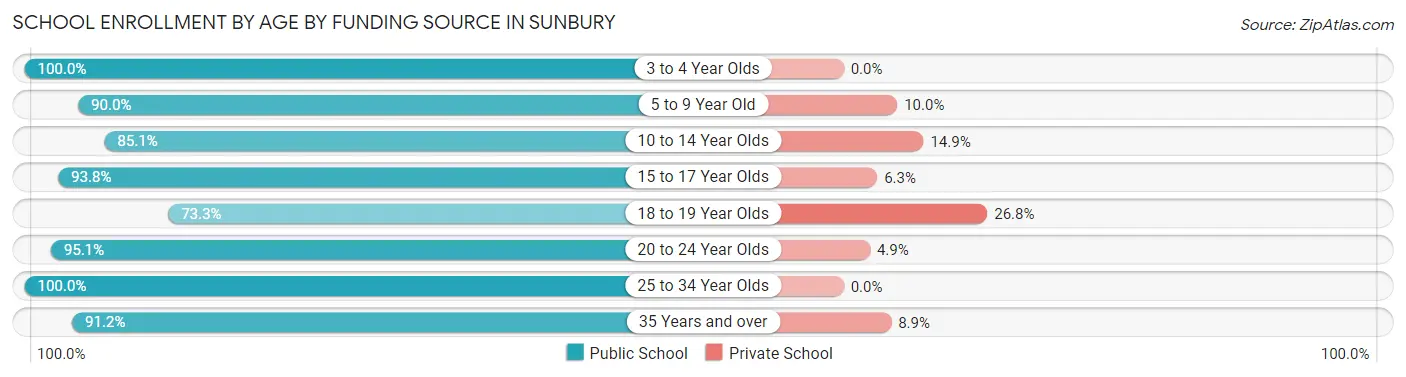
| Age Bracket | Public School | Private School |
| 3 to 4 Year Olds | 52 (100.0%) | 0 (0.0%) |
| 5 to 9 Year Old | 577 (90.0%) | 64 (10.0%) |
| 10 to 14 Year Olds | 584 (85.1%) | 102 (14.9%) |
| 15 to 17 Year Olds | 255 (93.8%) | 17 (6.2%) |
| 18 to 19 Year Olds | 115 (73.3%) | 42 (26.8%) |
| 20 to 24 Year Olds | 194 (95.1%) | 10 (4.9%) |
| 25 to 34 Year Olds | 10 (100.0%) | 0 (0.0%) |
| 35 Years and over | 103 (91.1%) | 10 (8.8%) |
| Total | 1,889 (88.5%) | 246 (11.5%) |
Educational Attainment by Field of Study in Sunbury
Education (140 | 23.1%), science & technology (107 | 17.7%), business (61 | 10.1%), psychology (48 | 7.9%), and visual & performing arts (41 | 6.8%) are the most common fields of study among 605 individuals in Sunbury who have obtained a bachelor's degree or higher.
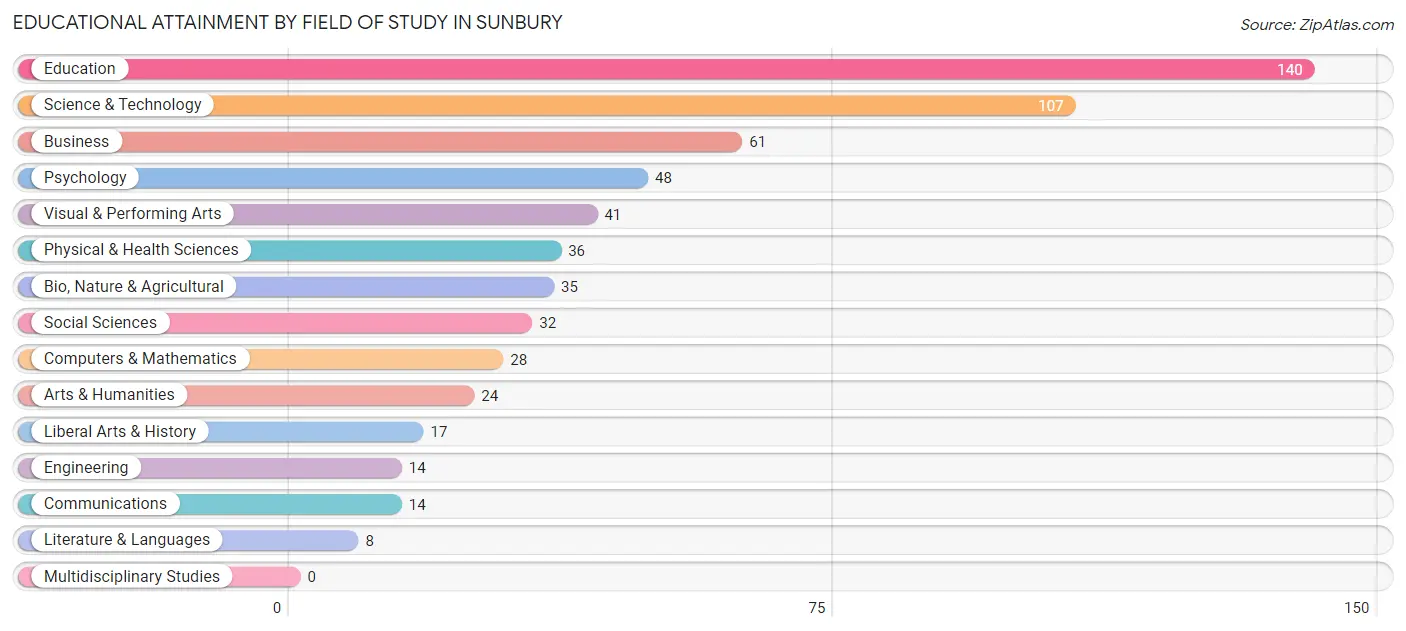
| Field of Study | # Graduates | % Graduates |
| Computers & Mathematics | 28 | 4.6% |
| Bio, Nature & Agricultural | 35 | 5.8% |
| Physical & Health Sciences | 36 | 5.9% |
| Psychology | 48 | 7.9% |
| Social Sciences | 32 | 5.3% |
| Engineering | 14 | 2.3% |
| Multidisciplinary Studies | 0 | 0.0% |
| Science & Technology | 107 | 17.7% |
| Business | 61 | 10.1% |
| Education | 140 | 23.1% |
| Literature & Languages | 8 | 1.3% |
| Liberal Arts & History | 17 | 2.8% |
| Visual & Performing Arts | 41 | 6.8% |
| Communications | 14 | 2.3% |
| Arts & Humanities | 24 | 4.0% |
| Total | 605 | 100.0% |
Transportation & Commute in Sunbury
Vehicle Availability by Sex in Sunbury
The most prevalent vehicle ownership categories in Sunbury are males with 2 vehicles (798, accounting for 41.3%) and females with 2 vehicles (868, making up 36.4%).
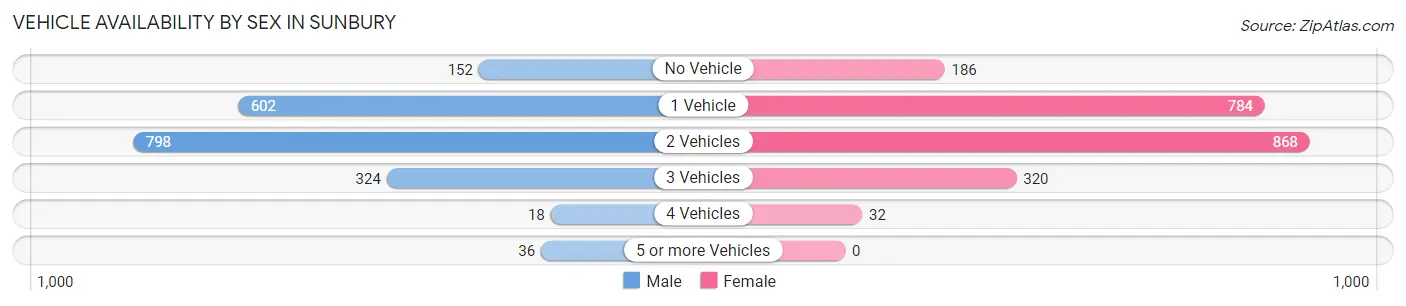
| Vehicles Available | Male | Female |
| No Vehicle | 152 (7.9%) | 186 (8.5%) |
| 1 Vehicle | 602 (31.2%) | 784 (35.8%) |
| 2 Vehicles | 798 (41.3%) | 868 (39.6%) |
| 3 Vehicles | 324 (16.8%) | 320 (14.6%) |
| 4 Vehicles | 18 (0.9%) | 32 (1.5%) |
| 5 or more Vehicles | 36 (1.9%) | 0 (0.0%) |
| Total | 1,930 (100.0%) | 2,190 (100.0%) |
Commute Time in Sunbury
The most frequently occuring commute durations in Sunbury are 10 to 14 minutes (986 commuters, 25.0%), 20 to 24 minutes (685 commuters, 17.4%), and 15 to 19 minutes (607 commuters, 15.4%).
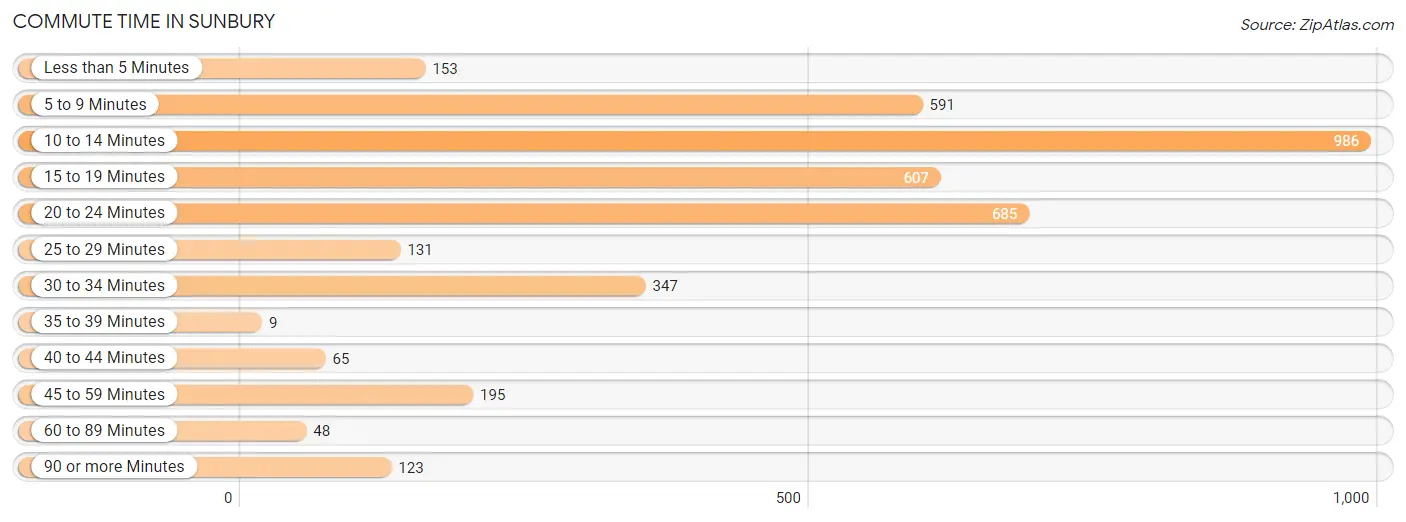
| Commute Time | # Commuters | % Commuters |
| Less than 5 Minutes | 153 | 3.9% |
| 5 to 9 Minutes | 591 | 15.0% |
| 10 to 14 Minutes | 986 | 25.0% |
| 15 to 19 Minutes | 607 | 15.4% |
| 20 to 24 Minutes | 685 | 17.4% |
| 25 to 29 Minutes | 131 | 3.3% |
| 30 to 34 Minutes | 347 | 8.8% |
| 35 to 39 Minutes | 9 | 0.2% |
| 40 to 44 Minutes | 65 | 1.7% |
| 45 to 59 Minutes | 195 | 5.0% |
| 60 to 89 Minutes | 48 | 1.2% |
| 90 or more Minutes | 123 | 3.1% |
Commute Time by Sex in Sunbury
The most common commute times in Sunbury are 10 to 14 minutes (478 commuters, 25.8%) for males and 10 to 14 minutes (508 commuters, 24.4%) for females.
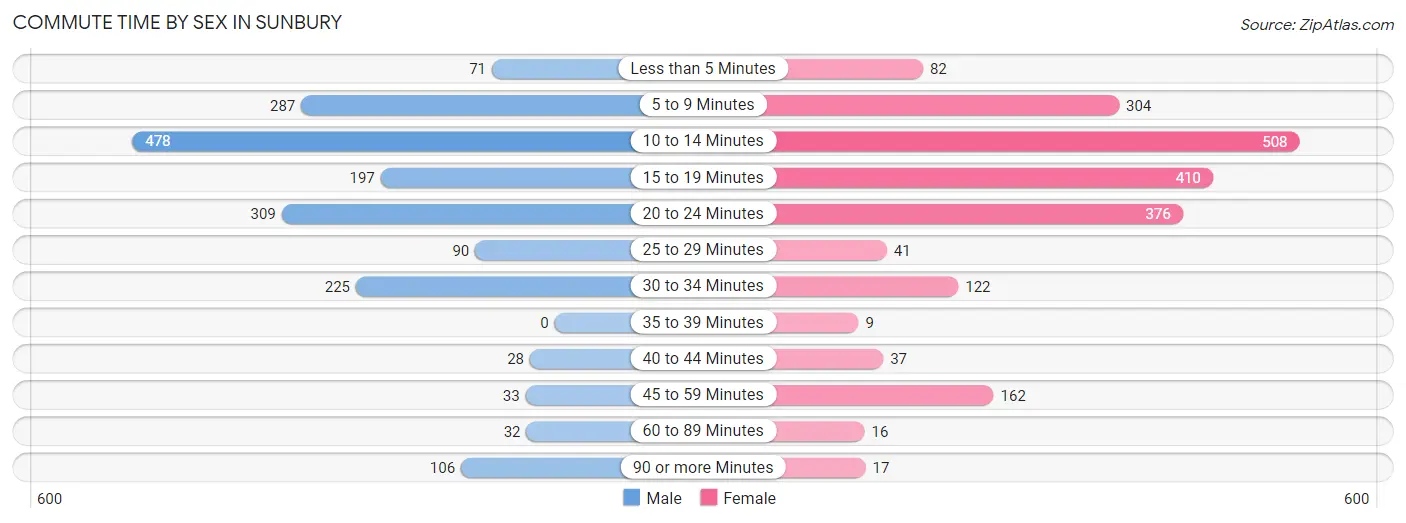
| Commute Time | Male | Female |
| Less than 5 Minutes | 71 (3.8%) | 82 (3.9%) |
| 5 to 9 Minutes | 287 (15.5%) | 304 (14.6%) |
| 10 to 14 Minutes | 478 (25.8%) | 508 (24.4%) |
| 15 to 19 Minutes | 197 (10.6%) | 410 (19.7%) |
| 20 to 24 Minutes | 309 (16.7%) | 376 (18.0%) |
| 25 to 29 Minutes | 90 (4.9%) | 41 (2.0%) |
| 30 to 34 Minutes | 225 (12.1%) | 122 (5.9%) |
| 35 to 39 Minutes | 0 (0.0%) | 9 (0.4%) |
| 40 to 44 Minutes | 28 (1.5%) | 37 (1.8%) |
| 45 to 59 Minutes | 33 (1.8%) | 162 (7.8%) |
| 60 to 89 Minutes | 32 (1.7%) | 16 (0.8%) |
| 90 or more Minutes | 106 (5.7%) | 17 (0.8%) |
Time of Departure to Work by Sex in Sunbury
The most frequent times of departure to work in Sunbury are 7:00 AM to 7:29 AM (280, 15.1%) for males and 7:00 AM to 7:29 AM (464, 22.3%) for females.
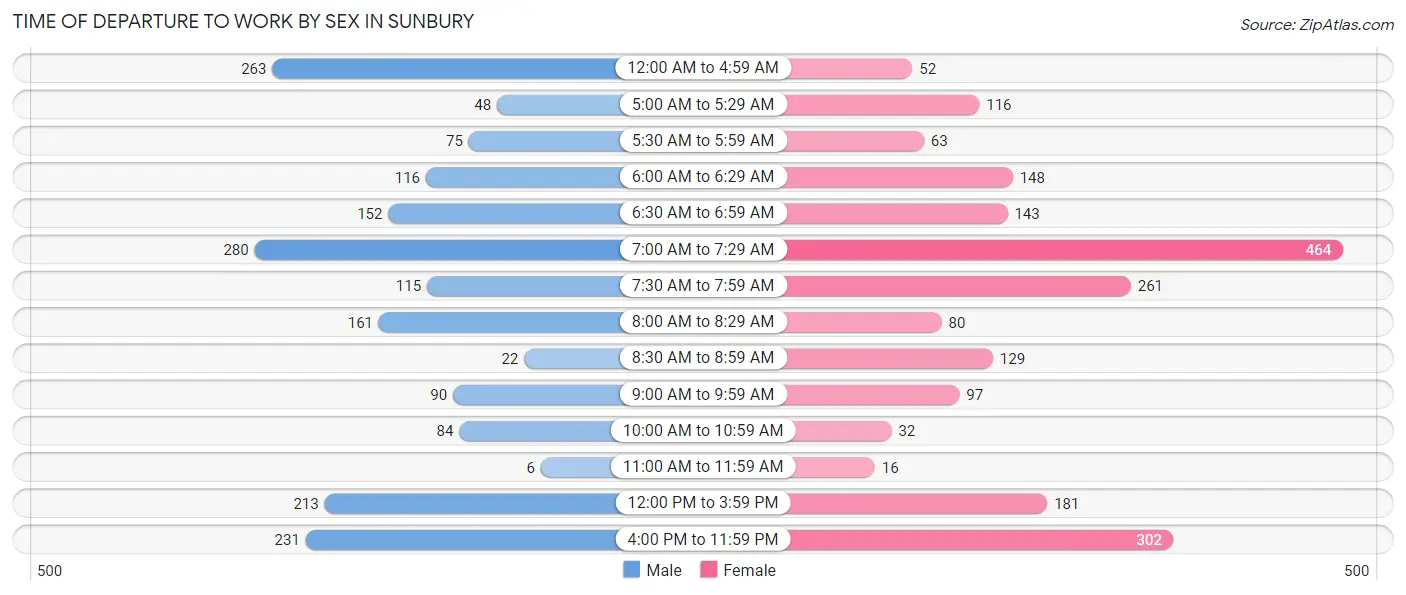
| Time of Departure | Male | Female |
| 12:00 AM to 4:59 AM | 263 (14.2%) | 52 (2.5%) |
| 5:00 AM to 5:29 AM | 48 (2.6%) | 116 (5.6%) |
| 5:30 AM to 5:59 AM | 75 (4.0%) | 63 (3.0%) |
| 6:00 AM to 6:29 AM | 116 (6.2%) | 148 (7.1%) |
| 6:30 AM to 6:59 AM | 152 (8.2%) | 143 (6.9%) |
| 7:00 AM to 7:29 AM | 280 (15.1%) | 464 (22.3%) |
| 7:30 AM to 7:59 AM | 115 (6.2%) | 261 (12.5%) |
| 8:00 AM to 8:29 AM | 161 (8.7%) | 80 (3.8%) |
| 8:30 AM to 8:59 AM | 22 (1.2%) | 129 (6.2%) |
| 9:00 AM to 9:59 AM | 90 (4.9%) | 97 (4.6%) |
| 10:00 AM to 10:59 AM | 84 (4.5%) | 32 (1.5%) |
| 11:00 AM to 11:59 AM | 6 (0.3%) | 16 (0.8%) |
| 12:00 PM to 3:59 PM | 213 (11.5%) | 181 (8.7%) |
| 4:00 PM to 11:59 PM | 231 (12.4%) | 302 (14.5%) |
| Total | 1,856 (100.0%) | 2,084 (100.0%) |
Housing Occupancy in Sunbury
Occupancy by Ownership in Sunbury
Of the total 4,160 dwellings in Sunbury, owner-occupied units account for 2,031 (48.8%), while renter-occupied units make up 2,129 (51.2%).
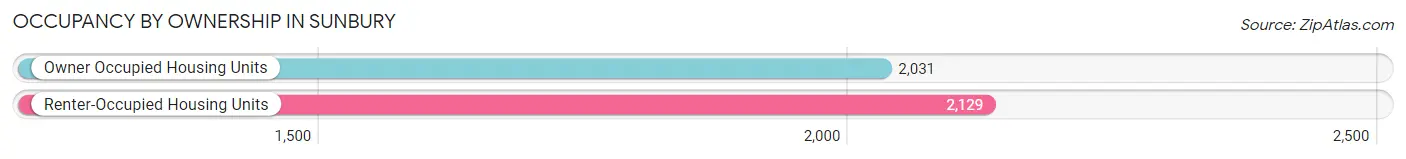
| Occupancy | # Housing Units | % Housing Units |
| Owner Occupied Housing Units | 2,031 | 48.8% |
| Renter-Occupied Housing Units | 2,129 | 51.2% |
| Total Occupied Housing Units | 4,160 | 100.0% |
Occupancy by Household Size in Sunbury
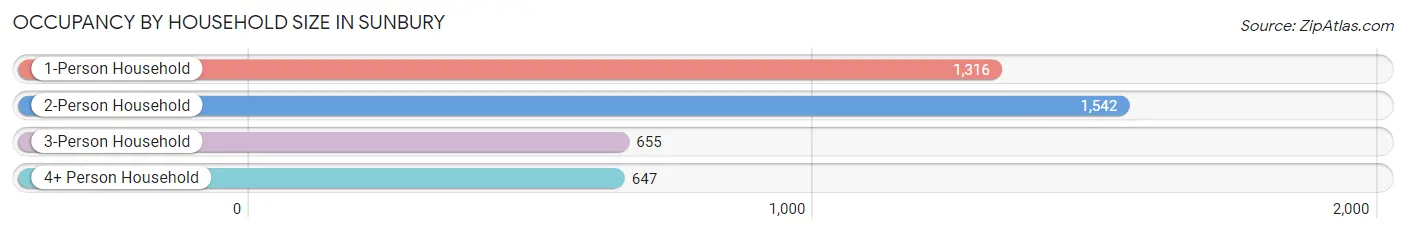
| Household Size | # Housing Units | % Housing Units |
| 1-Person Household | 1,316 | 31.6% |
| 2-Person Household | 1,542 | 37.1% |
| 3-Person Household | 655 | 15.8% |
| 4+ Person Household | 647 | 15.5% |
| Total Housing Units | 4,160 | 100.0% |
Occupancy by Ownership by Household Size in Sunbury
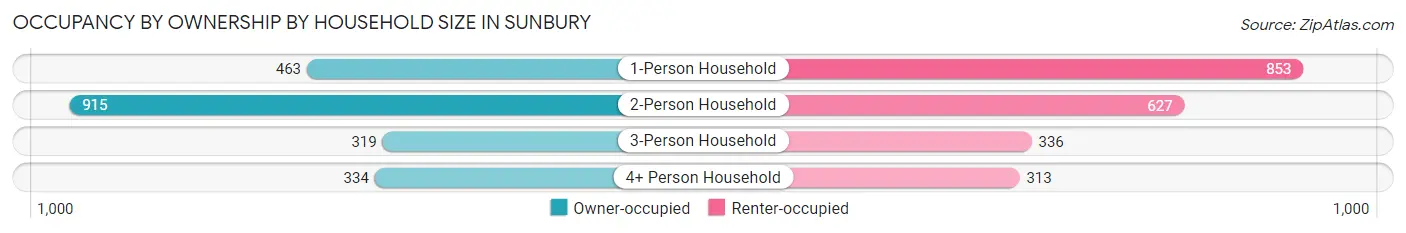
| Household Size | Owner-occupied | Renter-occupied |
| 1-Person Household | 463 (35.2%) | 853 (64.8%) |
| 2-Person Household | 915 (59.3%) | 627 (40.7%) |
| 3-Person Household | 319 (48.7%) | 336 (51.3%) |
| 4+ Person Household | 334 (51.6%) | 313 (48.4%) |
| Total Housing Units | 2,031 (48.8%) | 2,129 (51.2%) |
Occupancy by Educational Attainment in Sunbury
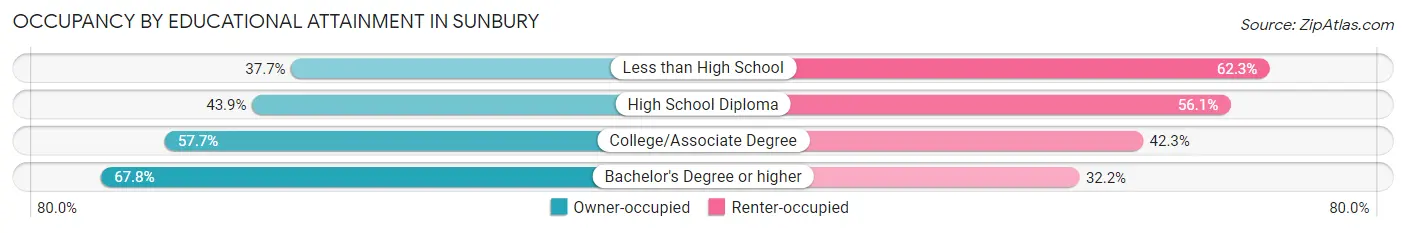
| Household Size | Owner-occupied | Renter-occupied |
| Less than High School | 153 (37.7%) | 253 (62.3%) |
| High School Diploma | 1,045 (43.9%) | 1,336 (56.1%) |
| College/Associate Degree | 563 (57.7%) | 412 (42.3%) |
| Bachelor's Degree or higher | 270 (67.8%) | 128 (32.2%) |
Occupancy by Age of Householder in Sunbury
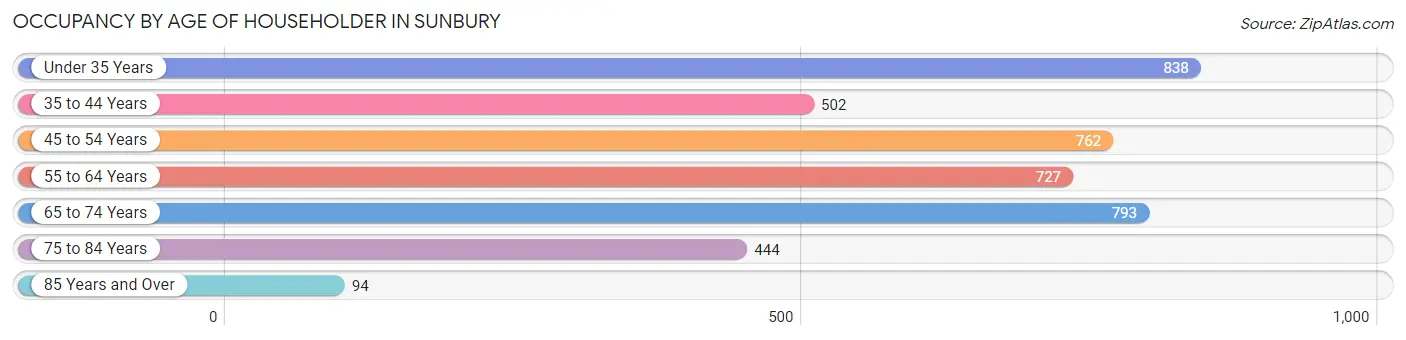
| Age Bracket | # Households | % Households |
| Under 35 Years | 838 | 20.1% |
| 35 to 44 Years | 502 | 12.1% |
| 45 to 54 Years | 762 | 18.3% |
| 55 to 64 Years | 727 | 17.5% |
| 65 to 74 Years | 793 | 19.1% |
| 75 to 84 Years | 444 | 10.7% |
| 85 Years and Over | 94 | 2.3% |
| Total | 4,160 | 100.0% |
Housing Finances in Sunbury
Median Income by Occupancy in Sunbury
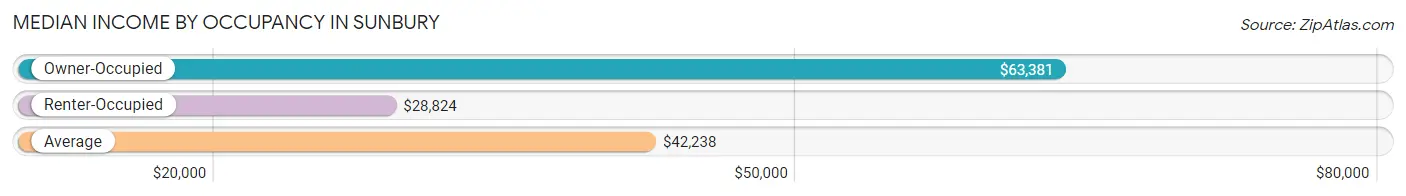
| Occupancy Type | # Households | Median Income |
| Owner-Occupied | 2,031 (48.8%) | $63,381 |
| Renter-Occupied | 2,129 (51.2%) | $28,824 |
| Average | 4,160 (100.0%) | $42,238 |
Occupancy by Householder Income Bracket in Sunbury
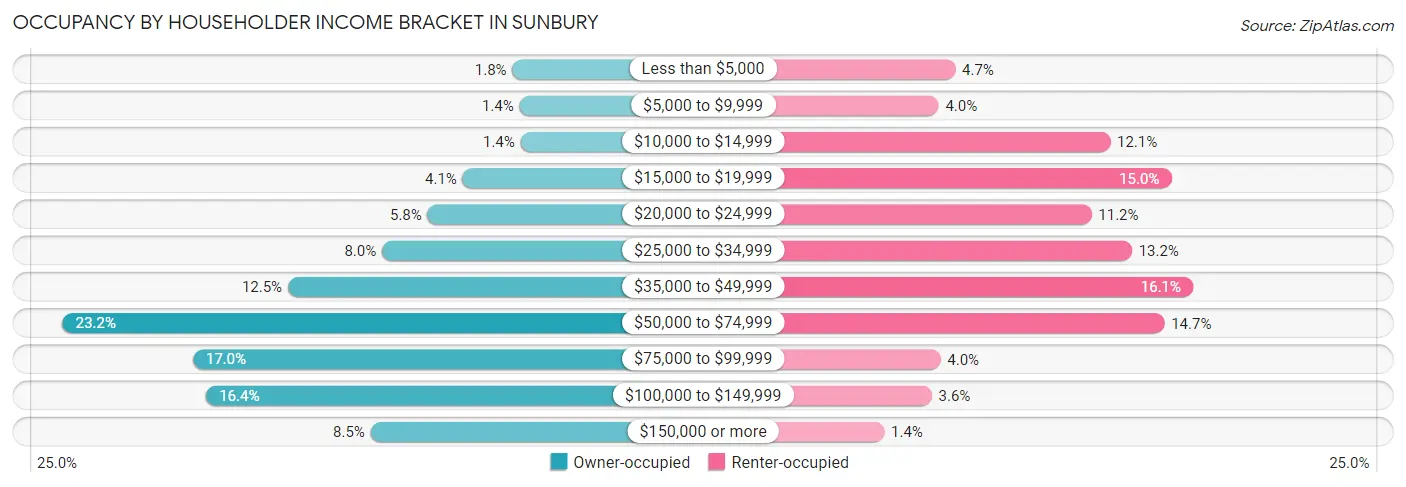
| Income Bracket | Owner-occupied | Renter-occupied |
| Less than $5,000 | 36 (1.8%) | 101 (4.7%) |
| $5,000 to $9,999 | 29 (1.4%) | 84 (4.0%) |
| $10,000 to $14,999 | 28 (1.4%) | 258 (12.1%) |
| $15,000 to $19,999 | 84 (4.1%) | 320 (15.0%) |
| $20,000 to $24,999 | 118 (5.8%) | 239 (11.2%) |
| $25,000 to $34,999 | 162 (8.0%) | 280 (13.2%) |
| $35,000 to $49,999 | 253 (12.5%) | 342 (16.1%) |
| $50,000 to $74,999 | 471 (23.2%) | 313 (14.7%) |
| $75,000 to $99,999 | 345 (17.0%) | 86 (4.0%) |
| $100,000 to $149,999 | 332 (16.4%) | 77 (3.6%) |
| $150,000 or more | 173 (8.5%) | 29 (1.4%) |
| Total | 2,031 (100.0%) | 2,129 (100.0%) |
Monthly Housing Cost Tiers in Sunbury
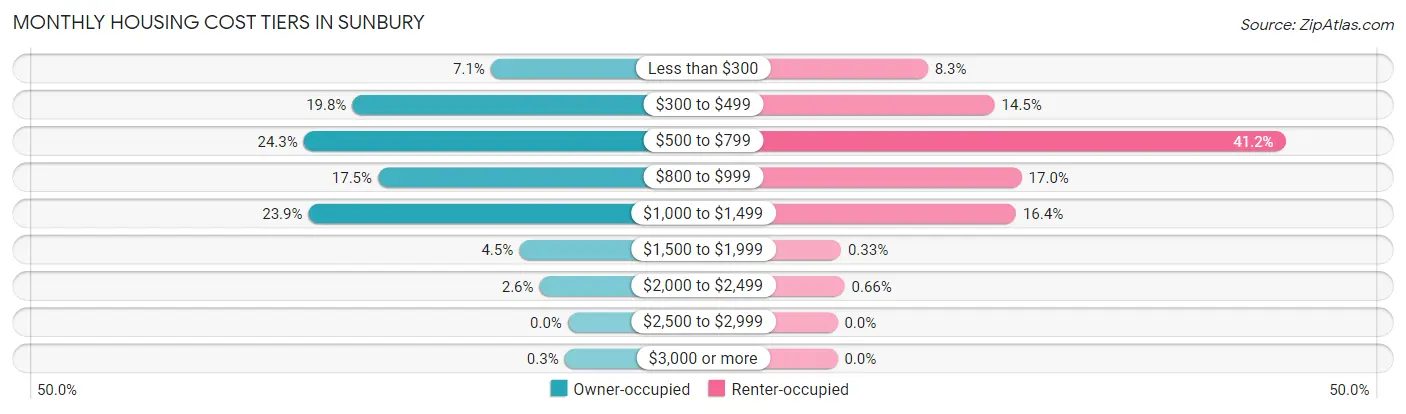
| Monthly Cost | Owner-occupied | Renter-occupied |
| Less than $300 | 144 (7.1%) | 177 (8.3%) |
| $300 to $499 | 403 (19.8%) | 308 (14.5%) |
| $500 to $799 | 494 (24.3%) | 878 (41.2%) |
| $800 to $999 | 355 (17.5%) | 361 (17.0%) |
| $1,000 to $1,499 | 485 (23.9%) | 350 (16.4%) |
| $1,500 to $1,999 | 91 (4.5%) | 7 (0.3%) |
| $2,000 to $2,499 | 53 (2.6%) | 14 (0.7%) |
| $2,500 to $2,999 | 0 (0.0%) | 0 (0.0%) |
| $3,000 or more | 6 (0.3%) | 0 (0.0%) |
| Total | 2,031 (100.0%) | 2,129 (100.0%) |
Physical Housing Characteristics in Sunbury
Housing Structures in Sunbury
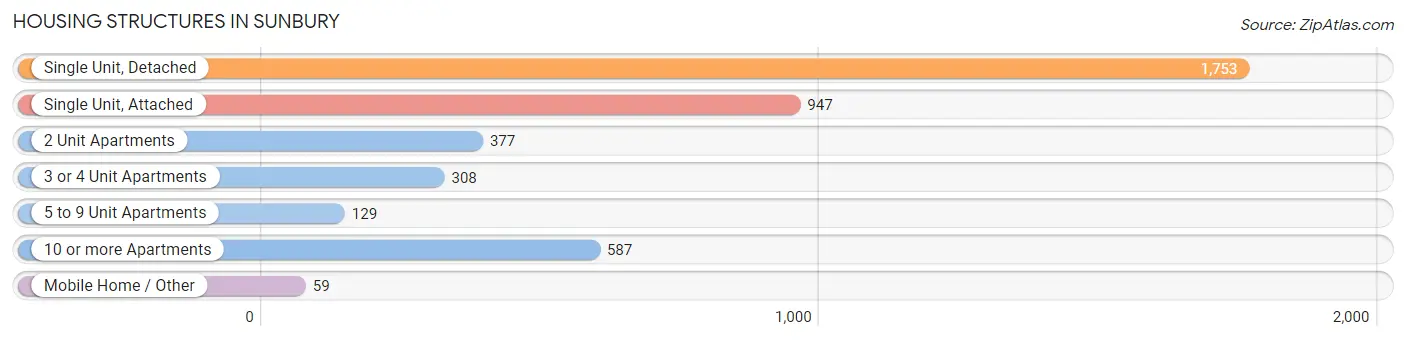
| Structure Type | # Housing Units | % Housing Units |
| Single Unit, Detached | 1,753 | 42.1% |
| Single Unit, Attached | 947 | 22.8% |
| 2 Unit Apartments | 377 | 9.1% |
| 3 or 4 Unit Apartments | 308 | 7.4% |
| 5 to 9 Unit Apartments | 129 | 3.1% |
| 10 or more Apartments | 587 | 14.1% |
| Mobile Home / Other | 59 | 1.4% |
| Total | 4,160 | 100.0% |
Housing Structures by Occupancy in Sunbury
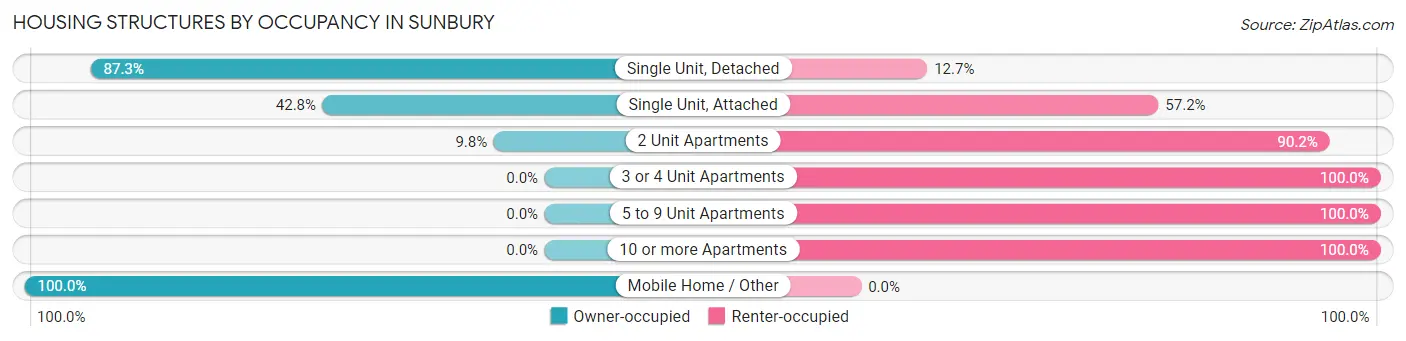
| Structure Type | Owner-occupied | Renter-occupied |
| Single Unit, Detached | 1,530 (87.3%) | 223 (12.7%) |
| Single Unit, Attached | 405 (42.8%) | 542 (57.2%) |
| 2 Unit Apartments | 37 (9.8%) | 340 (90.2%) |
| 3 or 4 Unit Apartments | 0 (0.0%) | 308 (100.0%) |
| 5 to 9 Unit Apartments | 0 (0.0%) | 129 (100.0%) |
| 10 or more Apartments | 0 (0.0%) | 587 (100.0%) |
| Mobile Home / Other | 59 (100.0%) | 0 (0.0%) |
| Total | 2,031 (48.8%) | 2,129 (51.2%) |
Housing Structures by Number of Rooms in Sunbury
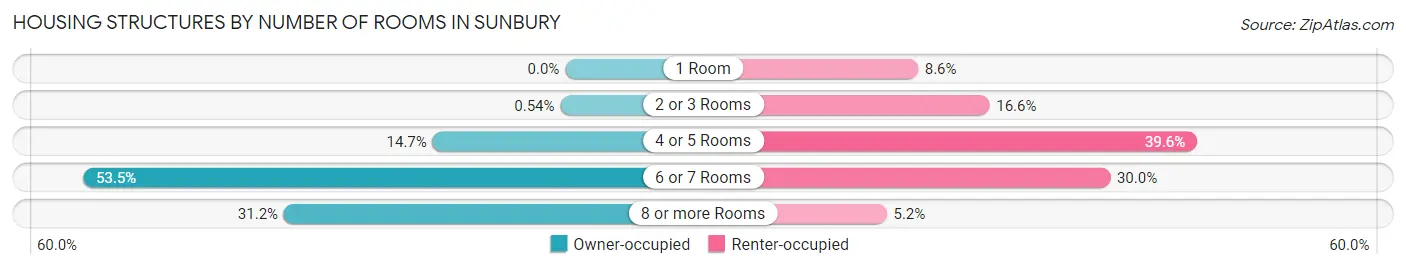
| Number of Rooms | Owner-occupied | Renter-occupied |
| 1 Room | 0 (0.0%) | 184 (8.6%) |
| 2 or 3 Rooms | 11 (0.5%) | 353 (16.6%) |
| 4 or 5 Rooms | 299 (14.7%) | 844 (39.6%) |
| 6 or 7 Rooms | 1,087 (53.5%) | 638 (30.0%) |
| 8 or more Rooms | 634 (31.2%) | 110 (5.2%) |
| Total | 2,031 (100.0%) | 2,129 (100.0%) |
Housing Structure by Heating Type in Sunbury
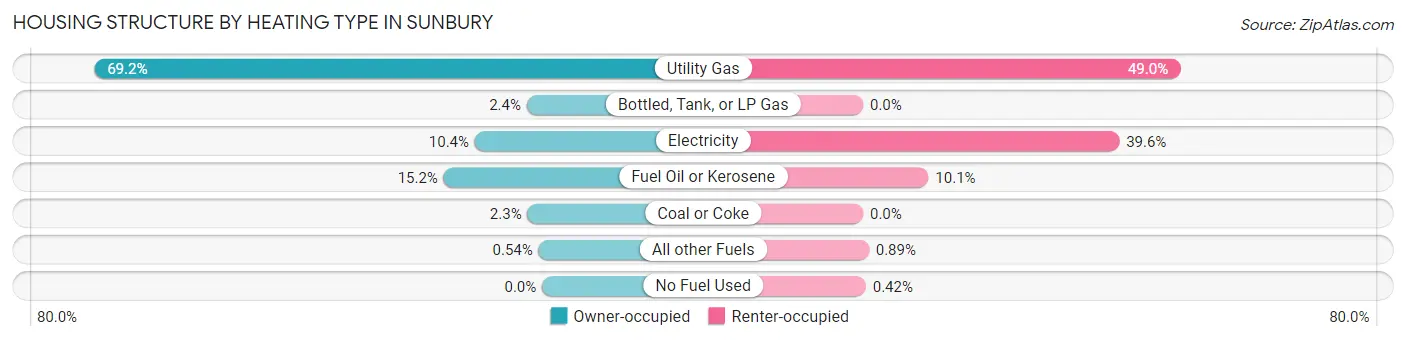
| Heating Type | Owner-occupied | Renter-occupied |
| Utility Gas | 1,406 (69.2%) | 1,043 (49.0%) |
| Bottled, Tank, or LP Gas | 48 (2.4%) | 0 (0.0%) |
| Electricity | 211 (10.4%) | 843 (39.6%) |
| Fuel Oil or Kerosene | 309 (15.2%) | 215 (10.1%) |
| Coal or Coke | 46 (2.3%) | 0 (0.0%) |
| All other Fuels | 11 (0.5%) | 19 (0.9%) |
| No Fuel Used | 0 (0.0%) | 9 (0.4%) |
| Total | 2,031 (100.0%) | 2,129 (100.0%) |
Household Vehicle Usage in Sunbury
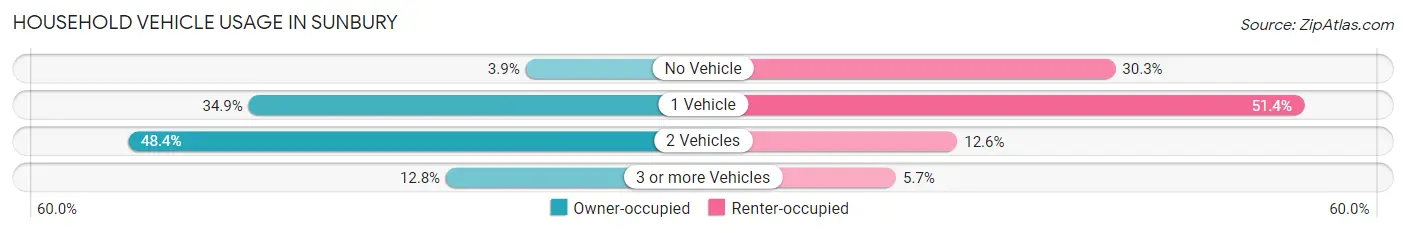
| Vehicles per Household | Owner-occupied | Renter-occupied |
| No Vehicle | 79 (3.9%) | 645 (30.3%) |
| 1 Vehicle | 709 (34.9%) | 1,094 (51.4%) |
| 2 Vehicles | 983 (48.4%) | 268 (12.6%) |
| 3 or more Vehicles | 260 (12.8%) | 122 (5.7%) |
| Total | 2,031 (100.0%) | 2,129 (100.0%) |
Real Estate & Mortgages in Sunbury
Real Estate and Mortgage Overview in Sunbury
| Characteristic | Without Mortgage | With Mortgage |
| Housing Units | 703 | 1,328 |
| Median Property Value | $87,500 | $100,300 |
| Median Household Income | $70,893 | $61 |
| Monthly Housing Costs | $391 | $6 |
| Real Estate Taxes | $1,271 | $11 |
Property Value by Mortgage Status in Sunbury
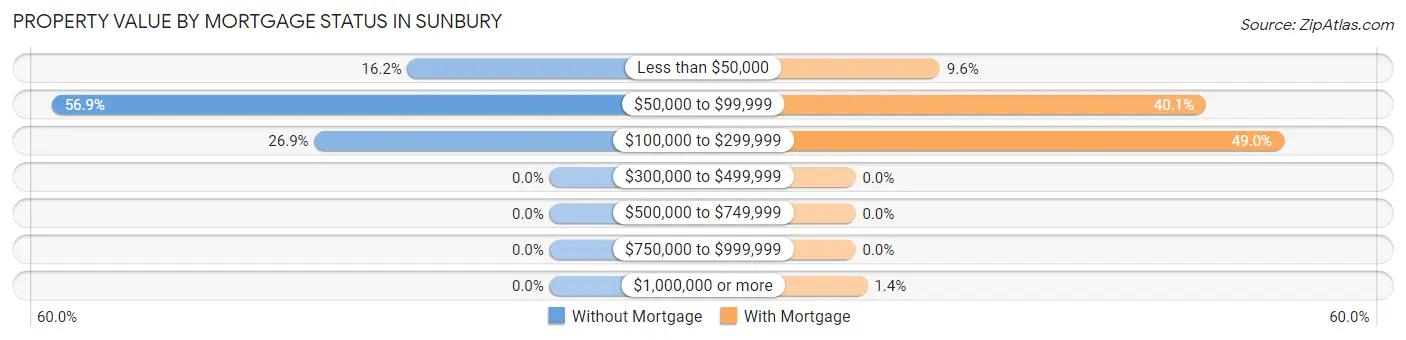
| Property Value | Without Mortgage | With Mortgage |
| Less than $50,000 | 114 (16.2%) | 128 (9.6%) |
| $50,000 to $99,999 | 400 (56.9%) | 532 (40.1%) |
| $100,000 to $299,999 | 189 (26.9%) | 650 (48.9%) |
| $300,000 to $499,999 | 0 (0.0%) | 0 (0.0%) |
| $500,000 to $749,999 | 0 (0.0%) | 0 (0.0%) |
| $750,000 to $999,999 | 0 (0.0%) | 0 (0.0%) |
| $1,000,000 or more | 0 (0.0%) | 18 (1.4%) |
| Total | 703 (100.0%) | 1,328 (100.0%) |
Household Income by Mortgage Status in Sunbury
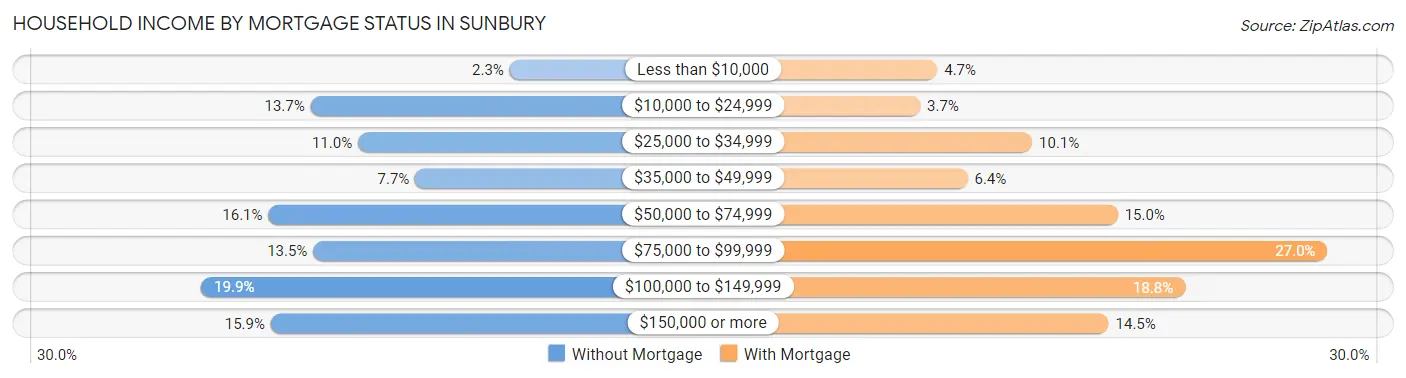
| Household Income | Without Mortgage | With Mortgage |
| Less than $10,000 | 16 (2.3%) | 62 (4.7%) |
| $10,000 to $24,999 | 96 (13.7%) | 49 (3.7%) |
| $25,000 to $34,999 | 77 (11.0%) | 134 (10.1%) |
| $35,000 to $49,999 | 54 (7.7%) | 85 (6.4%) |
| $50,000 to $74,999 | 113 (16.1%) | 199 (15.0%) |
| $75,000 to $99,999 | 95 (13.5%) | 358 (27.0%) |
| $100,000 to $149,999 | 140 (19.9%) | 250 (18.8%) |
| $150,000 or more | 112 (15.9%) | 192 (14.5%) |
| Total | 703 (100.0%) | 1,328 (100.0%) |
Property Value to Household Income Ratio in Sunbury
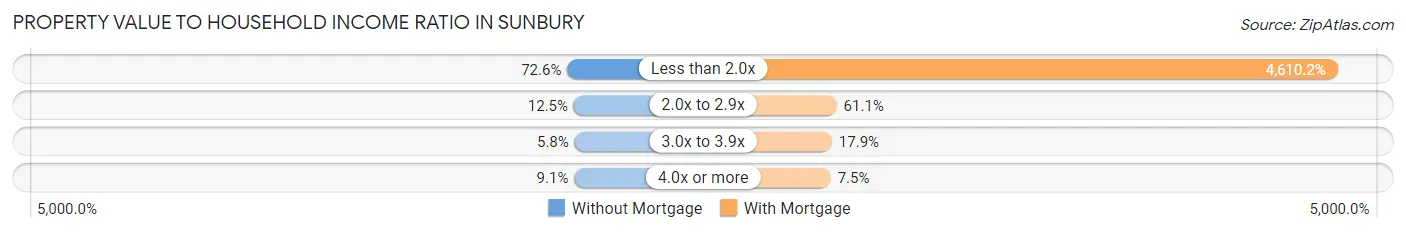
| Value-to-Income Ratio | Without Mortgage | With Mortgage |
| Less than 2.0x | 510 (72.6%) | 61,223 (4,610.2%) |
| 2.0x to 2.9x | 88 (12.5%) | 812 (61.1%) |
| 3.0x to 3.9x | 41 (5.8%) | 238 (17.9%) |
| 4.0x or more | 64 (9.1%) | 100 (7.5%) |
| Total | 703 (100.0%) | 1,328 (100.0%) |
Real Estate Taxes by Mortgage Status in Sunbury
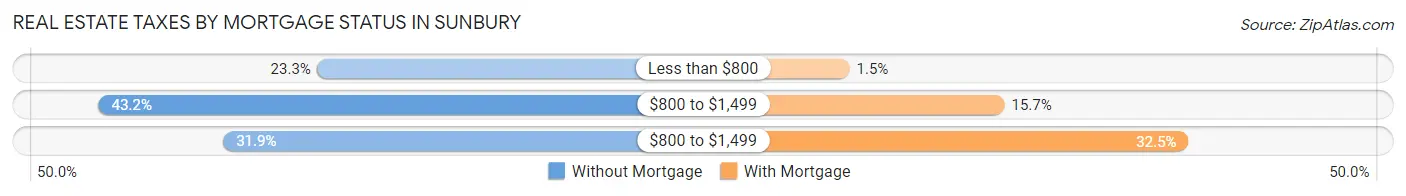
| Property Taxes | Without Mortgage | With Mortgage |
| Less than $800 | 164 (23.3%) | 20 (1.5%) |
| $800 to $1,499 | 304 (43.2%) | 208 (15.7%) |
| $800 to $1,499 | 224 (31.9%) | 431 (32.5%) |
| Total | 703 (100.0%) | 1,328 (100.0%) |
Health & Disability in Sunbury
Health Insurance Coverage by Age in Sunbury
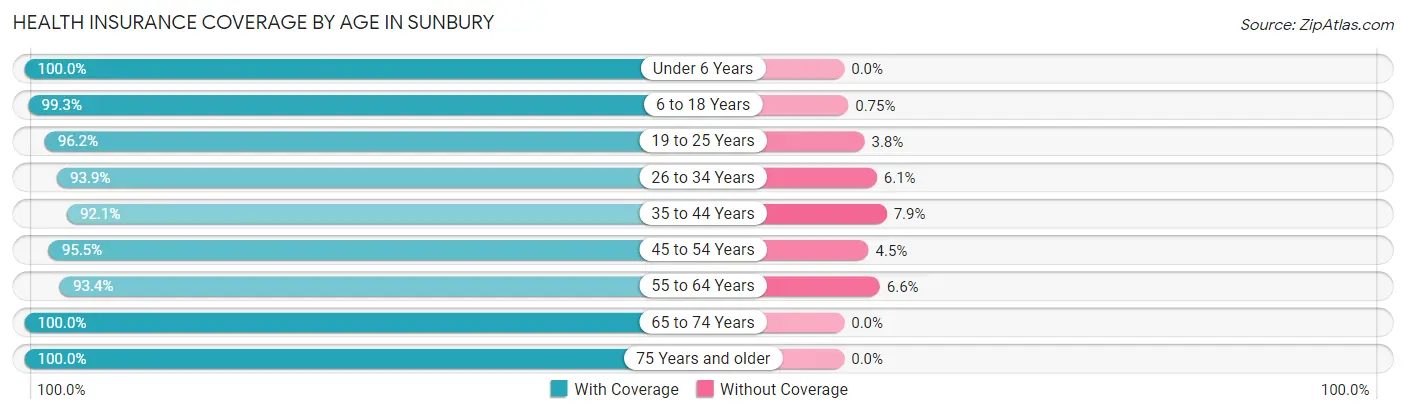
| Age Bracket | With Coverage | Without Coverage |
| Under 6 Years | 837 (100.0%) | 0 (0.0%) |
| 6 to 18 Years | 1,464 (99.3%) | 11 (0.7%) |
| 19 to 25 Years | 920 (96.2%) | 36 (3.8%) |
| 26 to 34 Years | 1,053 (93.9%) | 68 (6.1%) |
| 35 to 44 Years | 768 (92.1%) | 66 (7.9%) |
| 45 to 54 Years | 1,117 (95.5%) | 53 (4.5%) |
| 55 to 64 Years | 1,155 (93.4%) | 82 (6.6%) |
| 65 to 74 Years | 1,076 (100.0%) | 0 (0.0%) |
| 75 Years and older | 783 (100.0%) | 0 (0.0%) |
| Total | 9,173 (96.7%) | 316 (3.3%) |
Health Insurance Coverage by Citizenship Status in Sunbury
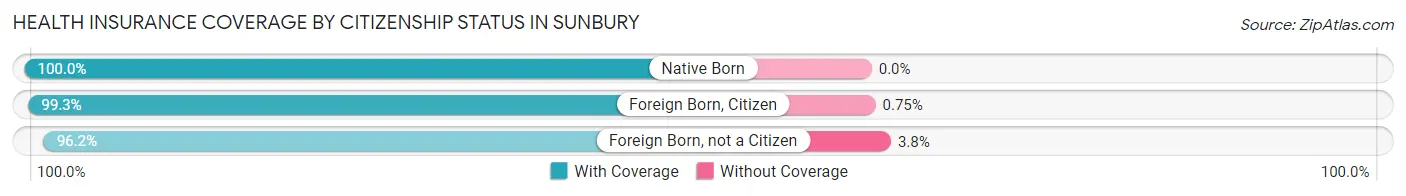
| Citizenship Status | With Coverage | Without Coverage |
| Native Born | 837 (100.0%) | 0 (0.0%) |
| Foreign Born, Citizen | 1,464 (99.3%) | 11 (0.7%) |
| Foreign Born, not a Citizen | 920 (96.2%) | 36 (3.8%) |
Health Insurance Coverage by Household Income in Sunbury
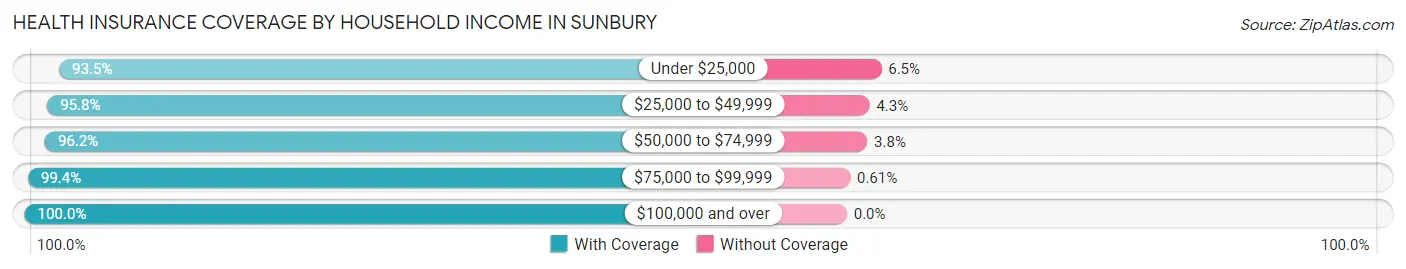
| Household Income | With Coverage | Without Coverage |
| Under $25,000 | 1,997 (93.5%) | 138 (6.5%) |
| $25,000 to $49,999 | 2,188 (95.8%) | 97 (4.3%) |
| $50,000 to $74,999 | 1,837 (96.2%) | 73 (3.8%) |
| $75,000 to $99,999 | 1,295 (99.4%) | 8 (0.6%) |
| $100,000 and over | 1,781 (100.0%) | 0 (0.0%) |
Public vs Private Health Insurance Coverage by Age in Sunbury
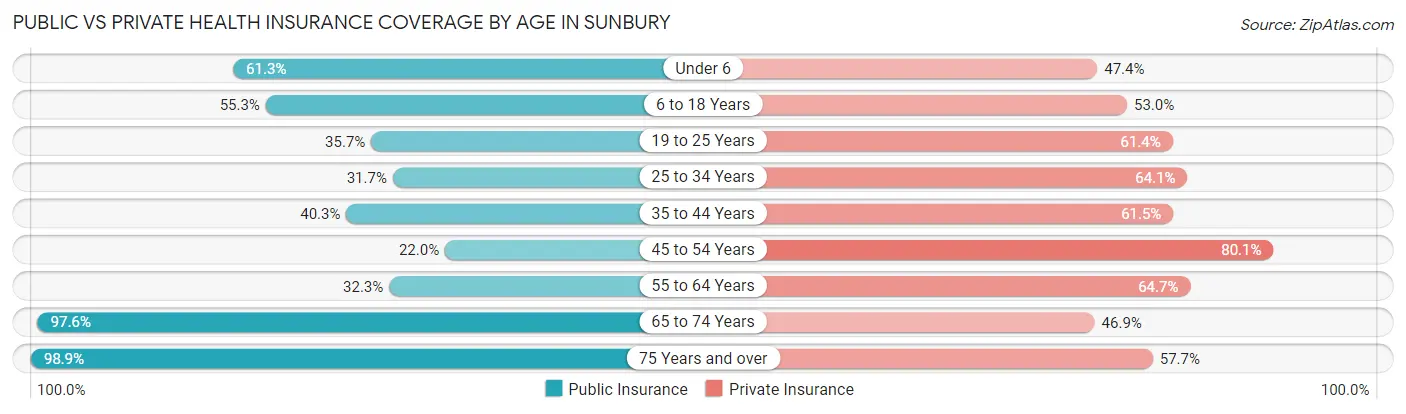
| Age Bracket | Public Insurance | Private Insurance |
| Under 6 | 513 (61.3%) | 397 (47.4%) |
| 6 to 18 Years | 815 (55.2%) | 781 (52.9%) |
| 19 to 25 Years | 341 (35.7%) | 587 (61.4%) |
| 25 to 34 Years | 355 (31.7%) | 719 (64.1%) |
| 35 to 44 Years | 336 (40.3%) | 513 (61.5%) |
| 45 to 54 Years | 257 (22.0%) | 937 (80.1%) |
| 55 to 64 Years | 400 (32.3%) | 800 (64.7%) |
| 65 to 74 Years | 1,050 (97.6%) | 505 (46.9%) |
| 75 Years and over | 774 (98.9%) | 452 (57.7%) |
| Total | 4,841 (51.0%) | 5,691 (60.0%) |
Disability Status by Sex by Age in Sunbury
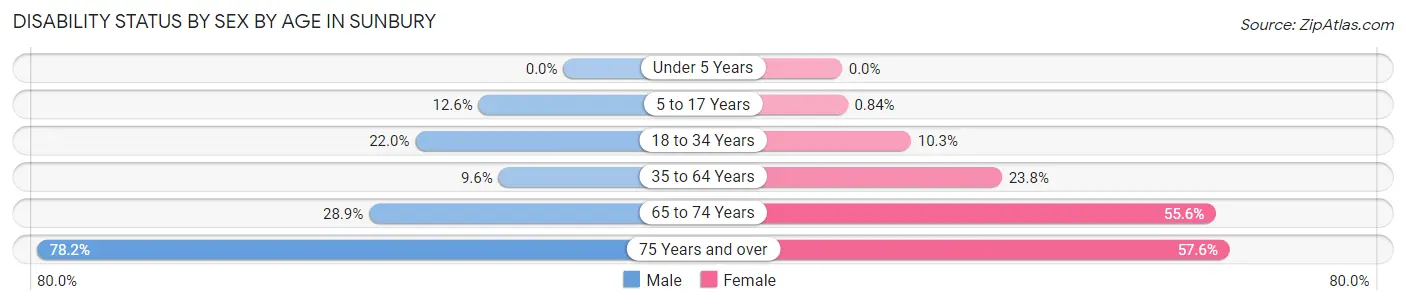
| Age Bracket | Male | Female |
| Under 5 Years | 0 (0.0%) | 0 (0.0%) |
| 5 to 17 Years | 90 (12.6%) | 8 (0.8%) |
| 18 to 34 Years | 223 (22.0%) | 125 (10.2%) |
| 35 to 64 Years | 138 (9.6%) | 429 (23.7%) |
| 65 to 74 Years | 163 (28.8%) | 284 (55.6%) |
| 75 Years and over | 201 (78.2%) | 303 (57.6%) |
Disability Class by Sex by Age in Sunbury
Disability Class: Hearing Difficulty
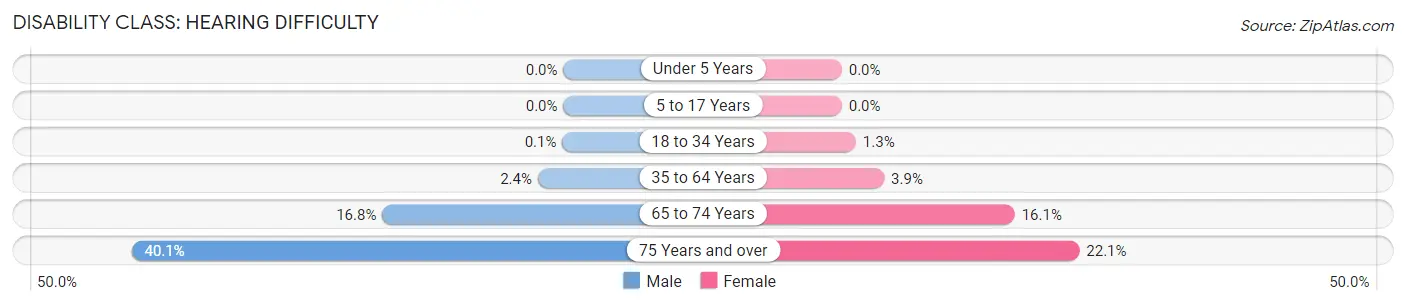
| Age Bracket | Male | Female |
| Under 5 Years | 0 (0.0%) | 0 (0.0%) |
| 5 to 17 Years | 0 (0.0%) | 0 (0.0%) |
| 18 to 34 Years | 1 (0.1%) | 16 (1.3%) |
| 35 to 64 Years | 34 (2.4%) | 71 (3.9%) |
| 65 to 74 Years | 95 (16.8%) | 82 (16.1%) |
| 75 Years and over | 103 (40.1%) | 116 (22.1%) |
Disability Class: Vision Difficulty
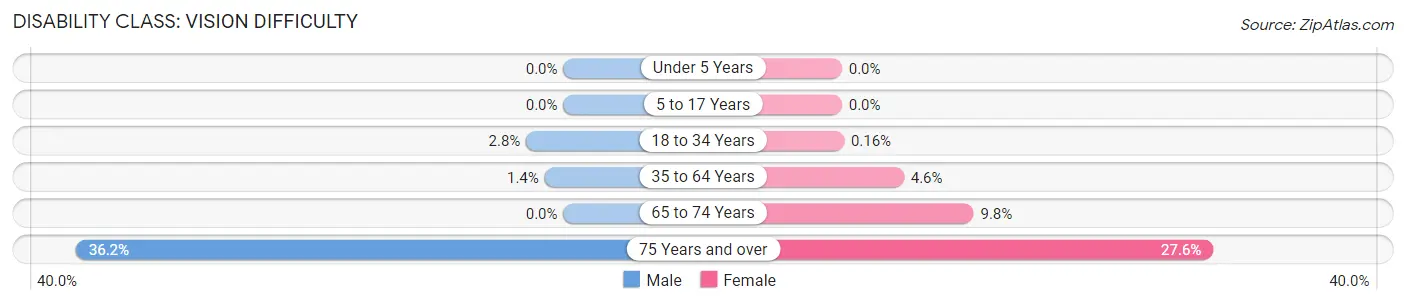
| Age Bracket | Male | Female |
| Under 5 Years | 0 (0.0%) | 0 (0.0%) |
| 5 to 17 Years | 0 (0.0%) | 0 (0.0%) |
| 18 to 34 Years | 28 (2.8%) | 2 (0.2%) |
| 35 to 64 Years | 20 (1.4%) | 83 (4.6%) |
| 65 to 74 Years | 0 (0.0%) | 50 (9.8%) |
| 75 Years and over | 93 (36.2%) | 145 (27.6%) |
Disability Class: Cognitive Difficulty
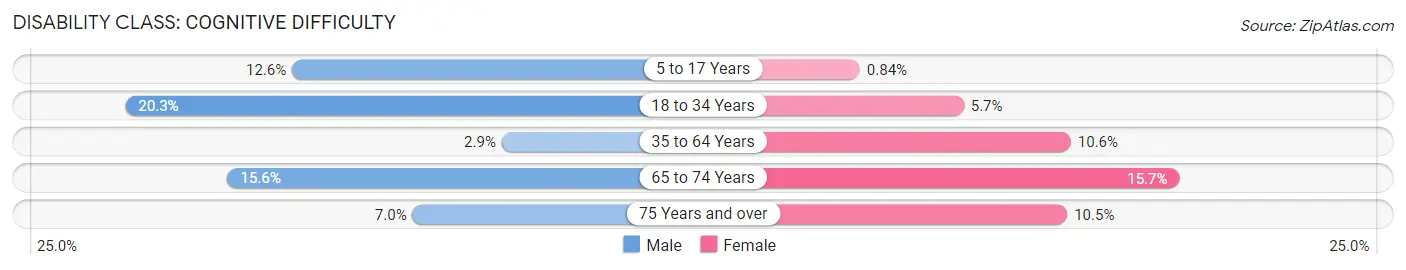
| Age Bracket | Male | Female |
| 5 to 17 Years | 90 (12.6%) | 8 (0.8%) |
| 18 to 34 Years | 206 (20.3%) | 69 (5.7%) |
| 35 to 64 Years | 41 (2.9%) | 192 (10.6%) |
| 65 to 74 Years | 88 (15.6%) | 80 (15.7%) |
| 75 Years and over | 18 (7.0%) | 55 (10.5%) |
Disability Class: Ambulatory Difficulty
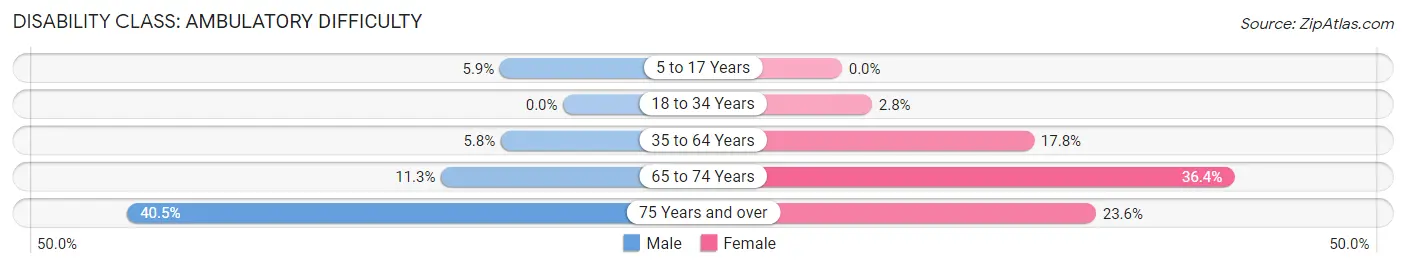
| Age Bracket | Male | Female |
| 5 to 17 Years | 42 (5.9%) | 0 (0.0%) |
| 18 to 34 Years | 0 (0.0%) | 34 (2.8%) |
| 35 to 64 Years | 83 (5.8%) | 322 (17.8%) |
| 65 to 74 Years | 64 (11.3%) | 186 (36.4%) |
| 75 Years and over | 104 (40.5%) | 124 (23.6%) |
Disability Class: Self-Care Difficulty
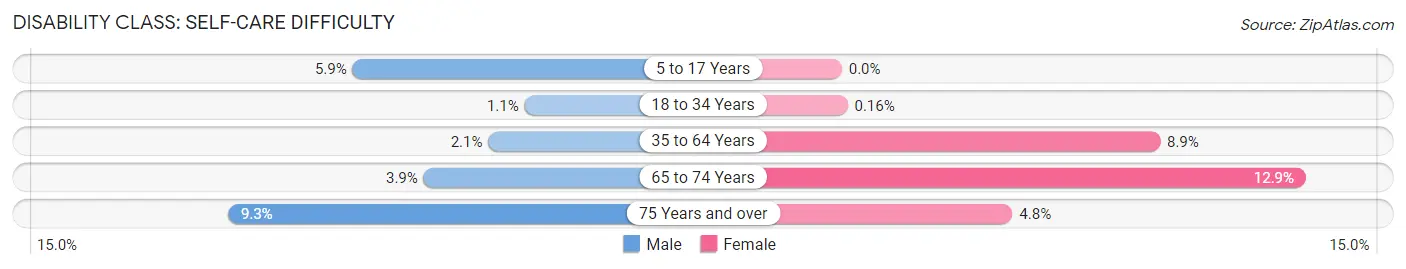
| Age Bracket | Male | Female |
| 5 to 17 Years | 42 (5.9%) | 0 (0.0%) |
| 18 to 34 Years | 11 (1.1%) | 2 (0.2%) |
| 35 to 64 Years | 30 (2.1%) | 160 (8.9%) |
| 65 to 74 Years | 22 (3.9%) | 66 (12.9%) |
| 75 Years and over | 24 (9.3%) | 25 (4.8%) |
Technology Access in Sunbury
Computing Device Access in Sunbury
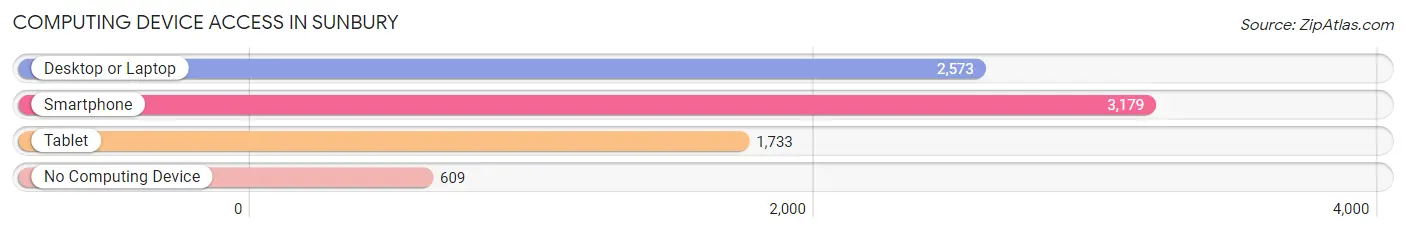
| Device Type | # Households | % Households |
| Desktop or Laptop | 2,573 | 61.9% |
| Smartphone | 3,179 | 76.4% |
| Tablet | 1,733 | 41.7% |
| No Computing Device | 609 | 14.6% |
| Total | 4,160 | 100.0% |
Internet Access in Sunbury
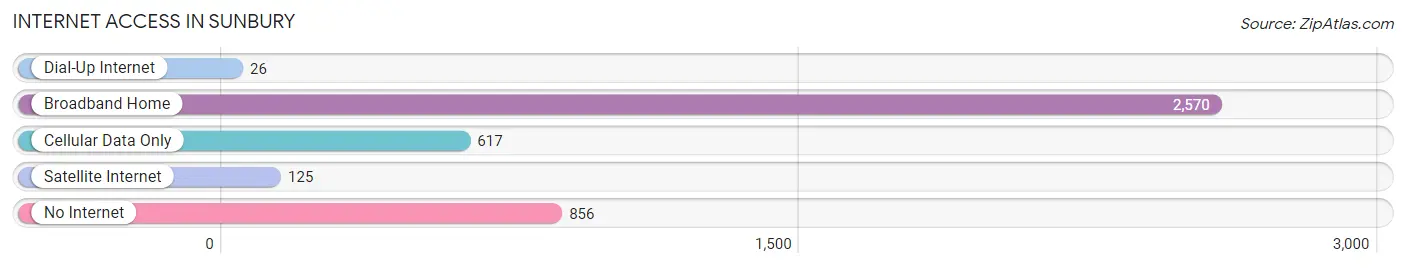
| Internet Type | # Households | % Households |
| Dial-Up Internet | 26 | 0.6% |
| Broadband Home | 2,570 | 61.8% |
| Cellular Data Only | 617 | 14.8% |
| Satellite Internet | 125 | 3.0% |
| No Internet | 856 | 20.6% |
| Total | 4,160 | 100.0% |
Sunbury Summary
History
The history of Sunbury, Pennsylvania dates back to the late 1700s when the area was first settled by Europeans. The first settlers were German immigrants who arrived in the area in 1772. The town was originally known as “Stoever’s Ferry” after the first settler, John Stoever. The town was officially incorporated in 1831 and was renamed Sunbury in honor of the Sunbury family who had settled in the area in the early 1800s.
The town of Sunbury was an important stop on the Susquehanna and Tidewater Canal, which opened in 1834. The canal was a major transportation route for goods and people between Philadelphia and the Susquehanna River. The canal was a major economic driver for the town and helped to spur growth and development.
The town of Sunbury was also an important stop on the Underground Railroad. The town was a safe haven for escaped slaves and was home to several prominent abolitionists. Sunbury was also the site of the first public school in Northumberland County, which opened in 1836.
Geography
Sunbury is located in Northumberland County, Pennsylvania. The town is situated on the west bank of the Susquehanna River, approximately 40 miles north of Harrisburg. The town is located in the Ridge and Valley region of the Appalachian Mountains and is surrounded by rolling hills and valleys.
The climate in Sunbury is humid continental, with hot summers and cold winters. The average annual temperature is around 50 degrees Fahrenheit. The average annual precipitation is around 40 inches.
Economy
The economy of Sunbury is largely based on manufacturing and services. The town is home to several manufacturing companies, including a paper mill, a steel mill, and a plastics factory. The town is also home to several service-based businesses, including a hospital, a bank, and a number of retail stores.
The town is also home to several educational institutions, including a community college and a technical school. The town is also home to a number of tourist attractions, including a historic district, a museum, and a number of parks and recreational areas.
Demographics
As of the 2010 census, the population of Sunbury was 9,905. The racial makeup of the town was 90.3% White, 5.3% African American, 0.4% Native American, 0.7% Asian, 0.1% Pacific Islander, and 2.2% from other races. The median household income was $37,945 and the median family income was $45,945. The per capita income was $20,945.
Sunbury is home to a diverse population, with a variety of religious and ethnic backgrounds. The town is home to a large Amish community, as well as a large Hispanic population. The town is also home to a number of churches, including Catholic, Lutheran, and Methodist.
Common Questions
What is Per Capita Income in Sunbury?
Per Capita income in Sunbury is $24,586.
What is the Median Family Income in Sunbury?
Median Family Income in Sunbury is $54,619.
What is the Median Household income in Sunbury?
Median Household Income in Sunbury is $42,238.
What is Income or Wage Gap in Sunbury?
Income or Wage Gap in Sunbury is 24.9%.
Women in Sunbury earn 75.1 cents for every dollar earned by a man.
What is Family Income Deficit in Sunbury?
Family Income Deficit in Sunbury is $8,834.
Families that are below poverty line in Sunbury earn $8,834 less on average than the poverty threshold level.
What is Inequality or Gini Index in Sunbury?
Inequality or Gini Index in Sunbury is 0.45.
What is the Total Population of Sunbury?
Total Population of Sunbury is 9,680.
What is the Total Male Population of Sunbury?
Total Male Population of Sunbury is 4,323.
What is the Total Female Population of Sunbury?
Total Female Population of Sunbury is 5,357.
What is the Ratio of Males per 100 Females in Sunbury?
There are 80.70 Males per 100 Females in Sunbury.
What is the Ratio of Females per 100 Males in Sunbury?
There are 123.92 Females per 100 Males in Sunbury.
What is the Median Population Age in Sunbury?
Median Population Age in Sunbury is 40.4 Years.
What is the Average Family Size in Sunbury
Average Family Size in Sunbury is 2.8 People.
What is the Average Household Size in Sunbury
Average Household Size in Sunbury is 2.3 People.
How Large is the Labor Force in Sunbury?
There are 4,437 People in the Labor Forcein in Sunbury.
What is the Percentage of People in the Labor Force in Sunbury?
57.4% of People are in the Labor Force in Sunbury.
What is the Unemployment Rate in Sunbury?
Unemployment Rate in Sunbury is 5.5%.