Shamokin, PA Map & Demographics
Shamokin Map
Shamokin Overview
$21,579
PER CAPITA INCOME
$38,616
AVG FAMILY INCOME
$32,753
AVG HOUSEHOLD INCOME
52.3%
WAGE / INCOME GAP [ % ]
47.7¢/ $1
WAGE / INCOME GAP [ $ ]
0.51
INEQUALITY / GINI INDEX
6,915
TOTAL POPULATION
3,501
MALE POPULATION
3,414
FEMALE POPULATION
102.55
MALES / 100 FEMALES
97.51
FEMALES / 100 MALES
38.1
MEDIAN AGE
3.2
AVG FAMILY SIZE
2.4
AVG HOUSEHOLD SIZE
3,042
LABOR FORCE [ PEOPLE ]
57.5%
PERCENT IN LABOR FORCE
8.7%
UNEMPLOYMENT RATE
Shamokin Zip Codes
Shamokin Area Codes
Income in Shamokin
Income Overview in Shamokin
Per Capita Income in Shamokin is $21,579, while median incomes of families and households are $38,616 and $32,753 respectively.
| Characteristic | Number | Measure |
| Per Capita Income | 6,915 | $21,579 |
| Median Family Income | 1,575 | $38,616 |
| Mean Family Income | 1,575 | $60,147 |
| Median Household Income | 2,872 | $32,753 |
| Mean Household Income | 2,872 | $50,113 |
| Income Deficit | 1,575 | $0 |
| Wage / Income Gap (%) | 6,915 | 52.30% |
| Wage / Income Gap ($) | 6,915 | 47.70¢ per $1 |
| Gini / Inequality Index | 6,915 | 0.51 |
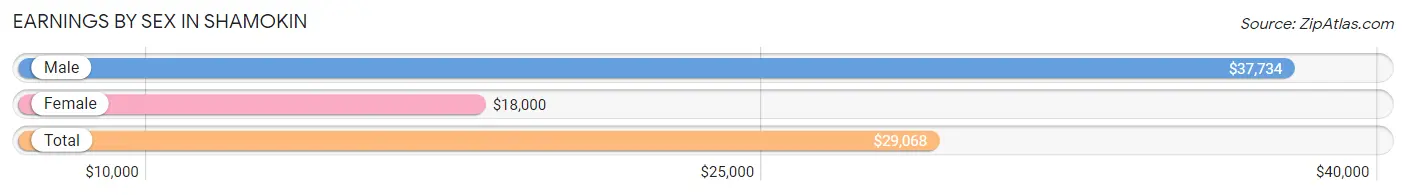
Earnings by Sex in Shamokin
Average Earnings in Shamokin are $29,068, $37,734 for men and $18,000 for women, a difference of 52.3%.
| Sex | Number | Average Earnings |
| Male | 1,490 (48.4%) | $37,734 |
| Female | 1,590 (51.6%) | $18,000 |
| Total | 3,080 (100.0%) | $29,068 |
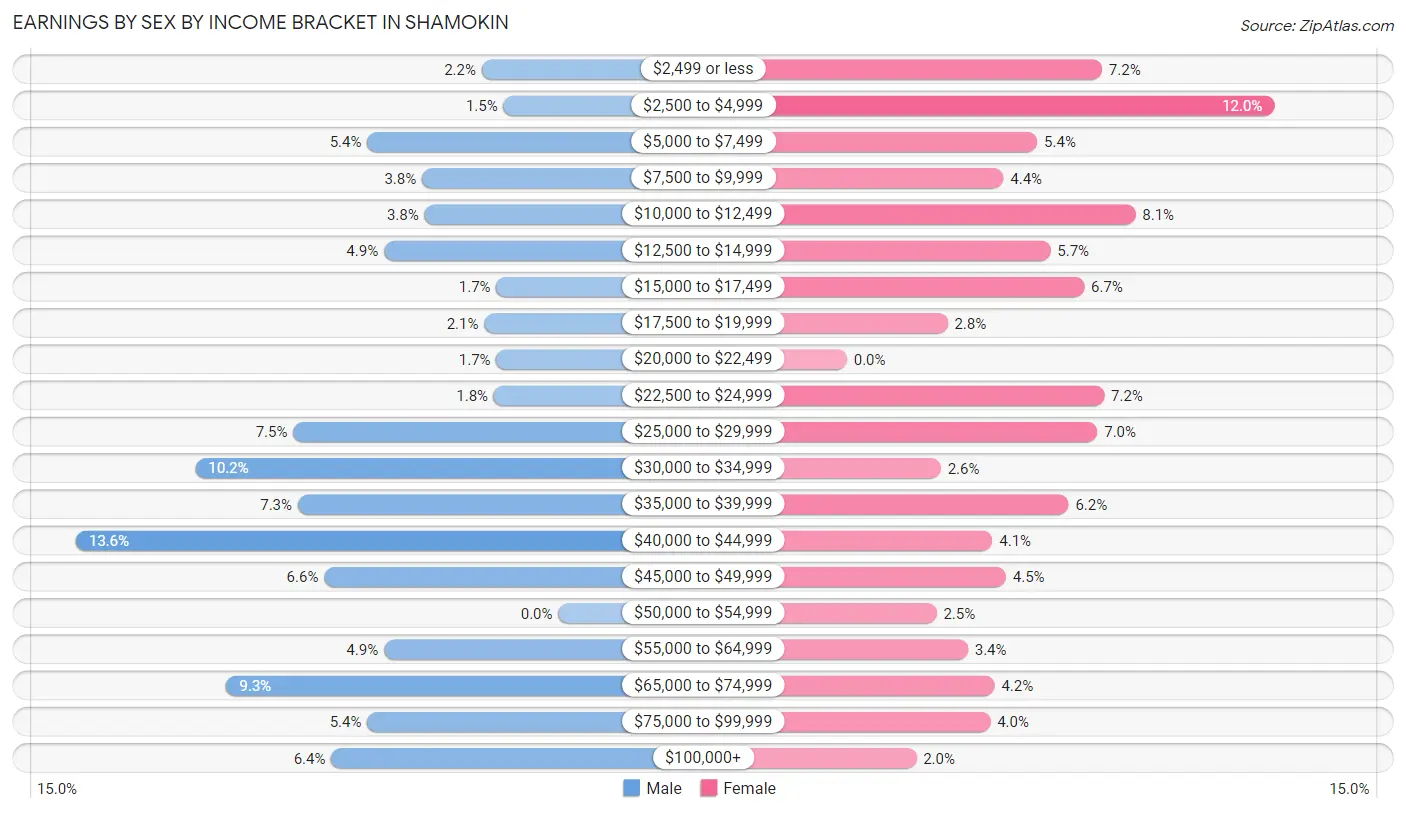
Earnings by Sex by Income Bracket in Shamokin
The most common earnings brackets in Shamokin are $40,000 to $44,999 for men (202 | 13.6%) and $2,500 to $4,999 for women (191 | 12.0%).
| Income | Male | Female |
| $2,499 or less | 32 (2.1%) | 114 (7.2%) |
| $2,500 to $4,999 | 23 (1.5%) | 191 (12.0%) |
| $5,000 to $7,499 | 80 (5.4%) | 85 (5.3%) |
| $7,500 to $9,999 | 57 (3.8%) | 70 (4.4%) |
| $10,000 to $12,499 | 56 (3.8%) | 129 (8.1%) |
| $12,500 to $14,999 | 73 (4.9%) | 91 (5.7%) |
| $15,000 to $17,499 | 26 (1.7%) | 106 (6.7%) |
| $17,500 to $19,999 | 31 (2.1%) | 45 (2.8%) |
| $20,000 to $22,499 | 26 (1.7%) | 0 (0.0%) |
| $22,500 to $24,999 | 27 (1.8%) | 115 (7.2%) |
| $25,000 to $29,999 | 111 (7.4%) | 112 (7.0%) |
| $30,000 to $34,999 | 152 (10.2%) | 42 (2.6%) |
| $35,000 to $39,999 | 109 (7.3%) | 99 (6.2%) |
| $40,000 to $44,999 | 202 (13.6%) | 65 (4.1%) |
| $45,000 to $49,999 | 98 (6.6%) | 71 (4.5%) |
| $50,000 to $54,999 | 0 (0.0%) | 40 (2.5%) |
| $55,000 to $64,999 | 73 (4.9%) | 54 (3.4%) |
| $65,000 to $74,999 | 139 (9.3%) | 66 (4.2%) |
| $75,000 to $99,999 | 80 (5.4%) | 64 (4.0%) |
| $100,000+ | 95 (6.4%) | 31 (1.9%) |
| Total | 1,490 (100.0%) | 1,590 (100.0%) |
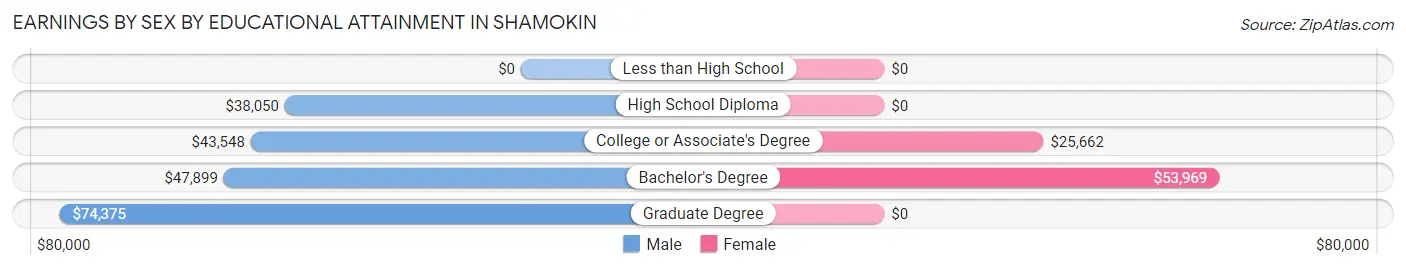
Earnings by Sex by Educational Attainment in Shamokin
Average earnings in Shamokin are $41,295 for men and $24,328 for women, a difference of 41.1%. Men with an educational attainment of graduate degree enjoy the highest average annual earnings of $74,375, while those with high school diploma education earn the least with $38,050. Women with an educational attainment of bachelor's degree earn the most with the average annual earnings of $53,969, while those with college or associate's degree education have the smallest earnings of $25,662.
| Educational Attainment | Male Income | Female Income |
| Less than High School | - | - |
| High School Diploma | $38,050 | $0 |
| College or Associate's Degree | $43,548 | $25,662 |
| Bachelor's Degree | $47,899 | $53,969 |
| Graduate Degree | $74,375 | $0 |
| Total | $41,295 | $24,328 |
Family Income in Shamokin
Family Income Brackets in Shamokin
According to the Shamokin family income data, there are 299 families falling into the $15,000 to $24,999 income range, which is the most common income bracket and makes up 19.0% of all families. Conversely, the $200,000+ income bracket is the least frequent group with only 24 families (1.5%) belonging to this category.
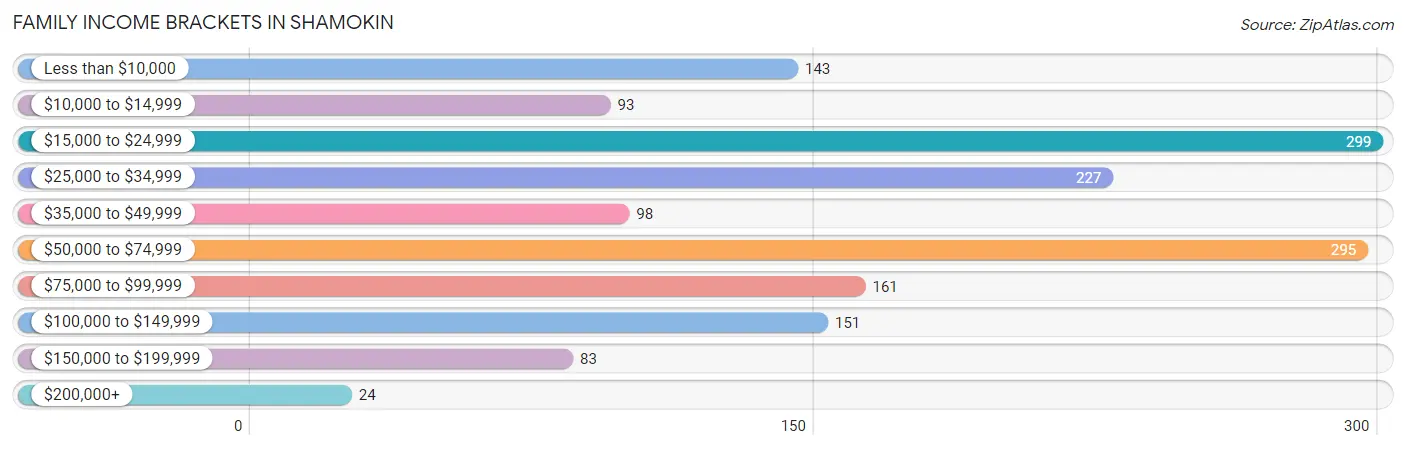
| Income Bracket | # Families | % Families |
| Less than $10,000 | 143 | 9.1% |
| $10,000 to $14,999 | 93 | 5.9% |
| $15,000 to $24,999 | 299 | 19.0% |
| $25,000 to $34,999 | 227 | 14.4% |
| $35,000 to $49,999 | 98 | 6.2% |
| $50,000 to $74,999 | 295 | 18.7% |
| $75,000 to $99,999 | 161 | 10.2% |
| $100,000 to $149,999 | 151 | 9.6% |
| $150,000 to $199,999 | 83 | 5.3% |
| $200,000+ | 24 | 1.5% |
Family Income by Famaliy Size in Shamokin
7+ person families (40 | 2.5%) account for the highest median family income in Shamokin with $123,958 per family, while 2-person families (720 | 45.7%) have the highest median income of $22,728 per family member.
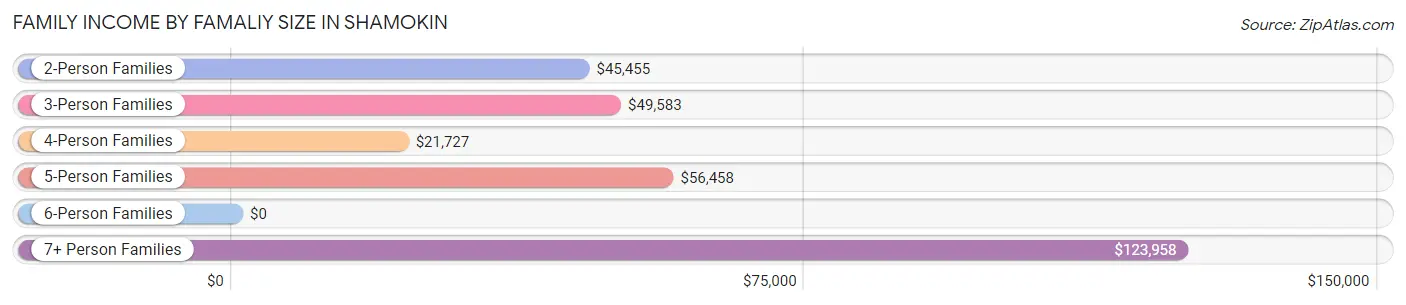
| Income Bracket | # Families | Median Income |
| 2-Person Families | 720 (45.7%) | $45,455 |
| 3-Person Families | 377 (23.9%) | $49,583 |
| 4-Person Families | 274 (17.4%) | $21,727 |
| 5-Person Families | 110 (7.0%) | $56,458 |
| 6-Person Families | 54 (3.4%) | $0 |
| 7+ Person Families | 40 (2.5%) | $123,958 |
| Total | 1,575 (100.0%) | $38,616 |
Family Income by Number of Earners in Shamokin
The median family income in Shamokin is $38,616, with families comprising 2 earners (462) having the highest median family income of $95,500, while families with no earners (274) have the lowest median family income of $21,273, accounting for 29.3% and 17.4% of families, respectively.
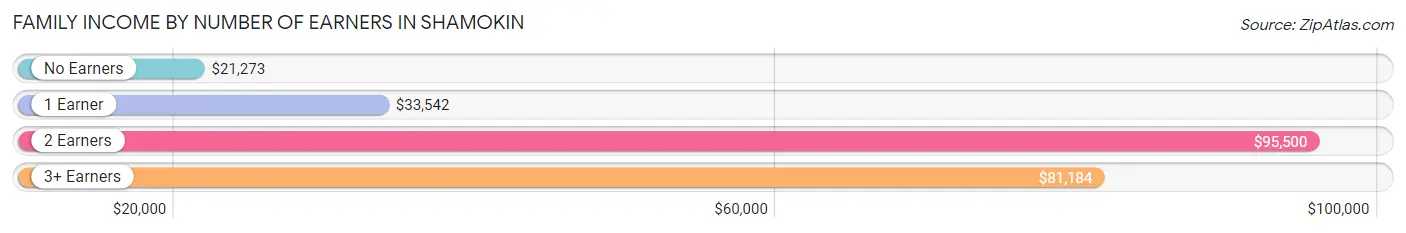
| Number of Earners | # Families | Median Income |
| No Earners | 274 (17.4%) | $21,273 |
| 1 Earner | 651 (41.3%) | $33,542 |
| 2 Earners | 462 (29.3%) | $95,500 |
| 3+ Earners | 188 (11.9%) | $81,184 |
| Total | 1,575 (100.0%) | $38,616 |
Household Income in Shamokin
Household Income Brackets in Shamokin
With 526 households falling in the category, the $15,000 to $24,999 income range is the most frequent in Shamokin, accounting for 18.3% of all households. In contrast, only 46 households (1.6%) fall into the $200,000+ income bracket, making it the least populous group.
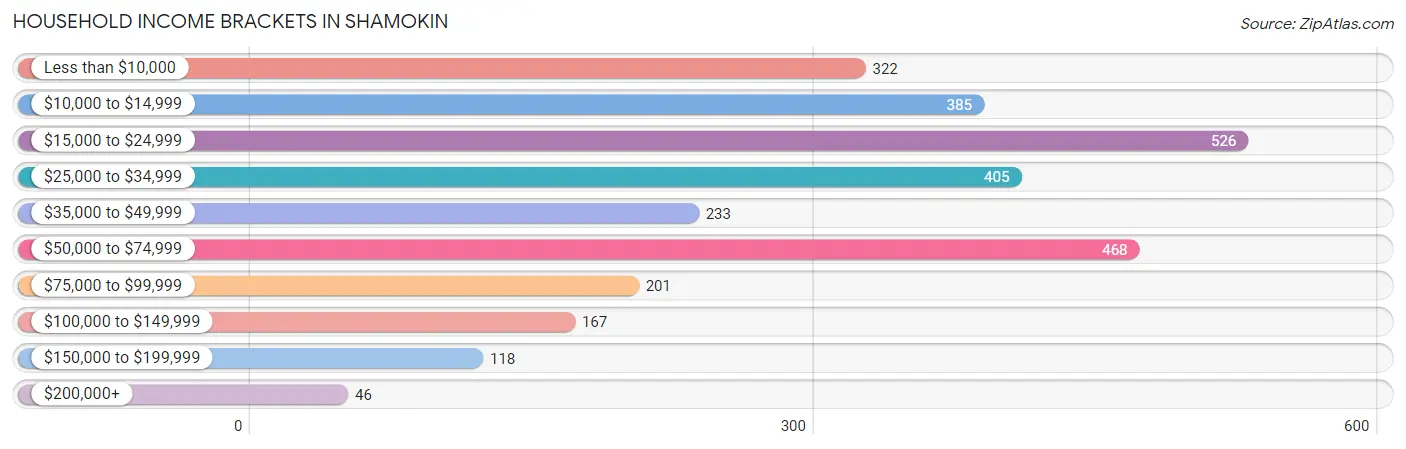
| Income Bracket | # Households | % Households |
| Less than $10,000 | 322 | 11.2% |
| $10,000 to $14,999 | 385 | 13.4% |
| $15,000 to $24,999 | 526 | 18.3% |
| $25,000 to $34,999 | 405 | 14.1% |
| $35,000 to $49,999 | 233 | 8.1% |
| $50,000 to $74,999 | 468 | 16.3% |
| $75,000 to $99,999 | 201 | 7.0% |
| $100,000 to $149,999 | 167 | 5.8% |
| $150,000 to $199,999 | 118 | 4.1% |
| $200,000+ | 46 | 1.6% |
Household Income by Householder Age in Shamokin
The median household income in Shamokin is $32,753, with the highest median household income of $49,907 found in the 45 to 64 years age bracket for the primary householder. A total of 1,052 households (36.6%) fall into this category. Meanwhile, the 15 to 24 years age bracket for the primary householder has the lowest median household income of $0, with 81 households (2.8%) in this group.
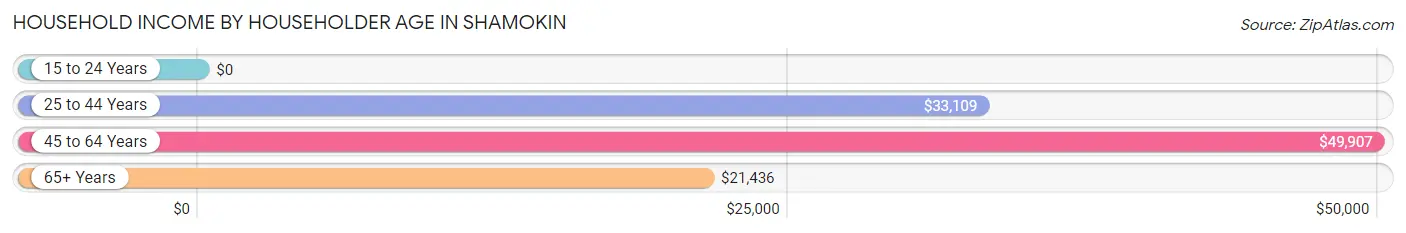
| Income Bracket | # Households | Median Income |
| 15 to 24 Years | 81 (2.8%) | $0 |
| 25 to 44 Years | 898 (31.3%) | $33,109 |
| 45 to 64 Years | 1,052 (36.6%) | $49,907 |
| 65+ Years | 841 (29.3%) | $21,436 |
| Total | 2,872 (100.0%) | $32,753 |
Poverty in Shamokin
Income Below Poverty by Sex and Age in Shamokin
With 31.8% poverty level for males and 40.1% for females among the residents of Shamokin, under 5 year old males and under 5 year old females are the most vulnerable to poverty, with 136 males (50.4%) and 187 females (87.8%) in their respective age groups living below the poverty level.
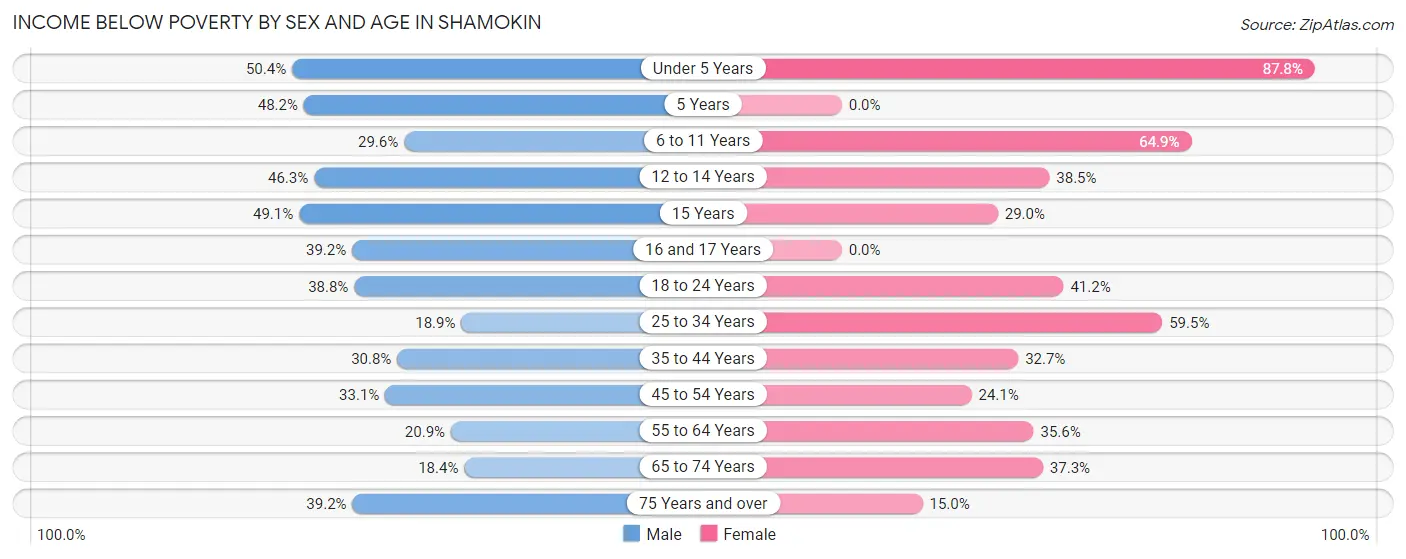
| Age Bracket | Male | Female |
| Under 5 Years | 136 (50.4%) | 187 (87.8%) |
| 5 Years | 66 (48.2%) | 0 (0.0%) |
| 6 to 11 Years | 102 (29.6%) | 194 (64.9%) |
| 12 to 14 Years | 56 (46.3%) | 42 (38.5%) |
| 15 Years | 26 (49.1%) | 22 (28.9%) |
| 16 and 17 Years | 40 (39.2%) | 0 (0.0%) |
| 18 to 24 Years | 92 (38.8%) | 165 (41.1%) |
| 25 to 34 Years | 82 (18.9%) | 160 (59.5%) |
| 35 to 44 Years | 140 (30.8%) | 183 (32.7%) |
| 45 to 54 Years | 174 (33.1%) | 119 (24.1%) |
| 55 to 64 Years | 72 (20.9%) | 126 (35.6%) |
| 65 to 74 Years | 53 (18.4%) | 140 (37.3%) |
| 75 Years and over | 74 (39.2%) | 31 (15.0%) |
| Total | 1,113 (31.8%) | 1,369 (40.1%) |
Income Above Poverty by Sex and Age in Shamokin
According to the poverty statistics in Shamokin, males aged 65 to 74 years and females aged 16 and 17 years are the age groups that are most secure financially, with 81.6% of males and 100.0% of females in these age groups living above the poverty line.
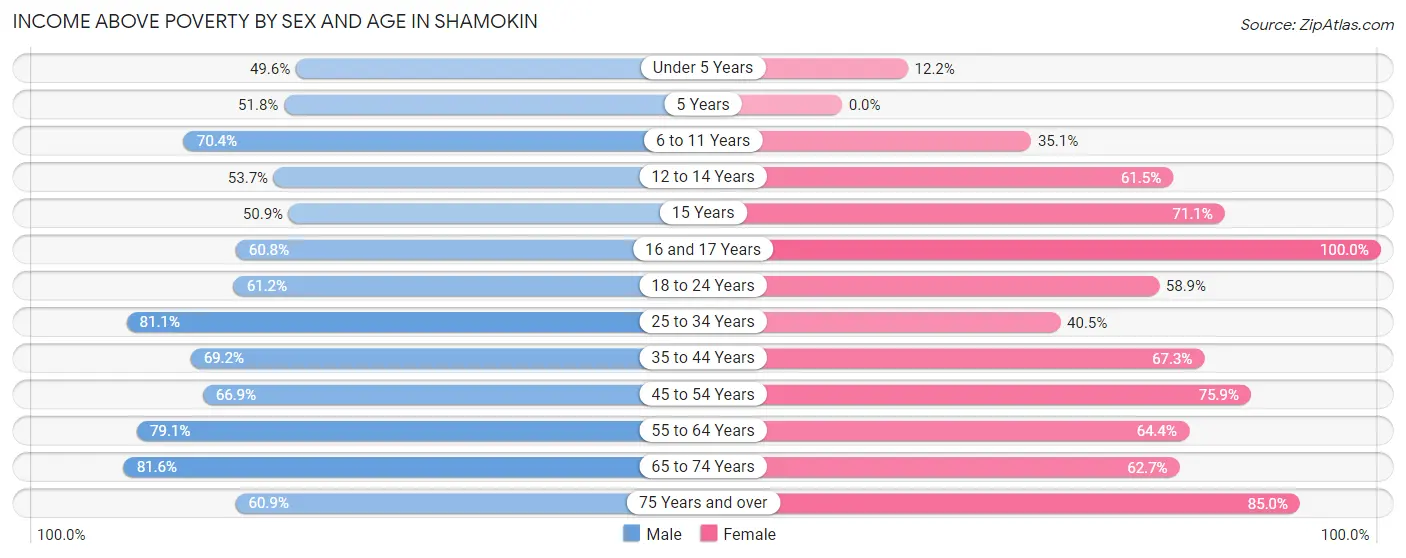
| Age Bracket | Male | Female |
| Under 5 Years | 134 (49.6%) | 26 (12.2%) |
| 5 Years | 71 (51.8%) | 0 (0.0%) |
| 6 to 11 Years | 243 (70.4%) | 105 (35.1%) |
| 12 to 14 Years | 65 (53.7%) | 67 (61.5%) |
| 15 Years | 27 (50.9%) | 54 (71.1%) |
| 16 and 17 Years | 62 (60.8%) | 58 (100.0%) |
| 18 to 24 Years | 145 (61.2%) | 236 (58.9%) |
| 25 to 34 Years | 351 (81.1%) | 109 (40.5%) |
| 35 to 44 Years | 314 (69.2%) | 376 (67.3%) |
| 45 to 54 Years | 352 (66.9%) | 375 (75.9%) |
| 55 to 64 Years | 273 (79.1%) | 228 (64.4%) |
| 65 to 74 Years | 235 (81.6%) | 235 (62.7%) |
| 75 Years and over | 115 (60.9%) | 176 (85.0%) |
| Total | 2,387 (68.2%) | 2,045 (59.9%) |
Income Below Poverty Among Married-Couple Families in Shamokin
The poverty statistics for married-couple families in Shamokin show that 12.7% or 106 of the total 832 families live below the poverty line. Families with 3 or 4 children have the highest poverty rate of 36.0%, comprising of 9 families. On the other hand, families with 5 or more children have the lowest poverty rate of 0.0%, which includes 0 families.
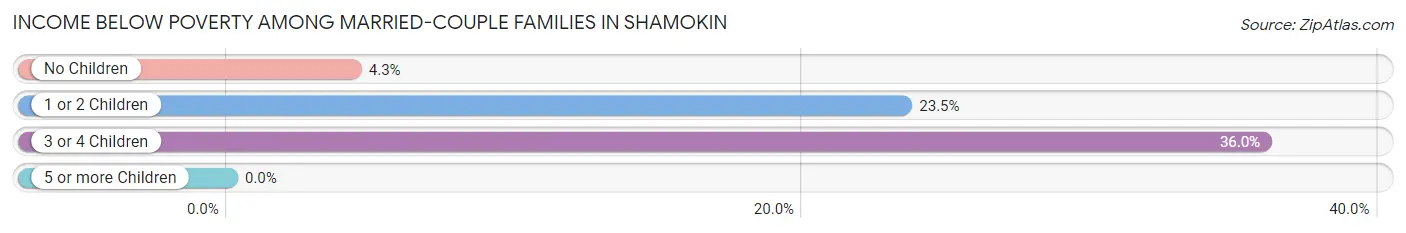
| Children | Above Poverty | Below Poverty |
| No Children | 444 (95.7%) | 20 (4.3%) |
| 1 or 2 Children | 251 (76.5%) | 77 (23.5%) |
| 3 or 4 Children | 16 (64.0%) | 9 (36.0%) |
| 5 or more Children | 15 (100.0%) | 0 (0.0%) |
| Total | 726 (87.3%) | 106 (12.7%) |
Income Below Poverty Among Single-Parent Households in Shamokin
According to the poverty data in Shamokin, 20.7% or 50 single-father households and 59.5% or 298 single-mother households are living below the poverty line. Among single-father households, those with 5 or more children have the highest poverty rate, with 27 households (100.0%) experiencing poverty. Likewise, among single-mother households, those with 5 or more children have the highest poverty rate, with 27 households (100.0%) falling below the poverty line.
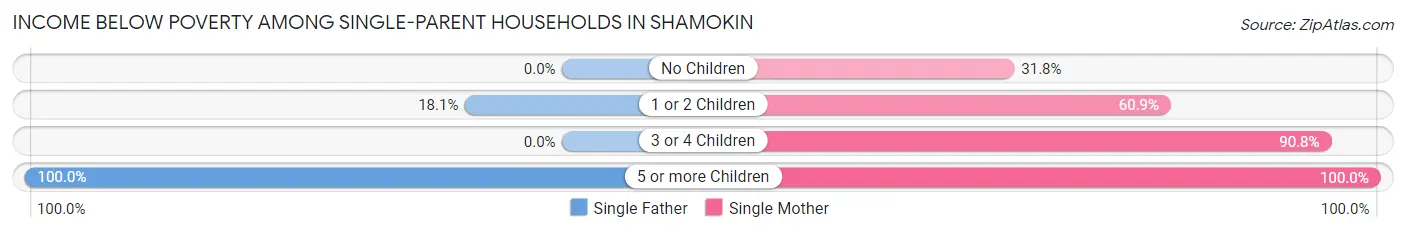
| Children | Single Father | Single Mother |
| No Children | 0 (0.0%) | 55 (31.8%) |
| 1 or 2 Children | 23 (18.1%) | 117 (60.9%) |
| 3 or 4 Children | 0 (0.0%) | 99 (90.8%) |
| 5 or more Children | 27 (100.0%) | 27 (100.0%) |
| Total | 50 (20.7%) | 298 (59.5%) |
Income Below Poverty Among Married-Couple vs Single-Parent Households in Shamokin
The poverty data for Shamokin shows that 106 of the married-couple family households (12.7%) and 348 of the single-parent households (46.8%) are living below the poverty level. Within the married-couple family households, those with 3 or 4 children have the highest poverty rate, with 9 households (36.0%) falling below the poverty line. Among the single-parent households, those with 5 or more children have the highest poverty rate, with 54 household (100.0%) living below poverty.
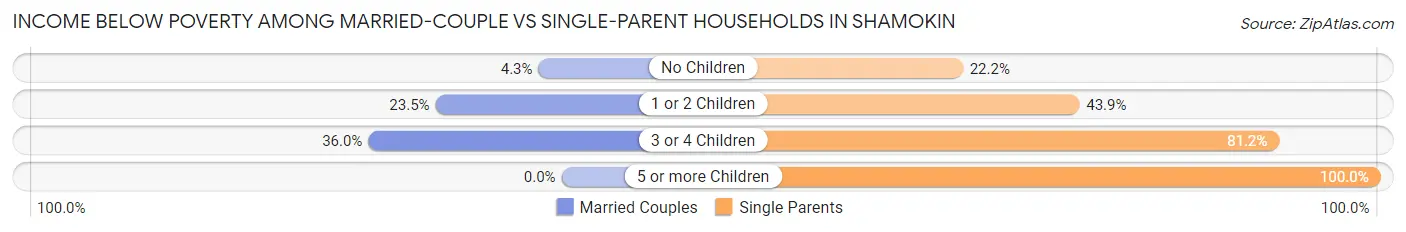
| Children | Married-Couple Families | Single-Parent Households |
| No Children | 20 (4.3%) | 55 (22.2%) |
| 1 or 2 Children | 77 (23.5%) | 140 (43.9%) |
| 3 or 4 Children | 9 (36.0%) | 99 (81.1%) |
| 5 or more Children | 0 (0.0%) | 54 (100.0%) |
| Total | 106 (12.7%) | 348 (46.8%) |
Race in Shamokin
The most populous races in Shamokin are White / Caucasian (5,586 | 80.8%), Two or more Races (1,009 | 14.6%), and Hispanic or Latino (788 | 11.4%).
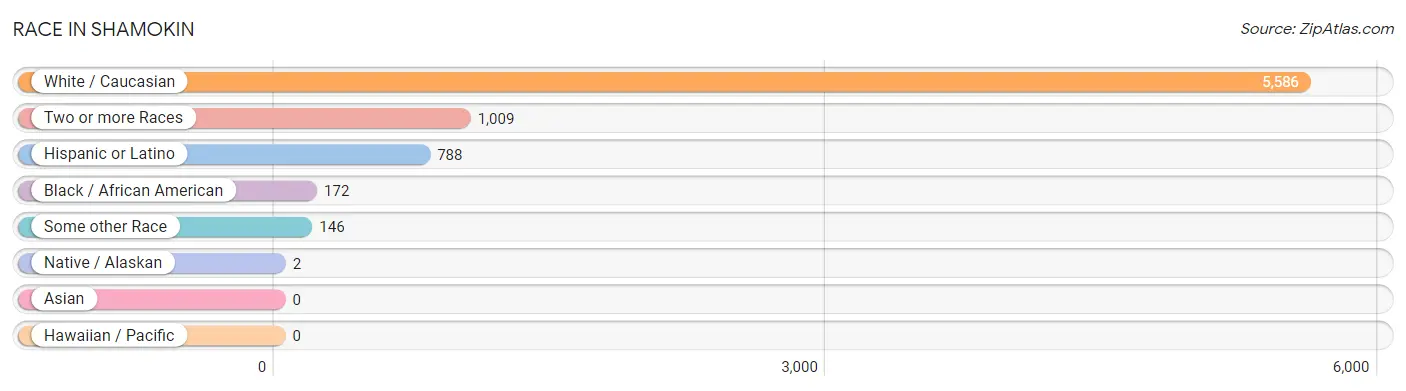
| Race | # Population | % Population |
| Asian | 0 | 0.0% |
| Black / African American | 172 | 2.5% |
| Hawaiian / Pacific | 0 | 0.0% |
| Hispanic or Latino | 788 | 11.4% |
| Native / Alaskan | 2 | 0.0% |
| White / Caucasian | 5,586 | 80.8% |
| Two or more Races | 1,009 | 14.6% |
| Some other Race | 146 | 2.1% |
| Total | 6,915 | 100.0% |
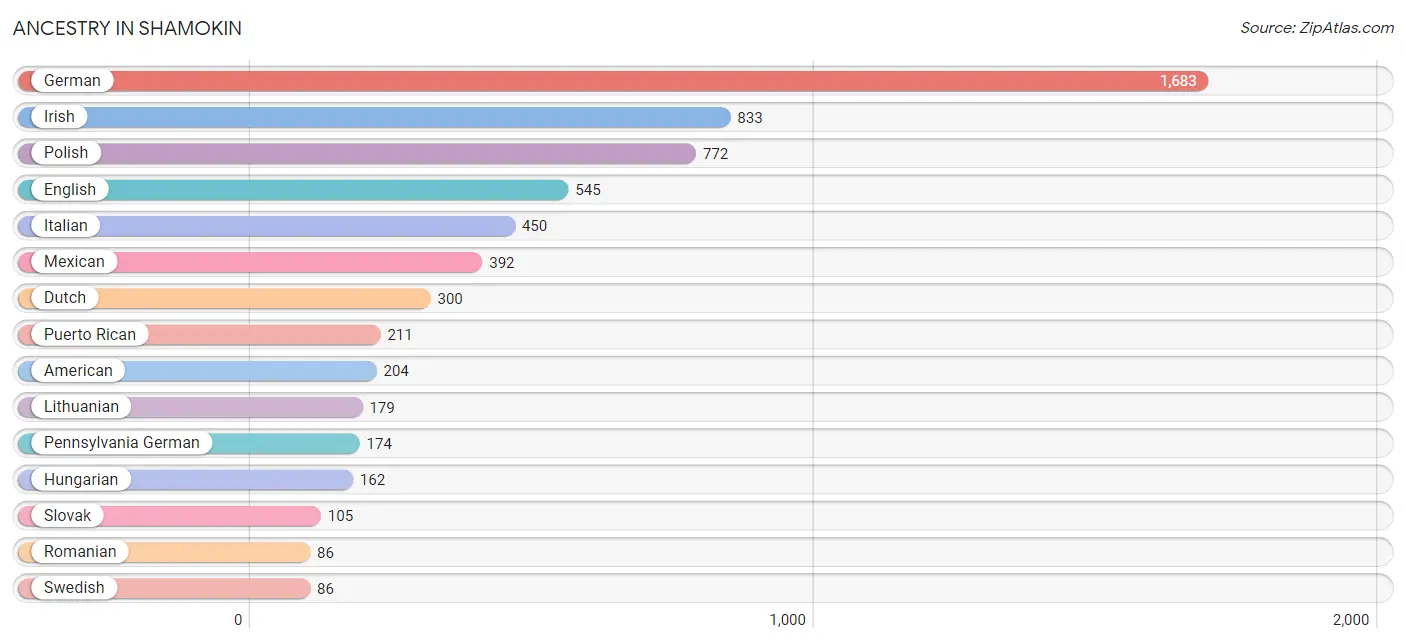
Ancestry in Shamokin
The most populous ancestries reported in Shamokin are German (1,683 | 24.3%), Irish (833 | 12.0%), Polish (772 | 11.2%), English (545 | 7.9%), and Italian (450 | 6.5%), together accounting for 61.9% of all Shamokin residents.
| Ancestry | # Population | % Population |
| American | 204 | 2.9% |
| Austrian | 7 | 0.1% |
| Cherokee | 15 | 0.2% |
| Colombian | 84 | 1.2% |
| Cuban | 66 | 0.9% |
| Czech | 5 | 0.1% |
| Dutch | 300 | 4.3% |
| English | 545 | 7.9% |
| Ethiopian | 52 | 0.7% |
| European | 20 | 0.3% |
| French | 10 | 0.1% |
| German | 1,683 | 24.3% |
| Hungarian | 162 | 2.3% |
| Irish | 833 | 12.0% |
| Italian | 450 | 6.5% |
| Kenyan | 1 | 0.0% |
| Lithuanian | 179 | 2.6% |
| Mexican | 392 | 5.7% |
| Pennsylvania German | 174 | 2.5% |
| Polish | 772 | 11.2% |
| Portuguese | 1 | 0.0% |
| Puerto Rican | 211 | 3.0% |
| Romanian | 86 | 1.2% |
| Russian | 27 | 0.4% |
| Scotch-Irish | 10 | 0.1% |
| Scottish | 46 | 0.7% |
| Sioux | 16 | 0.2% |
| Slavic | 13 | 0.2% |
| Slovak | 105 | 1.5% |
| South American | 84 | 1.2% |
| Spanish | 3 | 0.0% |
| Sri Lankan | 42 | 0.6% |
| Subsaharan African | 77 | 1.1% |
| Swedish | 86 | 1.2% |
| Ukrainian | 31 | 0.4% |
| Welsh | 78 | 1.1% | View All 36 Rows |
Immigrants in Shamokin
The most numerous immigrant groups reported in Shamokin came from Africa (57 | 0.8%), Eastern Africa (53 | 0.8%), Ethiopia (52 | 0.7%), Europe (27 | 0.4%), and Northern Europe (27 | 0.4%), together accounting for 3.1% of all Shamokin residents.
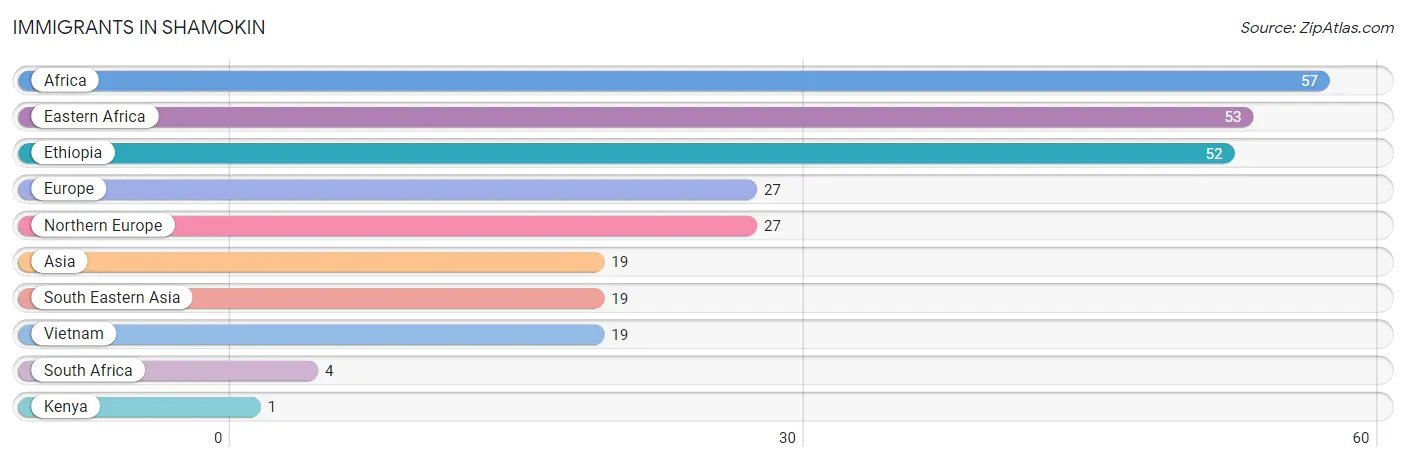
| Immigration Origin | # Population | % Population |
| Africa | 57 | 0.8% |
| Asia | 19 | 0.3% |
| Eastern Africa | 53 | 0.8% |
| Ethiopia | 52 | 0.7% |
| Europe | 27 | 0.4% |
| Kenya | 1 | 0.0% |
| Northern Europe | 27 | 0.4% |
| South Africa | 4 | 0.1% |
| South Eastern Asia | 19 | 0.3% |
| Vietnam | 19 | 0.3% | View All 10 Rows |
Sex and Age in Shamokin
Sex and Age in Shamokin
The most populous age groups in Shamokin are 5 to 9 Years (322 | 9.2%) for men and 20 to 24 Years (336 | 9.8%) for women.
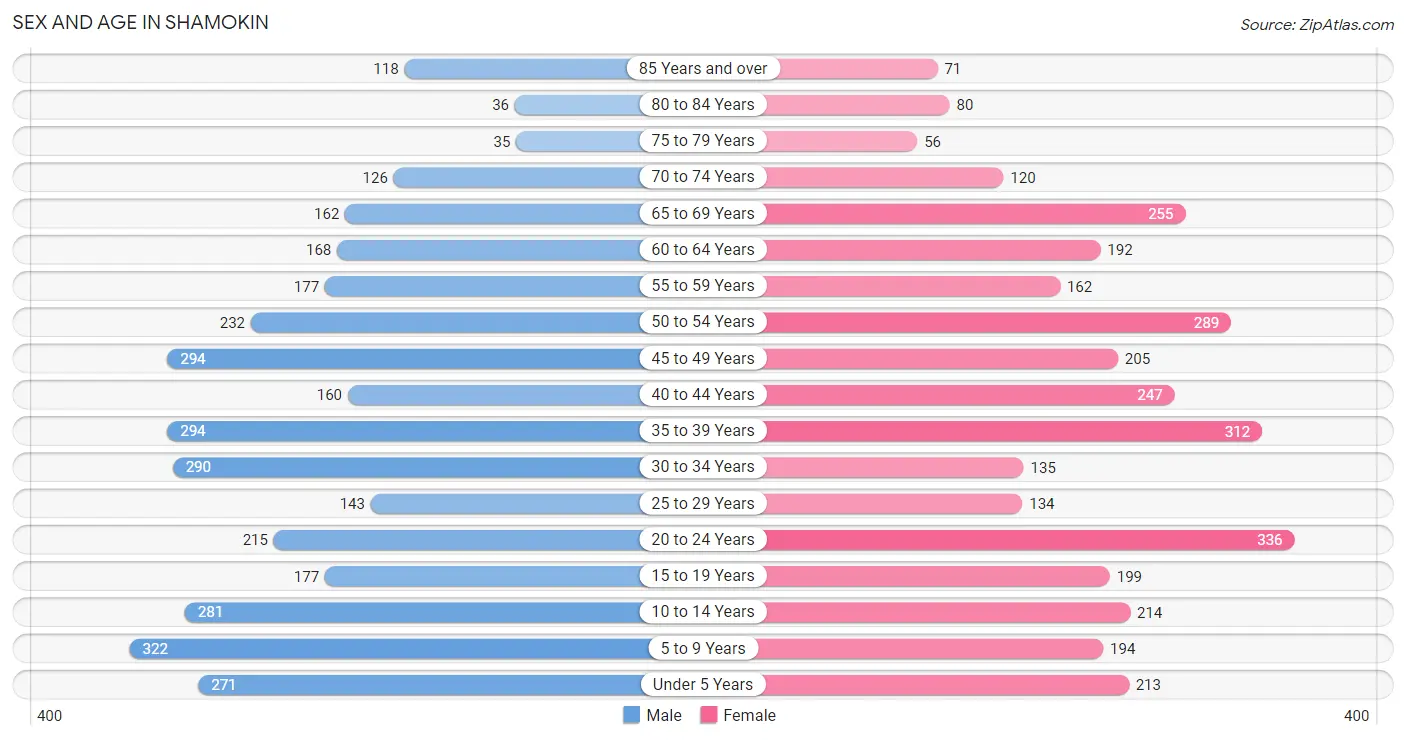
| Age Bracket | Male | Female |
| Under 5 Years | 271 (7.7%) | 213 (6.2%) |
| 5 to 9 Years | 322 (9.2%) | 194 (5.7%) |
| 10 to 14 Years | 281 (8.0%) | 214 (6.3%) |
| 15 to 19 Years | 177 (5.1%) | 199 (5.8%) |
| 20 to 24 Years | 215 (6.1%) | 336 (9.8%) |
| 25 to 29 Years | 143 (4.1%) | 134 (3.9%) |
| 30 to 34 Years | 290 (8.3%) | 135 (4.0%) |
| 35 to 39 Years | 294 (8.4%) | 312 (9.1%) |
| 40 to 44 Years | 160 (4.6%) | 247 (7.2%) |
| 45 to 49 Years | 294 (8.4%) | 205 (6.0%) |
| 50 to 54 Years | 232 (6.6%) | 289 (8.5%) |
| 55 to 59 Years | 177 (5.1%) | 162 (4.8%) |
| 60 to 64 Years | 168 (4.8%) | 192 (5.6%) |
| 65 to 69 Years | 162 (4.6%) | 255 (7.5%) |
| 70 to 74 Years | 126 (3.6%) | 120 (3.5%) |
| 75 to 79 Years | 35 (1.0%) | 56 (1.6%) |
| 80 to 84 Years | 36 (1.0%) | 80 (2.3%) |
| 85 Years and over | 118 (3.4%) | 71 (2.1%) |
| Total | 3,501 (100.0%) | 3,414 (100.0%) |
Families and Households in Shamokin
Median Family Size in Shamokin
The median family size in Shamokin is 3.18 persons per family, with married-couple families (832 | 52.8%) accounting for the largest median family size of 3.21 persons per family. On the other hand, single male/father families (242 | 15.4%) represent the smallest median family size with 3.14 persons per family.
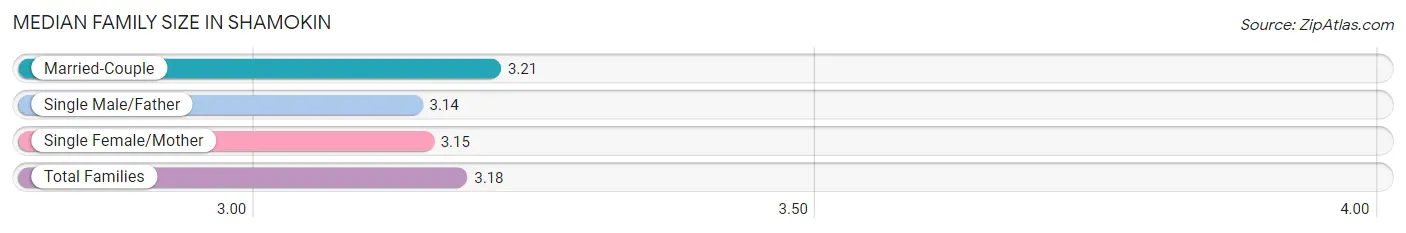
| Family Type | # Families | Family Size |
| Married-Couple | 832 (52.8%) | 3.21 |
| Single Male/Father | 242 (15.4%) | 3.14 |
| Single Female/Mother | 501 (31.8%) | 3.15 |
| Total Families | 1,575 (100.0%) | 3.18 |
Median Household Size in Shamokin
The median household size in Shamokin is 2.40 persons per household, with single female/mother households (501 | 17.4%) accounting for the largest median household size of 3.51 persons per household. non-family households (1,297 | 45.2%) represent the smallest median household size with 1.22 persons per household.
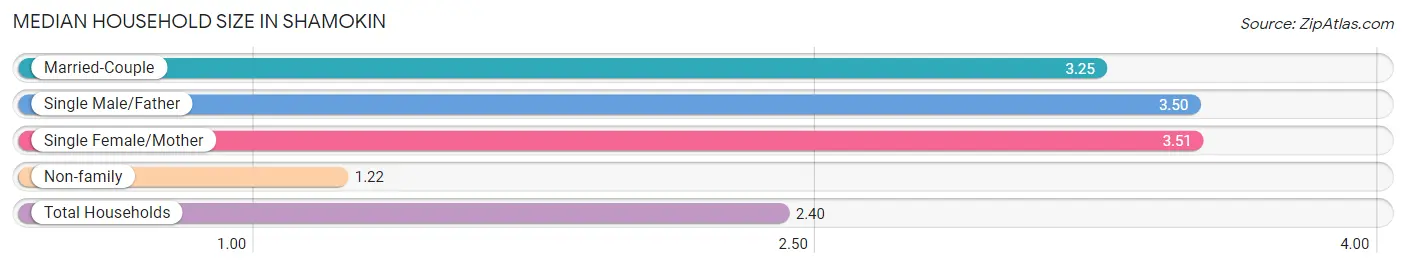
| Household Type | # Households | Household Size |
| Married-Couple | 832 (29.0%) | 3.25 |
| Single Male/Father | 242 (8.4%) | 3.50 |
| Single Female/Mother | 501 (17.4%) | 3.51 |
| Non-family | 1,297 (45.2%) | 1.22 |
| Total Households | 2,872 (100.0%) | 2.40 |
Household Size by Marriage Status in Shamokin
Out of a total of 2,872 households in Shamokin, 1,575 (54.8%) are family households, while 1,297 (45.2%) are nonfamily households. The most numerous type of family households are 2-person households, comprising 570, and the most common type of nonfamily households are 1-person households, comprising 1,157.
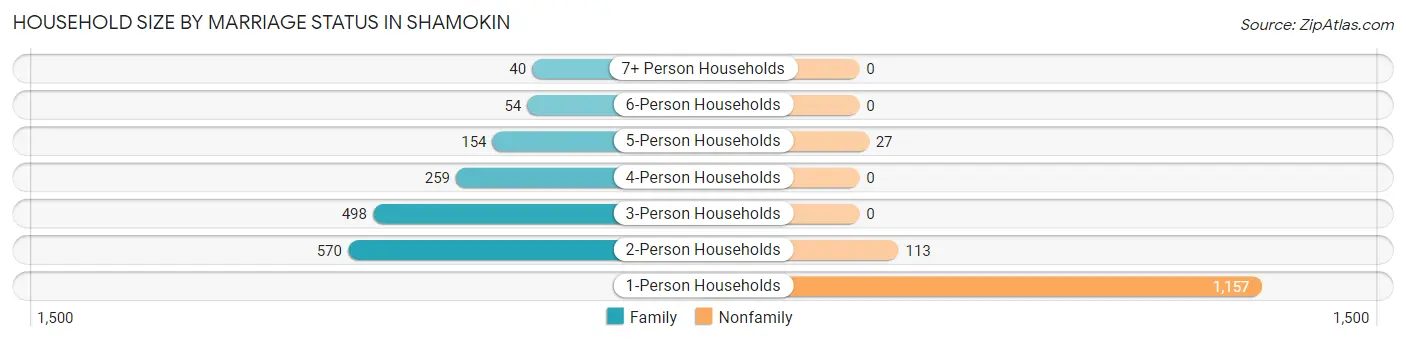
| Household Size | Family Households | Nonfamily Households |
| 1-Person Households | - | 1,157 (40.3%) |
| 2-Person Households | 570 (19.9%) | 113 (3.9%) |
| 3-Person Households | 498 (17.3%) | 0 (0.0%) |
| 4-Person Households | 259 (9.0%) | 0 (0.0%) |
| 5-Person Households | 154 (5.4%) | 27 (0.9%) |
| 6-Person Households | 54 (1.9%) | 0 (0.0%) |
| 7+ Person Households | 40 (1.4%) | 0 (0.0%) |
| Total | 1,575 (54.8%) | 1,297 (45.2%) |
Female Fertility in Shamokin
Fertility by Age in Shamokin
Average fertility rate in Shamokin is 126.0 births per 1,000 women. Women in the age bracket of 20 to 34 years have the highest fertility rate with 286.0 births per 1,000 women. Women in the age bracket of 20 to 34 years acount for 81.2% of all women with births.
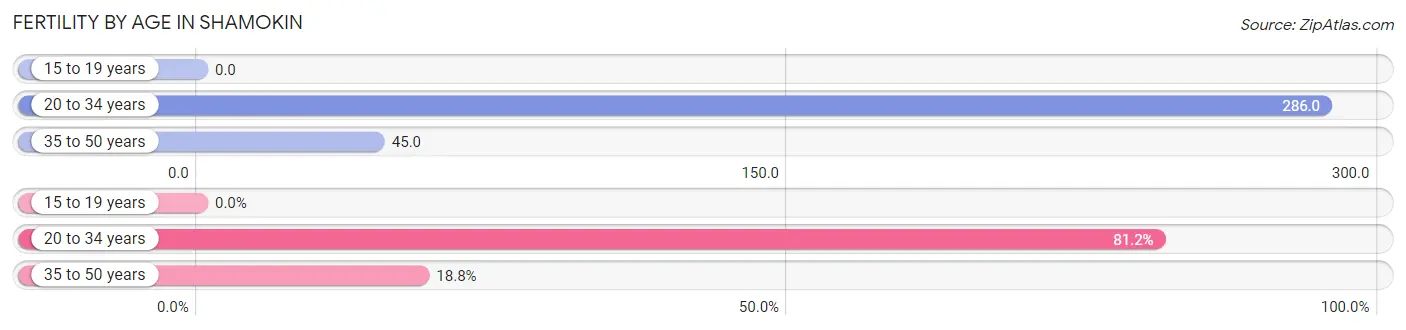
| Age Bracket | Women with Births | Births / 1,000 Women |
| 15 to 19 years | 0 (0.0%) | 0.0 |
| 20 to 34 years | 173 (81.2%) | 286.0 |
| 35 to 50 years | 40 (18.8%) | 45.0 |
| Total | 213 (100.0%) | 126.0 |
Fertility by Age by Marriage Status in Shamokin
29.1% of women with births (213) in Shamokin are married. The highest percentage of unmarried women with births falls into 20 to 34 years age bracket with 87.3% of them unmarried at the time of birth, while the lowest percentage of unmarried women with births belong to 35 to 50 years age bracket with 0.0% of them unmarried.
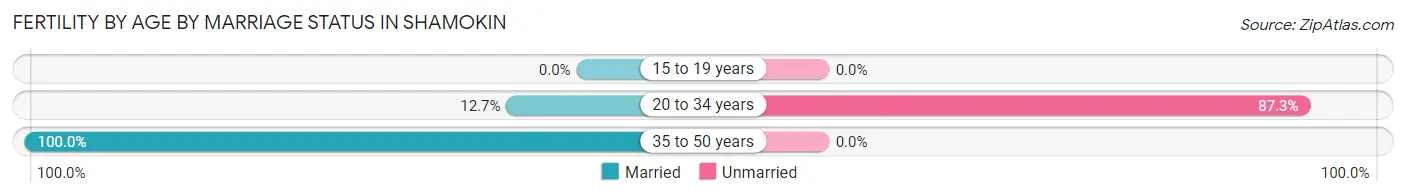
| Age Bracket | Married | Unmarried |
| 15 to 19 years | 0 (0.0%) | 0 (0.0%) |
| 20 to 34 years | 22 (12.7%) | 151 (87.3%) |
| 35 to 50 years | 40 (100.0%) | 0 (0.0%) |
| Total | 62 (29.1%) | 151 (70.9%) |
Fertility by Education in Shamokin
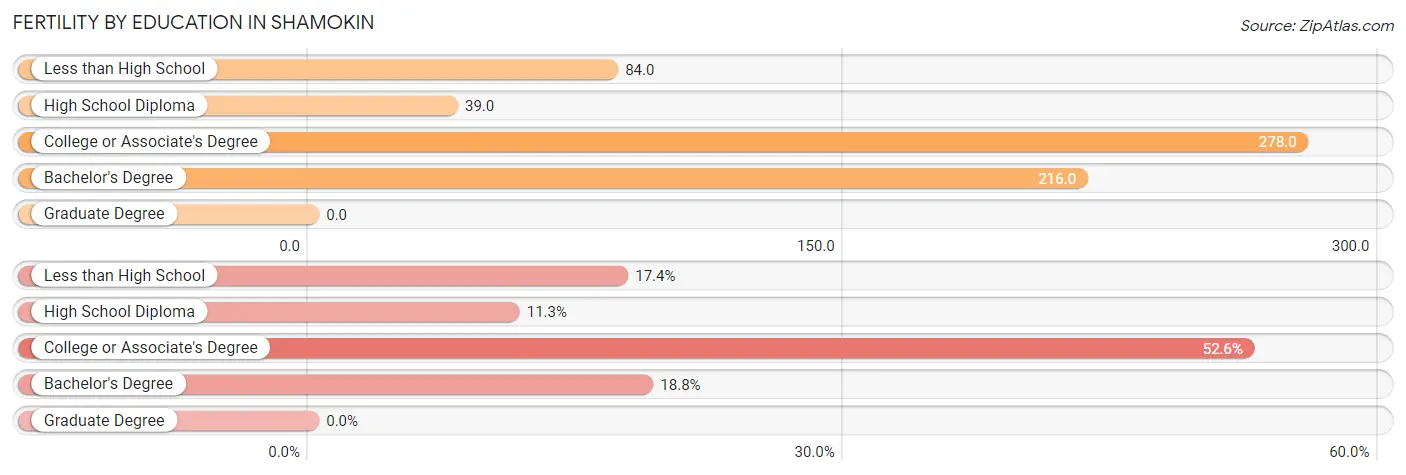
| Educational Attainment | Women with Births | Births / 1,000 Women |
| Less than High School | 37 (17.4%) | 84.0 |
| High School Diploma | 24 (11.3%) | 39.0 |
| College or Associate's Degree | 112 (52.6%) | 278.0 |
| Bachelor's Degree | 40 (18.8%) | 216.0 |
| Graduate Degree | 0 (0.0%) | 0.0 |
| Total | 213 (100.0%) | 126.0 |
Fertility by Education by Marriage Status in Shamokin
70.9% of women with births in Shamokin are unmarried. Women with the educational attainment of bachelor's degree are most likely to be married with 100.0% of them married at childbirth, while women with the educational attainment of less than high school are least likely to be married with 100.0% of them unmarried at childbirth.
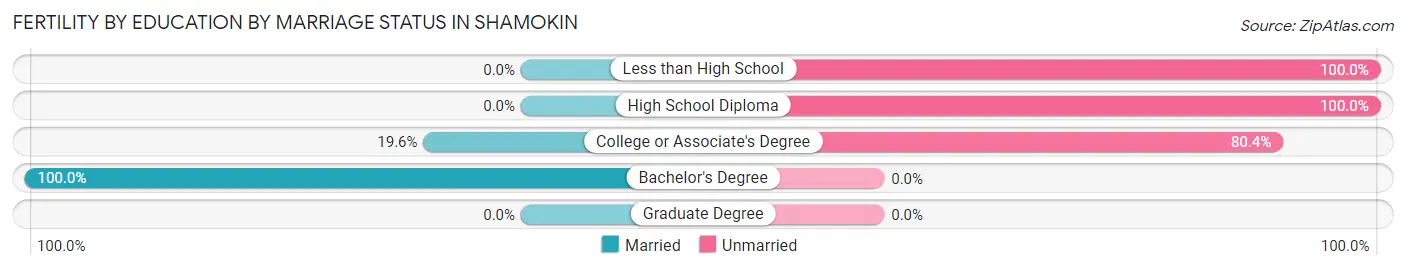
| Educational Attainment | Married | Unmarried |
| Less than High School | 0 (0.0%) | 37 (100.0%) |
| High School Diploma | 0 (0.0%) | 24 (100.0%) |
| College or Associate's Degree | 22 (19.6%) | 90 (80.4%) |
| Bachelor's Degree | 40 (100.0%) | 0 (0.0%) |
| Graduate Degree | 0 (0.0%) | 0 (0.0%) |
| Total | 62 (29.1%) | 151 (70.9%) |
Employment Characteristics in Shamokin
Employment by Class of Employer in Shamokin
Among the 2,717 employed individuals in Shamokin, private company employees (1,930 | 71.0%), local government employees (259 | 9.5%), and self-employed (not incorporated) (197 | 7.2%) make up the most common classes of employment.
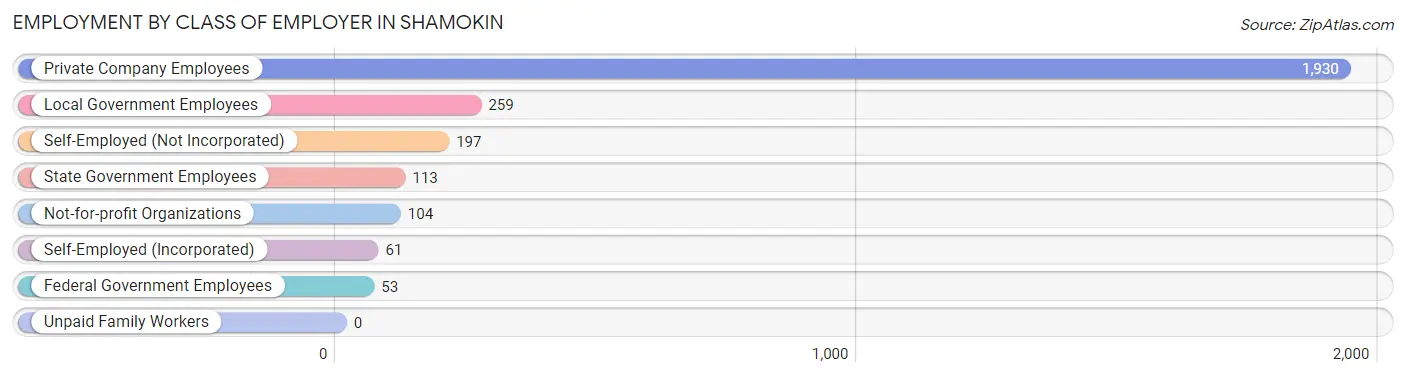
| Employer Class | # Employees | % Employees |
| Private Company Employees | 1,930 | 71.0% |
| Self-Employed (Incorporated) | 61 | 2.2% |
| Self-Employed (Not Incorporated) | 197 | 7.2% |
| Not-for-profit Organizations | 104 | 3.8% |
| Local Government Employees | 259 | 9.5% |
| State Government Employees | 113 | 4.2% |
| Federal Government Employees | 53 | 1.9% |
| Unpaid Family Workers | 0 | 0.0% |
| Total | 2,717 | 100.0% |
Employment Status by Age in Shamokin
According to the labor force statistics for Shamokin, out of the total population over 16 years of age (5,291), 57.5% or 3,042 individuals are in the labor force, with 8.7% or 265 of them unemployed. The age group with the highest labor force participation rate is 30 to 34 years, with 90.1% or 383 individuals in the labor force. Within the labor force, the 30 to 34 years age range has the highest percentage of unemployed individuals, with 37.1% or 142 of them being unemployed.
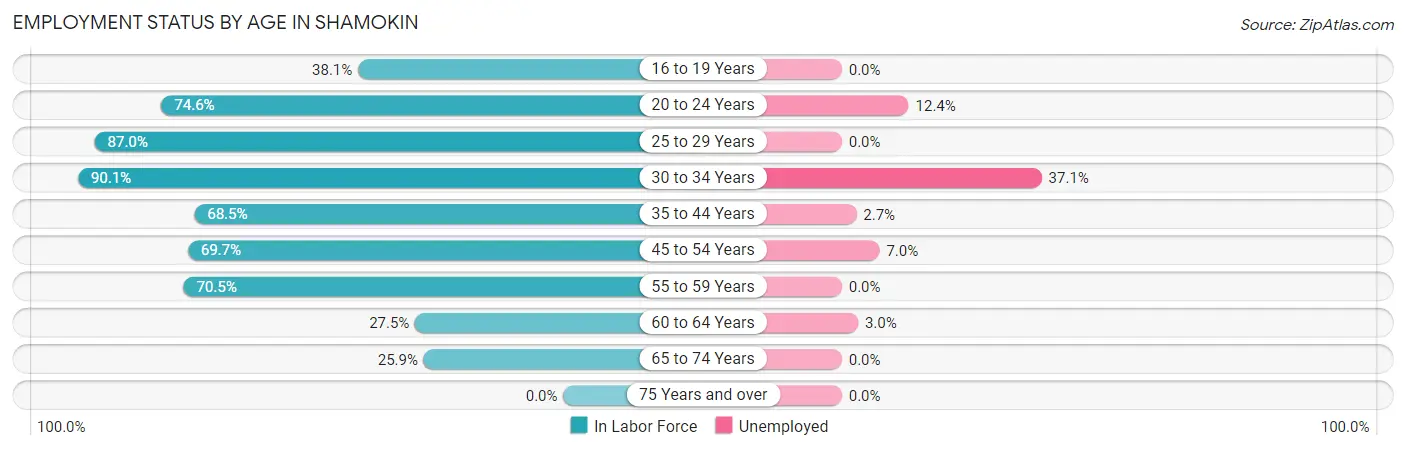
| Age Bracket | In Labor Force | Unemployed |
| 16 to 19 Years | 94 (38.1%) | 0 (0.0%) |
| 20 to 24 Years | 411 (74.6%) | 51 (12.4%) |
| 25 to 29 Years | 241 (87.0%) | 0 (0.0%) |
| 30 to 34 Years | 383 (90.1%) | 142 (37.1%) |
| 35 to 44 Years | 694 (68.5%) | 19 (2.7%) |
| 45 to 54 Years | 711 (69.7%) | 50 (7.0%) |
| 55 to 59 Years | 239 (70.5%) | 0 (0.0%) |
| 60 to 64 Years | 99 (27.5%) | 3 (3.0%) |
| 65 to 74 Years | 172 (25.9%) | 0 (0.0%) |
| 75 Years and over | 0 (0.0%) | 0 (0.0%) |
| Total | 3,042 (57.5%) | 265 (8.7%) |
Employment Status by Educational Attainment in Shamokin
According to labor force statistics for Shamokin, 68.9% of individuals (2,366) out of the total population between 25 and 64 years of age (3,434) are in the labor force, with 9.0% or 213 of them being unemployed. The group with the highest labor force participation rate are those with the educational attainment of bachelor's degree or higher, with 92.0% or 496 individuals in the labor force. Within the labor force, individuals with college / associate degree education have the highest percentage of unemployment, with 16.4% or 107 of them being unemployed.
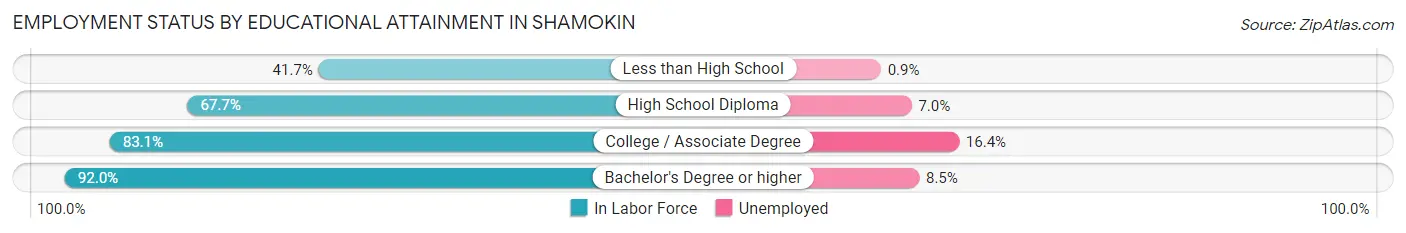
| Educational Attainment | In Labor Force | Unemployed |
| Less than High School | 337 (41.7%) | 7 (0.9%) |
| High School Diploma | 883 (67.7%) | 91 (7.0%) |
| College / Associate Degree | 651 (83.1%) | 128 (16.4%) |
| Bachelor's Degree or higher | 496 (92.0%) | 46 (8.5%) |
| Total | 2,366 (68.9%) | 309 (9.0%) |
Employment Occupations by Sex in Shamokin
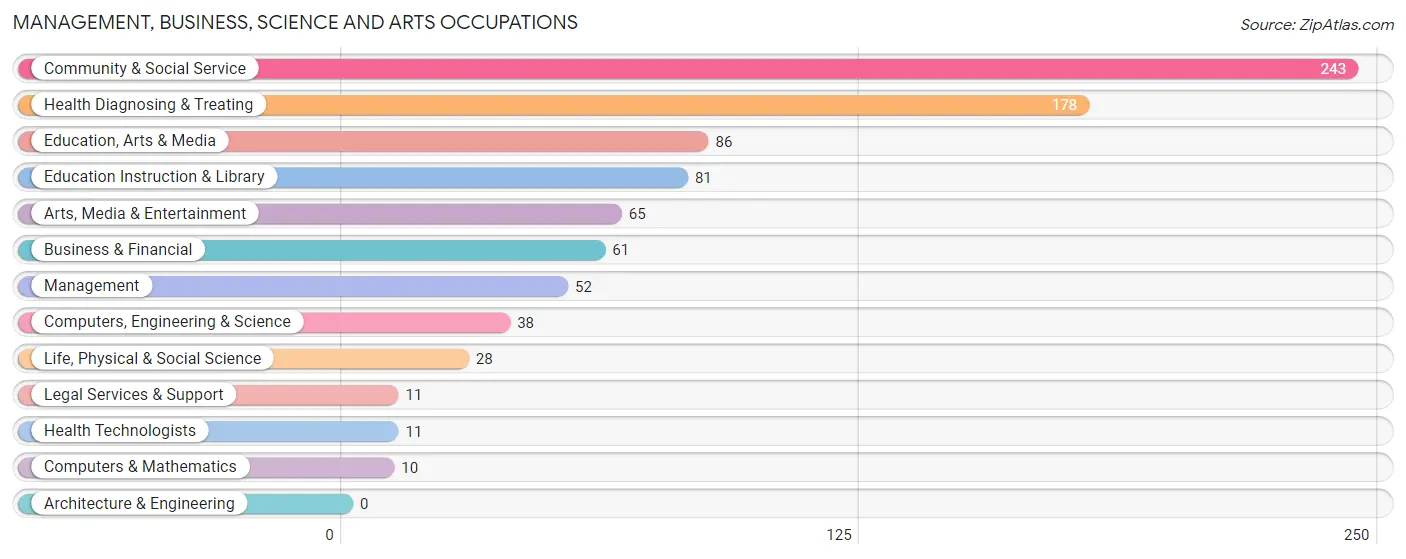
Management, Business, Science and Arts Occupations
The most common Management, Business, Science and Arts occupations in Shamokin are Community & Social Service (243 | 8.7%), Health Diagnosing & Treating (178 | 6.4%), Education, Arts & Media (86 | 3.1%), Education Instruction & Library (81 | 2.9%), and Arts, Media & Entertainment (65 | 2.3%).
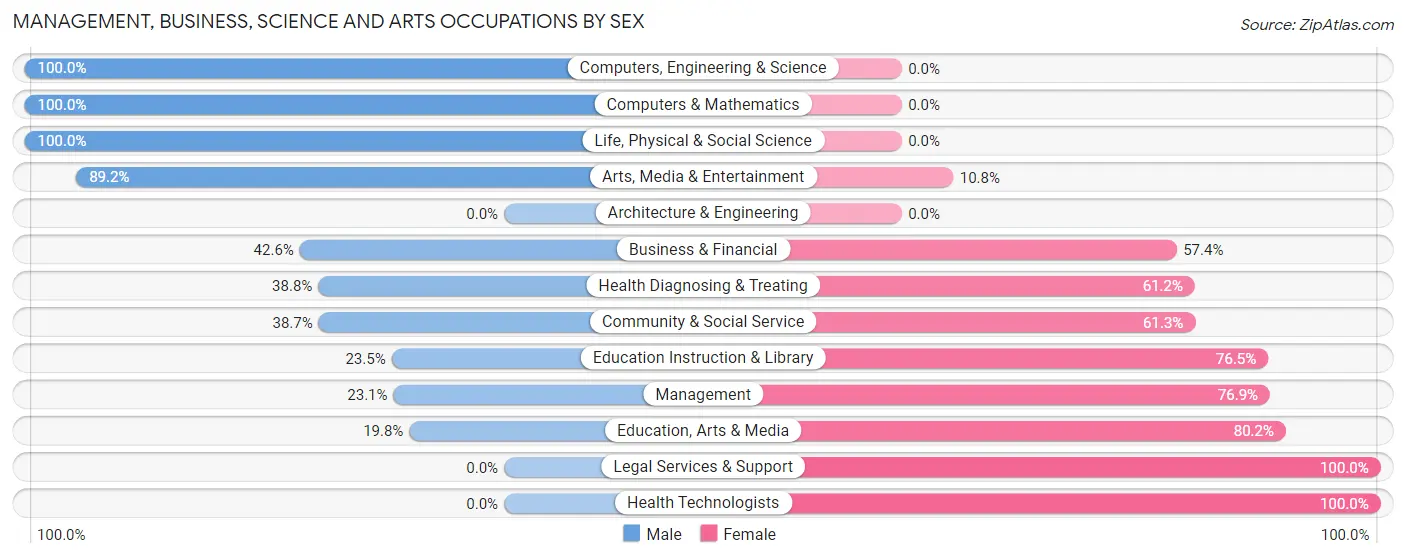
Management, Business, Science and Arts Occupations by Sex
Within the Management, Business, Science and Arts occupations in Shamokin, the most male-oriented occupations are Computers, Engineering & Science (100.0%), Computers & Mathematics (100.0%), and Life, Physical & Social Science (100.0%), while the most female-oriented occupations are Legal Services & Support (100.0%), Health Technologists (100.0%), and Education, Arts & Media (80.2%).
| Occupation | Male | Female |
| Management | 12 (23.1%) | 40 (76.9%) |
| Business & Financial | 26 (42.6%) | 35 (57.4%) |
| Computers, Engineering & Science | 38 (100.0%) | 0 (0.0%) |
| Computers & Mathematics | 10 (100.0%) | 0 (0.0%) |
| Architecture & Engineering | 0 (0.0%) | 0 (0.0%) |
| Life, Physical & Social Science | 28 (100.0%) | 0 (0.0%) |
| Community & Social Service | 94 (38.7%) | 149 (61.3%) |
| Education, Arts & Media | 17 (19.8%) | 69 (80.2%) |
| Legal Services & Support | 0 (0.0%) | 11 (100.0%) |
| Education Instruction & Library | 19 (23.5%) | 62 (76.5%) |
| Arts, Media & Entertainment | 58 (89.2%) | 7 (10.8%) |
| Health Diagnosing & Treating | 69 (38.8%) | 109 (61.2%) |
| Health Technologists | 0 (0.0%) | 11 (100.0%) |
| Total (Category) | 239 (41.8%) | 333 (58.2%) |
| Total (Overall) | 1,387 (49.9%) | 1,392 (50.1%) |
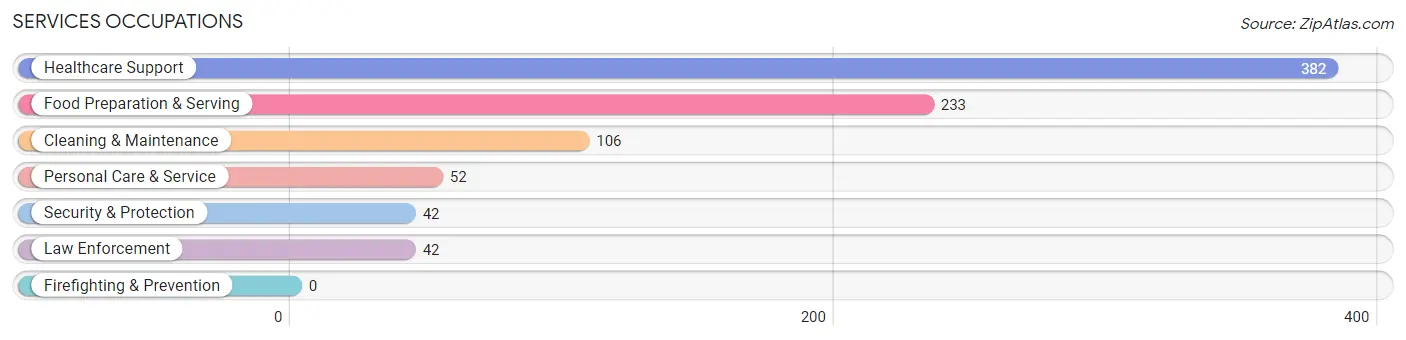
Services Occupations
The most common Services occupations in Shamokin are Healthcare Support (382 | 13.8%), Food Preparation & Serving (233 | 8.4%), Cleaning & Maintenance (106 | 3.8%), Personal Care & Service (52 | 1.9%), and Security & Protection (42 | 1.5%).
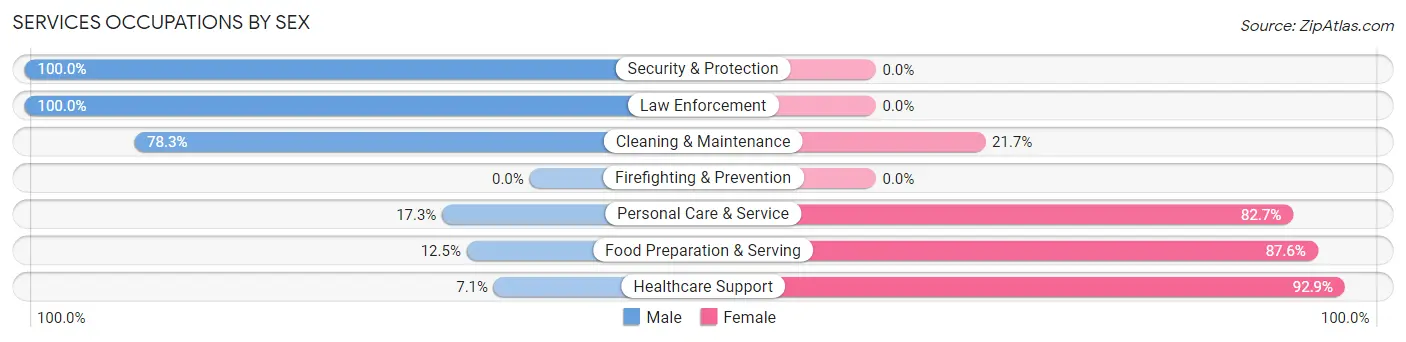
Services Occupations by Sex
Within the Services occupations in Shamokin, the most male-oriented occupations are Security & Protection (100.0%), Law Enforcement (100.0%), and Cleaning & Maintenance (78.3%), while the most female-oriented occupations are Healthcare Support (92.9%), Food Preparation & Serving (87.5%), and Personal Care & Service (82.7%).
| Occupation | Male | Female |
| Healthcare Support | 27 (7.1%) | 355 (92.9%) |
| Security & Protection | 42 (100.0%) | 0 (0.0%) |
| Firefighting & Prevention | 0 (0.0%) | 0 (0.0%) |
| Law Enforcement | 42 (100.0%) | 0 (0.0%) |
| Food Preparation & Serving | 29 (12.4%) | 204 (87.5%) |
| Cleaning & Maintenance | 83 (78.3%) | 23 (21.7%) |
| Personal Care & Service | 9 (17.3%) | 43 (82.7%) |
| Total (Category) | 190 (23.3%) | 625 (76.7%) |
| Total (Overall) | 1,387 (49.9%) | 1,392 (50.1%) |
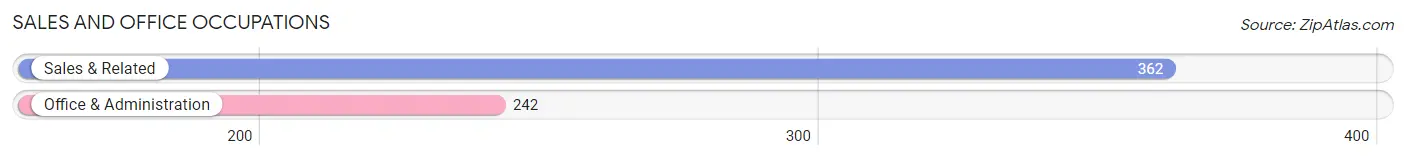
Sales and Office Occupations
The most common Sales and Office occupations in Shamokin are Sales & Related (362 | 13.0%), and Office & Administration (242 | 8.7%).
Sales and Office Occupations by Sex
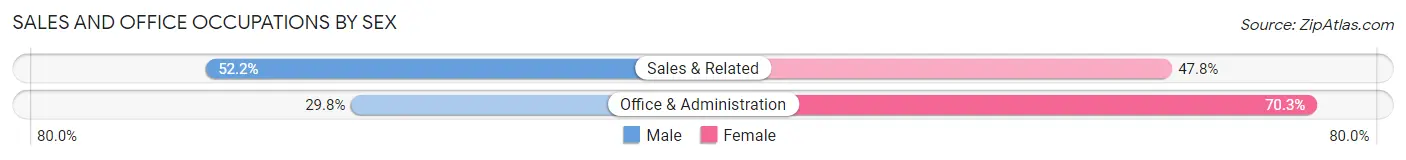
| Occupation | Male | Female |
| Sales & Related | 189 (52.2%) | 173 (47.8%) |
| Office & Administration | 72 (29.7%) | 170 (70.3%) |
| Total (Category) | 261 (43.2%) | 343 (56.8%) |
| Total (Overall) | 1,387 (49.9%) | 1,392 (50.1%) |
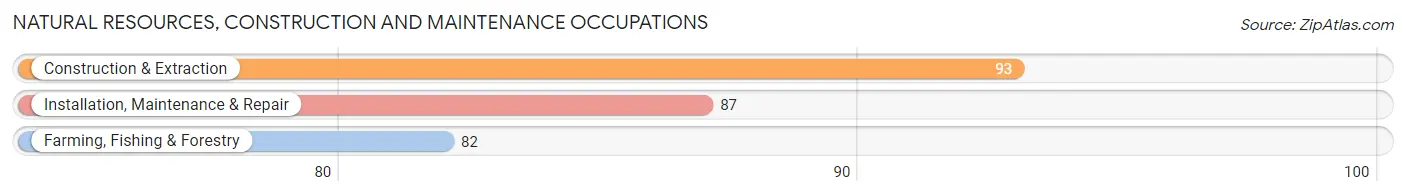
Natural Resources, Construction and Maintenance Occupations
The most common Natural Resources, Construction and Maintenance occupations in Shamokin are Construction & Extraction (93 | 3.4%), Installation, Maintenance & Repair (87 | 3.1%), and Farming, Fishing & Forestry (82 | 2.9%).
Natural Resources, Construction and Maintenance Occupations by Sex
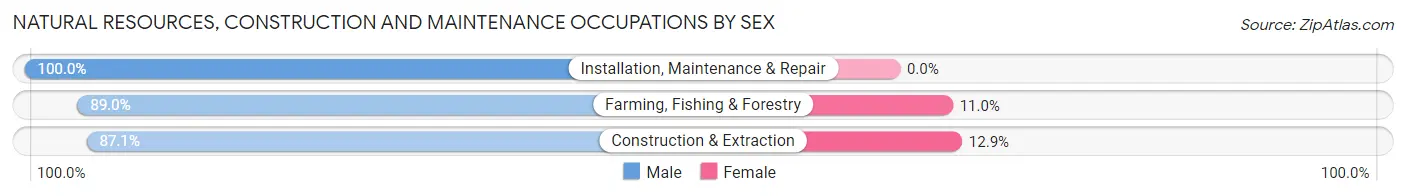
| Occupation | Male | Female |
| Farming, Fishing & Forestry | 73 (89.0%) | 9 (11.0%) |
| Construction & Extraction | 81 (87.1%) | 12 (12.9%) |
| Installation, Maintenance & Repair | 87 (100.0%) | 0 (0.0%) |
| Total (Category) | 241 (92.0%) | 21 (8.0%) |
| Total (Overall) | 1,387 (49.9%) | 1,392 (50.1%) |
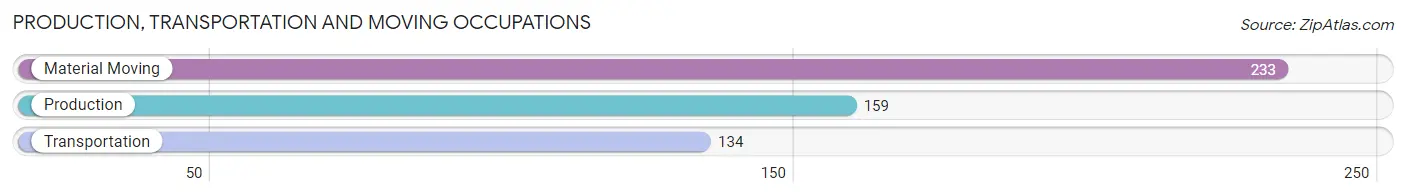
Production, Transportation and Moving Occupations
The most common Production, Transportation and Moving occupations in Shamokin are Material Moving (233 | 8.4%), Production (159 | 5.7%), and Transportation (134 | 4.8%).
Production, Transportation and Moving Occupations by Sex
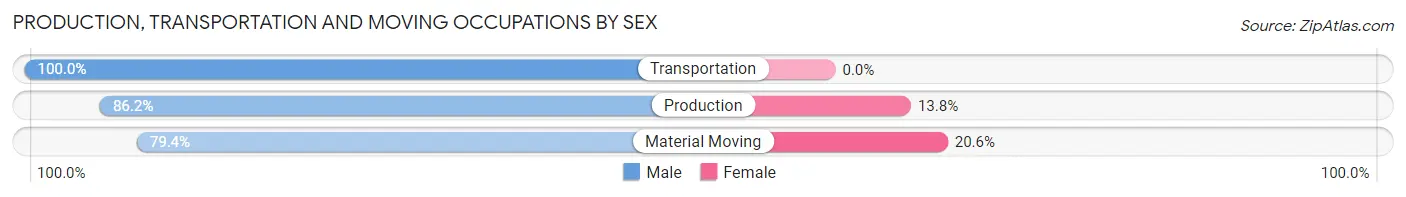
| Occupation | Male | Female |
| Production | 137 (86.2%) | 22 (13.8%) |
| Transportation | 134 (100.0%) | 0 (0.0%) |
| Material Moving | 185 (79.4%) | 48 (20.6%) |
| Total (Category) | 456 (86.7%) | 70 (13.3%) |
| Total (Overall) | 1,387 (49.9%) | 1,392 (50.1%) |
Employment Industries by Sex in Shamokin
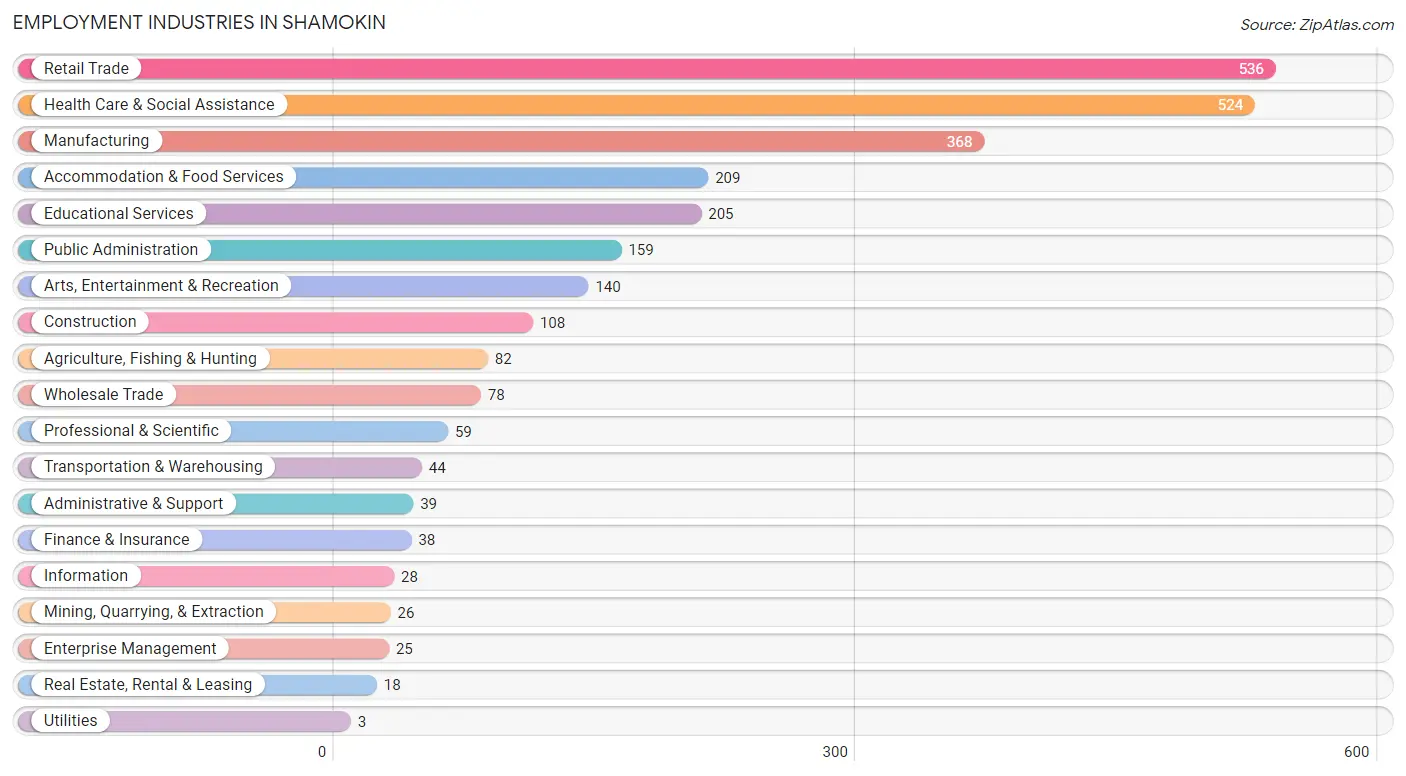
Employment Industries in Shamokin
The major employment industries in Shamokin include Retail Trade (536 | 19.3%), Health Care & Social Assistance (524 | 18.9%), Manufacturing (368 | 13.2%), Accommodation & Food Services (209 | 7.5%), and Educational Services (205 | 7.4%).
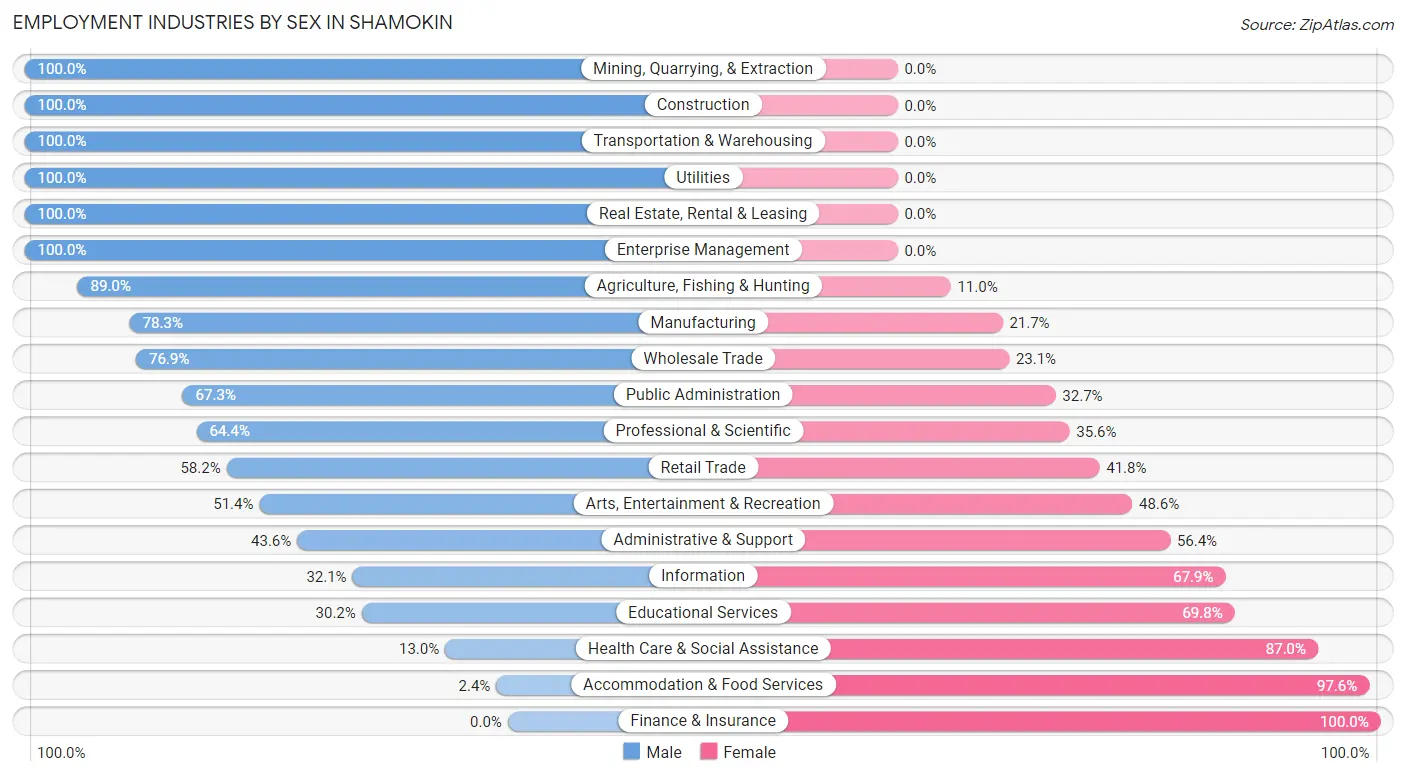
Employment Industries by Sex in Shamokin
The Shamokin industries that see more men than women are Mining, Quarrying, & Extraction (100.0%), Construction (100.0%), and Transportation & Warehousing (100.0%), whereas the industries that tend to have a higher number of women are Finance & Insurance (100.0%), Accommodation & Food Services (97.6%), and Health Care & Social Assistance (87.0%).
| Industry | Male | Female |
| Agriculture, Fishing & Hunting | 73 (89.0%) | 9 (11.0%) |
| Mining, Quarrying, & Extraction | 26 (100.0%) | 0 (0.0%) |
| Construction | 108 (100.0%) | 0 (0.0%) |
| Manufacturing | 288 (78.3%) | 80 (21.7%) |
| Wholesale Trade | 60 (76.9%) | 18 (23.1%) |
| Retail Trade | 312 (58.2%) | 224 (41.8%) |
| Transportation & Warehousing | 44 (100.0%) | 0 (0.0%) |
| Utilities | 3 (100.0%) | 0 (0.0%) |
| Information | 9 (32.1%) | 19 (67.9%) |
| Finance & Insurance | 0 (0.0%) | 38 (100.0%) |
| Real Estate, Rental & Leasing | 18 (100.0%) | 0 (0.0%) |
| Professional & Scientific | 38 (64.4%) | 21 (35.6%) |
| Enterprise Management | 25 (100.0%) | 0 (0.0%) |
| Administrative & Support | 17 (43.6%) | 22 (56.4%) |
| Educational Services | 62 (30.2%) | 143 (69.8%) |
| Health Care & Social Assistance | 68 (13.0%) | 456 (87.0%) |
| Arts, Entertainment & Recreation | 72 (51.4%) | 68 (48.6%) |
| Accommodation & Food Services | 5 (2.4%) | 204 (97.6%) |
| Public Administration | 107 (67.3%) | 52 (32.7%) |
| Total | 1,387 (49.9%) | 1,392 (50.1%) |
Education in Shamokin
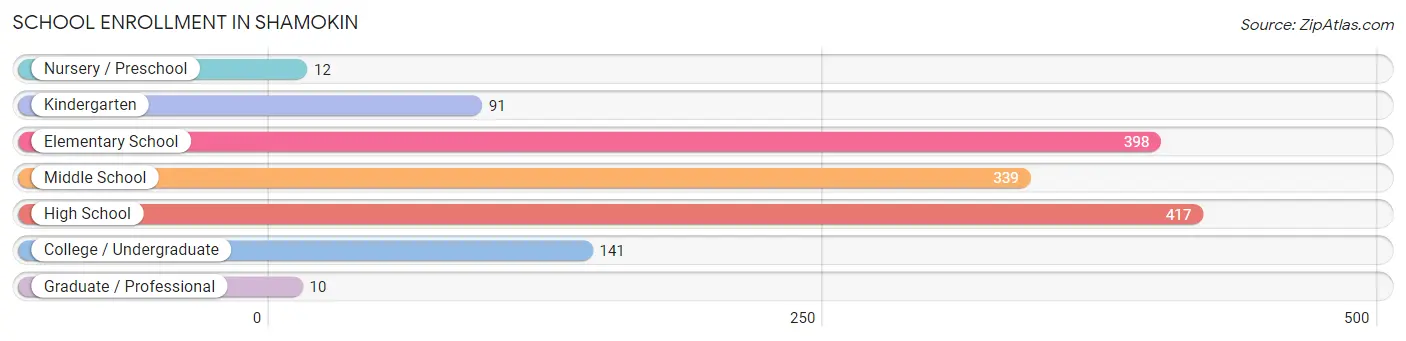
School Enrollment in Shamokin
The most common levels of schooling among the 1,408 students in Shamokin are high school (417 | 29.6%), elementary school (398 | 28.3%), and middle school (339 | 24.1%).
| School Level | # Students | % Students |
| Nursery / Preschool | 12 | 0.9% |
| Kindergarten | 91 | 6.5% |
| Elementary School | 398 | 28.3% |
| Middle School | 339 | 24.1% |
| High School | 417 | 29.6% |
| College / Undergraduate | 141 | 10.0% |
| Graduate / Professional | 10 | 0.7% |
| Total | 1,408 | 100.0% |
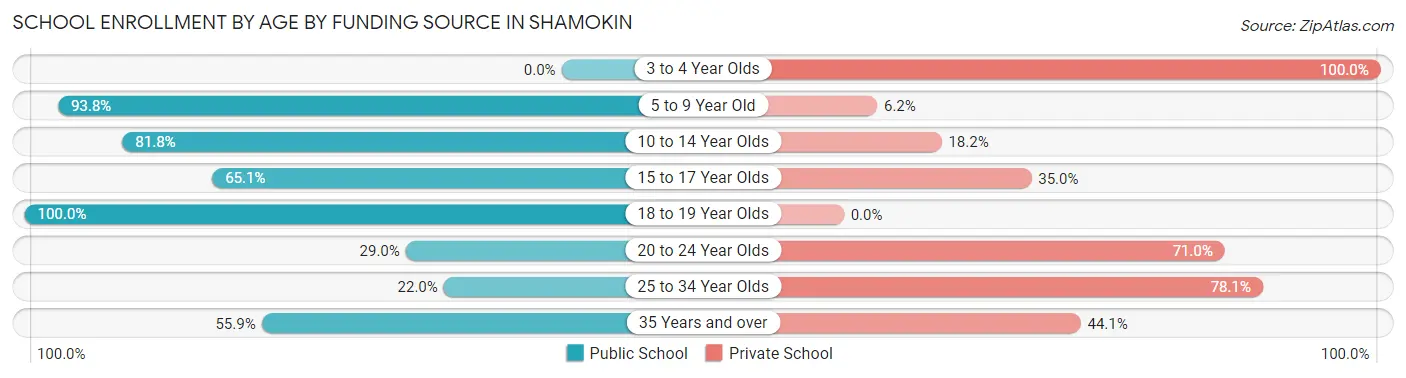
School Enrollment by Age by Funding Source in Shamokin
Out of a total of 1,408 students who are enrolled in schools in Shamokin, 308 (21.9%) attend a private institution, while the remaining 1,100 (78.1%) are enrolled in public schools. The age group of 3 to 4 year olds has the highest likelihood of being enrolled in private schools, with 12 (100.0% in the age bracket) enrolled. Conversely, the age group of 18 to 19 year olds has the lowest likelihood of being enrolled in a private school, with 56 (100.0% in the age bracket) attending a public institution.
| Age Bracket | Public School | Private School |
| 3 to 4 Year Olds | 0 (0.0%) | 12 (100.0%) |
| 5 to 9 Year Old | 422 (93.8%) | 28 (6.2%) |
| 10 to 14 Year Olds | 377 (81.8%) | 84 (18.2%) |
| 15 to 17 Year Olds | 188 (65.0%) | 101 (34.9%) |
| 18 to 19 Year Olds | 56 (100.0%) | 0 (0.0%) |
| 20 to 24 Year Olds | 9 (29.0%) | 22 (71.0%) |
| 25 to 34 Year Olds | 9 (22.0%) | 32 (78.0%) |
| 35 Years and over | 38 (55.9%) | 30 (44.1%) |
| Total | 1,100 (78.1%) | 308 (21.9%) |
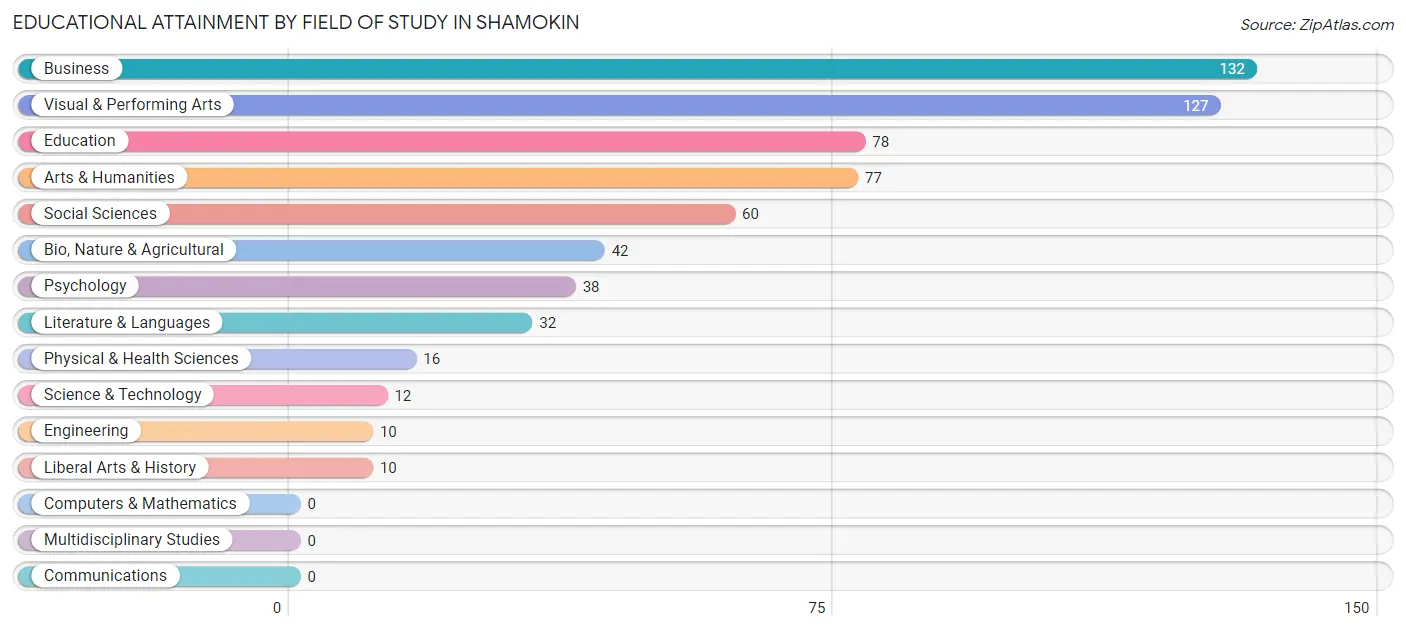
Educational Attainment by Field of Study in Shamokin
Business (132 | 20.8%), visual & performing arts (127 | 20.0%), education (78 | 12.3%), arts & humanities (77 | 12.1%), and social sciences (60 | 9.5%) are the most common fields of study among 634 individuals in Shamokin who have obtained a bachelor's degree or higher.
| Field of Study | # Graduates | % Graduates |
| Computers & Mathematics | 0 | 0.0% |
| Bio, Nature & Agricultural | 42 | 6.6% |
| Physical & Health Sciences | 16 | 2.5% |
| Psychology | 38 | 6.0% |
| Social Sciences | 60 | 9.5% |
| Engineering | 10 | 1.6% |
| Multidisciplinary Studies | 0 | 0.0% |
| Science & Technology | 12 | 1.9% |
| Business | 132 | 20.8% |
| Education | 78 | 12.3% |
| Literature & Languages | 32 | 5.1% |
| Liberal Arts & History | 10 | 1.6% |
| Visual & Performing Arts | 127 | 20.0% |
| Communications | 0 | 0.0% |
| Arts & Humanities | 77 | 12.1% |
| Total | 634 | 100.0% |
Transportation & Commute in Shamokin
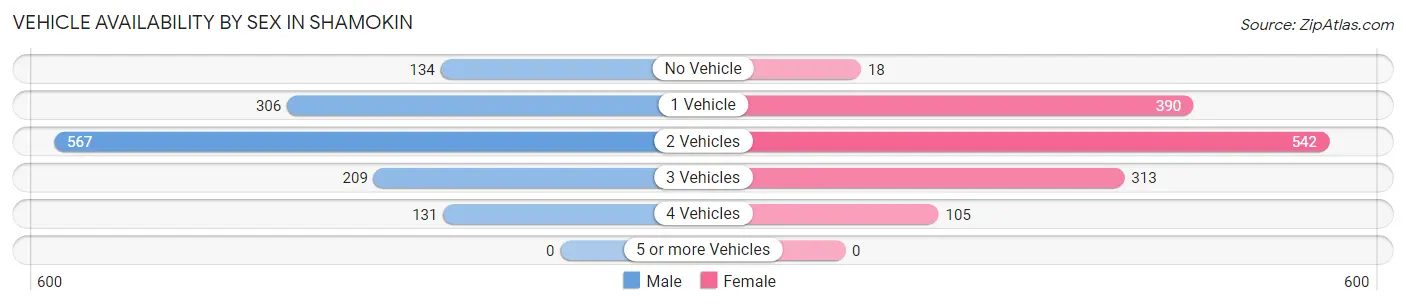
Vehicle Availability by Sex in Shamokin
The most prevalent vehicle ownership categories in Shamokin are males with 2 vehicles (567, accounting for 42.1%) and females with 2 vehicles (542, making up 41.4%).
| Vehicles Available | Male | Female |
| No Vehicle | 134 (10.0%) | 18 (1.3%) |
| 1 Vehicle | 306 (22.7%) | 390 (28.5%) |
| 2 Vehicles | 567 (42.1%) | 542 (39.6%) |
| 3 Vehicles | 209 (15.5%) | 313 (22.9%) |
| 4 Vehicles | 131 (9.7%) | 105 (7.7%) |
| 5 or more Vehicles | 0 (0.0%) | 0 (0.0%) |
| Total | 1,347 (100.0%) | 1,368 (100.0%) |
Commute Time in Shamokin
The most frequently occuring commute durations in Shamokin are 30 to 34 minutes (625 commuters, 24.6%), 5 to 9 minutes (427 commuters, 16.8%), and 10 to 14 minutes (280 commuters, 11.0%).
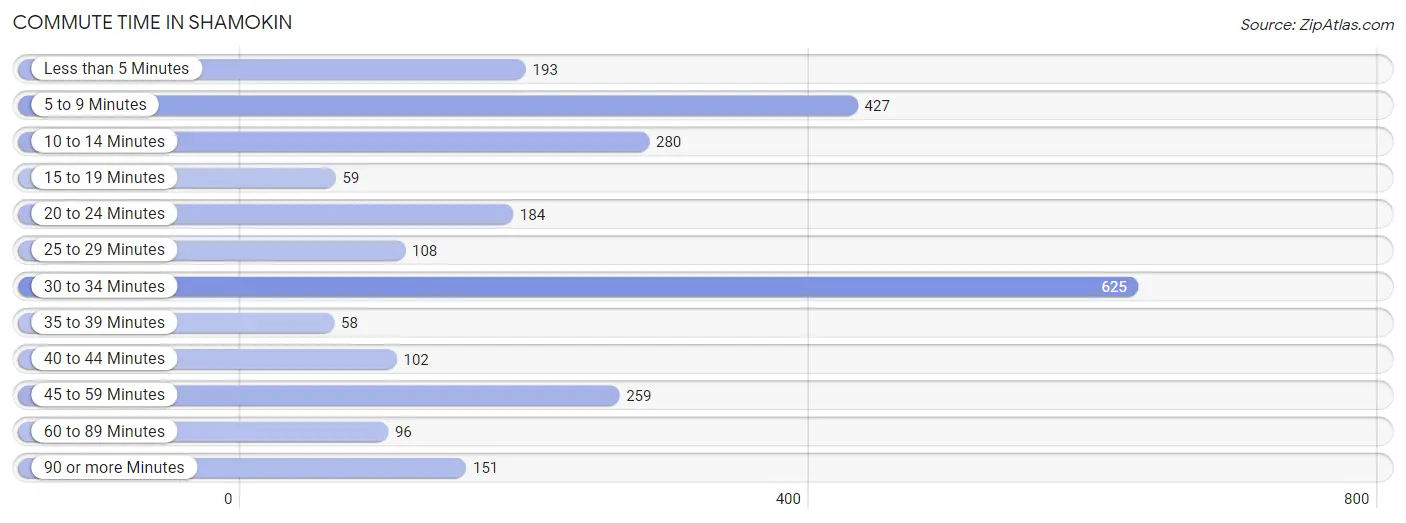
| Commute Time | # Commuters | % Commuters |
| Less than 5 Minutes | 193 | 7.6% |
| 5 to 9 Minutes | 427 | 16.8% |
| 10 to 14 Minutes | 280 | 11.0% |
| 15 to 19 Minutes | 59 | 2.3% |
| 20 to 24 Minutes | 184 | 7.2% |
| 25 to 29 Minutes | 108 | 4.3% |
| 30 to 34 Minutes | 625 | 24.6% |
| 35 to 39 Minutes | 58 | 2.3% |
| 40 to 44 Minutes | 102 | 4.0% |
| 45 to 59 Minutes | 259 | 10.2% |
| 60 to 89 Minutes | 96 | 3.8% |
| 90 or more Minutes | 151 | 5.9% |
Commute Time by Sex in Shamokin
The most common commute times in Shamokin are 30 to 34 minutes (262 commuters, 21.5%) for males and 30 to 34 minutes (363 commuters, 27.4%) for females.
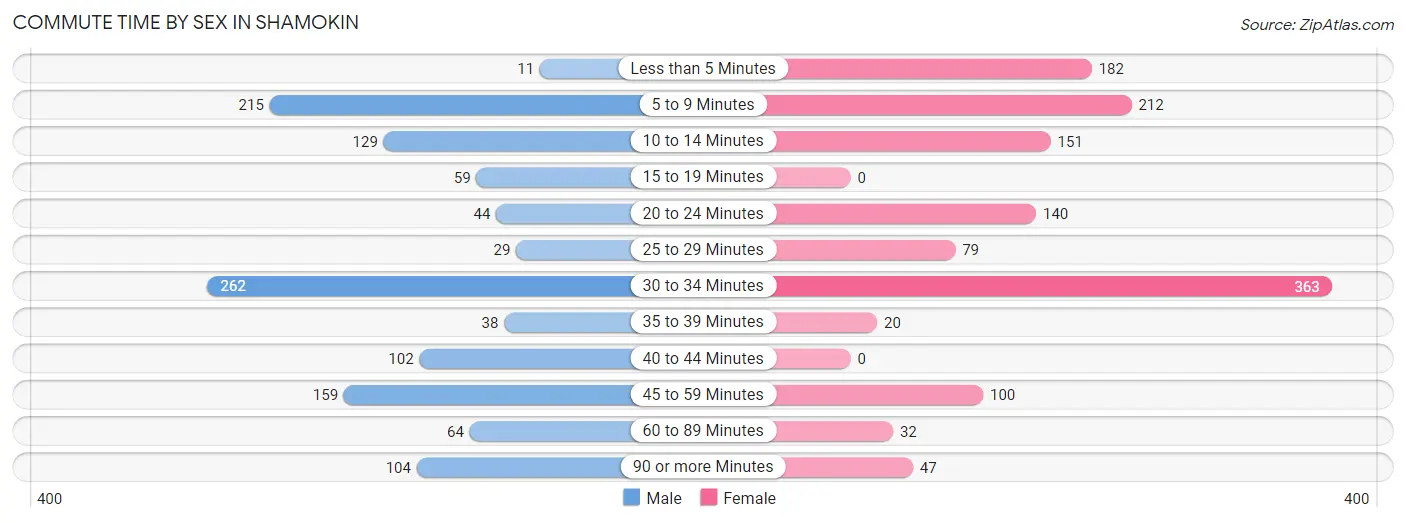
| Commute Time | Male | Female |
| Less than 5 Minutes | 11 (0.9%) | 182 (13.7%) |
| 5 to 9 Minutes | 215 (17.7%) | 212 (16.0%) |
| 10 to 14 Minutes | 129 (10.6%) | 151 (11.4%) |
| 15 to 19 Minutes | 59 (4.9%) | 0 (0.0%) |
| 20 to 24 Minutes | 44 (3.6%) | 140 (10.6%) |
| 25 to 29 Minutes | 29 (2.4%) | 79 (6.0%) |
| 30 to 34 Minutes | 262 (21.5%) | 363 (27.4%) |
| 35 to 39 Minutes | 38 (3.1%) | 20 (1.5%) |
| 40 to 44 Minutes | 102 (8.4%) | 0 (0.0%) |
| 45 to 59 Minutes | 159 (13.1%) | 100 (7.5%) |
| 60 to 89 Minutes | 64 (5.3%) | 32 (2.4%) |
| 90 or more Minutes | 104 (8.6%) | 47 (3.5%) |
Time of Departure to Work by Sex in Shamokin
The most frequent times of departure to work in Shamokin are 6:00 AM to 6:29 AM (167, 13.7%) for males and 7:00 AM to 7:29 AM (309, 23.3%) for females.
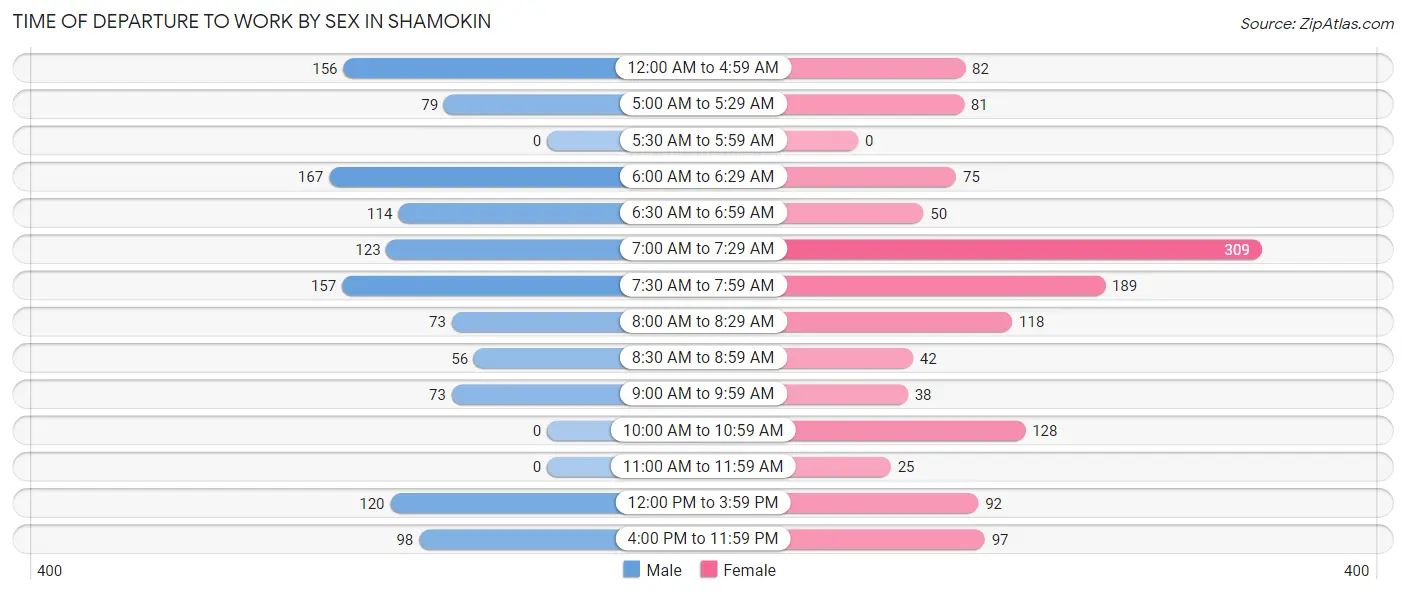
| Time of Departure | Male | Female |
| 12:00 AM to 4:59 AM | 156 (12.8%) | 82 (6.2%) |
| 5:00 AM to 5:29 AM | 79 (6.5%) | 81 (6.1%) |
| 5:30 AM to 5:59 AM | 0 (0.0%) | 0 (0.0%) |
| 6:00 AM to 6:29 AM | 167 (13.7%) | 75 (5.7%) |
| 6:30 AM to 6:59 AM | 114 (9.4%) | 50 (3.8%) |
| 7:00 AM to 7:29 AM | 123 (10.1%) | 309 (23.3%) |
| 7:30 AM to 7:59 AM | 157 (12.9%) | 189 (14.2%) |
| 8:00 AM to 8:29 AM | 73 (6.0%) | 118 (8.9%) |
| 8:30 AM to 8:59 AM | 56 (4.6%) | 42 (3.2%) |
| 9:00 AM to 9:59 AM | 73 (6.0%) | 38 (2.9%) |
| 10:00 AM to 10:59 AM | 0 (0.0%) | 128 (9.7%) |
| 11:00 AM to 11:59 AM | 0 (0.0%) | 25 (1.9%) |
| 12:00 PM to 3:59 PM | 120 (9.9%) | 92 (6.9%) |
| 4:00 PM to 11:59 PM | 98 (8.1%) | 97 (7.3%) |
| Total | 1,216 (100.0%) | 1,326 (100.0%) |
Housing Occupancy in Shamokin
Occupancy by Ownership in Shamokin
Of the total 2,872 dwellings in Shamokin, owner-occupied units account for 1,656 (57.7%), while renter-occupied units make up 1,216 (42.3%).
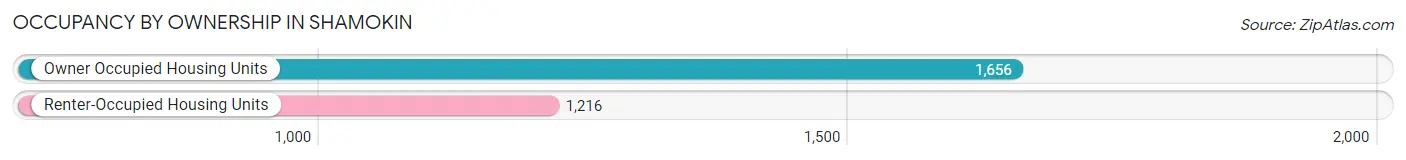
| Occupancy | # Housing Units | % Housing Units |
| Owner Occupied Housing Units | 1,656 | 57.7% |
| Renter-Occupied Housing Units | 1,216 | 42.3% |
| Total Occupied Housing Units | 2,872 | 100.0% |
Occupancy by Household Size in Shamokin
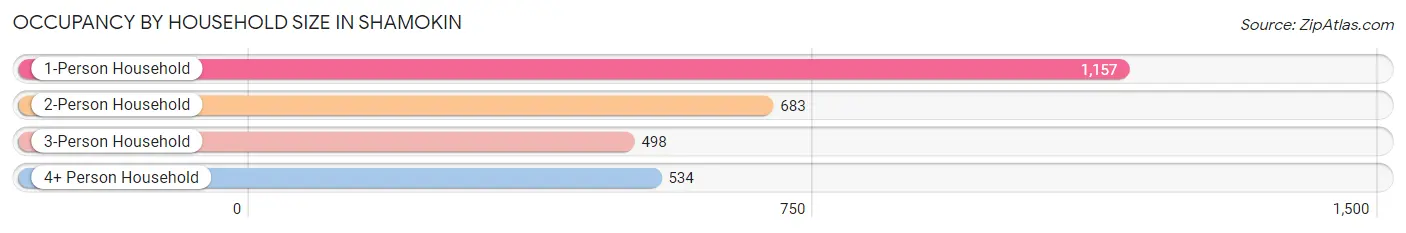
| Household Size | # Housing Units | % Housing Units |
| 1-Person Household | 1,157 | 40.3% |
| 2-Person Household | 683 | 23.8% |
| 3-Person Household | 498 | 17.3% |
| 4+ Person Household | 534 | 18.6% |
| Total Housing Units | 2,872 | 100.0% |
Occupancy by Ownership by Household Size in Shamokin
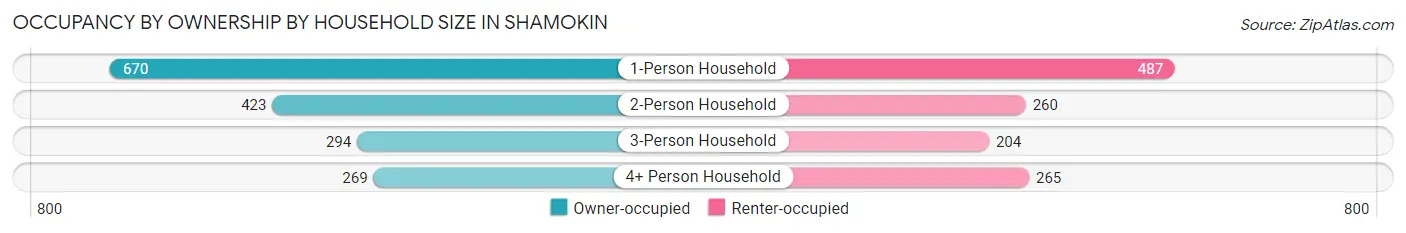
| Household Size | Owner-occupied | Renter-occupied |
| 1-Person Household | 670 (57.9%) | 487 (42.1%) |
| 2-Person Household | 423 (61.9%) | 260 (38.1%) |
| 3-Person Household | 294 (59.0%) | 204 (41.0%) |
| 4+ Person Household | 269 (50.4%) | 265 (49.6%) |
| Total Housing Units | 1,656 (57.7%) | 1,216 (42.3%) |
Occupancy by Educational Attainment in Shamokin
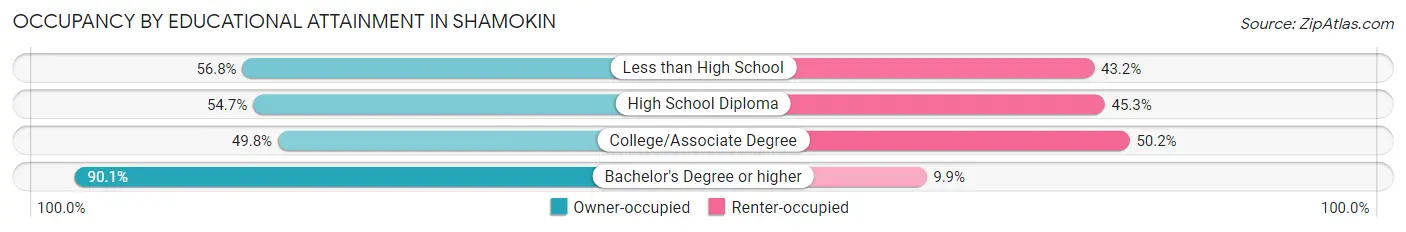
| Household Size | Owner-occupied | Renter-occupied |
| Less than High School | 296 (56.8%) | 225 (43.2%) |
| High School Diploma | 754 (54.7%) | 624 (45.3%) |
| College/Associate Degree | 334 (49.8%) | 337 (50.2%) |
| Bachelor's Degree or higher | 272 (90.1%) | 30 (9.9%) |
Occupancy by Age of Householder in Shamokin
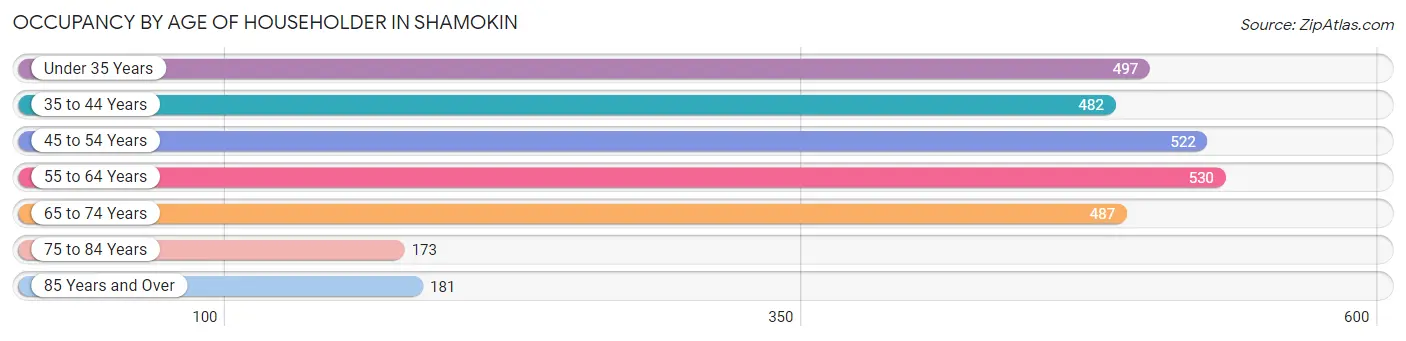
| Age Bracket | # Households | % Households |
| Under 35 Years | 497 | 17.3% |
| 35 to 44 Years | 482 | 16.8% |
| 45 to 54 Years | 522 | 18.2% |
| 55 to 64 Years | 530 | 18.4% |
| 65 to 74 Years | 487 | 17.0% |
| 75 to 84 Years | 173 | 6.0% |
| 85 Years and Over | 181 | 6.3% |
| Total | 2,872 | 100.0% |
Housing Finances in Shamokin
Median Income by Occupancy in Shamokin
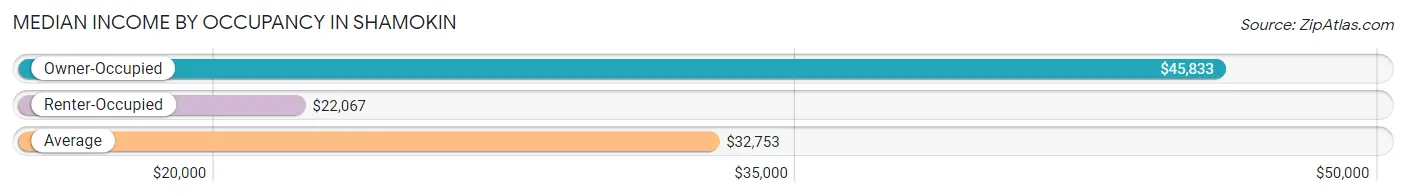
| Occupancy Type | # Households | Median Income |
| Owner-Occupied | 1,656 (57.7%) | $45,833 |
| Renter-Occupied | 1,216 (42.3%) | $22,067 |
| Average | 2,872 (100.0%) | $32,753 |
Occupancy by Householder Income Bracket in Shamokin
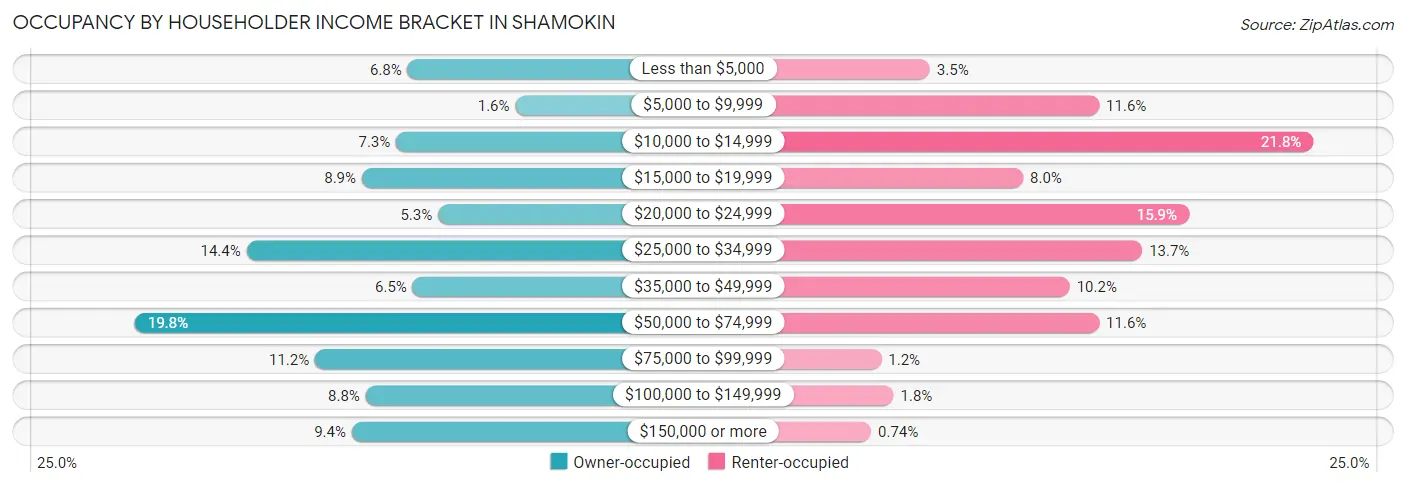
| Income Bracket | Owner-occupied | Renter-occupied |
| Less than $5,000 | 112 (6.8%) | 43 (3.5%) |
| $5,000 to $9,999 | 27 (1.6%) | 141 (11.6%) |
| $10,000 to $14,999 | 121 (7.3%) | 265 (21.8%) |
| $15,000 to $19,999 | 148 (8.9%) | 97 (8.0%) |
| $20,000 to $24,999 | 88 (5.3%) | 193 (15.9%) |
| $25,000 to $34,999 | 239 (14.4%) | 166 (13.7%) |
| $35,000 to $49,999 | 108 (6.5%) | 124 (10.2%) |
| $50,000 to $74,999 | 327 (19.8%) | 141 (11.6%) |
| $75,000 to $99,999 | 185 (11.2%) | 15 (1.2%) |
| $100,000 to $149,999 | 145 (8.8%) | 22 (1.8%) |
| $150,000 or more | 156 (9.4%) | 9 (0.7%) |
| Total | 1,656 (100.0%) | 1,216 (100.0%) |
Monthly Housing Cost Tiers in Shamokin
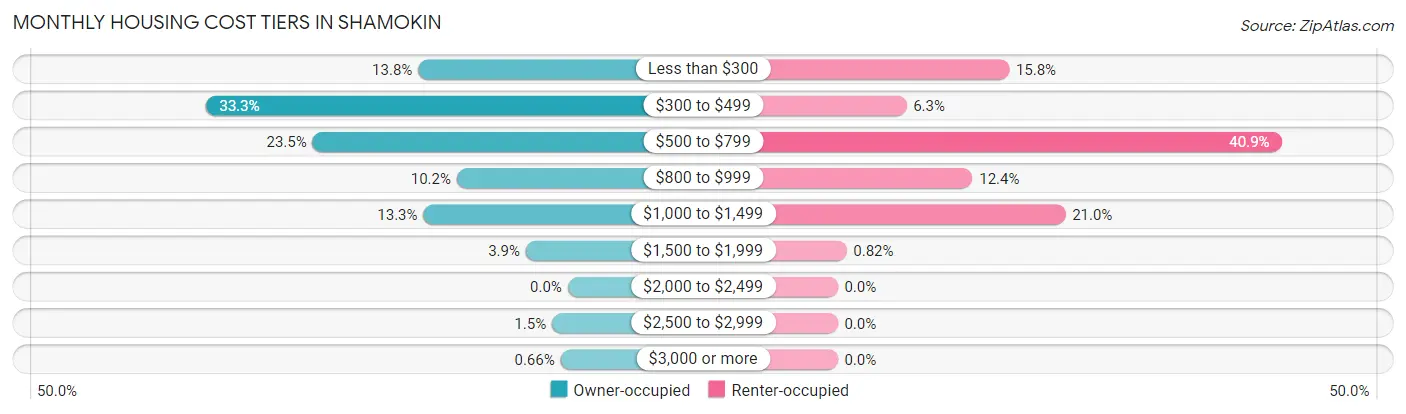
| Monthly Cost | Owner-occupied | Renter-occupied |
| Less than $300 | 228 (13.8%) | 192 (15.8%) |
| $300 to $499 | 551 (33.3%) | 77 (6.3%) |
| $500 to $799 | 389 (23.5%) | 497 (40.9%) |
| $800 to $999 | 169 (10.2%) | 151 (12.4%) |
| $1,000 to $1,499 | 220 (13.3%) | 255 (21.0%) |
| $1,500 to $1,999 | 64 (3.9%) | 10 (0.8%) |
| $2,000 to $2,499 | 0 (0.0%) | 0 (0.0%) |
| $2,500 to $2,999 | 24 (1.5%) | 0 (0.0%) |
| $3,000 or more | 11 (0.7%) | 0 (0.0%) |
| Total | 1,656 (100.0%) | 1,216 (100.0%) |
Physical Housing Characteristics in Shamokin
Housing Structures in Shamokin
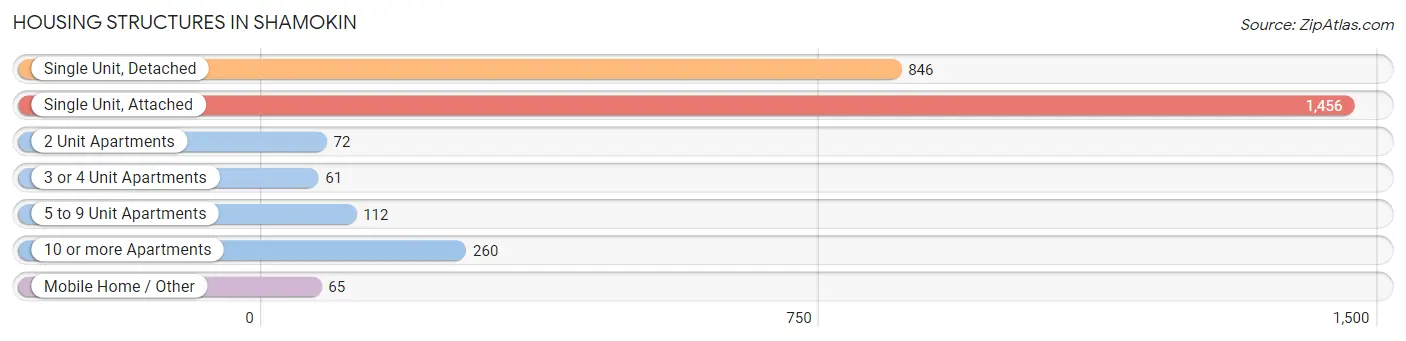
| Structure Type | # Housing Units | % Housing Units |
| Single Unit, Detached | 846 | 29.5% |
| Single Unit, Attached | 1,456 | 50.7% |
| 2 Unit Apartments | 72 | 2.5% |
| 3 or 4 Unit Apartments | 61 | 2.1% |
| 5 to 9 Unit Apartments | 112 | 3.9% |
| 10 or more Apartments | 260 | 9.0% |
| Mobile Home / Other | 65 | 2.3% |
| Total | 2,872 | 100.0% |
Housing Structures by Occupancy in Shamokin
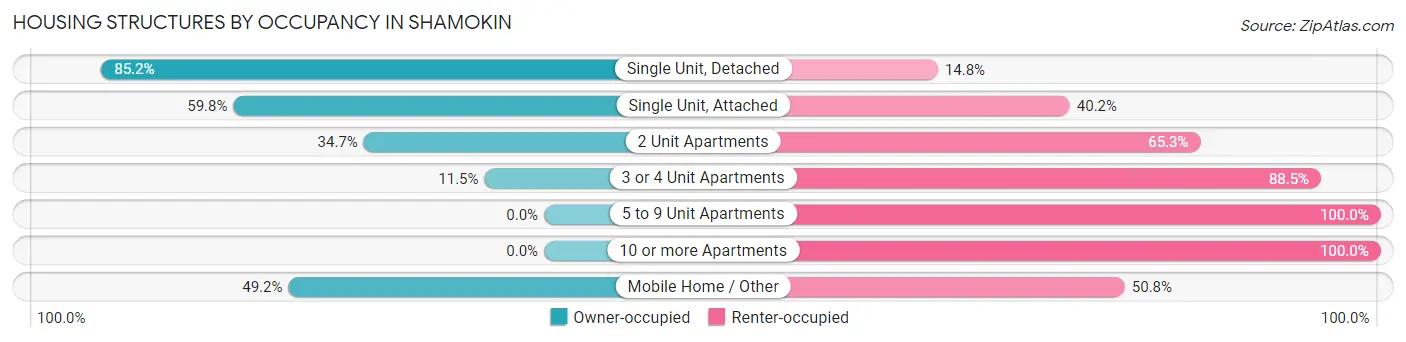
| Structure Type | Owner-occupied | Renter-occupied |
| Single Unit, Detached | 721 (85.2%) | 125 (14.8%) |
| Single Unit, Attached | 871 (59.8%) | 585 (40.2%) |
| 2 Unit Apartments | 25 (34.7%) | 47 (65.3%) |
| 3 or 4 Unit Apartments | 7 (11.5%) | 54 (88.5%) |
| 5 to 9 Unit Apartments | 0 (0.0%) | 112 (100.0%) |
| 10 or more Apartments | 0 (0.0%) | 260 (100.0%) |
| Mobile Home / Other | 32 (49.2%) | 33 (50.8%) |
| Total | 1,656 (57.7%) | 1,216 (42.3%) |
Housing Structures by Number of Rooms in Shamokin
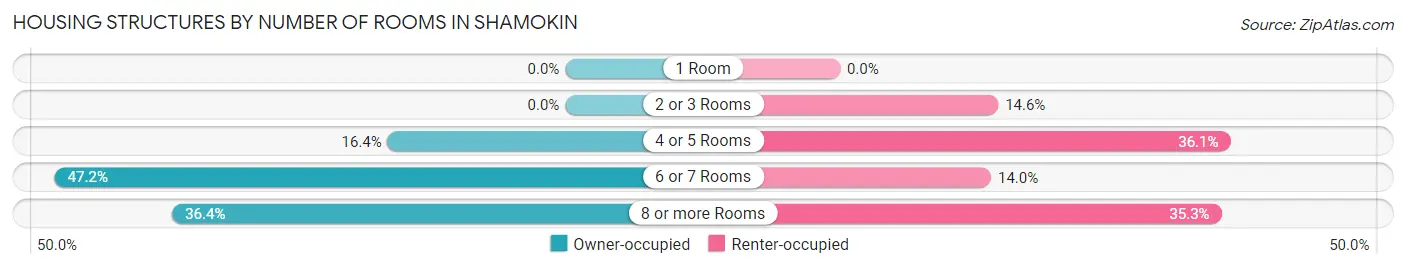
| Number of Rooms | Owner-occupied | Renter-occupied |
| 1 Room | 0 (0.0%) | 0 (0.0%) |
| 2 or 3 Rooms | 0 (0.0%) | 178 (14.6%) |
| 4 or 5 Rooms | 272 (16.4%) | 439 (36.1%) |
| 6 or 7 Rooms | 782 (47.2%) | 170 (14.0%) |
| 8 or more Rooms | 602 (36.3%) | 429 (35.3%) |
| Total | 1,656 (100.0%) | 1,216 (100.0%) |
Housing Structure by Heating Type in Shamokin
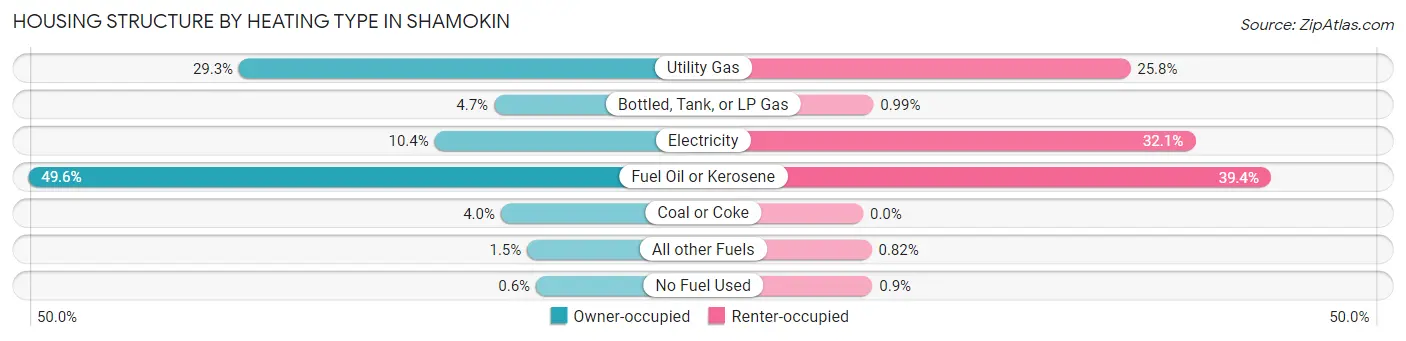
| Heating Type | Owner-occupied | Renter-occupied |
| Utility Gas | 485 (29.3%) | 314 (25.8%) |
| Bottled, Tank, or LP Gas | 77 (4.6%) | 12 (1.0%) |
| Electricity | 172 (10.4%) | 390 (32.1%) |
| Fuel Oil or Kerosene | 822 (49.6%) | 479 (39.4%) |
| Coal or Coke | 66 (4.0%) | 0 (0.0%) |
| All other Fuels | 24 (1.5%) | 10 (0.8%) |
| No Fuel Used | 10 (0.6%) | 11 (0.9%) |
| Total | 1,656 (100.0%) | 1,216 (100.0%) |
Household Vehicle Usage in Shamokin
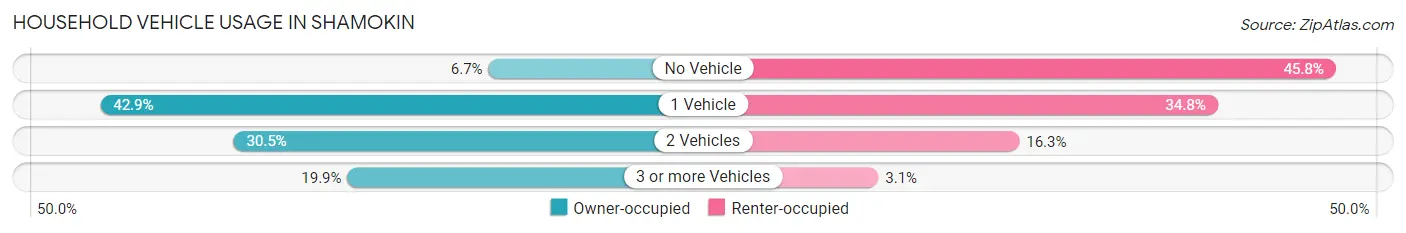
| Vehicles per Household | Owner-occupied | Renter-occupied |
| No Vehicle | 111 (6.7%) | 557 (45.8%) |
| 1 Vehicle | 711 (42.9%) | 423 (34.8%) |
| 2 Vehicles | 505 (30.5%) | 198 (16.3%) |
| 3 or more Vehicles | 329 (19.9%) | 38 (3.1%) |
| Total | 1,656 (100.0%) | 1,216 (100.0%) |
Real Estate & Mortgages in Shamokin
Real Estate and Mortgage Overview in Shamokin
| Characteristic | Without Mortgage | With Mortgage |
| Housing Units | 974 | 682 |
| Median Property Value | $42,500 | $86,400 |
| Median Household Income | $33,789 | $128 |
| Monthly Housing Costs | $401 | $11 |
| Real Estate Taxes | $746 | $12 |
Property Value by Mortgage Status in Shamokin
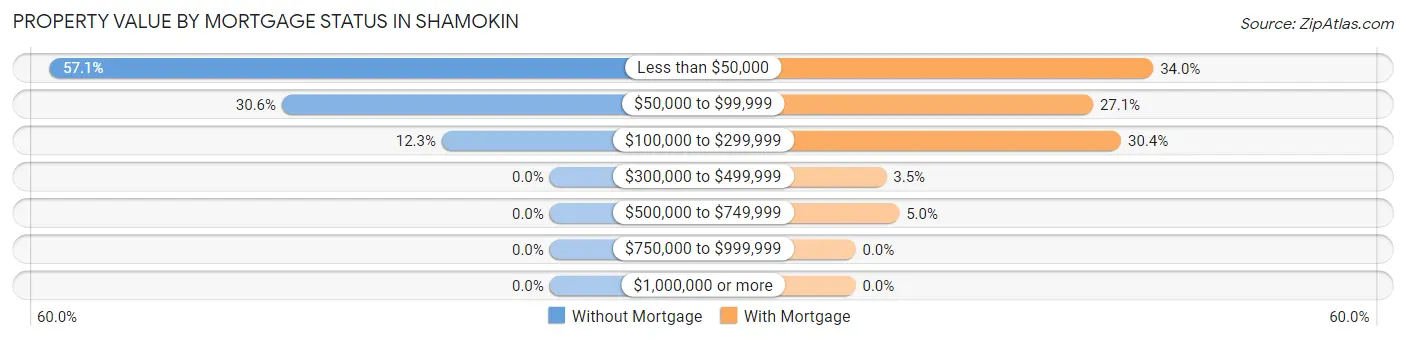
| Property Value | Without Mortgage | With Mortgage |
| Less than $50,000 | 556 (57.1%) | 232 (34.0%) |
| $50,000 to $99,999 | 298 (30.6%) | 185 (27.1%) |
| $100,000 to $299,999 | 120 (12.3%) | 207 (30.3%) |
| $300,000 to $499,999 | 0 (0.0%) | 24 (3.5%) |
| $500,000 to $749,999 | 0 (0.0%) | 34 (5.0%) |
| $750,000 to $999,999 | 0 (0.0%) | 0 (0.0%) |
| $1,000,000 or more | 0 (0.0%) | 0 (0.0%) |
| Total | 974 (100.0%) | 682 (100.0%) |
Household Income by Mortgage Status in Shamokin
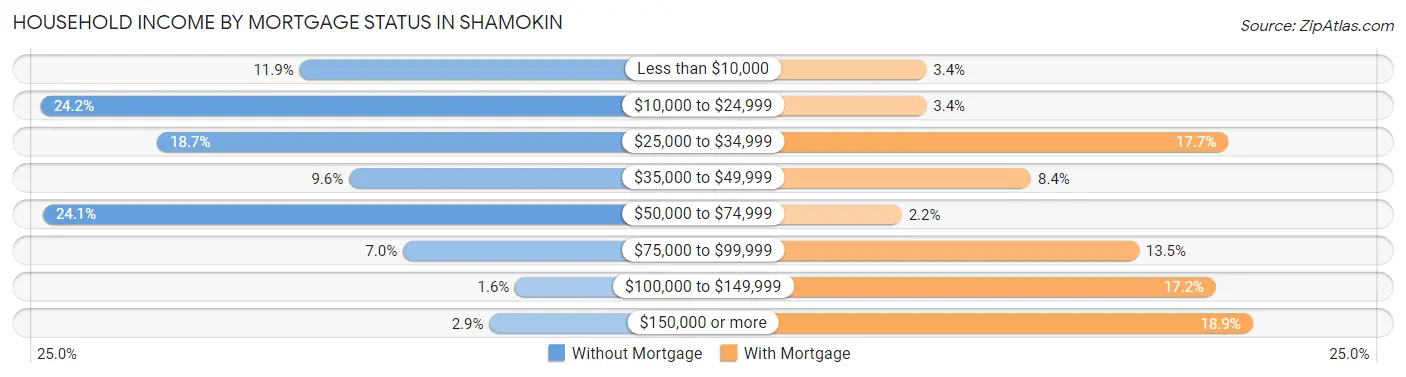
| Household Income | Without Mortgage | With Mortgage |
| Less than $10,000 | 116 (11.9%) | 23 (3.4%) |
| $10,000 to $24,999 | 236 (24.2%) | 23 (3.4%) |
| $25,000 to $34,999 | 182 (18.7%) | 121 (17.7%) |
| $35,000 to $49,999 | 93 (9.6%) | 57 (8.4%) |
| $50,000 to $74,999 | 235 (24.1%) | 15 (2.2%) |
| $75,000 to $99,999 | 68 (7.0%) | 92 (13.5%) |
| $100,000 to $149,999 | 16 (1.6%) | 117 (17.2%) |
| $150,000 or more | 28 (2.9%) | 129 (18.9%) |
| Total | 974 (100.0%) | 682 (100.0%) |
Property Value to Household Income Ratio in Shamokin
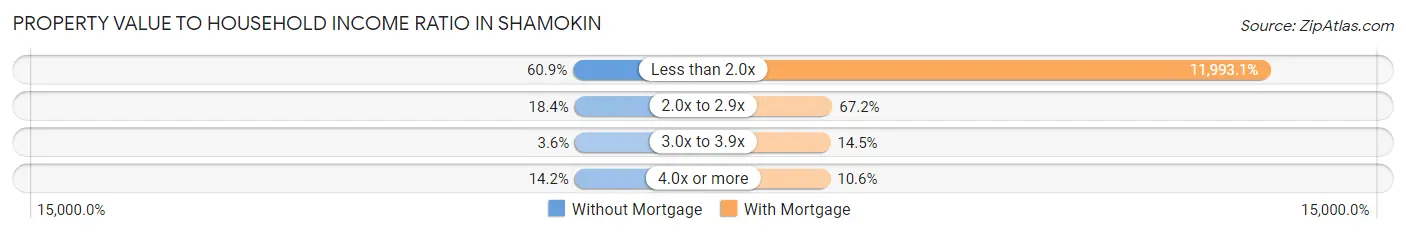
| Value-to-Income Ratio | Without Mortgage | With Mortgage |
| Less than 2.0x | 593 (60.9%) | 81,793 (11,993.1%) |
| 2.0x to 2.9x | 179 (18.4%) | 458 (67.2%) |
| 3.0x to 3.9x | 35 (3.6%) | 99 (14.5%) |
| 4.0x or more | 138 (14.2%) | 72 (10.6%) |
| Total | 974 (100.0%) | 682 (100.0%) |
Real Estate Taxes by Mortgage Status in Shamokin
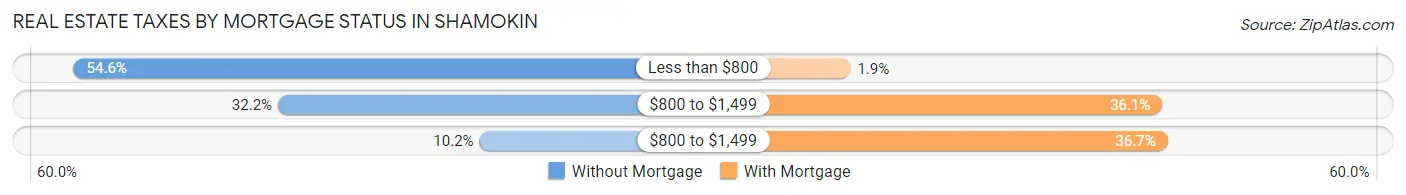
| Property Taxes | Without Mortgage | With Mortgage |
| Less than $800 | 532 (54.6%) | 13 (1.9%) |
| $800 to $1,499 | 314 (32.2%) | 246 (36.1%) |
| $800 to $1,499 | 99 (10.2%) | 250 (36.7%) |
| Total | 974 (100.0%) | 682 (100.0%) |
Health & Disability in Shamokin
Health Insurance Coverage by Age in Shamokin
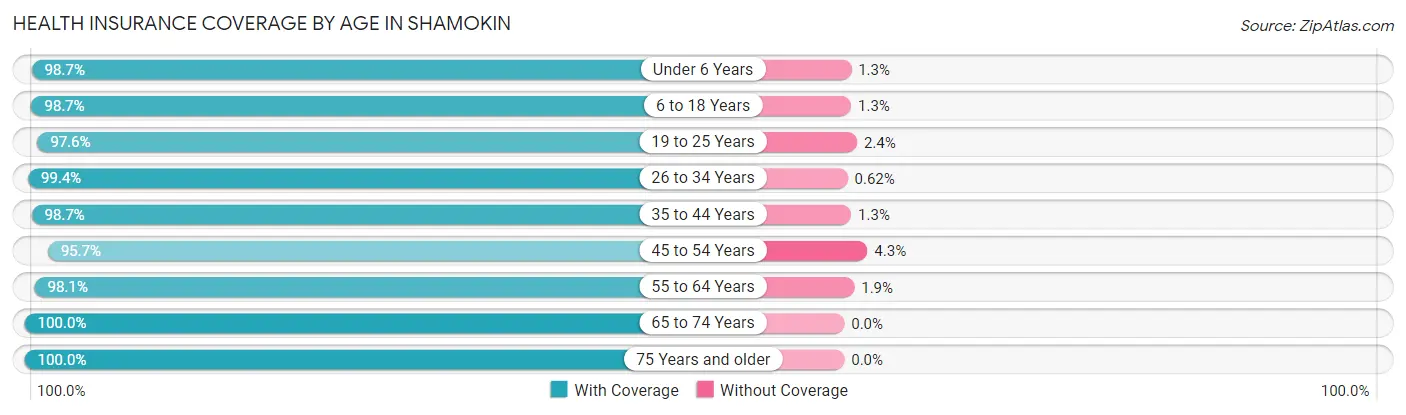
| Age Bracket | With Coverage | Without Coverage |
| Under 6 Years | 613 (98.7%) | 8 (1.3%) |
| 6 to 18 Years | 1,170 (98.7%) | 15 (1.3%) |
| 19 to 25 Years | 660 (97.6%) | 16 (2.4%) |
| 26 to 34 Years | 638 (99.4%) | 4 (0.6%) |
| 35 to 44 Years | 1,000 (98.7%) | 13 (1.3%) |
| 45 to 54 Years | 976 (95.7%) | 44 (4.3%) |
| 55 to 64 Years | 686 (98.1%) | 13 (1.9%) |
| 65 to 74 Years | 663 (100.0%) | 0 (0.0%) |
| 75 Years and older | 396 (100.0%) | 0 (0.0%) |
| Total | 6,802 (98.4%) | 113 (1.6%) |
Health Insurance Coverage by Citizenship Status in Shamokin
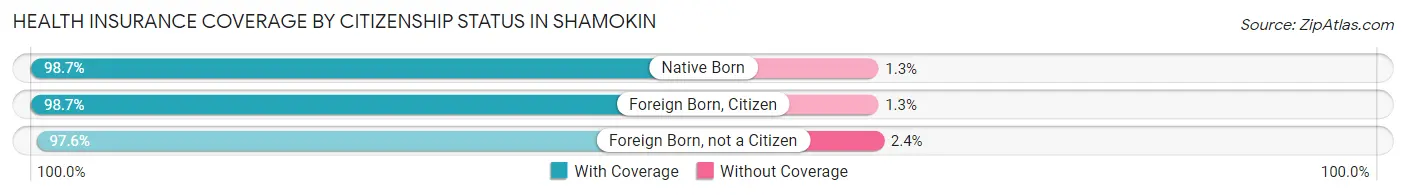
| Citizenship Status | With Coverage | Without Coverage |
| Native Born | 613 (98.7%) | 8 (1.3%) |
| Foreign Born, Citizen | 1,170 (98.7%) | 15 (1.3%) |
| Foreign Born, not a Citizen | 660 (97.6%) | 16 (2.4%) |
Health Insurance Coverage by Household Income in Shamokin
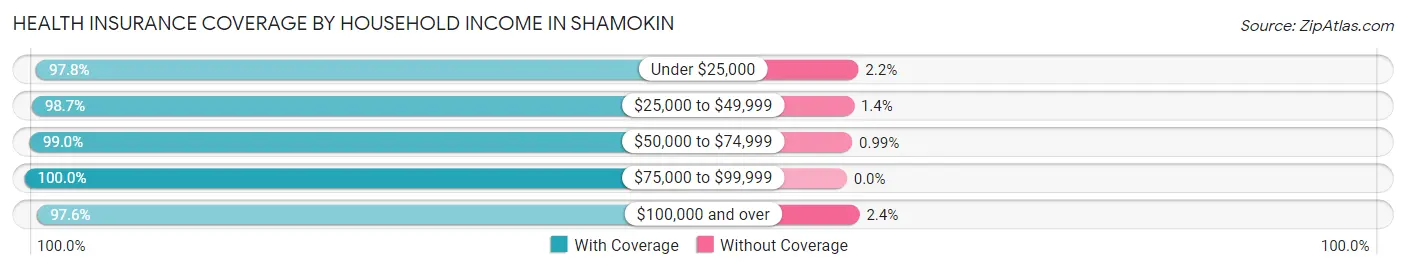
| Household Income | With Coverage | Without Coverage |
| Under $25,000 | 2,572 (97.8%) | 57 (2.2%) |
| $25,000 to $49,999 | 1,165 (98.7%) | 16 (1.3%) |
| $50,000 to $74,999 | 1,301 (99.0%) | 13 (1.0%) |
| $75,000 to $99,999 | 634 (100.0%) | 0 (0.0%) |
| $100,000 and over | 1,110 (97.6%) | 27 (2.4%) |
Public vs Private Health Insurance Coverage by Age in Shamokin
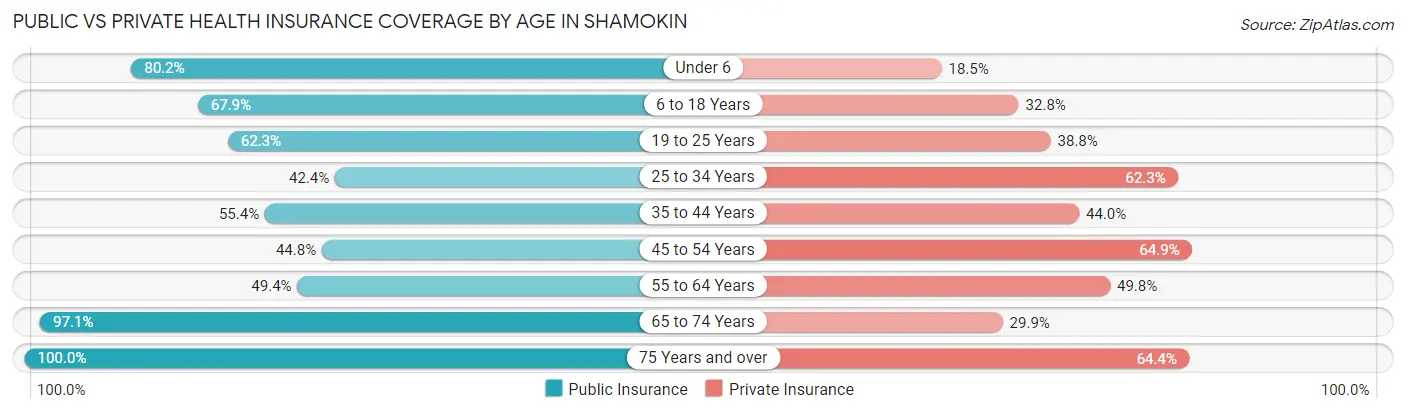
| Age Bracket | Public Insurance | Private Insurance |
| Under 6 | 498 (80.2%) | 115 (18.5%) |
| 6 to 18 Years | 804 (67.8%) | 389 (32.8%) |
| 19 to 25 Years | 421 (62.3%) | 262 (38.8%) |
| 25 to 34 Years | 272 (42.4%) | 400 (62.3%) |
| 35 to 44 Years | 561 (55.4%) | 446 (44.0%) |
| 45 to 54 Years | 457 (44.8%) | 662 (64.9%) |
| 55 to 64 Years | 345 (49.4%) | 348 (49.8%) |
| 65 to 74 Years | 644 (97.1%) | 198 (29.9%) |
| 75 Years and over | 396 (100.0%) | 255 (64.4%) |
| Total | 4,398 (63.6%) | 3,075 (44.5%) |
Disability Status by Sex by Age in Shamokin
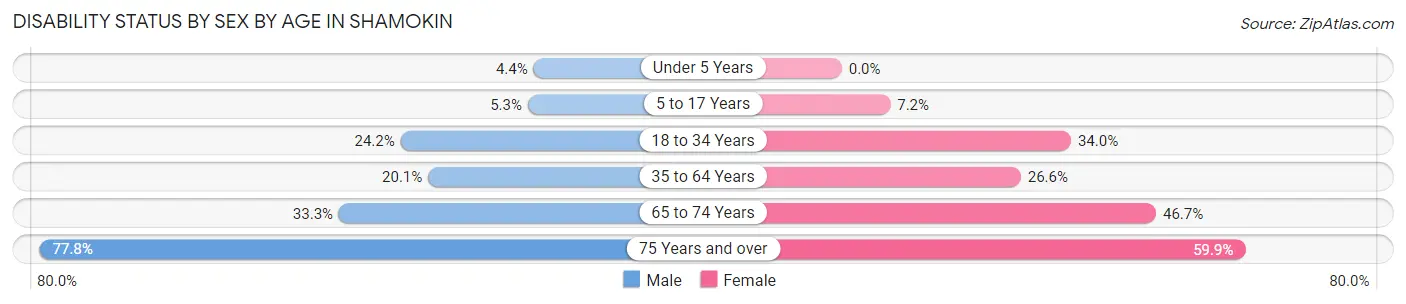
| Age Bracket | Male | Female |
| Under 5 Years | 12 (4.4%) | 0 (0.0%) |
| 5 to 17 Years | 40 (5.3%) | 39 (7.2%) |
| 18 to 34 Years | 162 (24.2%) | 228 (34.0%) |
| 35 to 64 Years | 266 (20.1%) | 374 (26.6%) |
| 65 to 74 Years | 96 (33.3%) | 175 (46.7%) |
| 75 Years and over | 147 (77.8%) | 124 (59.9%) |
Disability Class by Sex by Age in Shamokin
Disability Class: Hearing Difficulty
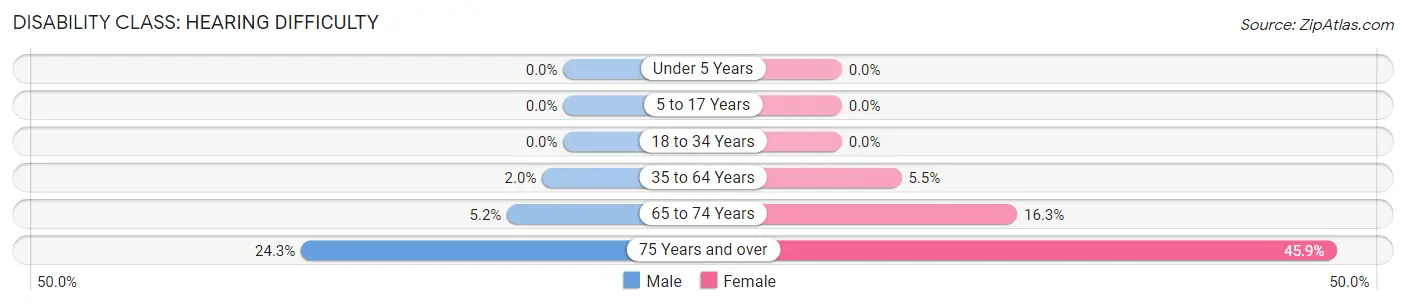
| Age Bracket | Male | Female |
| Under 5 Years | 0 (0.0%) | 0 (0.0%) |
| 5 to 17 Years | 0 (0.0%) | 0 (0.0%) |
| 18 to 34 Years | 0 (0.0%) | 0 (0.0%) |
| 35 to 64 Years | 26 (2.0%) | 78 (5.5%) |
| 65 to 74 Years | 15 (5.2%) | 61 (16.3%) |
| 75 Years and over | 46 (24.3%) | 95 (45.9%) |
Disability Class: Vision Difficulty
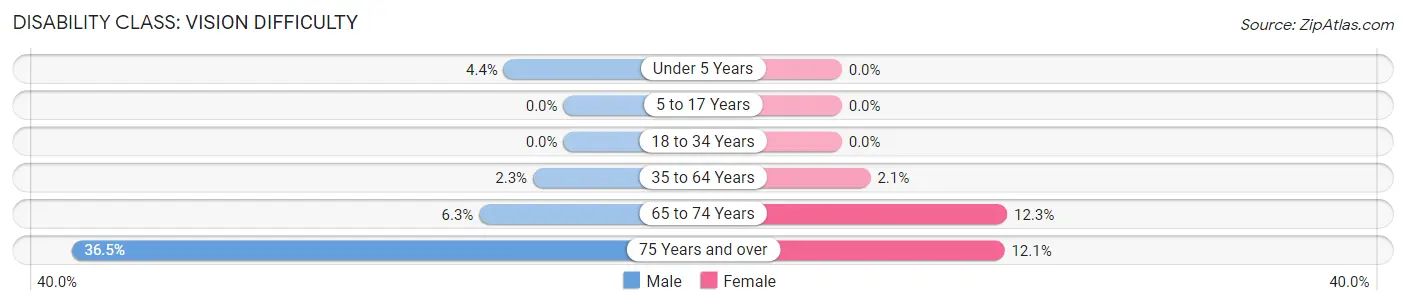
| Age Bracket | Male | Female |
| Under 5 Years | 12 (4.4%) | 0 (0.0%) |
| 5 to 17 Years | 0 (0.0%) | 0 (0.0%) |
| 18 to 34 Years | 0 (0.0%) | 0 (0.0%) |
| 35 to 64 Years | 30 (2.3%) | 30 (2.1%) |
| 65 to 74 Years | 18 (6.2%) | 46 (12.3%) |
| 75 Years and over | 69 (36.5%) | 25 (12.1%) |
Disability Class: Cognitive Difficulty
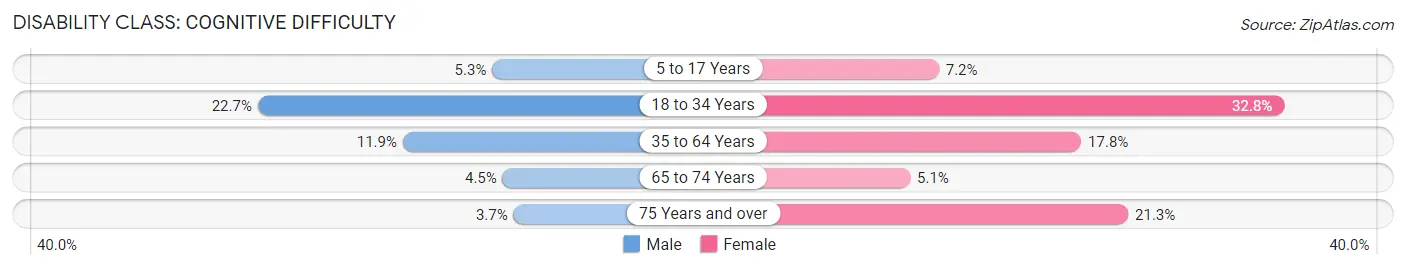
| Age Bracket | Male | Female |
| 5 to 17 Years | 40 (5.3%) | 39 (7.2%) |
| 18 to 34 Years | 152 (22.7%) | 220 (32.8%) |
| 35 to 64 Years | 158 (11.9%) | 250 (17.8%) |
| 65 to 74 Years | 13 (4.5%) | 19 (5.1%) |
| 75 Years and over | 7 (3.7%) | 44 (21.3%) |
Disability Class: Ambulatory Difficulty
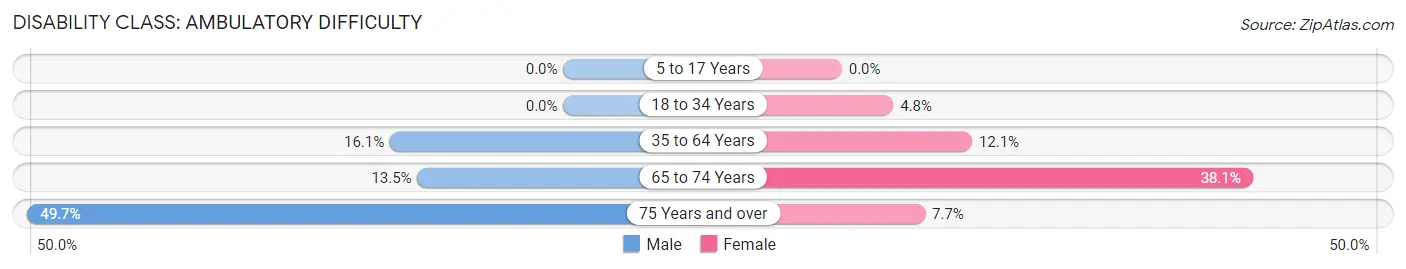
| Age Bracket | Male | Female |
| 5 to 17 Years | 0 (0.0%) | 0 (0.0%) |
| 18 to 34 Years | 0 (0.0%) | 32 (4.8%) |
| 35 to 64 Years | 213 (16.1%) | 170 (12.1%) |
| 65 to 74 Years | 39 (13.5%) | 143 (38.1%) |
| 75 Years and over | 94 (49.7%) | 16 (7.7%) |
Disability Class: Self-Care Difficulty
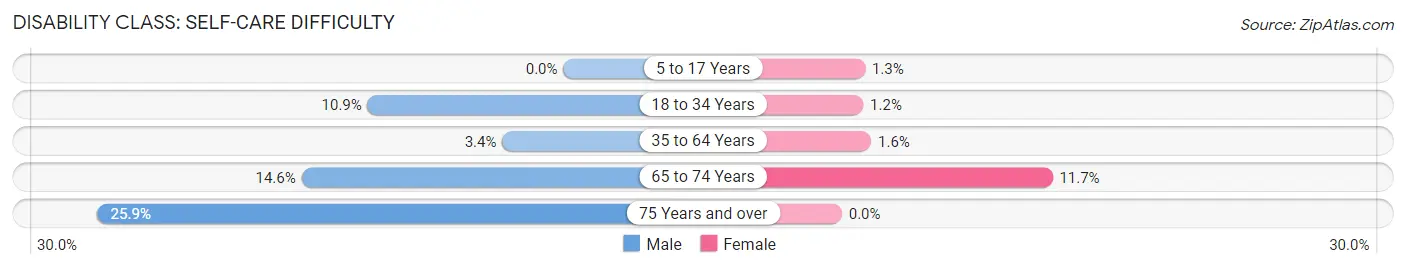
| Age Bracket | Male | Female |
| 5 to 17 Years | 0 (0.0%) | 7 (1.3%) |
| 18 to 34 Years | 73 (10.9%) | 8 (1.2%) |
| 35 to 64 Years | 45 (3.4%) | 23 (1.6%) |
| 65 to 74 Years | 42 (14.6%) | 44 (11.7%) |
| 75 Years and over | 49 (25.9%) | 0 (0.0%) |
Technology Access in Shamokin
Computing Device Access in Shamokin
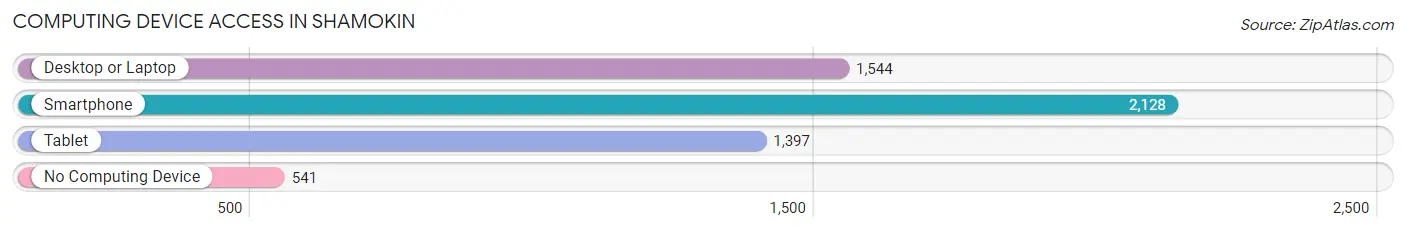
| Device Type | # Households | % Households |
| Desktop or Laptop | 1,544 | 53.8% |
| Smartphone | 2,128 | 74.1% |
| Tablet | 1,397 | 48.6% |
| No Computing Device | 541 | 18.8% |
| Total | 2,872 | 100.0% |
Internet Access in Shamokin
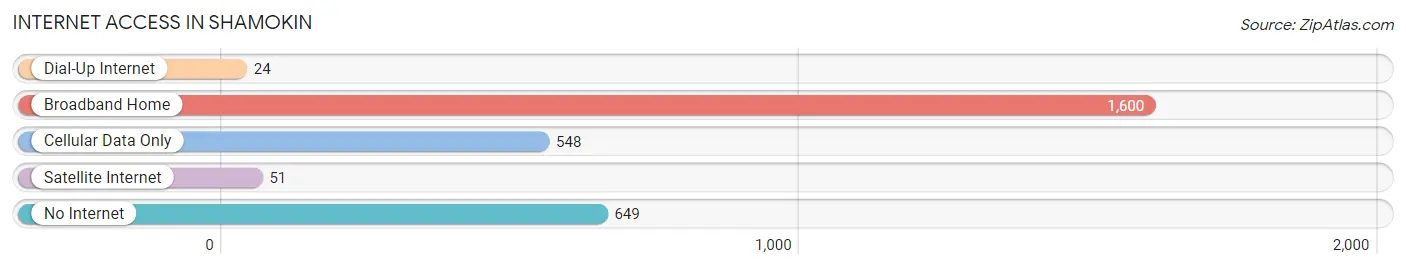
| Internet Type | # Households | % Households |
| Dial-Up Internet | 24 | 0.8% |
| Broadband Home | 1,600 | 55.7% |
| Cellular Data Only | 548 | 19.1% |
| Satellite Internet | 51 | 1.8% |
| No Internet | 649 | 22.6% |
| Total | 2,872 | 100.0% |
Shamokin Summary
History
The history of Shamokin, Pennsylvania dates back to the mid-1700s when the area was first settled by Europeans. The town was originally known as Sunbury, but was renamed Shamokin in 1773. The name is derived from the Native American term “Shamokin” which means “place of eels”. The town was founded by a group of German immigrants who were looking for a place to settle and start a new life.
The town quickly grew and became an important trading center in the region. It was a major stop on the Susquehanna and Lehigh Canal, which connected the Susquehanna River to the Lehigh River. The canal was a major transportation route for goods and people in the area.
In the late 1800s, Shamokin became an important coal mining center. The town was home to several large coal mines, which provided jobs for many of the town’s residents. The coal industry was the main source of income for the town until the mid-1900s when the industry began to decline.
Geography
Shamokin is located in Northumberland County, Pennsylvania. It is situated in the Susquehanna Valley, which is a large valley that stretches from the Allegheny Mountains to the Atlantic Ocean. The town is located on the banks of the Susquehanna River, which is the longest river in the United States.
The town is surrounded by rolling hills and mountains, which provide a beautiful backdrop for the town. The climate in Shamokin is humid continental, which means that the summers are hot and humid and the winters are cold and snowy.
Economy
The economy of Shamokin is largely based on the coal industry. The town is home to several large coal mines, which provide jobs for many of the town’s residents. The coal industry is the main source of income for the town.
In addition to the coal industry, Shamokin is also home to several manufacturing companies. These companies produce a variety of products, including furniture, clothing, and electronics.
The town is also home to several retail stores, restaurants, and other businesses. These businesses provide jobs for many of the town’s residents.
Demographics
As of the 2010 census, the population of Shamokin was 7,374. The town has a population density of 1,845 people per square mile. The median age of the town’s residents is 38.7 years.
The racial makeup of the town is 97.3% White, 0.7% African American, 0.2% Native American, 0.3% Asian, 0.1% Pacific Islander, 0.4% from other races, and 1.0% from two or more races. The town’s population is also diverse in terms of religion, with the majority of the population being Roman Catholic (44.3%), followed by Protestant (25.2%), and other religions (30.5%).
The median household income in Shamokin is $35,945, and the median family income is $41,945. The town’s poverty rate is 17.3%. The unemployment rate in Shamokin is 8.2%.
Common Questions
What is Per Capita Income in Shamokin?
Per Capita income in Shamokin is $21,579.
What is the Median Family Income in Shamokin?
Median Family Income in Shamokin is $38,616.
What is the Median Household income in Shamokin?
Median Household Income in Shamokin is $32,753.
What is Income or Wage Gap in Shamokin?
Income or Wage Gap in Shamokin is 52.3%.
Women in Shamokin earn 47.7 cents for every dollar earned by a man.
What is Inequality or Gini Index in Shamokin?
Inequality or Gini Index in Shamokin is 0.51.
What is the Total Population of Shamokin?
Total Population of Shamokin is 6,915.
What is the Total Male Population of Shamokin?
Total Male Population of Shamokin is 3,501.
What is the Total Female Population of Shamokin?
Total Female Population of Shamokin is 3,414.
What is the Ratio of Males per 100 Females in Shamokin?
There are 102.55 Males per 100 Females in Shamokin.
What is the Ratio of Females per 100 Males in Shamokin?
There are 97.51 Females per 100 Males in Shamokin.
What is the Median Population Age in Shamokin?
Median Population Age in Shamokin is 38.1 Years.
What is the Average Family Size in Shamokin
Average Family Size in Shamokin is 3.2 People.
What is the Average Household Size in Shamokin
Average Household Size in Shamokin is 2.4 People.
How Large is the Labor Force in Shamokin?
There are 3,042 People in the Labor Forcein in Shamokin.
What is the Percentage of People in the Labor Force in Shamokin?
57.5% of People are in the Labor Force in Shamokin.
What is the Unemployment Rate in Shamokin?
Unemployment Rate in Shamokin is 8.7%.