Pottsville, PA Map & Demographics
Pottsville Map
Pottsville Overview
$27,200
PER CAPITA INCOME
$57,934
AVG FAMILY INCOME
$46,081
AVG HOUSEHOLD INCOME
37.5%
WAGE / INCOME GAP [ % ]
62.5¢/ $1
WAGE / INCOME GAP [ $ ]
$11,086
FAMILY INCOME DEFICIT
0.45
INEQUALITY / GINI INDEX
13,386
TOTAL POPULATION
5,914
MALE POPULATION
7,472
FEMALE POPULATION
79.15
MALES / 100 FEMALES
126.34
FEMALES / 100 MALES
39.6
MEDIAN AGE
2.9
AVG FAMILY SIZE
2.2
AVG HOUSEHOLD SIZE
6,594
LABOR FORCE [ PEOPLE ]
61.7%
PERCENT IN LABOR FORCE
9.5%
UNEMPLOYMENT RATE
Pottsville Zip Codes
Pottsville Area Codes
Income in Pottsville
Income Overview in Pottsville
Per Capita Income in Pottsville is $27,200, while median incomes of families and households are $57,934 and $46,081 respectively.
| Characteristic | Number | Measure |
| Per Capita Income | 13,386 | $27,200 |
| Median Family Income | 3,179 | $57,934 |
| Mean Family Income | 3,179 | $72,078 |
| Median Household Income | 5,655 | $46,081 |
| Mean Household Income | 5,655 | $62,677 |
| Income Deficit | 3,179 | $11,086 |
| Wage / Income Gap (%) | 13,386 | 37.51% |
| Wage / Income Gap ($) | 13,386 | 62.49¢ per $1 |
| Gini / Inequality Index | 13,386 | 0.45 |
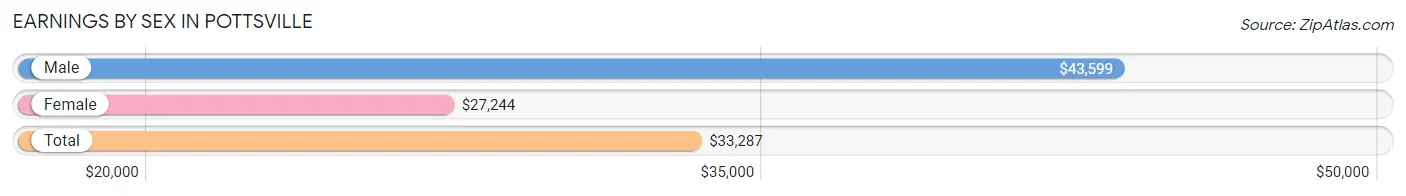
Earnings by Sex in Pottsville
Average Earnings in Pottsville are $33,287, $43,599 for men and $27,244 for women, a difference of 37.5%.
| Sex | Number | Average Earnings |
| Male | 3,099 (46.8%) | $43,599 |
| Female | 3,523 (53.2%) | $27,244 |
| Total | 6,622 (100.0%) | $33,287 |
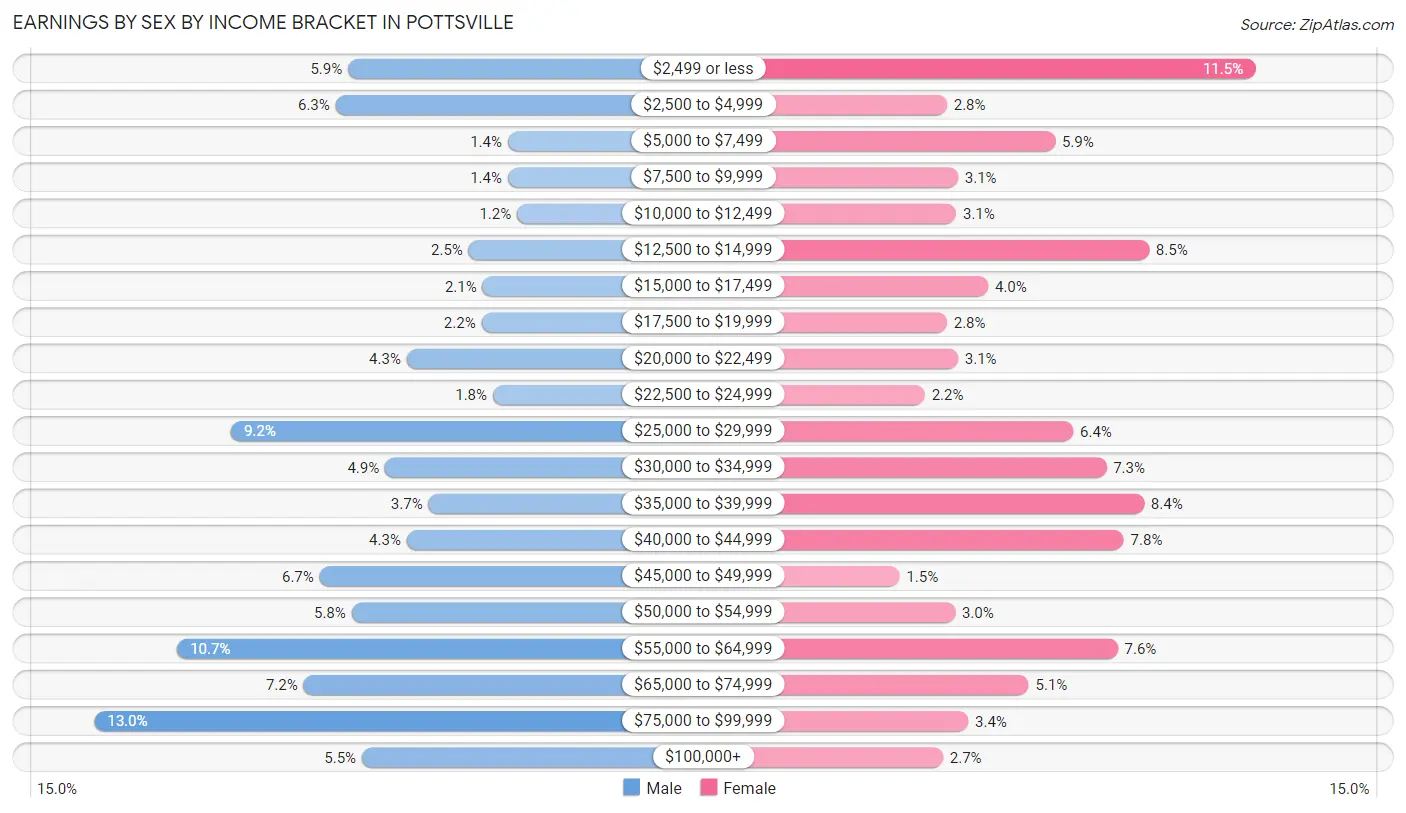
Earnings by Sex by Income Bracket in Pottsville
The most common earnings brackets in Pottsville are $75,000 to $99,999 for men (404 | 13.0%) and $2,499 or less for women (404 | 11.5%).
| Income | Male | Female |
| $2,499 or less | 183 (5.9%) | 404 (11.5%) |
| $2,500 to $4,999 | 194 (6.3%) | 99 (2.8%) |
| $5,000 to $7,499 | 44 (1.4%) | 206 (5.9%) |
| $7,500 to $9,999 | 44 (1.4%) | 110 (3.1%) |
| $10,000 to $12,499 | 36 (1.2%) | 108 (3.1%) |
| $12,500 to $14,999 | 78 (2.5%) | 299 (8.5%) |
| $15,000 to $17,499 | 66 (2.1%) | 140 (4.0%) |
| $17,500 to $19,999 | 67 (2.2%) | 99 (2.8%) |
| $20,000 to $22,499 | 132 (4.3%) | 110 (3.1%) |
| $22,500 to $24,999 | 57 (1.8%) | 77 (2.2%) |
| $25,000 to $29,999 | 285 (9.2%) | 224 (6.4%) |
| $30,000 to $34,999 | 151 (4.9%) | 257 (7.3%) |
| $35,000 to $39,999 | 113 (3.6%) | 294 (8.4%) |
| $40,000 to $44,999 | 132 (4.3%) | 274 (7.8%) |
| $45,000 to $49,999 | 208 (6.7%) | 52 (1.5%) |
| $50,000 to $54,999 | 180 (5.8%) | 107 (3.0%) |
| $55,000 to $64,999 | 332 (10.7%) | 268 (7.6%) |
| $65,000 to $74,999 | 222 (7.2%) | 180 (5.1%) |
| $75,000 to $99,999 | 404 (13.0%) | 120 (3.4%) |
| $100,000+ | 171 (5.5%) | 95 (2.7%) |
| Total | 3,099 (100.0%) | 3,523 (100.0%) |
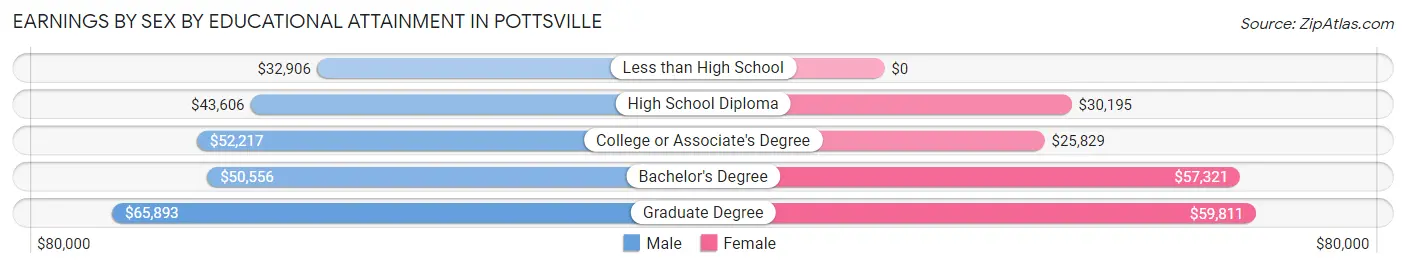
Earnings by Sex by Educational Attainment in Pottsville
Average earnings in Pottsville are $45,621 for men and $31,502 for women, a difference of 30.9%. Men with an educational attainment of graduate degree enjoy the highest average annual earnings of $65,893, while those with less than high school education earn the least with $32,906. Women with an educational attainment of graduate degree earn the most with the average annual earnings of $59,811, while those with college or associate's degree education have the smallest earnings of $25,829.
| Educational Attainment | Male Income | Female Income |
| Less than High School | $32,906 | $0 |
| High School Diploma | $43,606 | $30,195 |
| College or Associate's Degree | $52,217 | $25,829 |
| Bachelor's Degree | $50,556 | $57,321 |
| Graduate Degree | $65,893 | $59,811 |
| Total | $45,621 | $31,502 |
Family Income in Pottsville
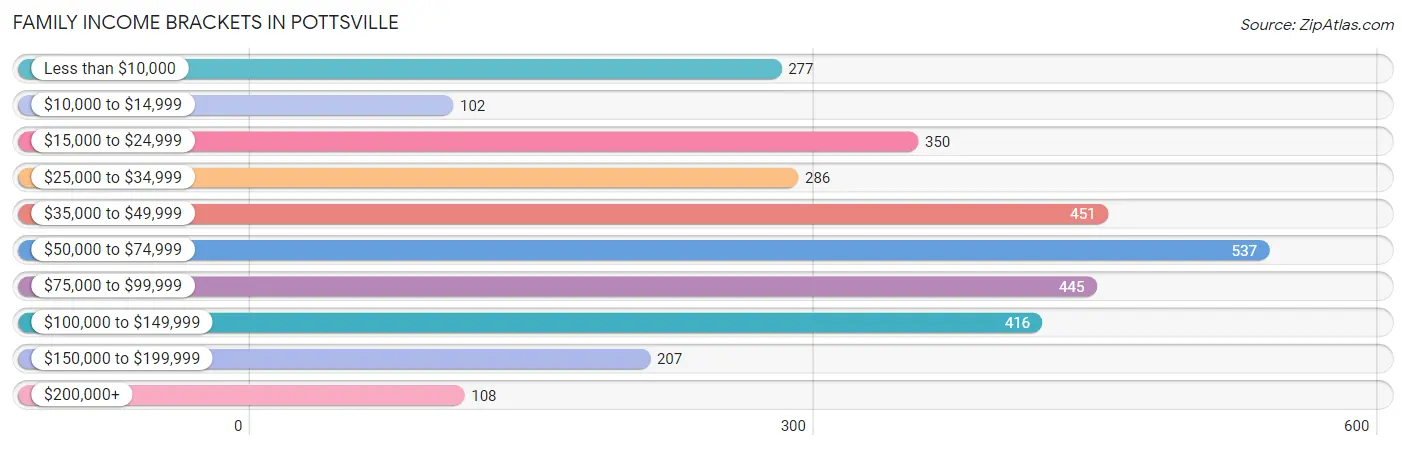
Family Income Brackets in Pottsville
According to the Pottsville family income data, there are 537 families falling into the $50,000 to $74,999 income range, which is the most common income bracket and makes up 16.9% of all families. Conversely, the $10,000 to $14,999 income bracket is the least frequent group with only 102 families (3.2%) belonging to this category.
| Income Bracket | # Families | % Families |
| Less than $10,000 | 277 | 8.7% |
| $10,000 to $14,999 | 102 | 3.2% |
| $15,000 to $24,999 | 350 | 11.0% |
| $25,000 to $34,999 | 286 | 9.0% |
| $35,000 to $49,999 | 451 | 14.2% |
| $50,000 to $74,999 | 537 | 16.9% |
| $75,000 to $99,999 | 445 | 14.0% |
| $100,000 to $149,999 | 416 | 13.1% |
| $150,000 to $199,999 | 207 | 6.5% |
| $200,000+ | 108 | 3.4% |
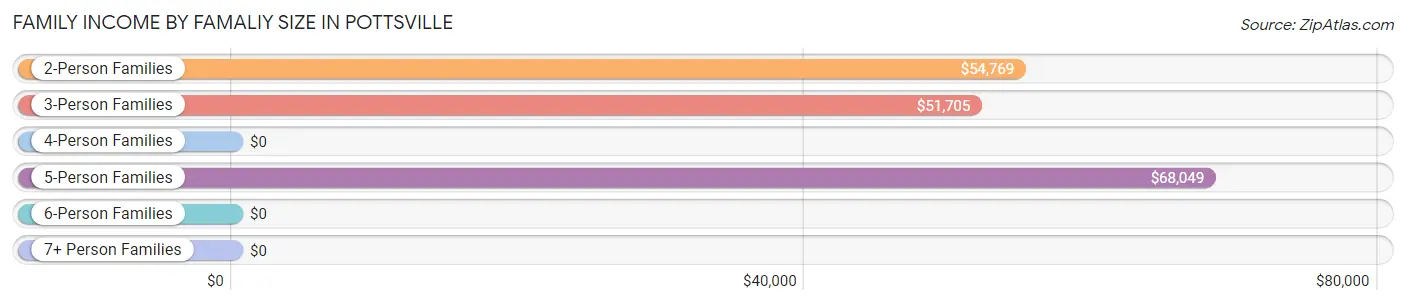
Family Income by Famaliy Size in Pottsville
5-person families (126 | 4.0%) account for the highest median family income in Pottsville with $68,049 per family, while 2-person families (1,601 | 50.4%) have the highest median income of $27,384 per family member.
| Income Bracket | # Families | Median Income |
| 2-Person Families | 1,601 (50.4%) | $54,769 |
| 3-Person Families | 1,004 (31.6%) | $51,705 |
| 4-Person Families | 302 (9.5%) | $0 |
| 5-Person Families | 126 (4.0%) | $68,049 |
| 6-Person Families | 36 (1.1%) | $0 |
| 7+ Person Families | 110 (3.5%) | $0 |
| Total | 3,179 (100.0%) | $57,934 |
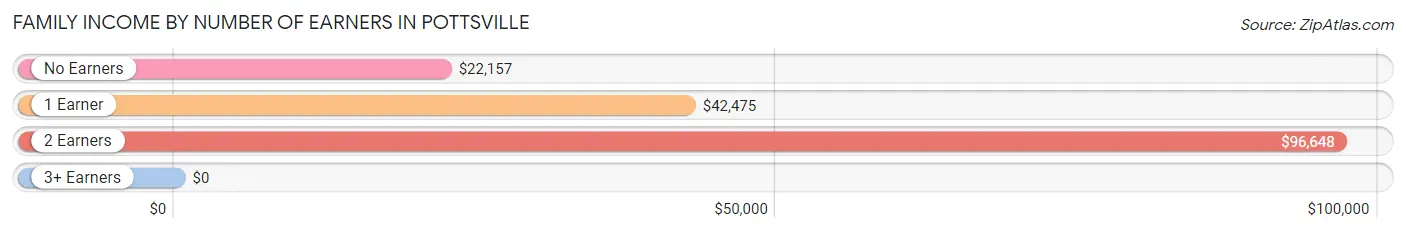
Family Income by Number of Earners in Pottsville
| Number of Earners | # Families | Median Income |
| No Earners | 670 (21.1%) | $22,157 |
| 1 Earner | 1,268 (39.9%) | $42,475 |
| 2 Earners | 936 (29.4%) | $96,648 |
| 3+ Earners | 305 (9.6%) | $0 |
| Total | 3,179 (100.0%) | $57,934 |
Household Income in Pottsville
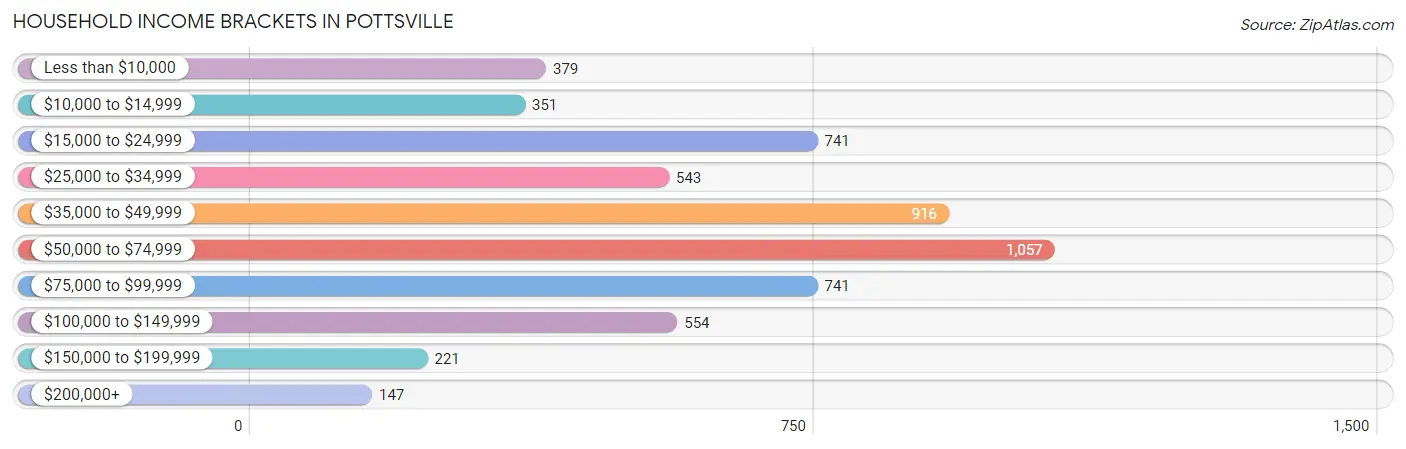
Household Income Brackets in Pottsville
With 1,057 households falling in the category, the $50,000 to $74,999 income range is the most frequent in Pottsville, accounting for 18.7% of all households. In contrast, only 147 households (2.6%) fall into the $200,000+ income bracket, making it the least populous group.
| Income Bracket | # Households | % Households |
| Less than $10,000 | 379 | 6.7% |
| $10,000 to $14,999 | 351 | 6.2% |
| $15,000 to $24,999 | 741 | 13.1% |
| $25,000 to $34,999 | 543 | 9.6% |
| $35,000 to $49,999 | 916 | 16.2% |
| $50,000 to $74,999 | 1,057 | 18.7% |
| $75,000 to $99,999 | 741 | 13.1% |
| $100,000 to $149,999 | 554 | 9.8% |
| $150,000 to $199,999 | 221 | 3.9% |
| $200,000+ | 147 | 2.6% |
Household Income by Householder Age in Pottsville
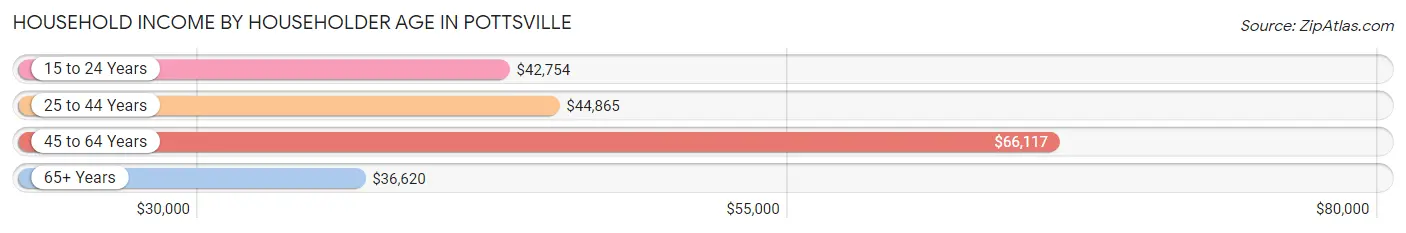
The median household income in Pottsville is $46,081, with the highest median household income of $66,117 found in the 45 to 64 years age bracket for the primary householder. A total of 1,934 households (34.2%) fall into this category. Meanwhile, the 65+ years age bracket for the primary householder has the lowest median household income of $36,620, with 1,694 households (30.0%) in this group.
| Income Bracket | # Households | Median Income |
| 15 to 24 Years | 190 (3.4%) | $42,754 |
| 25 to 44 Years | 1,837 (32.5%) | $44,865 |
| 45 to 64 Years | 1,934 (34.2%) | $66,117 |
| 65+ Years | 1,694 (30.0%) | $36,620 |
| Total | 5,655 (100.0%) | $46,081 |
Poverty in Pottsville
Income Below Poverty by Sex and Age in Pottsville
With 18.5% poverty level for males and 22.6% for females among the residents of Pottsville, 6 to 11 year old males and 15 year old females are the most vulnerable to poverty, with 160 males (51.9%) and 127 females (66.8%) in their respective age groups living below the poverty level.
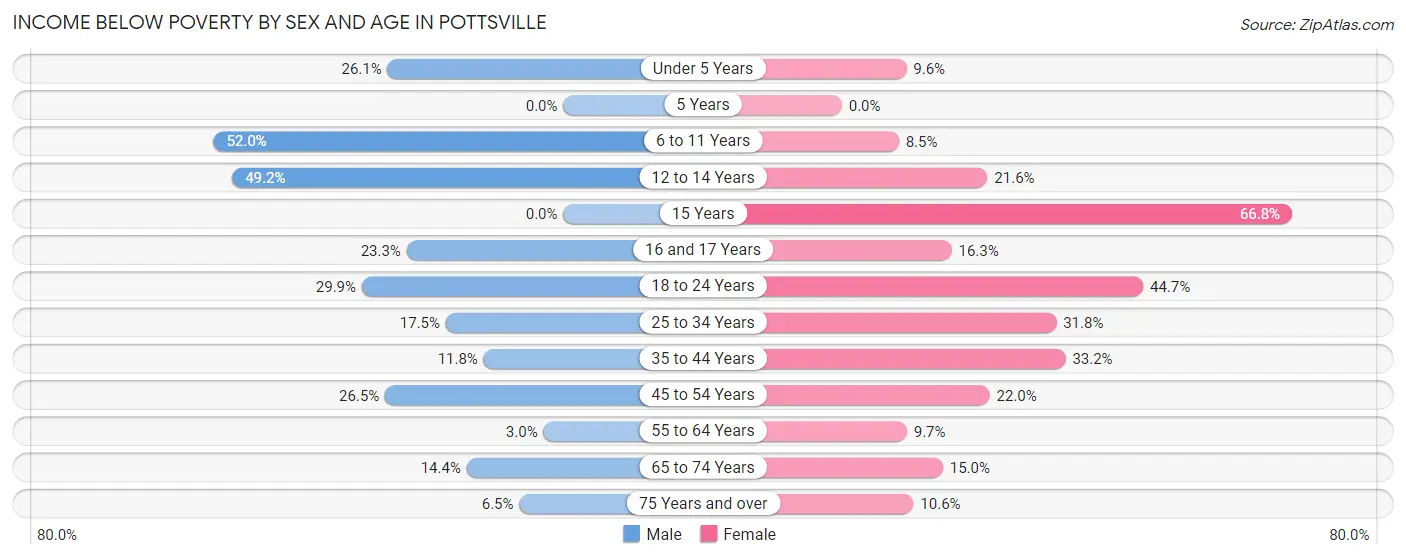
| Age Bracket | Male | Female |
| Under 5 Years | 113 (26.1%) | 48 (9.6%) |
| 5 Years | 0 (0.0%) | 0 (0.0%) |
| 6 to 11 Years | 160 (51.9%) | 60 (8.5%) |
| 12 to 14 Years | 59 (49.2%) | 56 (21.6%) |
| 15 Years | 0 (0.0%) | 127 (66.8%) |
| 16 and 17 Years | 30 (23.3%) | 37 (16.3%) |
| 18 to 24 Years | 76 (29.9%) | 301 (44.7%) |
| 25 to 34 Years | 123 (17.4%) | 340 (31.8%) |
| 35 to 44 Years | 88 (11.8%) | 268 (33.2%) |
| 45 to 54 Years | 226 (26.5%) | 169 (22.0%) |
| 55 to 64 Years | 24 (2.9%) | 69 (9.7%) |
| 65 to 74 Years | 89 (14.3%) | 93 (15.0%) |
| 75 Years and over | 25 (6.5%) | 69 (10.6%) |
| Total | 1,013 (18.5%) | 1,637 (22.6%) |
Income Above Poverty by Sex and Age in Pottsville
According to the poverty statistics in Pottsville, males aged 5 years and females aged 5 years are the age groups that are most secure financially, with 100.0% of males and 100.0% of females in these age groups living above the poverty line.
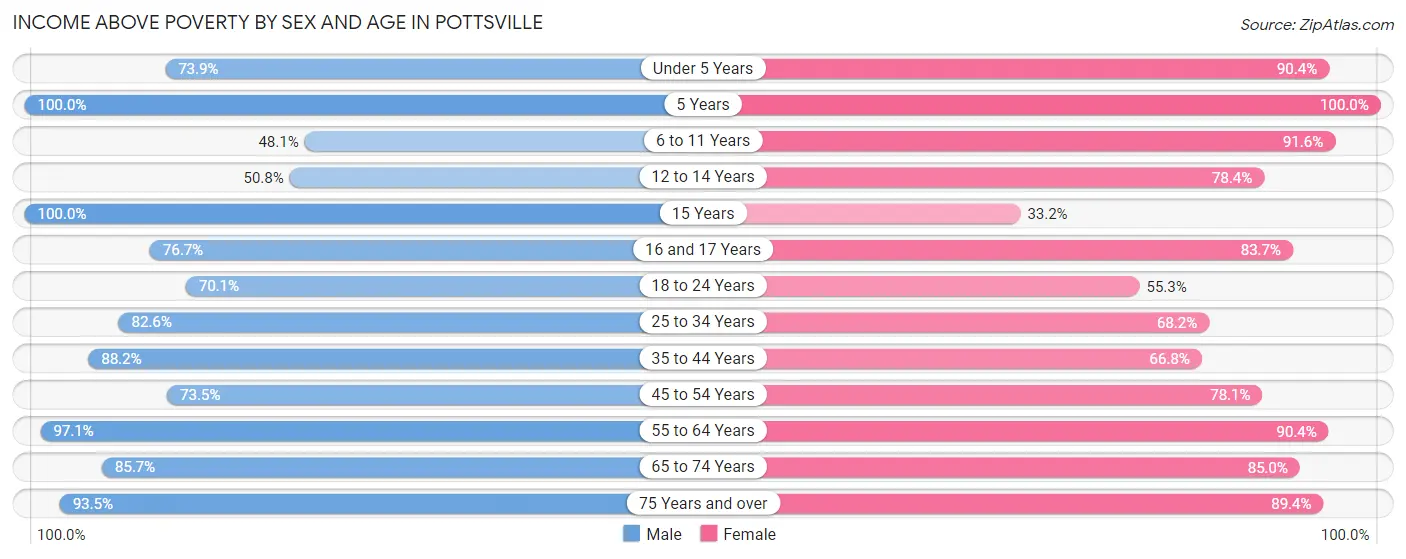
| Age Bracket | Male | Female |
| Under 5 Years | 320 (73.9%) | 453 (90.4%) |
| 5 Years | 75 (100.0%) | 46 (100.0%) |
| 6 to 11 Years | 148 (48.0%) | 650 (91.5%) |
| 12 to 14 Years | 61 (50.8%) | 203 (78.4%) |
| 15 Years | 50 (100.0%) | 63 (33.2%) |
| 16 and 17 Years | 99 (76.7%) | 190 (83.7%) |
| 18 to 24 Years | 178 (70.1%) | 372 (55.3%) |
| 25 to 34 Years | 582 (82.6%) | 728 (68.2%) |
| 35 to 44 Years | 656 (88.2%) | 539 (66.8%) |
| 45 to 54 Years | 628 (73.5%) | 601 (78.0%) |
| 55 to 64 Years | 789 (97.1%) | 646 (90.3%) |
| 65 to 74 Years | 531 (85.7%) | 527 (85.0%) |
| 75 Years and over | 358 (93.5%) | 580 (89.4%) |
| Total | 4,475 (81.5%) | 5,598 (77.4%) |
Income Below Poverty Among Married-Couple Families in Pottsville
The poverty statistics for married-couple families in Pottsville show that 5.1% or 86 of the total 1,692 families live below the poverty line. Families with 1 or 2 children have the highest poverty rate of 8.7%, comprising of 42 families. On the other hand, families with 3 or 4 children have the lowest poverty rate of 0.0%, which includes 0 families.
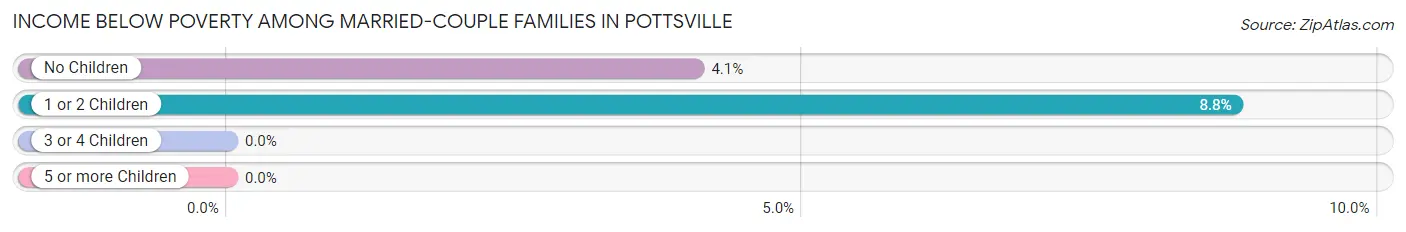
| Children | Above Poverty | Below Poverty |
| No Children | 1,040 (95.9%) | 44 (4.1%) |
| 1 or 2 Children | 438 (91.2%) | 42 (8.7%) |
| 3 or 4 Children | 51 (100.0%) | 0 (0.0%) |
| 5 or more Children | 77 (100.0%) | 0 (0.0%) |
| Total | 1,606 (94.9%) | 86 (5.1%) |
Income Below Poverty Among Single-Parent Households in Pottsville
According to the poverty data in Pottsville, 44.4% or 213 single-father households and 32.2% or 324 single-mother households are living below the poverty line. Among single-father households, those with 1 or 2 children have the highest poverty rate, with 141 households (61.0%) experiencing poverty. Likewise, among single-mother households, those with 3 or 4 children have the highest poverty rate, with 53 households (59.6%) falling below the poverty line.
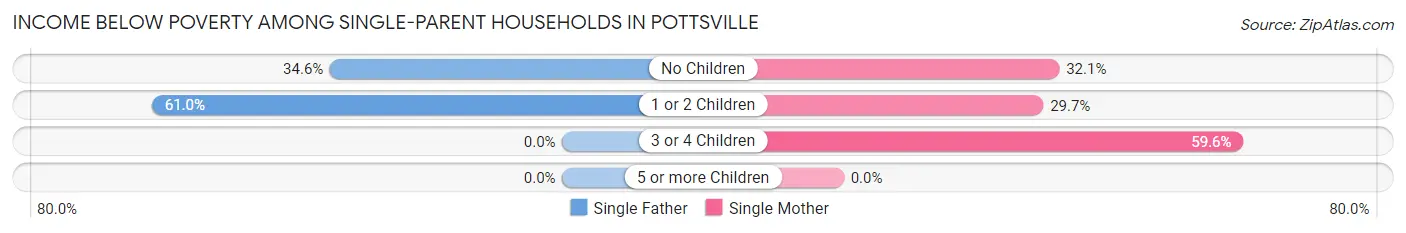
| Children | Single Father | Single Mother |
| No Children | 72 (34.6%) | 106 (32.1%) |
| 1 or 2 Children | 141 (61.0%) | 165 (29.7%) |
| 3 or 4 Children | 0 (0.0%) | 53 (59.6%) |
| 5 or more Children | 0 (0.0%) | 0 (0.0%) |
| Total | 213 (44.4%) | 324 (32.2%) |
Income Below Poverty Among Married-Couple vs Single-Parent Households in Pottsville
The poverty data for Pottsville shows that 86 of the married-couple family households (5.1%) and 537 of the single-parent households (36.1%) are living below the poverty level. Within the married-couple family households, those with 1 or 2 children have the highest poverty rate, with 42 households (8.7%) falling below the poverty line. Among the single-parent households, those with 3 or 4 children have the highest poverty rate, with 53 household (40.8%) living below poverty.
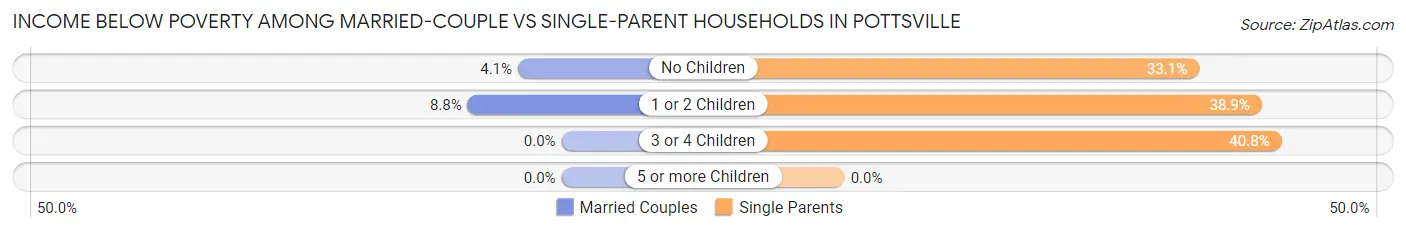
| Children | Married-Couple Families | Single-Parent Households |
| No Children | 44 (4.1%) | 178 (33.1%) |
| 1 or 2 Children | 42 (8.7%) | 306 (38.9%) |
| 3 or 4 Children | 0 (0.0%) | 53 (40.8%) |
| 5 or more Children | 0 (0.0%) | 0 (0.0%) |
| Total | 86 (5.1%) | 537 (36.1%) |
Race in Pottsville
The most populous races in Pottsville are White / Caucasian (11,916 | 89.0%), Hispanic or Latino (997 | 7.4%), and Black / African American (719 | 5.4%).
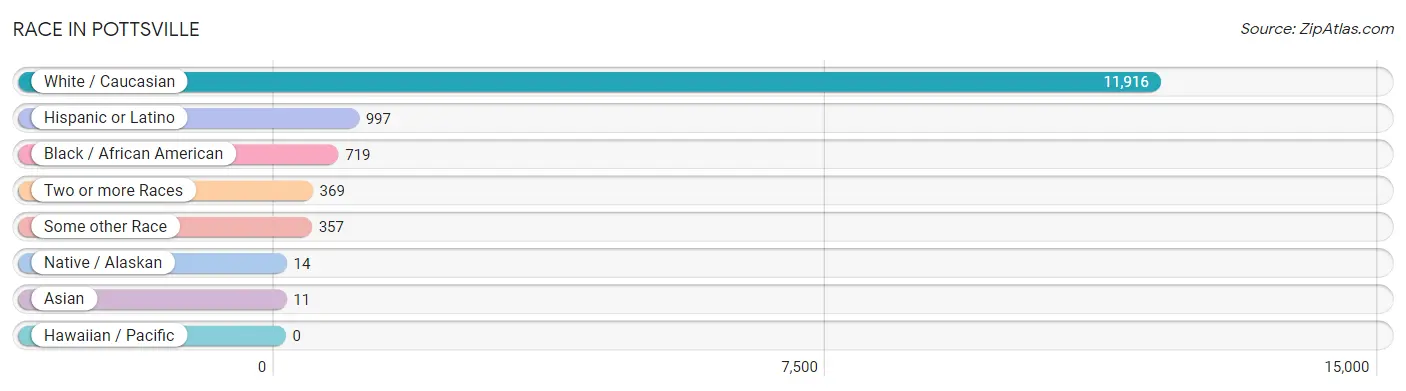
| Race | # Population | % Population |
| Asian | 11 | 0.1% |
| Black / African American | 719 | 5.4% |
| Hawaiian / Pacific | 0 | 0.0% |
| Hispanic or Latino | 997 | 7.4% |
| Native / Alaskan | 14 | 0.1% |
| White / Caucasian | 11,916 | 89.0% |
| Two or more Races | 369 | 2.8% |
| Some other Race | 357 | 2.7% |
| Total | 13,386 | 100.0% |
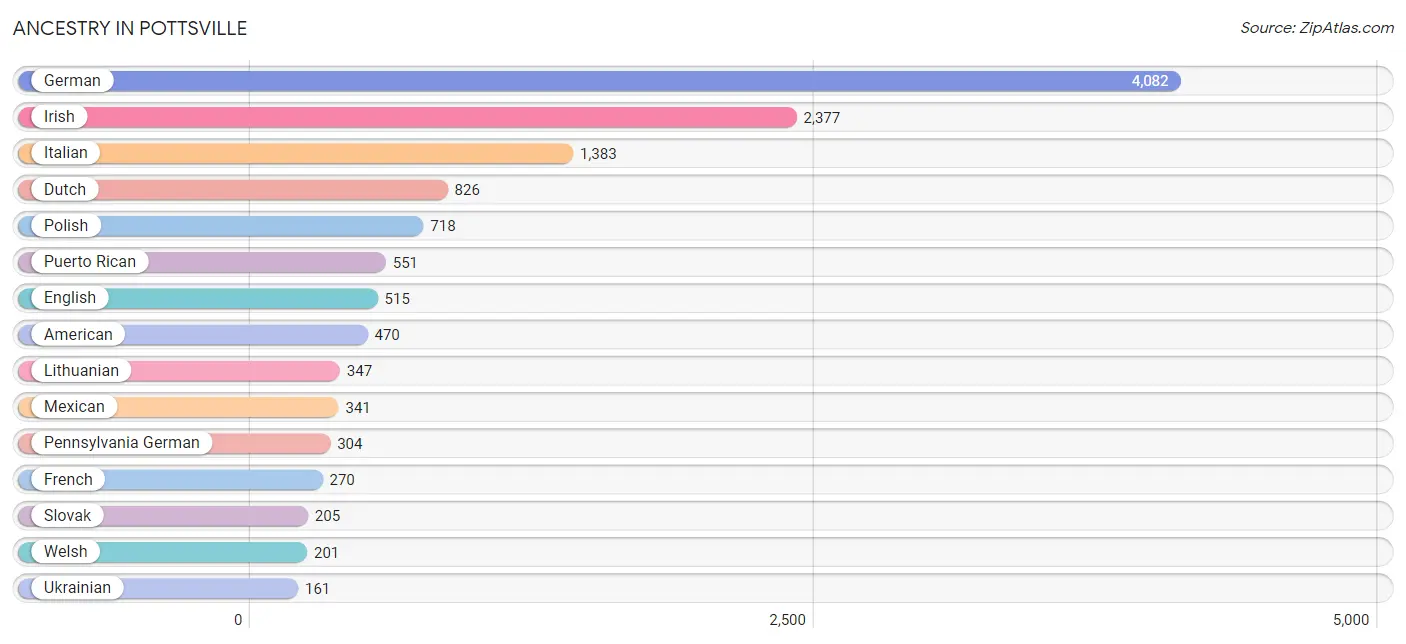
Ancestry in Pottsville
The most populous ancestries reported in Pottsville are German (4,082 | 30.5%), Irish (2,377 | 17.8%), Italian (1,383 | 10.3%), Dutch (826 | 6.2%), and Polish (718 | 5.4%), together accounting for 70.1% of all Pottsville residents.
| Ancestry | # Population | % Population |
| African | 26 | 0.2% |
| American | 470 | 3.5% |
| Arab | 135 | 1.0% |
| Austrian | 11 | 0.1% |
| Bahamian | 26 | 0.2% |
| Basque | 8 | 0.1% |
| Blackfeet | 9 | 0.1% |
| Brazilian | 18 | 0.1% |
| British | 16 | 0.1% |
| Cajun | 12 | 0.1% |
| Celtic | 13 | 0.1% |
| Central American Indian | 9 | 0.1% |
| Cherokee | 21 | 0.2% |
| Croatian | 5 | 0.0% |
| Cuban | 73 | 0.5% |
| Czech | 10 | 0.1% |
| Czechoslovakian | 24 | 0.2% |
| Danish | 7 | 0.1% |
| Dutch | 826 | 6.2% |
| Eastern European | 5 | 0.0% |
| Ecuadorian | 22 | 0.2% |
| Egyptian | 82 | 0.6% |
| English | 515 | 3.8% |
| European | 8 | 0.1% |
| French | 270 | 2.0% |
| French Canadian | 7 | 0.1% |
| German | 4,082 | 30.5% |
| Greek | 112 | 0.8% |
| Hungarian | 36 | 0.3% |
| Irish | 2,377 | 17.8% |
| Iroquois | 5 | 0.0% |
| Italian | 1,383 | 10.3% |
| Lebanese | 44 | 0.3% |
| Lithuanian | 347 | 2.6% |
| Mexican | 341 | 2.5% |
| Mexican American Indian | 9 | 0.1% |
| New Zealander | 1 | 0.0% |
| Norwegian | 26 | 0.2% |
| Pennsylvania German | 304 | 2.3% |
| Polish | 718 | 5.4% |
| Puerto Rican | 551 | 4.1% |
| Russian | 29 | 0.2% |
| Scandinavian | 4 | 0.0% |
| Scotch-Irish | 21 | 0.2% |
| Scottish | 47 | 0.4% |
| Slavic | 27 | 0.2% |
| Slovak | 205 | 1.5% |
| South American | 22 | 0.2% |
| Sri Lankan | 10 | 0.1% |
| Subsaharan African | 26 | 0.2% |
| Swedish | 44 | 0.3% |
| Swiss | 4 | 0.0% |
| Syrian | 9 | 0.1% |
| Thai | 1 | 0.0% |
| Ukrainian | 161 | 1.2% |
| Welsh | 201 | 1.5% | View All 56 Rows |
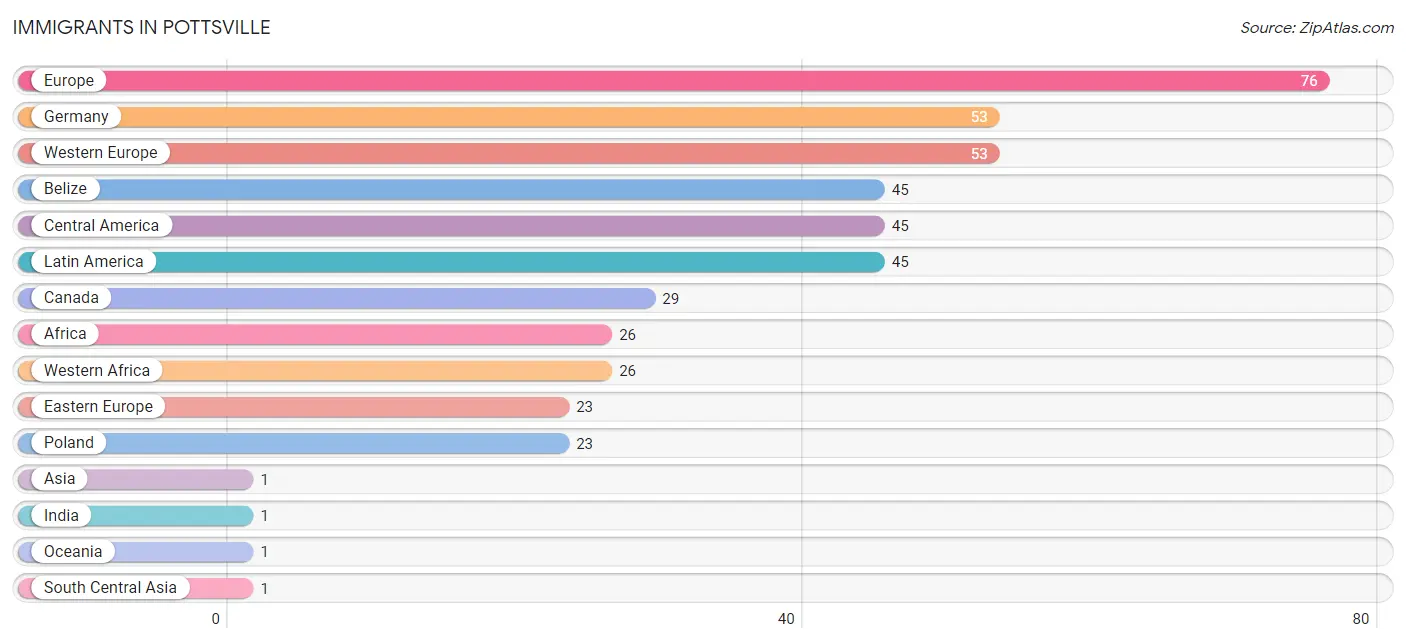
Immigrants in Pottsville
The most numerous immigrant groups reported in Pottsville came from Europe (76 | 0.6%), Germany (53 | 0.4%), Western Europe (53 | 0.4%), Belize (45 | 0.3%), and Central America (45 | 0.3%), together accounting for 2.1% of all Pottsville residents.
| Immigration Origin | # Population | % Population |
| Africa | 26 | 0.2% |
| Asia | 1 | 0.0% |
| Belize | 45 | 0.3% |
| Canada | 29 | 0.2% |
| Central America | 45 | 0.3% |
| Eastern Europe | 23 | 0.2% |
| Europe | 76 | 0.6% |
| Germany | 53 | 0.4% |
| India | 1 | 0.0% |
| Latin America | 45 | 0.3% |
| Oceania | 1 | 0.0% |
| Poland | 23 | 0.2% |
| South Central Asia | 1 | 0.0% |
| Western Africa | 26 | 0.2% |
| Western Europe | 53 | 0.4% | View All 15 Rows |
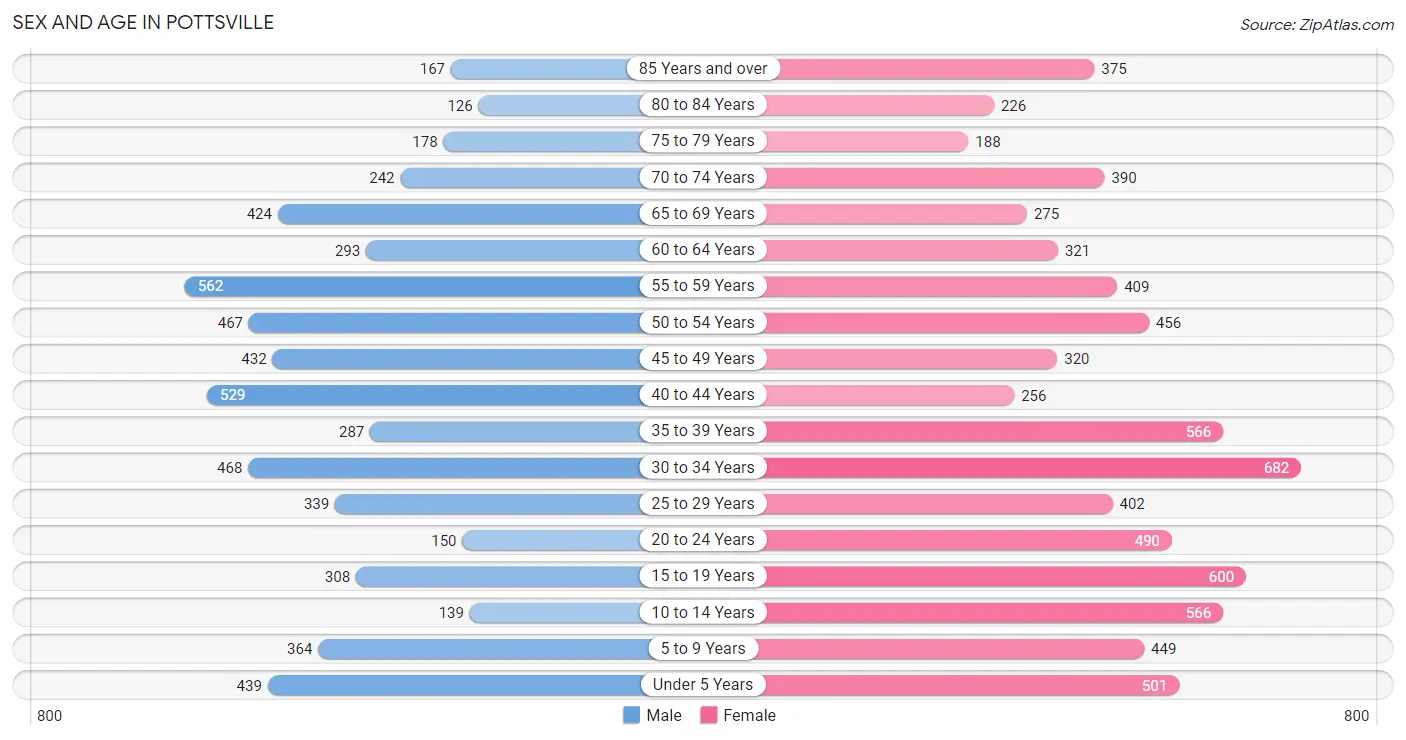
Sex and Age in Pottsville
Sex and Age in Pottsville
The most populous age groups in Pottsville are 55 to 59 Years (562 | 9.5%) for men and 30 to 34 Years (682 | 9.1%) for women.
| Age Bracket | Male | Female |
| Under 5 Years | 439 (7.4%) | 501 (6.7%) |
| 5 to 9 Years | 364 (6.1%) | 449 (6.0%) |
| 10 to 14 Years | 139 (2.4%) | 566 (7.6%) |
| 15 to 19 Years | 308 (5.2%) | 600 (8.0%) |
| 20 to 24 Years | 150 (2.5%) | 490 (6.6%) |
| 25 to 29 Years | 339 (5.7%) | 402 (5.4%) |
| 30 to 34 Years | 468 (7.9%) | 682 (9.1%) |
| 35 to 39 Years | 287 (4.9%) | 566 (7.6%) |
| 40 to 44 Years | 529 (8.9%) | 256 (3.4%) |
| 45 to 49 Years | 432 (7.3%) | 320 (4.3%) |
| 50 to 54 Years | 467 (7.9%) | 456 (6.1%) |
| 55 to 59 Years | 562 (9.5%) | 409 (5.5%) |
| 60 to 64 Years | 293 (5.0%) | 321 (4.3%) |
| 65 to 69 Years | 424 (7.2%) | 275 (3.7%) |
| 70 to 74 Years | 242 (4.1%) | 390 (5.2%) |
| 75 to 79 Years | 178 (3.0%) | 188 (2.5%) |
| 80 to 84 Years | 126 (2.1%) | 226 (3.0%) |
| 85 Years and over | 167 (2.8%) | 375 (5.0%) |
| Total | 5,914 (100.0%) | 7,472 (100.0%) |
Families and Households in Pottsville
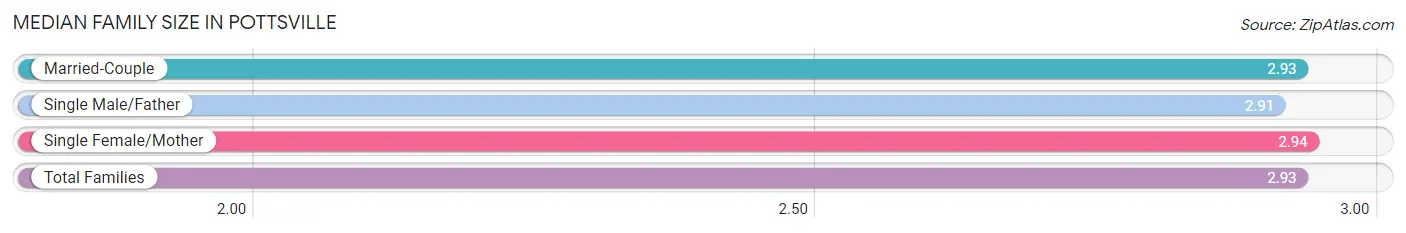
Median Family Size in Pottsville
The median family size in Pottsville is 2.93 persons per family, with single female/mother families (1,007 | 31.7%) accounting for the largest median family size of 2.94 persons per family. On the other hand, single male/father families (480 | 15.1%) represent the smallest median family size with 2.91 persons per family.
| Family Type | # Families | Family Size |
| Married-Couple | 1,692 (53.2%) | 2.93 |
| Single Male/Father | 480 (15.1%) | 2.91 |
| Single Female/Mother | 1,007 (31.7%) | 2.94 |
| Total Families | 3,179 (100.0%) | 2.93 |
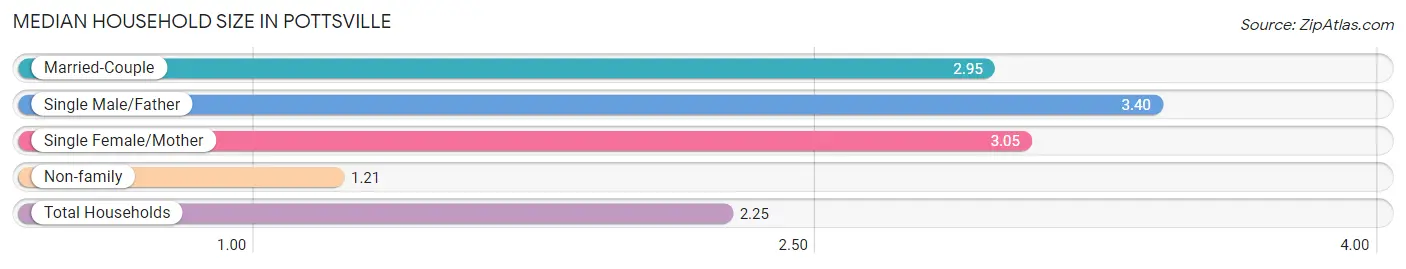
Median Household Size in Pottsville
The median household size in Pottsville is 2.25 persons per household, with single male/father households (480 | 8.5%) accounting for the largest median household size of 3.4 persons per household. non-family households (2,476 | 43.8%) represent the smallest median household size with 1.21 persons per household.
| Household Type | # Households | Household Size |
| Married-Couple | 1,692 (29.9%) | 2.95 |
| Single Male/Father | 480 (8.5%) | 3.40 |
| Single Female/Mother | 1,007 (17.8%) | 3.05 |
| Non-family | 2,476 (43.8%) | 1.21 |
| Total Households | 5,655 (100.0%) | 2.25 |
Household Size by Marriage Status in Pottsville
Out of a total of 5,655 households in Pottsville, 3,179 (56.2%) are family households, while 2,476 (43.8%) are nonfamily households. The most numerous type of family households are 2-person households, comprising 1,496, and the most common type of nonfamily households are 1-person households, comprising 1,985.
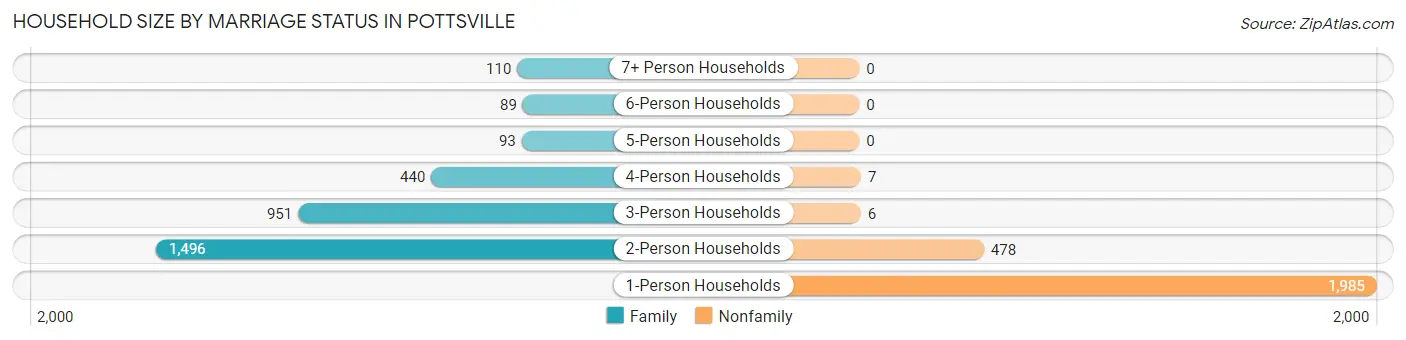
| Household Size | Family Households | Nonfamily Households |
| 1-Person Households | - | 1,985 (35.1%) |
| 2-Person Households | 1,496 (26.5%) | 478 (8.5%) |
| 3-Person Households | 951 (16.8%) | 6 (0.1%) |
| 4-Person Households | 440 (7.8%) | 7 (0.1%) |
| 5-Person Households | 93 (1.6%) | 0 (0.0%) |
| 6-Person Households | 89 (1.6%) | 0 (0.0%) |
| 7+ Person Households | 110 (1.9%) | 0 (0.0%) |
| Total | 3,179 (56.2%) | 2,476 (43.8%) |
Female Fertility in Pottsville
Fertility by Age in Pottsville
Average fertility rate in Pottsville is 95.0 births per 1,000 women. Women in the age bracket of 20 to 34 years have the highest fertility rate with 187.0 births per 1,000 women. Women in the age bracket of 20 to 34 years acount for 91.0% of all women with births.
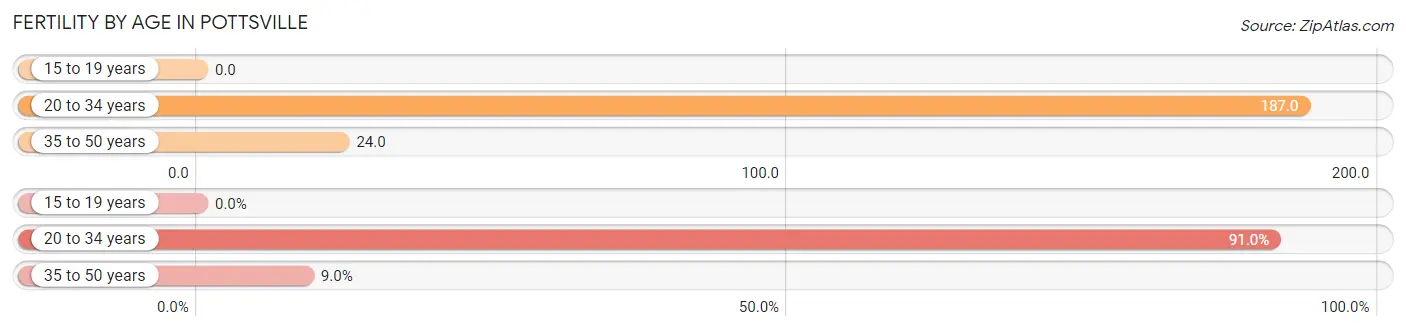
| Age Bracket | Women with Births | Births / 1,000 Women |
| 15 to 19 years | 0 (0.0%) | 0.0 |
| 20 to 34 years | 294 (91.0%) | 187.0 |
| 35 to 50 years | 29 (9.0%) | 24.0 |
| Total | 323 (100.0%) | 95.0 |
Fertility by Age by Marriage Status in Pottsville
36.5% of women with births (323) in Pottsville are married. The highest percentage of unmarried women with births falls into 20 to 34 years age bracket with 64.6% of them unmarried at the time of birth, while the lowest percentage of unmarried women with births belong to 35 to 50 years age bracket with 51.7% of them unmarried.
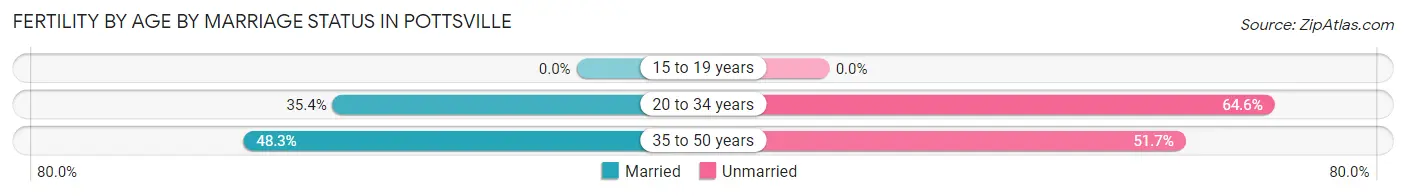
| Age Bracket | Married | Unmarried |
| 15 to 19 years | 0 (0.0%) | 0 (0.0%) |
| 20 to 34 years | 104 (35.4%) | 190 (64.6%) |
| 35 to 50 years | 14 (48.3%) | 15 (51.7%) |
| Total | 118 (36.5%) | 205 (63.5%) |
Fertility by Education in Pottsville
Average fertility rate in Pottsville is 95.0 births per 1,000 women. Women with the education attainment of high school diploma have the highest fertility rate of 188.0 births per 1,000 women, while women with the education attainment of less than high school have the lowest fertility at 49.0 births per 1,000 women. Women with the education attainment of high school diploma represent 55.1% of all women with births.
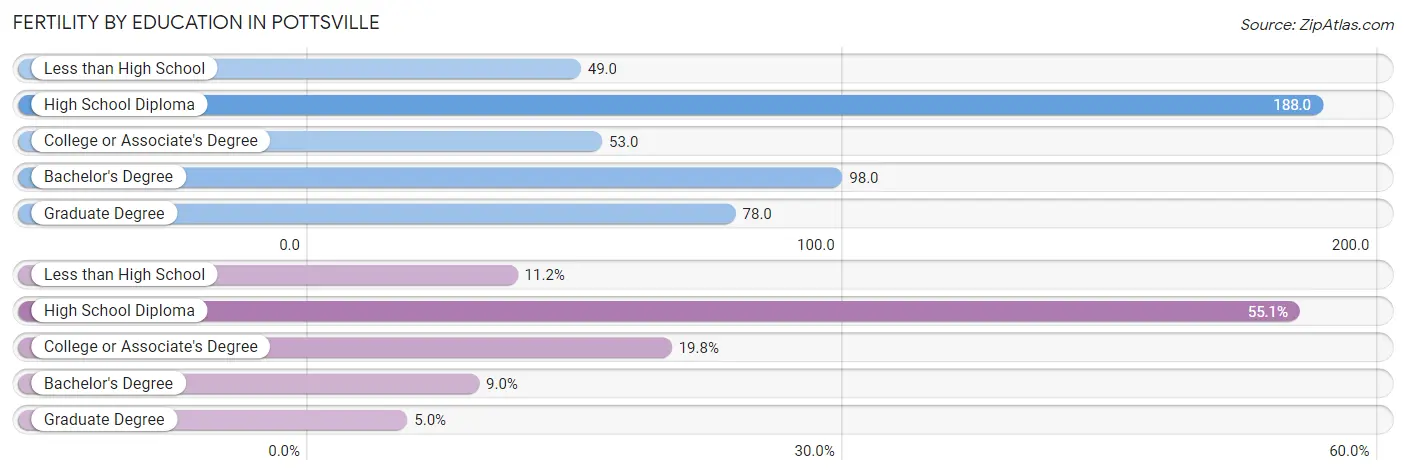
| Educational Attainment | Women with Births | Births / 1,000 Women |
| Less than High School | 36 (11.2%) | 49.0 |
| High School Diploma | 178 (55.1%) | 188.0 |
| College or Associate's Degree | 64 (19.8%) | 53.0 |
| Bachelor's Degree | 29 (9.0%) | 98.0 |
| Graduate Degree | 16 (5.0%) | 78.0 |
| Total | 323 (100.0%) | 95.0 |
Fertility by Education by Marriage Status in Pottsville
63.5% of women with births in Pottsville are unmarried. Women with the educational attainment of graduate degree are most likely to be married with 100.0% of them married at childbirth, while women with the educational attainment of less than high school are least likely to be married with 80.6% of them unmarried at childbirth.
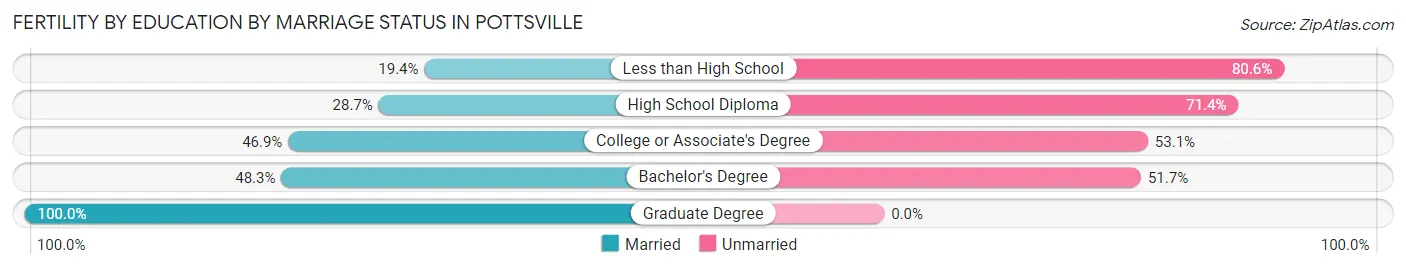
| Educational Attainment | Married | Unmarried |
| Less than High School | 7 (19.4%) | 29 (80.6%) |
| High School Diploma | 51 (28.6%) | 127 (71.4%) |
| College or Associate's Degree | 30 (46.9%) | 34 (53.1%) |
| Bachelor's Degree | 14 (48.3%) | 15 (51.7%) |
| Graduate Degree | 16 (100.0%) | 0 (0.0%) |
| Total | 118 (36.5%) | 205 (63.5%) |
Employment Characteristics in Pottsville
Employment by Class of Employer in Pottsville
Among the 5,783 employed individuals in Pottsville, private company employees (3,967 | 68.6%), local government employees (547 | 9.5%), and state government employees (361 | 6.2%) make up the most common classes of employment.
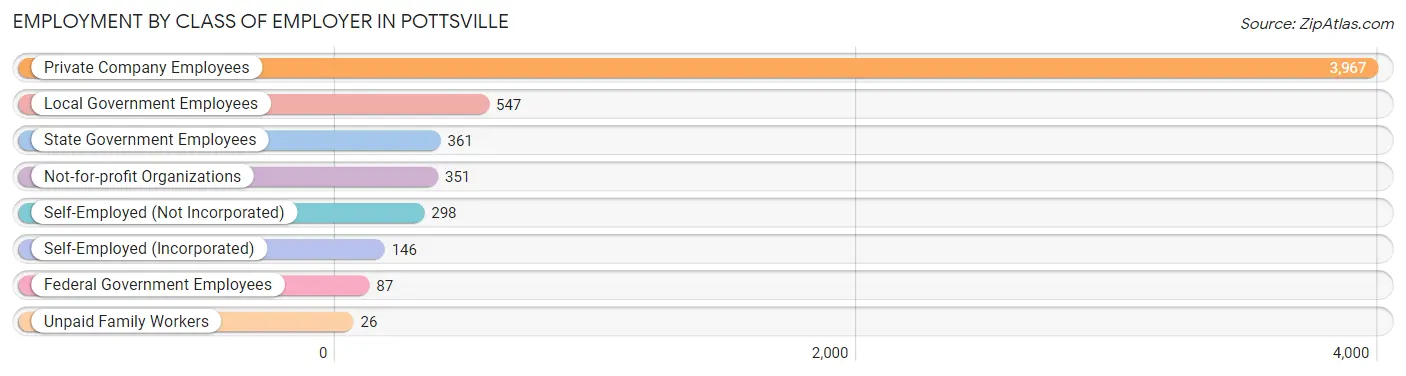
| Employer Class | # Employees | % Employees |
| Private Company Employees | 3,967 | 68.6% |
| Self-Employed (Incorporated) | 146 | 2.5% |
| Self-Employed (Not Incorporated) | 298 | 5.1% |
| Not-for-profit Organizations | 351 | 6.1% |
| Local Government Employees | 547 | 9.5% |
| State Government Employees | 361 | 6.2% |
| Federal Government Employees | 87 | 1.5% |
| Unpaid Family Workers | 26 | 0.4% |
| Total | 5,783 | 100.0% |
Employment Status by Age in Pottsville
According to the labor force statistics for Pottsville, out of the total population over 16 years of age (10,688), 61.7% or 6,594 individuals are in the labor force, with 9.5% or 626 of them unemployed. The age group with the highest labor force participation rate is 30 to 34 years, with 90.4% or 1,040 individuals in the labor force. Within the labor force, the 16 to 19 years age range has the highest percentage of unemployed individuals, with 27.6% or 67 of them being unemployed.
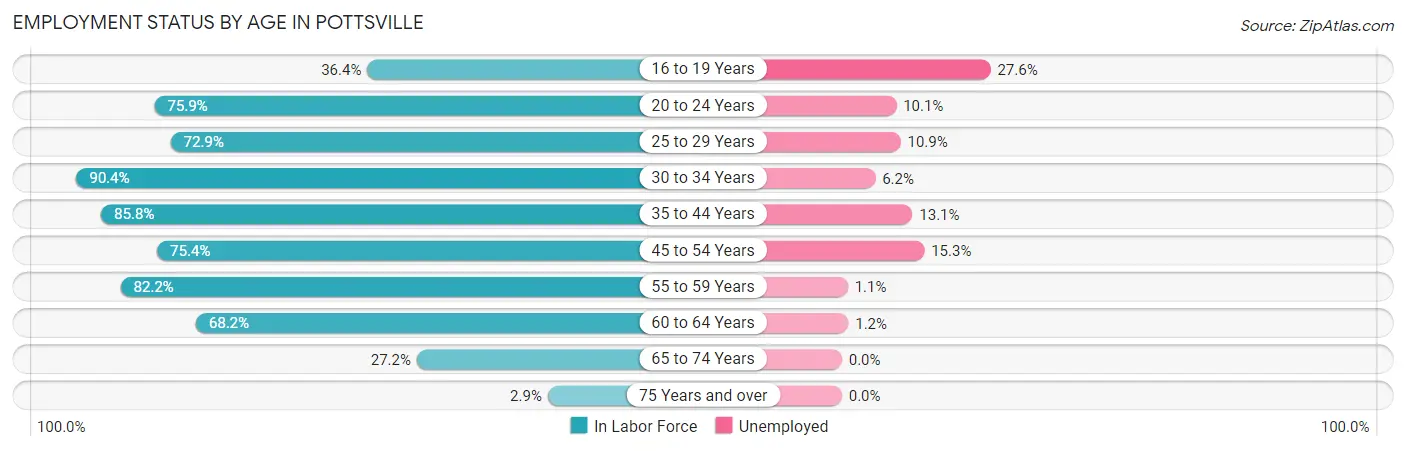
| Age Bracket | In Labor Force | Unemployed |
| 16 to 19 Years | 243 (36.4%) | 67 (27.6%) |
| 20 to 24 Years | 486 (75.9%) | 49 (10.1%) |
| 25 to 29 Years | 540 (72.9%) | 59 (10.9%) |
| 30 to 34 Years | 1,040 (90.4%) | 64 (6.2%) |
| 35 to 44 Years | 1,405 (85.8%) | 184 (13.1%) |
| 45 to 54 Years | 1,263 (75.4%) | 193 (15.3%) |
| 55 to 59 Years | 798 (82.2%) | 9 (1.1%) |
| 60 to 64 Years | 419 (68.2%) | 5 (1.2%) |
| 65 to 74 Years | 362 (27.2%) | 0 (0.0%) |
| 75 Years and over | 37 (2.9%) | 0 (0.0%) |
| Total | 6,594 (61.7%) | 626 (9.5%) |
Employment Status by Educational Attainment in Pottsville
According to labor force statistics for Pottsville, 80.5% of individuals (5,465) out of the total population between 25 and 64 years of age (6,789) are in the labor force, with 9.4% or 514 of them being unemployed. The group with the highest labor force participation rate are those with the educational attainment of bachelor's degree or higher, with 91.6% or 1,348 individuals in the labor force. Within the labor force, individuals with high school diploma education have the highest percentage of unemployment, with 14.9% or 293 of them being unemployed.
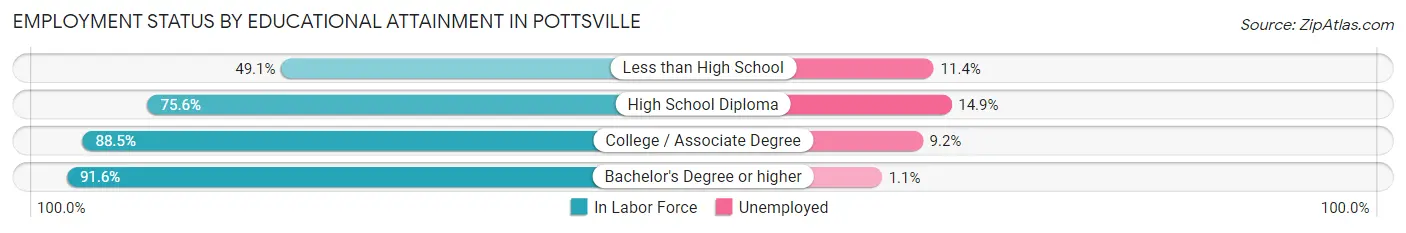
| Educational Attainment | In Labor Force | Unemployed |
| Less than High School | 317 (49.1%) | 74 (11.4%) |
| High School Diploma | 1,967 (75.6%) | 388 (14.9%) |
| College / Associate Degree | 1,832 (88.5%) | 190 (9.2%) |
| Bachelor's Degree or higher | 1,348 (91.6%) | 16 (1.1%) |
| Total | 5,465 (80.5%) | 638 (9.4%) |
Employment Occupations by Sex in Pottsville
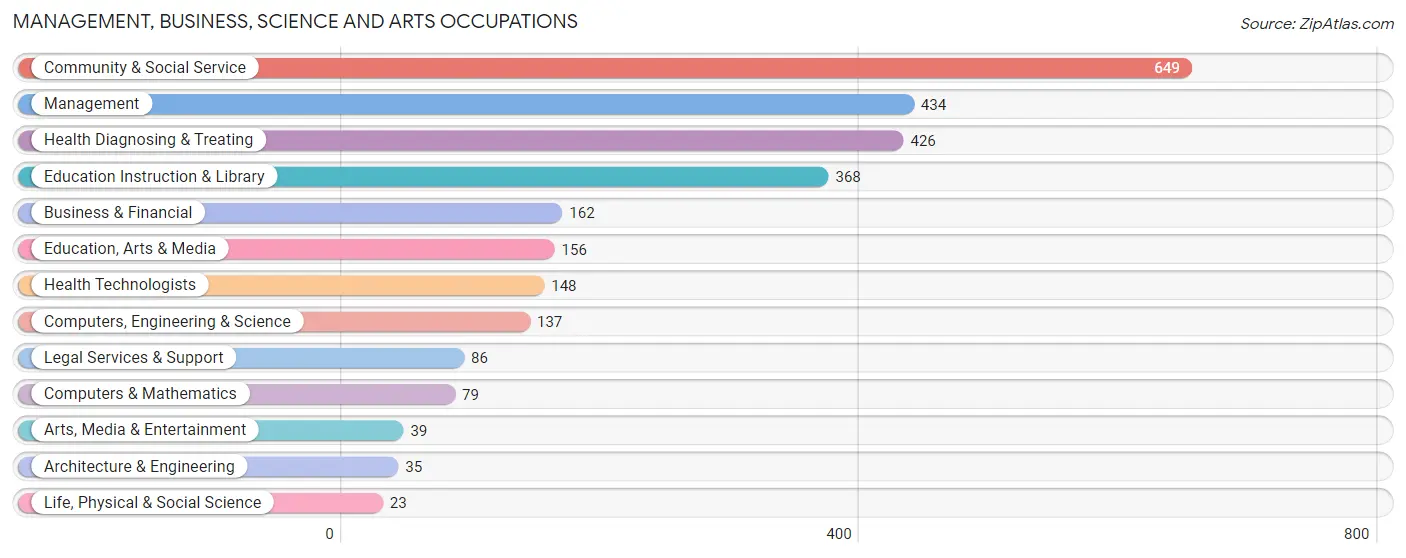
Management, Business, Science and Arts Occupations
The most common Management, Business, Science and Arts occupations in Pottsville are Community & Social Service (649 | 10.9%), Management (434 | 7.3%), Health Diagnosing & Treating (426 | 7.2%), Education Instruction & Library (368 | 6.2%), and Business & Financial (162 | 2.7%).
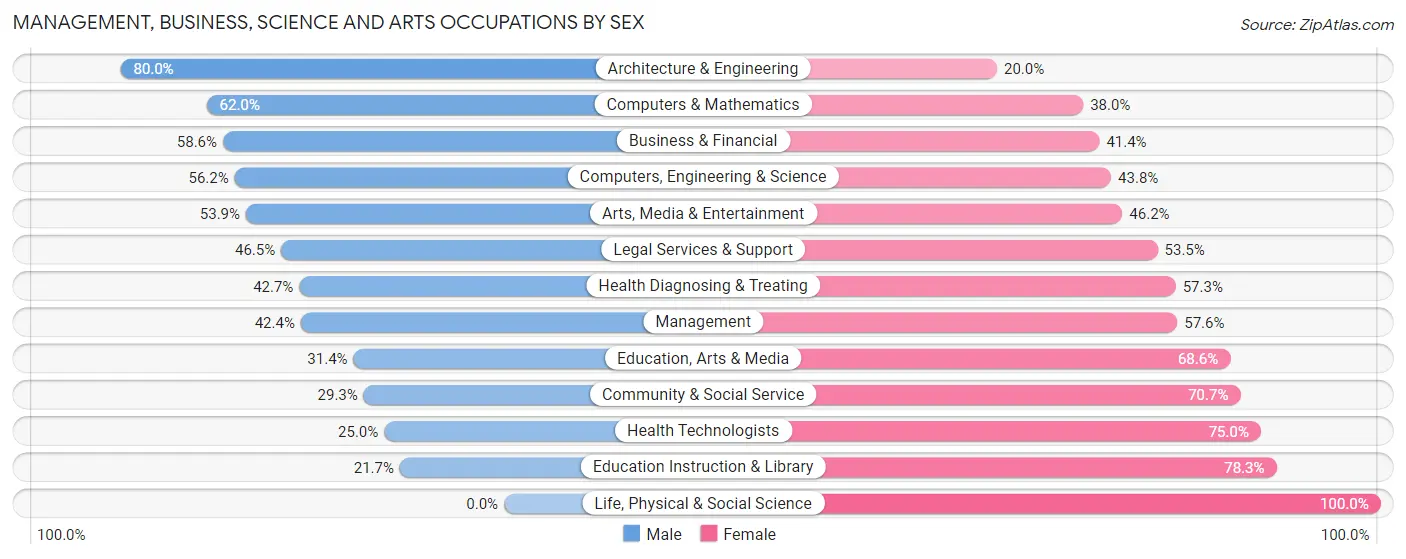
Management, Business, Science and Arts Occupations by Sex
Within the Management, Business, Science and Arts occupations in Pottsville, the most male-oriented occupations are Architecture & Engineering (80.0%), Computers & Mathematics (62.0%), and Business & Financial (58.6%), while the most female-oriented occupations are Life, Physical & Social Science (100.0%), Education Instruction & Library (78.3%), and Health Technologists (75.0%).
| Occupation | Male | Female |
| Management | 184 (42.4%) | 250 (57.6%) |
| Business & Financial | 95 (58.6%) | 67 (41.4%) |
| Computers, Engineering & Science | 77 (56.2%) | 60 (43.8%) |
| Computers & Mathematics | 49 (62.0%) | 30 (38.0%) |
| Architecture & Engineering | 28 (80.0%) | 7 (20.0%) |
| Life, Physical & Social Science | 0 (0.0%) | 23 (100.0%) |
| Community & Social Service | 190 (29.3%) | 459 (70.7%) |
| Education, Arts & Media | 49 (31.4%) | 107 (68.6%) |
| Legal Services & Support | 40 (46.5%) | 46 (53.5%) |
| Education Instruction & Library | 80 (21.7%) | 288 (78.3%) |
| Arts, Media & Entertainment | 21 (53.8%) | 18 (46.2%) |
| Health Diagnosing & Treating | 182 (42.7%) | 244 (57.3%) |
| Health Technologists | 37 (25.0%) | 111 (75.0%) |
| Total (Category) | 728 (40.3%) | 1,080 (59.7%) |
| Total (Overall) | 2,700 (45.4%) | 3,251 (54.6%) |
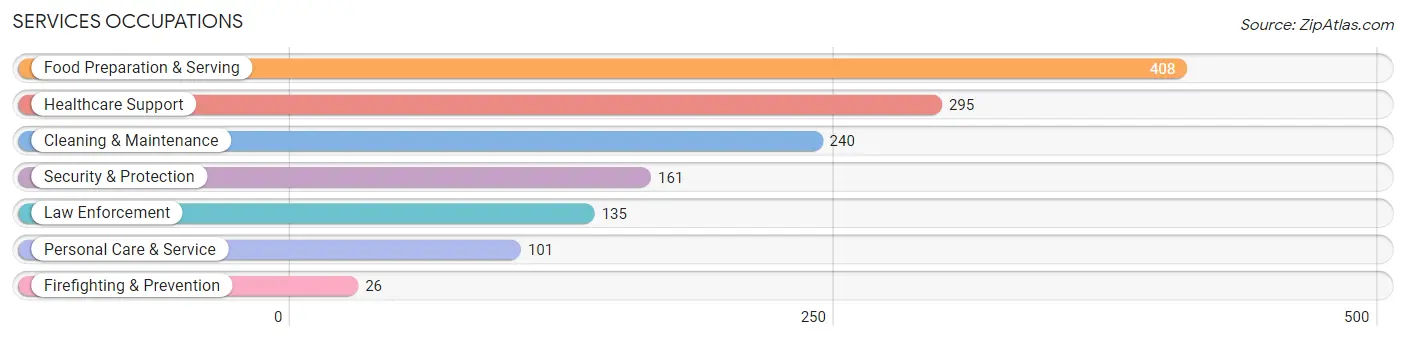
Services Occupations
The most common Services occupations in Pottsville are Food Preparation & Serving (408 | 6.9%), Healthcare Support (295 | 5.0%), Cleaning & Maintenance (240 | 4.0%), Security & Protection (161 | 2.7%), and Law Enforcement (135 | 2.3%).
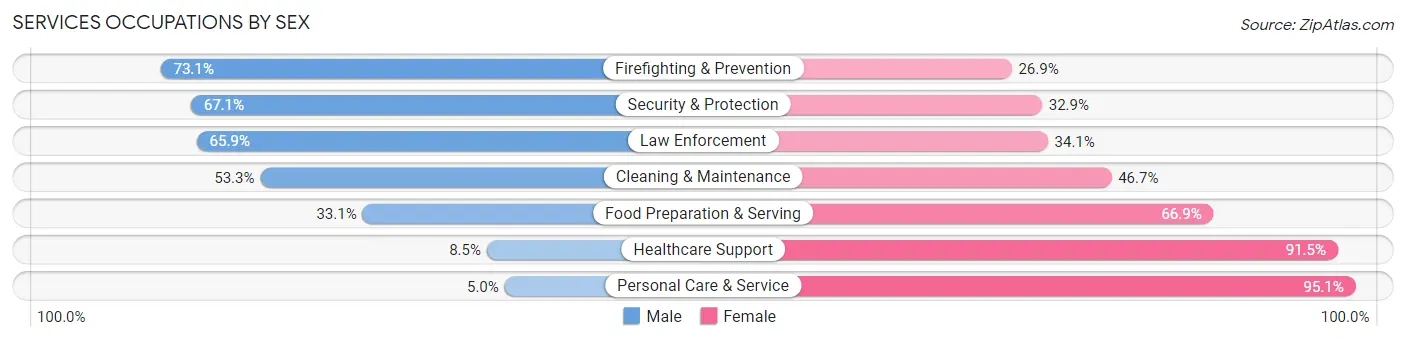
Services Occupations by Sex
Within the Services occupations in Pottsville, the most male-oriented occupations are Firefighting & Prevention (73.1%), Security & Protection (67.1%), and Law Enforcement (65.9%), while the most female-oriented occupations are Personal Care & Service (95.1%), Healthcare Support (91.5%), and Food Preparation & Serving (66.9%).
| Occupation | Male | Female |
| Healthcare Support | 25 (8.5%) | 270 (91.5%) |
| Security & Protection | 108 (67.1%) | 53 (32.9%) |
| Firefighting & Prevention | 19 (73.1%) | 7 (26.9%) |
| Law Enforcement | 89 (65.9%) | 46 (34.1%) |
| Food Preparation & Serving | 135 (33.1%) | 273 (66.9%) |
| Cleaning & Maintenance | 128 (53.3%) | 112 (46.7%) |
| Personal Care & Service | 5 (5.0%) | 96 (95.1%) |
| Total (Category) | 401 (33.3%) | 804 (66.7%) |
| Total (Overall) | 2,700 (45.4%) | 3,251 (54.6%) |
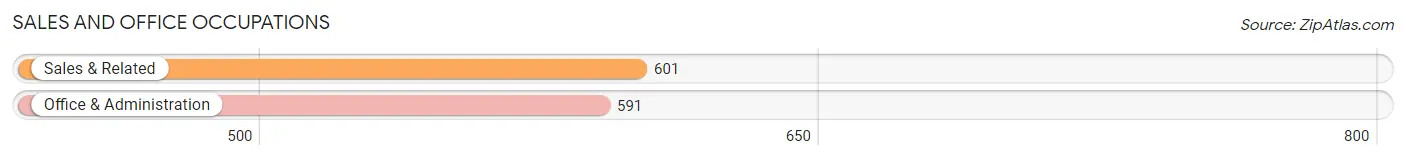
Sales and Office Occupations
The most common Sales and Office occupations in Pottsville are Sales & Related (601 | 10.1%), and Office & Administration (591 | 9.9%).
Sales and Office Occupations by Sex
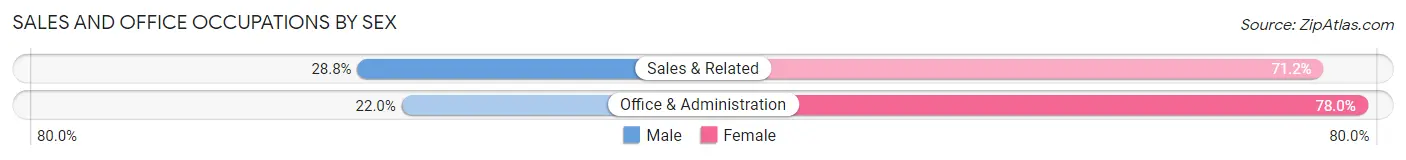
| Occupation | Male | Female |
| Sales & Related | 173 (28.8%) | 428 (71.2%) |
| Office & Administration | 130 (22.0%) | 461 (78.0%) |
| Total (Category) | 303 (25.4%) | 889 (74.6%) |
| Total (Overall) | 2,700 (45.4%) | 3,251 (54.6%) |
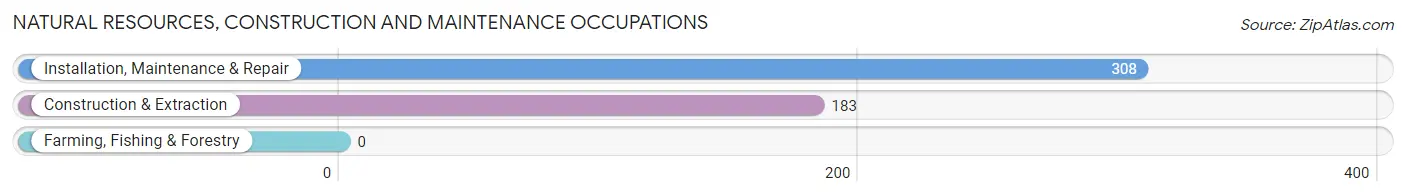
Natural Resources, Construction and Maintenance Occupations
The most common Natural Resources, Construction and Maintenance occupations in Pottsville are Installation, Maintenance & Repair (308 | 5.2%), and Construction & Extraction (183 | 3.1%).
Natural Resources, Construction and Maintenance Occupations by Sex
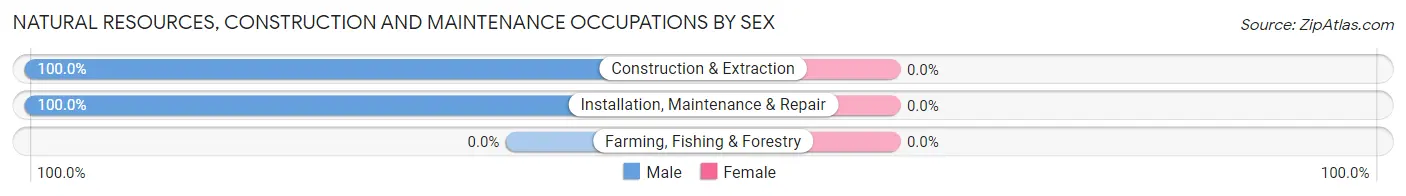
| Occupation | Male | Female |
| Farming, Fishing & Forestry | 0 (0.0%) | 0 (0.0%) |
| Construction & Extraction | 183 (100.0%) | 0 (0.0%) |
| Installation, Maintenance & Repair | 308 (100.0%) | 0 (0.0%) |
| Total (Category) | 491 (100.0%) | 0 (0.0%) |
| Total (Overall) | 2,700 (45.4%) | 3,251 (54.6%) |
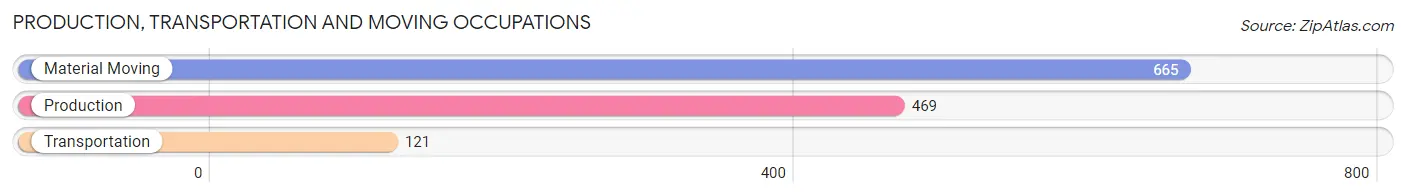
Production, Transportation and Moving Occupations
The most common Production, Transportation and Moving occupations in Pottsville are Material Moving (665 | 11.2%), Production (469 | 7.9%), and Transportation (121 | 2.0%).
Production, Transportation and Moving Occupations by Sex
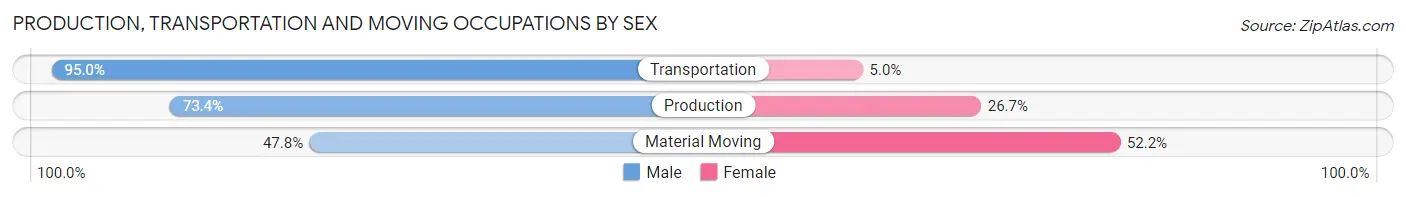
| Occupation | Male | Female |
| Production | 344 (73.4%) | 125 (26.7%) |
| Transportation | 115 (95.0%) | 6 (5.0%) |
| Material Moving | 318 (47.8%) | 347 (52.2%) |
| Total (Category) | 777 (61.9%) | 478 (38.1%) |
| Total (Overall) | 2,700 (45.4%) | 3,251 (54.6%) |
Employment Industries by Sex in Pottsville
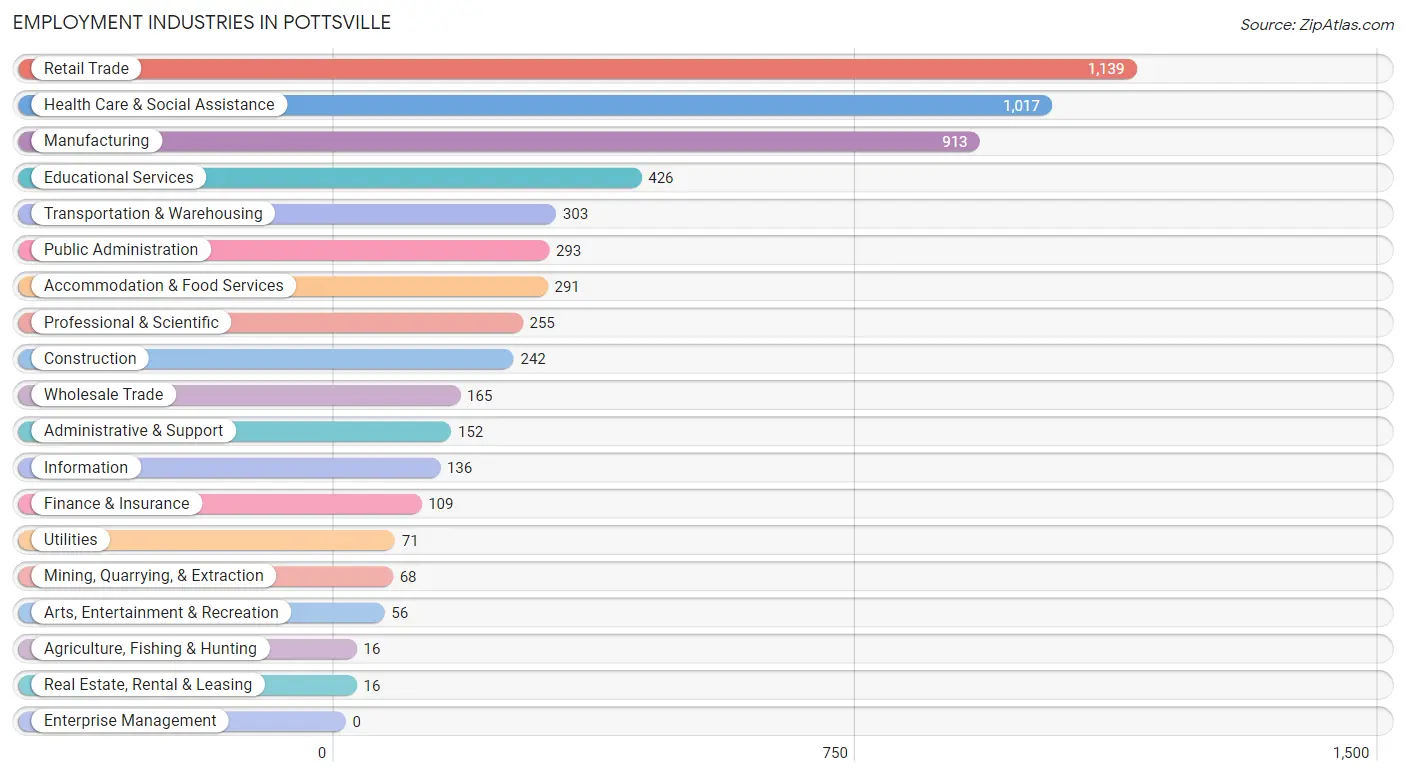
Employment Industries in Pottsville
The major employment industries in Pottsville include Retail Trade (1,139 | 19.1%), Health Care & Social Assistance (1,017 | 17.1%), Manufacturing (913 | 15.3%), Educational Services (426 | 7.2%), and Transportation & Warehousing (303 | 5.1%).
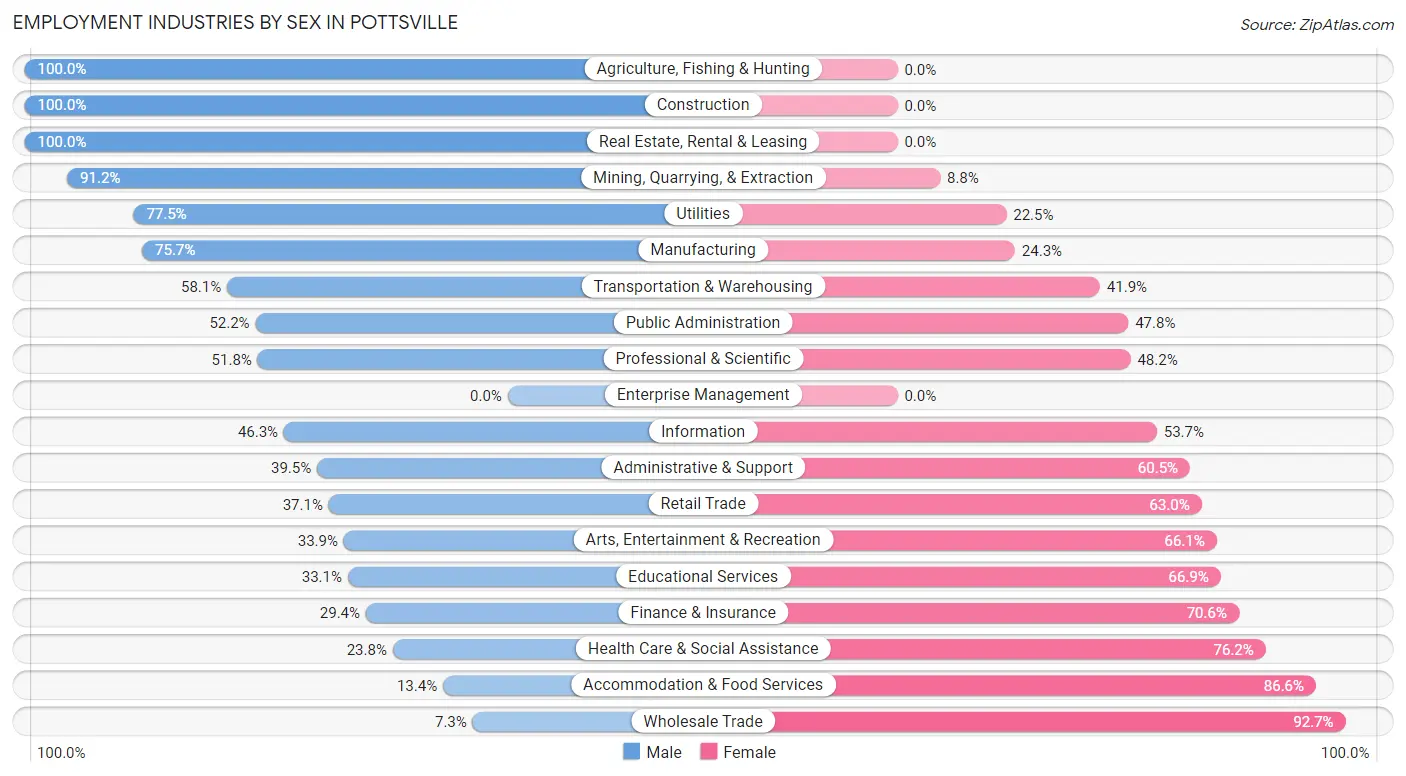
Employment Industries by Sex in Pottsville
The Pottsville industries that see more men than women are Agriculture, Fishing & Hunting (100.0%), Construction (100.0%), and Real Estate, Rental & Leasing (100.0%), whereas the industries that tend to have a higher number of women are Wholesale Trade (92.7%), Accommodation & Food Services (86.6%), and Health Care & Social Assistance (76.2%).
| Industry | Male | Female |
| Agriculture, Fishing & Hunting | 16 (100.0%) | 0 (0.0%) |
| Mining, Quarrying, & Extraction | 62 (91.2%) | 6 (8.8%) |
| Construction | 242 (100.0%) | 0 (0.0%) |
| Manufacturing | 691 (75.7%) | 222 (24.3%) |
| Wholesale Trade | 12 (7.3%) | 153 (92.7%) |
| Retail Trade | 422 (37.0%) | 717 (62.9%) |
| Transportation & Warehousing | 176 (58.1%) | 127 (41.9%) |
| Utilities | 55 (77.5%) | 16 (22.5%) |
| Information | 63 (46.3%) | 73 (53.7%) |
| Finance & Insurance | 32 (29.4%) | 77 (70.6%) |
| Real Estate, Rental & Leasing | 16 (100.0%) | 0 (0.0%) |
| Professional & Scientific | 132 (51.8%) | 123 (48.2%) |
| Enterprise Management | 0 (0.0%) | 0 (0.0%) |
| Administrative & Support | 60 (39.5%) | 92 (60.5%) |
| Educational Services | 141 (33.1%) | 285 (66.9%) |
| Health Care & Social Assistance | 242 (23.8%) | 775 (76.2%) |
| Arts, Entertainment & Recreation | 19 (33.9%) | 37 (66.1%) |
| Accommodation & Food Services | 39 (13.4%) | 252 (86.6%) |
| Public Administration | 153 (52.2%) | 140 (47.8%) |
| Total | 2,700 (45.4%) | 3,251 (54.6%) |
Education in Pottsville
School Enrollment in Pottsville
The most common levels of schooling among the 2,676 students in Pottsville are high school (883 | 33.0%), elementary school (752 | 28.1%), and middle school (414 | 15.5%).
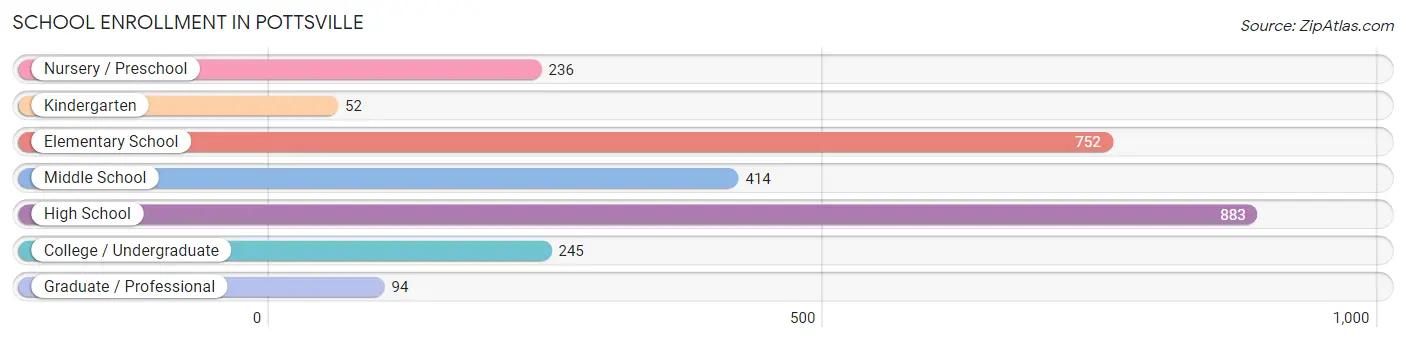
| School Level | # Students | % Students |
| Nursery / Preschool | 236 | 8.8% |
| Kindergarten | 52 | 1.9% |
| Elementary School | 752 | 28.1% |
| Middle School | 414 | 15.5% |
| High School | 883 | 33.0% |
| College / Undergraduate | 245 | 9.2% |
| Graduate / Professional | 94 | 3.5% |
| Total | 2,676 | 100.0% |
School Enrollment by Age by Funding Source in Pottsville
Out of a total of 2,676 students who are enrolled in schools in Pottsville, 270 (10.1%) attend a private institution, while the remaining 2,406 (89.9%) are enrolled in public schools. The age group of 20 to 24 year olds has the highest likelihood of being enrolled in private schools, with 34 (27.4% in the age bracket) enrolled. Conversely, the age group of 18 to 19 year olds has the lowest likelihood of being enrolled in a private school, with 193 (100.0% in the age bracket) attending a public institution.
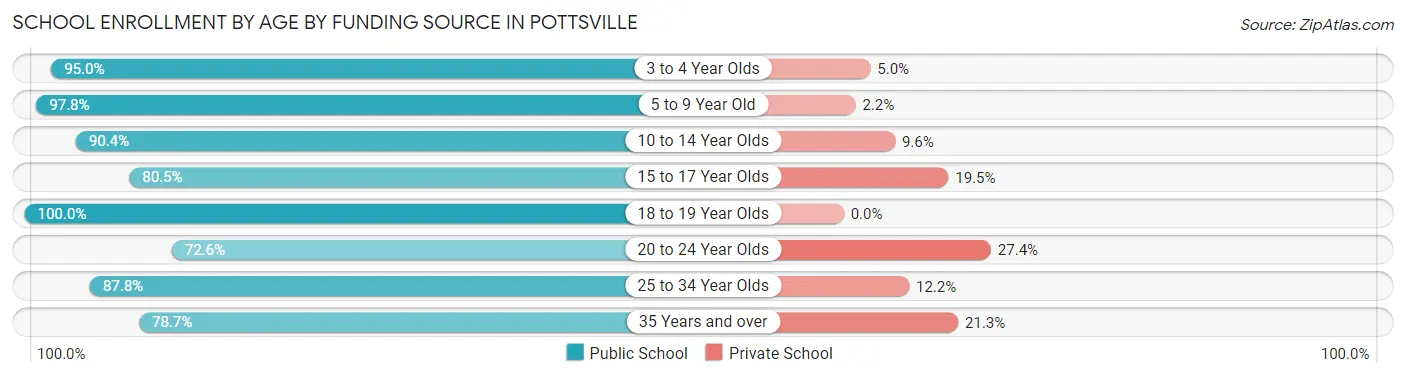
| Age Bracket | Public School | Private School |
| 3 to 4 Year Olds | 172 (95.0%) | 9 (5.0%) |
| 5 to 9 Year Old | 755 (97.8%) | 17 (2.2%) |
| 10 to 14 Year Olds | 539 (90.4%) | 57 (9.6%) |
| 15 to 17 Year Olds | 450 (80.5%) | 109 (19.5%) |
| 18 to 19 Year Olds | 193 (100.0%) | 0 (0.0%) |
| 20 to 24 Year Olds | 90 (72.6%) | 34 (27.4%) |
| 25 to 34 Year Olds | 101 (87.8%) | 14 (12.2%) |
| 35 Years and over | 107 (78.7%) | 29 (21.3%) |
| Total | 2,406 (89.9%) | 270 (10.1%) |
Educational Attainment by Field of Study in Pottsville
Business (341 | 17.0%), education (295 | 14.7%), arts & humanities (260 | 13.0%), social sciences (197 | 9.8%), and science & technology (180 | 9.0%) are the most common fields of study among 2,004 individuals in Pottsville who have obtained a bachelor's degree or higher.
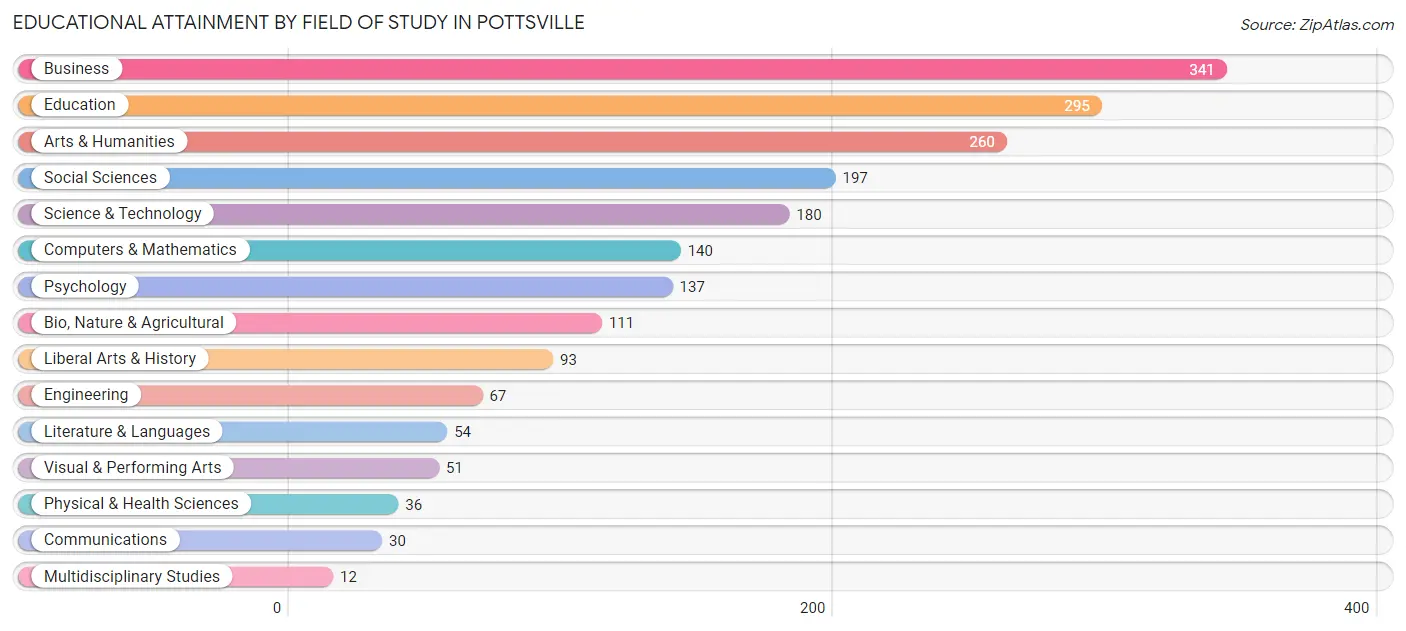
| Field of Study | # Graduates | % Graduates |
| Computers & Mathematics | 140 | 7.0% |
| Bio, Nature & Agricultural | 111 | 5.5% |
| Physical & Health Sciences | 36 | 1.8% |
| Psychology | 137 | 6.8% |
| Social Sciences | 197 | 9.8% |
| Engineering | 67 | 3.3% |
| Multidisciplinary Studies | 12 | 0.6% |
| Science & Technology | 180 | 9.0% |
| Business | 341 | 17.0% |
| Education | 295 | 14.7% |
| Literature & Languages | 54 | 2.7% |
| Liberal Arts & History | 93 | 4.6% |
| Visual & Performing Arts | 51 | 2.5% |
| Communications | 30 | 1.5% |
| Arts & Humanities | 260 | 13.0% |
| Total | 2,004 | 100.0% |
Transportation & Commute in Pottsville
Vehicle Availability by Sex in Pottsville
The most prevalent vehicle ownership categories in Pottsville are males with 2 vehicles (1,167, accounting for 45.0%) and females with 2 vehicles (1,375, making up 36.6%).
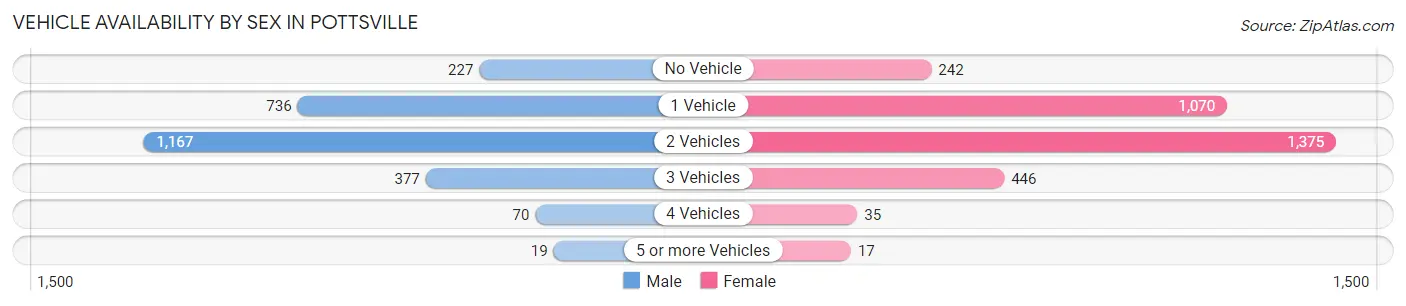
| Vehicles Available | Male | Female |
| No Vehicle | 227 (8.7%) | 242 (7.6%) |
| 1 Vehicle | 736 (28.3%) | 1,070 (33.6%) |
| 2 Vehicles | 1,167 (45.0%) | 1,375 (43.2%) |
| 3 Vehicles | 377 (14.5%) | 446 (14.0%) |
| 4 Vehicles | 70 (2.7%) | 35 (1.1%) |
| 5 or more Vehicles | 19 (0.7%) | 17 (0.5%) |
| Total | 2,596 (100.0%) | 3,185 (100.0%) |
Commute Time in Pottsville
The most frequently occuring commute durations in Pottsville are 15 to 19 minutes (1,155 commuters, 21.4%), 10 to 14 minutes (1,101 commuters, 20.4%), and 5 to 9 minutes (1,074 commuters, 19.9%).
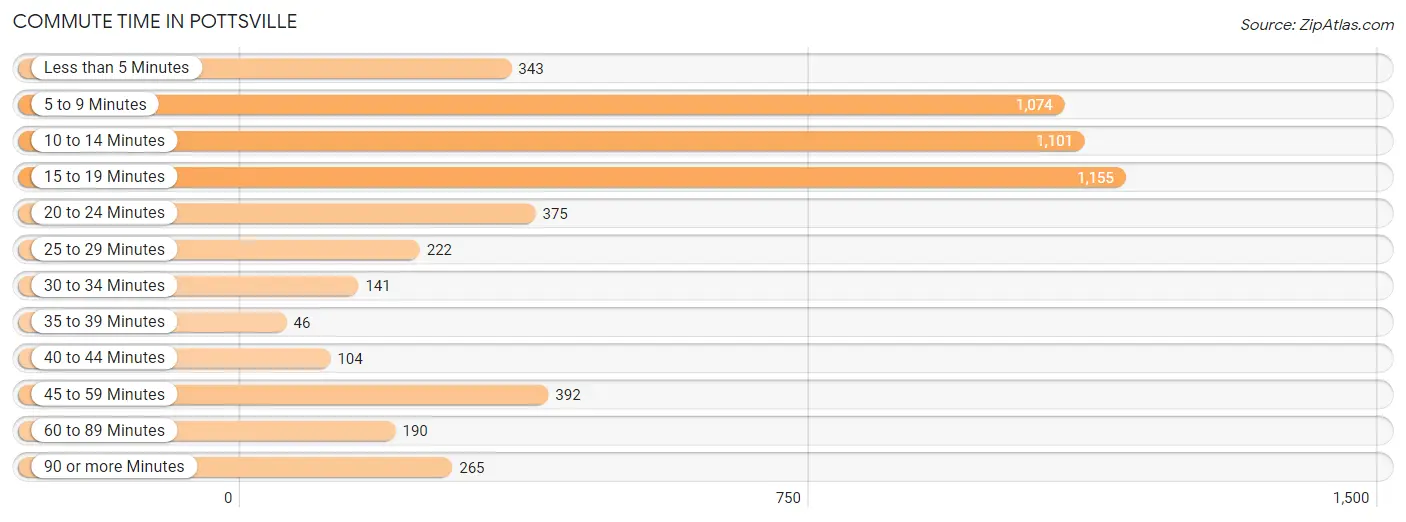
| Commute Time | # Commuters | % Commuters |
| Less than 5 Minutes | 343 | 6.3% |
| 5 to 9 Minutes | 1,074 | 19.9% |
| 10 to 14 Minutes | 1,101 | 20.4% |
| 15 to 19 Minutes | 1,155 | 21.4% |
| 20 to 24 Minutes | 375 | 6.9% |
| 25 to 29 Minutes | 222 | 4.1% |
| 30 to 34 Minutes | 141 | 2.6% |
| 35 to 39 Minutes | 46 | 0.9% |
| 40 to 44 Minutes | 104 | 1.9% |
| 45 to 59 Minutes | 392 | 7.2% |
| 60 to 89 Minutes | 190 | 3.5% |
| 90 or more Minutes | 265 | 4.9% |
Commute Time by Sex in Pottsville
The most common commute times in Pottsville are 10 to 14 minutes (535 commuters, 21.8%) for males and 15 to 19 minutes (839 commuters, 28.4%) for females.
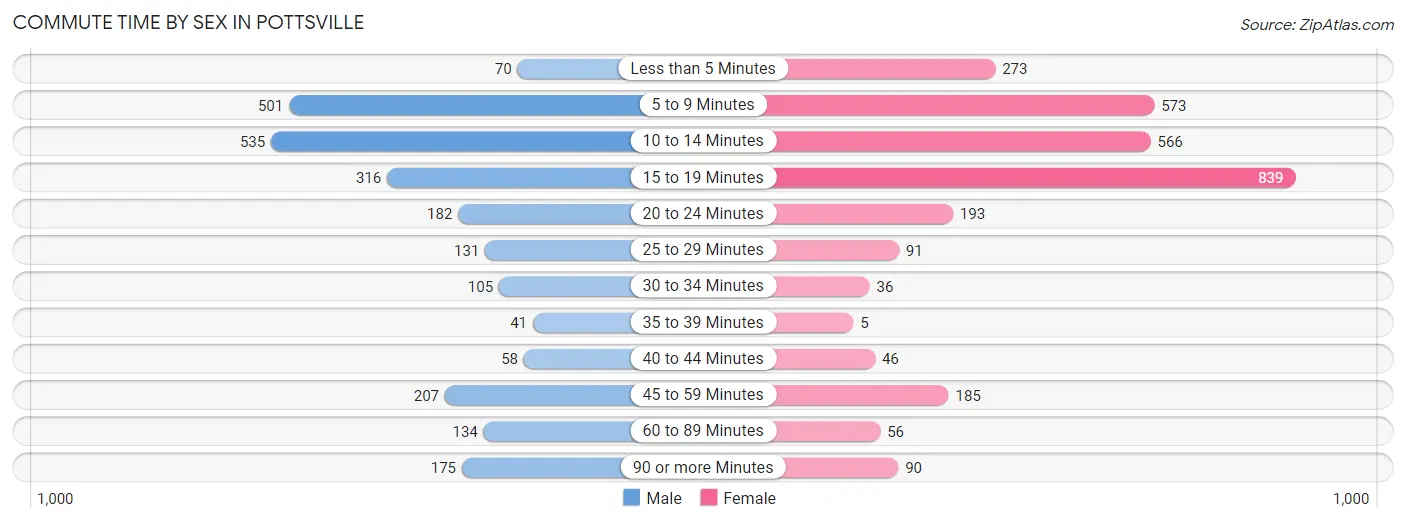
| Commute Time | Male | Female |
| Less than 5 Minutes | 70 (2.9%) | 273 (9.2%) |
| 5 to 9 Minutes | 501 (20.4%) | 573 (19.4%) |
| 10 to 14 Minutes | 535 (21.8%) | 566 (19.2%) |
| 15 to 19 Minutes | 316 (12.9%) | 839 (28.4%) |
| 20 to 24 Minutes | 182 (7.4%) | 193 (6.5%) |
| 25 to 29 Minutes | 131 (5.3%) | 91 (3.1%) |
| 30 to 34 Minutes | 105 (4.3%) | 36 (1.2%) |
| 35 to 39 Minutes | 41 (1.7%) | 5 (0.2%) |
| 40 to 44 Minutes | 58 (2.4%) | 46 (1.6%) |
| 45 to 59 Minutes | 207 (8.4%) | 185 (6.3%) |
| 60 to 89 Minutes | 134 (5.5%) | 56 (1.9%) |
| 90 or more Minutes | 175 (7.1%) | 90 (3.0%) |
Time of Departure to Work by Sex in Pottsville
The most frequent times of departure to work in Pottsville are 4:00 PM to 11:59 PM (378, 15.4%) for males and 9:00 AM to 9:59 AM (449, 15.2%) for females.
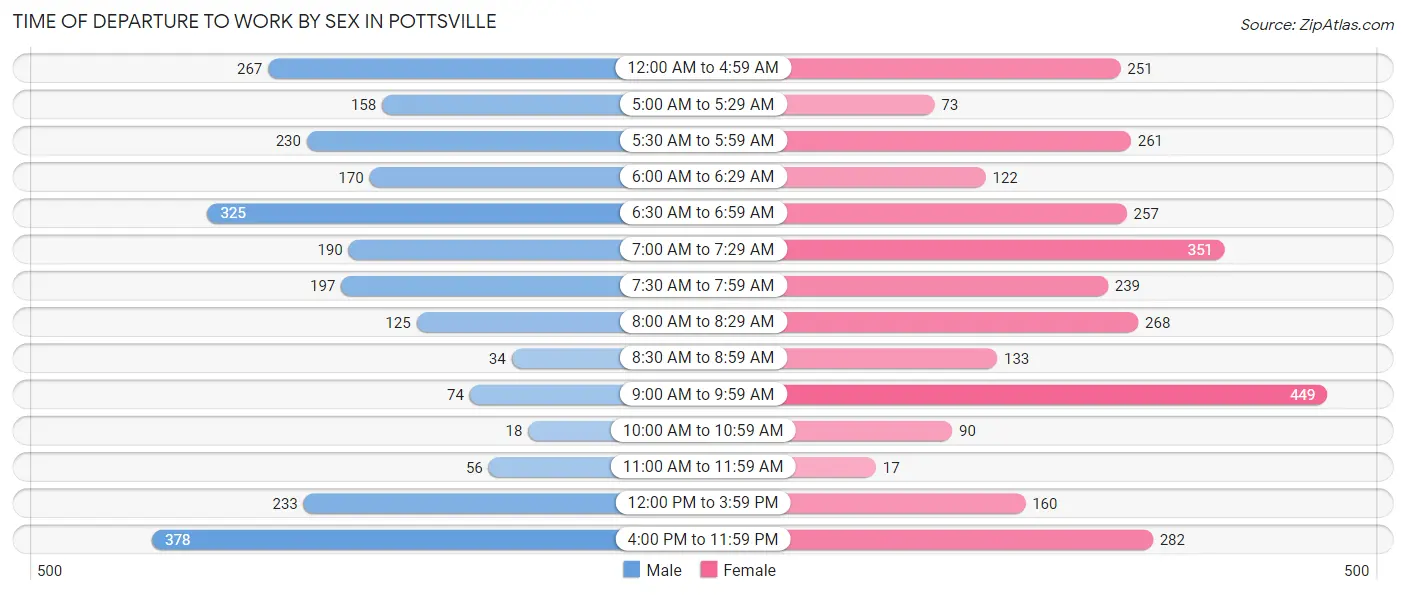
| Time of Departure | Male | Female |
| 12:00 AM to 4:59 AM | 267 (10.9%) | 251 (8.5%) |
| 5:00 AM to 5:29 AM | 158 (6.4%) | 73 (2.5%) |
| 5:30 AM to 5:59 AM | 230 (9.4%) | 261 (8.8%) |
| 6:00 AM to 6:29 AM | 170 (6.9%) | 122 (4.1%) |
| 6:30 AM to 6:59 AM | 325 (13.2%) | 257 (8.7%) |
| 7:00 AM to 7:29 AM | 190 (7.7%) | 351 (11.9%) |
| 7:30 AM to 7:59 AM | 197 (8.0%) | 239 (8.1%) |
| 8:00 AM to 8:29 AM | 125 (5.1%) | 268 (9.1%) |
| 8:30 AM to 8:59 AM | 34 (1.4%) | 133 (4.5%) |
| 9:00 AM to 9:59 AM | 74 (3.0%) | 449 (15.2%) |
| 10:00 AM to 10:59 AM | 18 (0.7%) | 90 (3.0%) |
| 11:00 AM to 11:59 AM | 56 (2.3%) | 17 (0.6%) |
| 12:00 PM to 3:59 PM | 233 (9.5%) | 160 (5.4%) |
| 4:00 PM to 11:59 PM | 378 (15.4%) | 282 (9.6%) |
| Total | 2,455 (100.0%) | 2,953 (100.0%) |
Housing Occupancy in Pottsville
Occupancy by Ownership in Pottsville
Of the total 5,655 dwellings in Pottsville, owner-occupied units account for 3,192 (56.5%), while renter-occupied units make up 2,463 (43.5%).
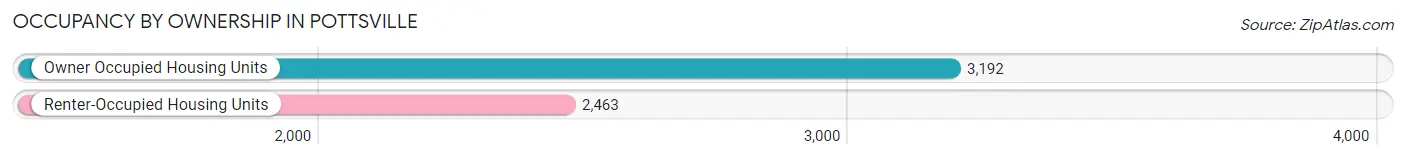
| Occupancy | # Housing Units | % Housing Units |
| Owner Occupied Housing Units | 3,192 | 56.5% |
| Renter-Occupied Housing Units | 2,463 | 43.5% |
| Total Occupied Housing Units | 5,655 | 100.0% |
Occupancy by Household Size in Pottsville
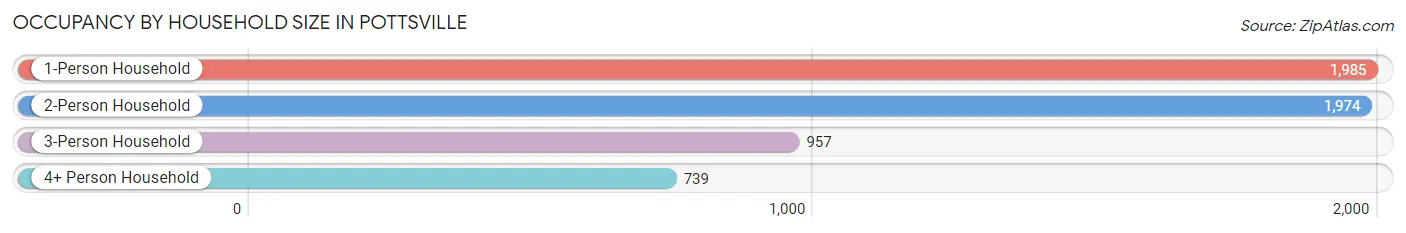
| Household Size | # Housing Units | % Housing Units |
| 1-Person Household | 1,985 | 35.1% |
| 2-Person Household | 1,974 | 34.9% |
| 3-Person Household | 957 | 16.9% |
| 4+ Person Household | 739 | 13.1% |
| Total Housing Units | 5,655 | 100.0% |
Occupancy by Ownership by Household Size in Pottsville
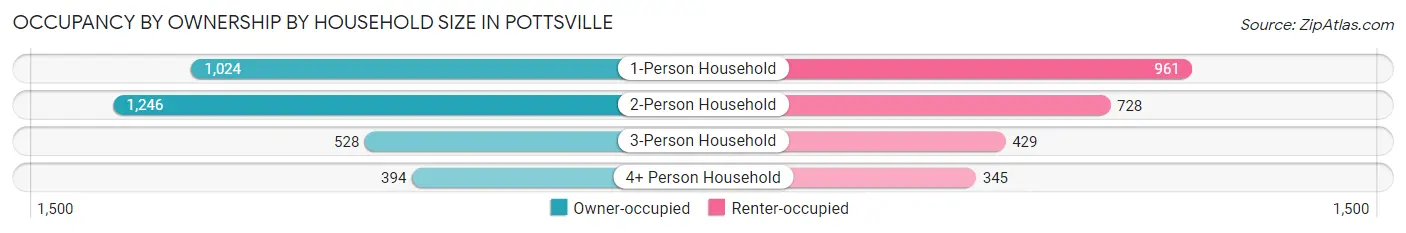
| Household Size | Owner-occupied | Renter-occupied |
| 1-Person Household | 1,024 (51.6%) | 961 (48.4%) |
| 2-Person Household | 1,246 (63.1%) | 728 (36.9%) |
| 3-Person Household | 528 (55.2%) | 429 (44.8%) |
| 4+ Person Household | 394 (53.3%) | 345 (46.7%) |
| Total Housing Units | 3,192 (56.5%) | 2,463 (43.5%) |
Occupancy by Educational Attainment in Pottsville
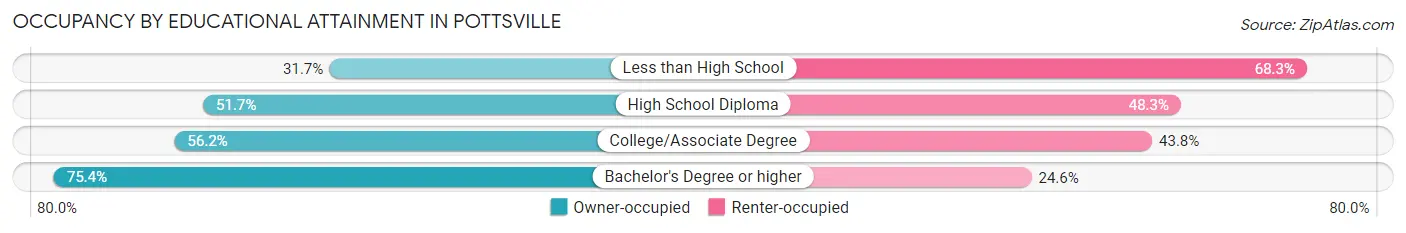
| Household Size | Owner-occupied | Renter-occupied |
| Less than High School | 155 (31.7%) | 334 (68.3%) |
| High School Diploma | 1,220 (51.7%) | 1,140 (48.3%) |
| College/Associate Degree | 875 (56.2%) | 681 (43.8%) |
| Bachelor's Degree or higher | 942 (75.4%) | 308 (24.6%) |
Occupancy by Age of Householder in Pottsville
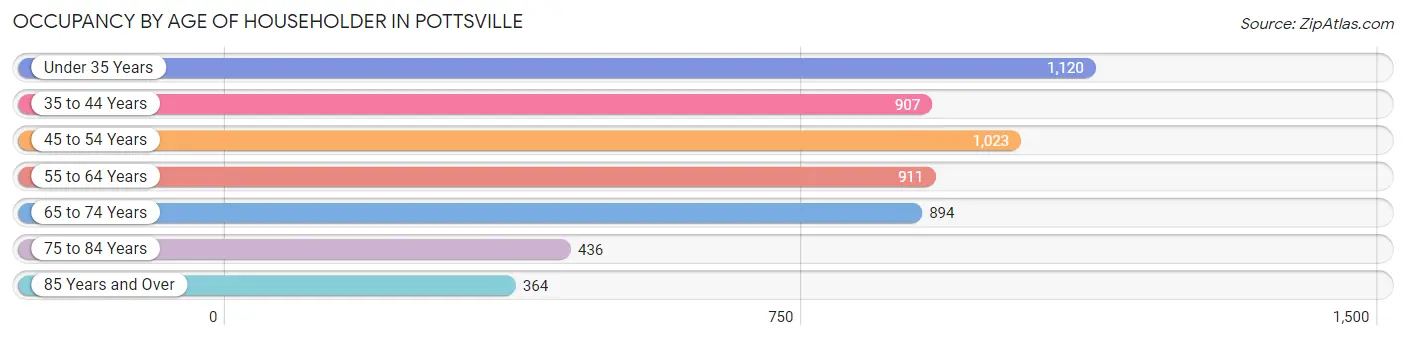
| Age Bracket | # Households | % Households |
| Under 35 Years | 1,120 | 19.8% |
| 35 to 44 Years | 907 | 16.0% |
| 45 to 54 Years | 1,023 | 18.1% |
| 55 to 64 Years | 911 | 16.1% |
| 65 to 74 Years | 894 | 15.8% |
| 75 to 84 Years | 436 | 7.7% |
| 85 Years and Over | 364 | 6.4% |
| Total | 5,655 | 100.0% |
Housing Finances in Pottsville
Median Income by Occupancy in Pottsville
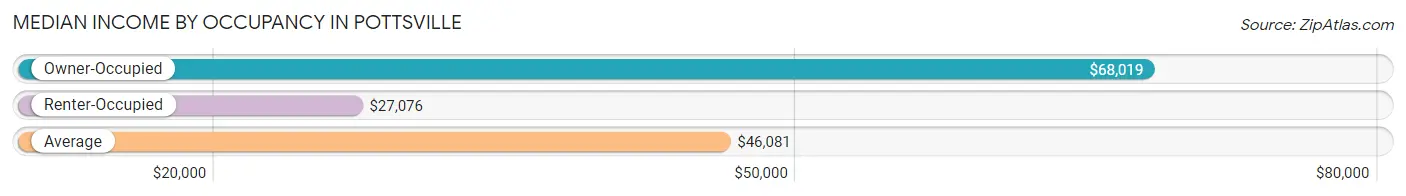
| Occupancy Type | # Households | Median Income |
| Owner-Occupied | 3,192 (56.5%) | $68,019 |
| Renter-Occupied | 2,463 (43.5%) | $27,076 |
| Average | 5,655 (100.0%) | $46,081 |
Occupancy by Householder Income Bracket in Pottsville
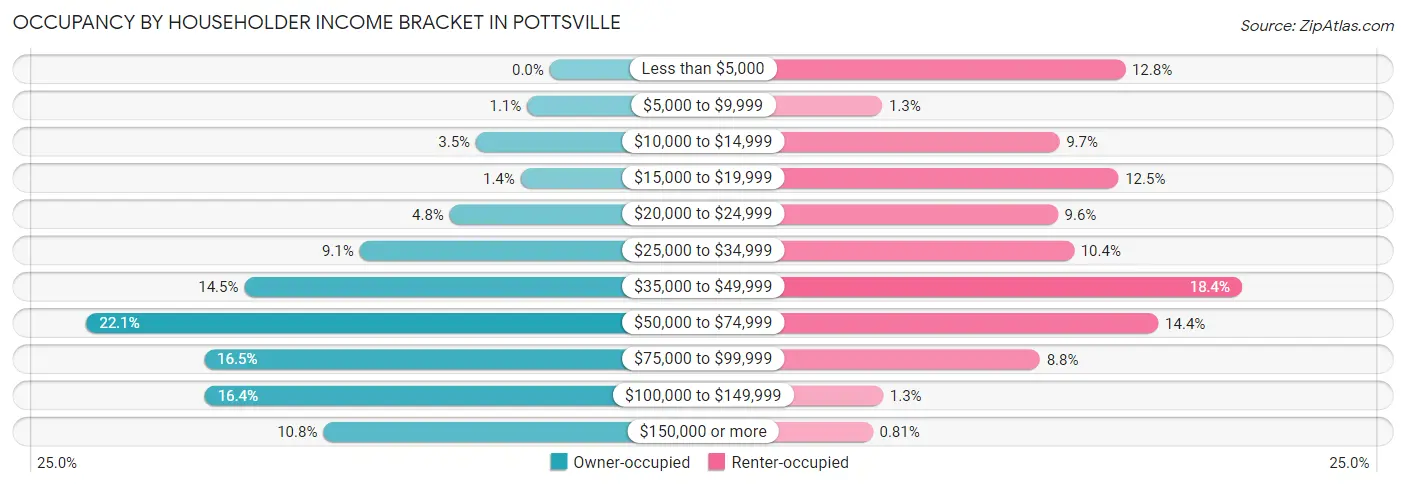
| Income Bracket | Owner-occupied | Renter-occupied |
| Less than $5,000 | 0 (0.0%) | 316 (12.8%) |
| $5,000 to $9,999 | 34 (1.1%) | 31 (1.3%) |
| $10,000 to $14,999 | 112 (3.5%) | 239 (9.7%) |
| $15,000 to $19,999 | 44 (1.4%) | 308 (12.5%) |
| $20,000 to $24,999 | 152 (4.8%) | 237 (9.6%) |
| $25,000 to $34,999 | 289 (9.0%) | 256 (10.4%) |
| $35,000 to $49,999 | 464 (14.5%) | 453 (18.4%) |
| $50,000 to $74,999 | 704 (22.1%) | 355 (14.4%) |
| $75,000 to $99,999 | 525 (16.5%) | 216 (8.8%) |
| $100,000 to $149,999 | 524 (16.4%) | 32 (1.3%) |
| $150,000 or more | 344 (10.8%) | 20 (0.8%) |
| Total | 3,192 (100.0%) | 2,463 (100.0%) |
Monthly Housing Cost Tiers in Pottsville
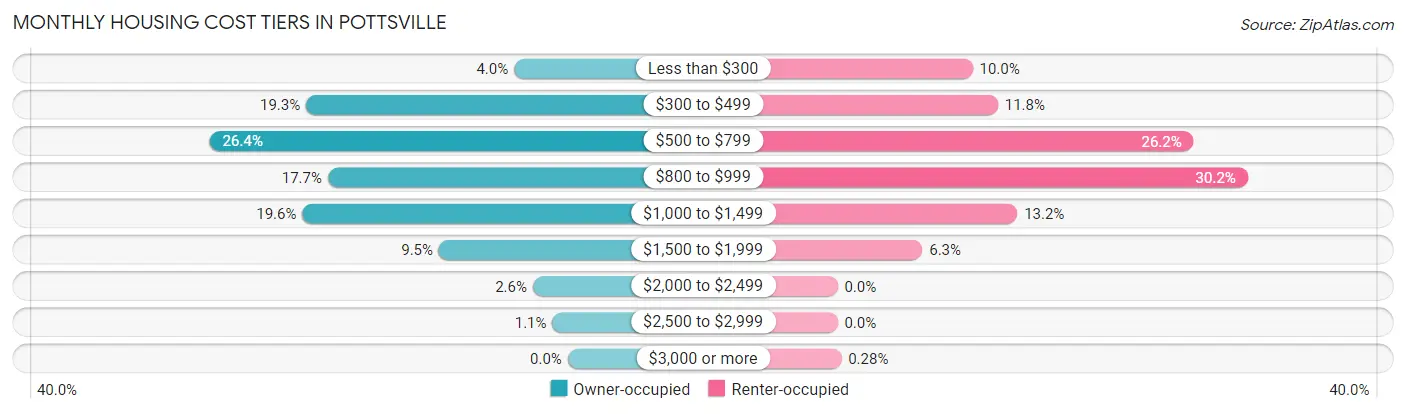
| Monthly Cost | Owner-occupied | Renter-occupied |
| Less than $300 | 126 (4.0%) | 245 (10.0%) |
| $300 to $499 | 615 (19.3%) | 291 (11.8%) |
| $500 to $799 | 842 (26.4%) | 646 (26.2%) |
| $800 to $999 | 564 (17.7%) | 744 (30.2%) |
| $1,000 to $1,499 | 624 (19.6%) | 326 (13.2%) |
| $1,500 to $1,999 | 303 (9.5%) | 154 (6.2%) |
| $2,000 to $2,499 | 82 (2.6%) | 0 (0.0%) |
| $2,500 to $2,999 | 36 (1.1%) | 0 (0.0%) |
| $3,000 or more | 0 (0.0%) | 7 (0.3%) |
| Total | 3,192 (100.0%) | 2,463 (100.0%) |
Physical Housing Characteristics in Pottsville
Housing Structures in Pottsville
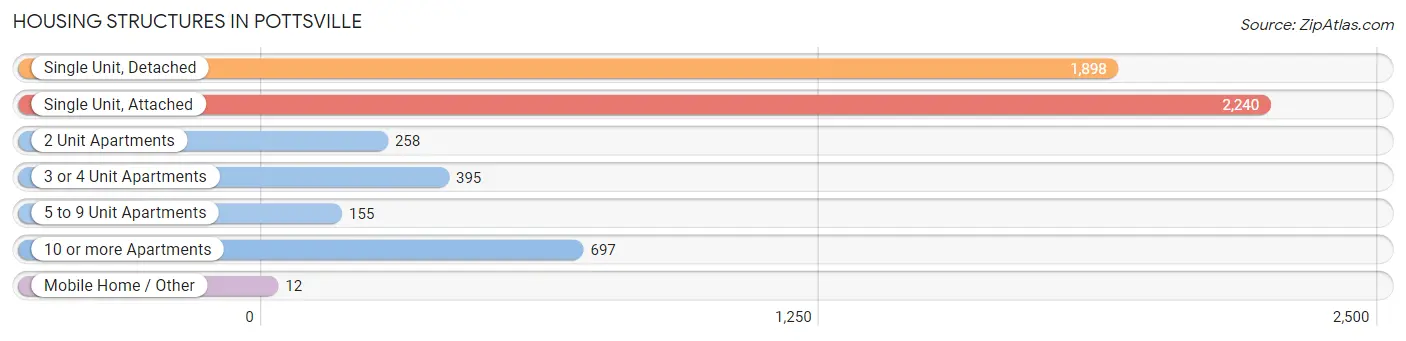
| Structure Type | # Housing Units | % Housing Units |
| Single Unit, Detached | 1,898 | 33.6% |
| Single Unit, Attached | 2,240 | 39.6% |
| 2 Unit Apartments | 258 | 4.6% |
| 3 or 4 Unit Apartments | 395 | 7.0% |
| 5 to 9 Unit Apartments | 155 | 2.7% |
| 10 or more Apartments | 697 | 12.3% |
| Mobile Home / Other | 12 | 0.2% |
| Total | 5,655 | 100.0% |
Housing Structures by Occupancy in Pottsville
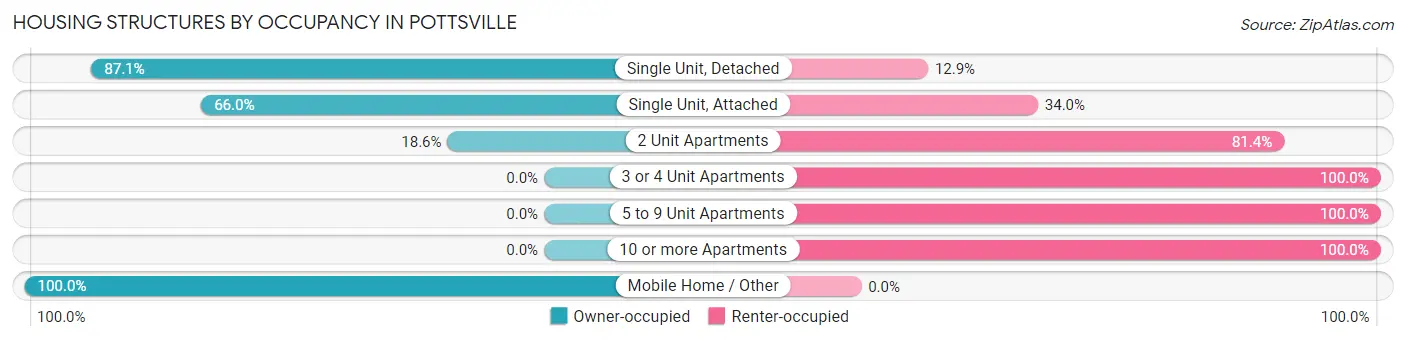
| Structure Type | Owner-occupied | Renter-occupied |
| Single Unit, Detached | 1,654 (87.1%) | 244 (12.9%) |
| Single Unit, Attached | 1,478 (66.0%) | 762 (34.0%) |
| 2 Unit Apartments | 48 (18.6%) | 210 (81.4%) |
| 3 or 4 Unit Apartments | 0 (0.0%) | 395 (100.0%) |
| 5 to 9 Unit Apartments | 0 (0.0%) | 155 (100.0%) |
| 10 or more Apartments | 0 (0.0%) | 697 (100.0%) |
| Mobile Home / Other | 12 (100.0%) | 0 (0.0%) |
| Total | 3,192 (56.5%) | 2,463 (43.5%) |
Housing Structures by Number of Rooms in Pottsville
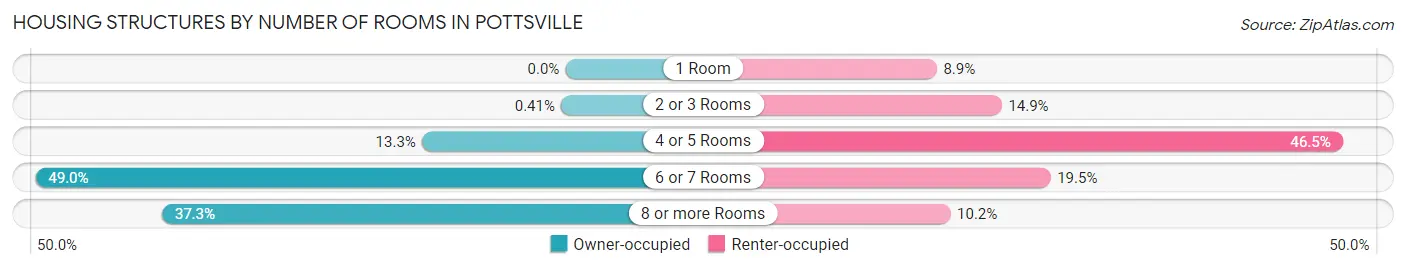
| Number of Rooms | Owner-occupied | Renter-occupied |
| 1 Room | 0 (0.0%) | 220 (8.9%) |
| 2 or 3 Rooms | 13 (0.4%) | 368 (14.9%) |
| 4 or 5 Rooms | 424 (13.3%) | 1,145 (46.5%) |
| 6 or 7 Rooms | 1,564 (49.0%) | 479 (19.5%) |
| 8 or more Rooms | 1,191 (37.3%) | 251 (10.2%) |
| Total | 3,192 (100.0%) | 2,463 (100.0%) |
Housing Structure by Heating Type in Pottsville
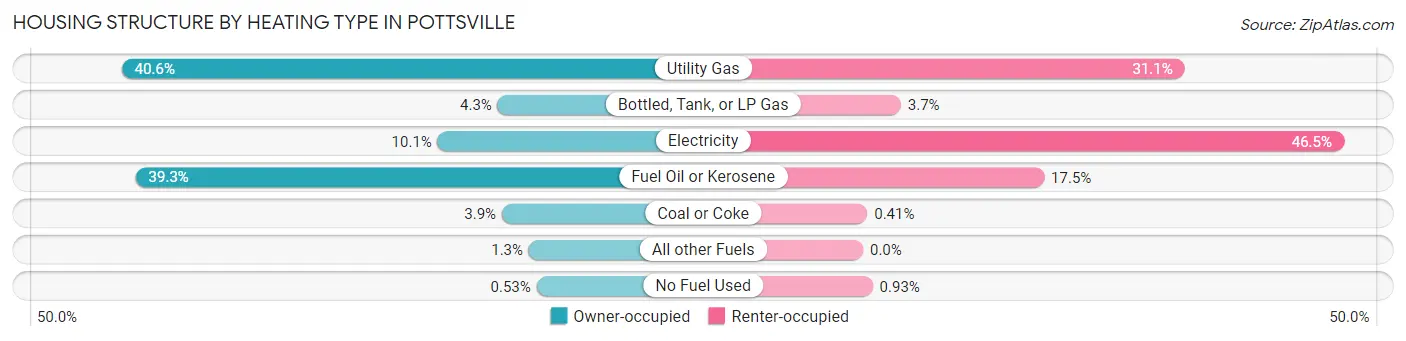
| Heating Type | Owner-occupied | Renter-occupied |
| Utility Gas | 1,297 (40.6%) | 765 (31.1%) |
| Bottled, Tank, or LP Gas | 137 (4.3%) | 90 (3.6%) |
| Electricity | 322 (10.1%) | 1,144 (46.5%) |
| Fuel Oil or Kerosene | 1,254 (39.3%) | 431 (17.5%) |
| Coal or Coke | 124 (3.9%) | 10 (0.4%) |
| All other Fuels | 41 (1.3%) | 0 (0.0%) |
| No Fuel Used | 17 (0.5%) | 23 (0.9%) |
| Total | 3,192 (100.0%) | 2,463 (100.0%) |
Household Vehicle Usage in Pottsville
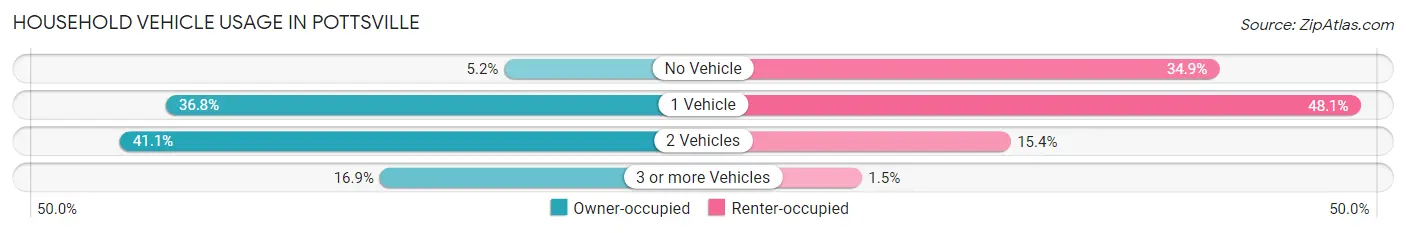
| Vehicles per Household | Owner-occupied | Renter-occupied |
| No Vehicle | 167 (5.2%) | 860 (34.9%) |
| 1 Vehicle | 1,175 (36.8%) | 1,185 (48.1%) |
| 2 Vehicles | 1,312 (41.1%) | 380 (15.4%) |
| 3 or more Vehicles | 538 (16.9%) | 38 (1.5%) |
| Total | 3,192 (100.0%) | 2,463 (100.0%) |
Real Estate & Mortgages in Pottsville
Real Estate and Mortgage Overview in Pottsville
| Characteristic | Without Mortgage | With Mortgage |
| Housing Units | 1,440 | 1,752 |
| Median Property Value | $75,400 | $96,000 |
| Median Household Income | $51,071 | $275 |
| Monthly Housing Costs | $501 | $0 |
| Real Estate Taxes | $1,828 | $0 |
Property Value by Mortgage Status in Pottsville
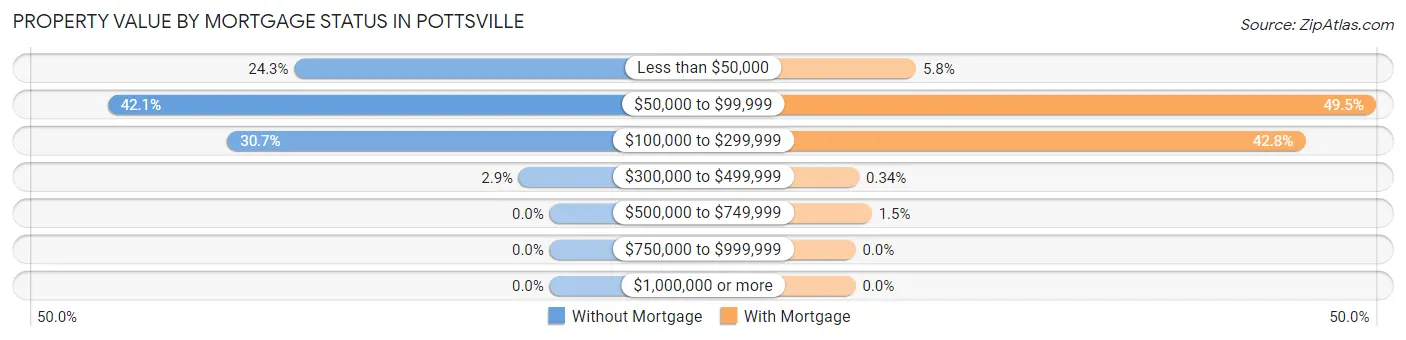
| Property Value | Without Mortgage | With Mortgage |
| Less than $50,000 | 350 (24.3%) | 101 (5.8%) |
| $50,000 to $99,999 | 606 (42.1%) | 868 (49.5%) |
| $100,000 to $299,999 | 442 (30.7%) | 750 (42.8%) |
| $300,000 to $499,999 | 42 (2.9%) | 6 (0.3%) |
| $500,000 to $749,999 | 0 (0.0%) | 27 (1.5%) |
| $750,000 to $999,999 | 0 (0.0%) | 0 (0.0%) |
| $1,000,000 or more | 0 (0.0%) | 0 (0.0%) |
| Total | 1,440 (100.0%) | 1,752 (100.0%) |
Household Income by Mortgage Status in Pottsville
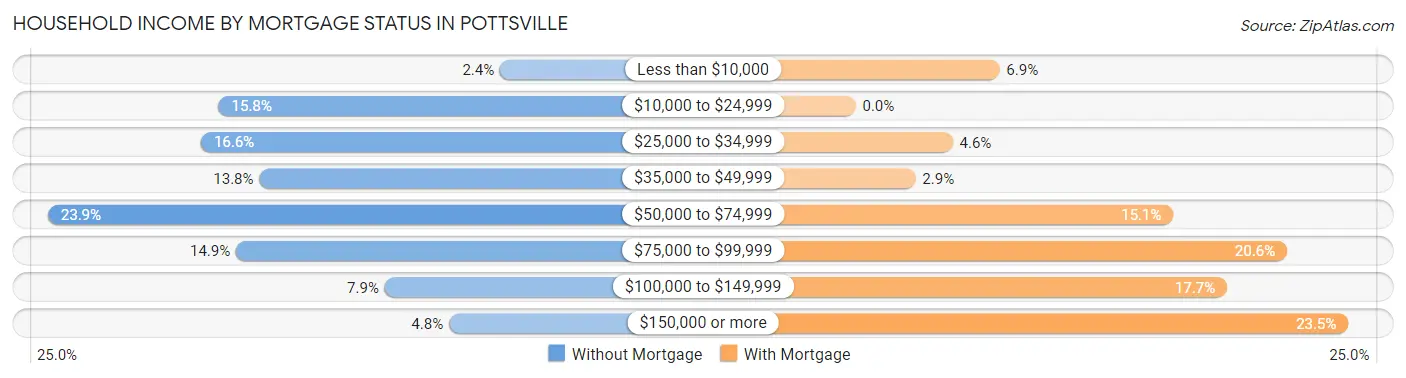
| Household Income | Without Mortgage | With Mortgage |
| Less than $10,000 | 34 (2.4%) | 120 (6.9%) |
| $10,000 to $24,999 | 227 (15.8%) | 0 (0.0%) |
| $25,000 to $34,999 | 239 (16.6%) | 81 (4.6%) |
| $35,000 to $49,999 | 199 (13.8%) | 50 (2.9%) |
| $50,000 to $74,999 | 344 (23.9%) | 265 (15.1%) |
| $75,000 to $99,999 | 215 (14.9%) | 360 (20.5%) |
| $100,000 to $149,999 | 113 (7.9%) | 310 (17.7%) |
| $150,000 or more | 69 (4.8%) | 411 (23.5%) |
| Total | 1,440 (100.0%) | 1,752 (100.0%) |
Property Value to Household Income Ratio in Pottsville
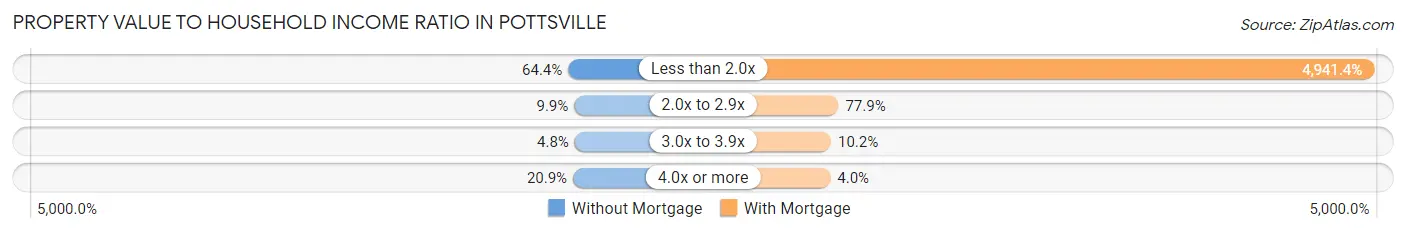
| Value-to-Income Ratio | Without Mortgage | With Mortgage |
| Less than 2.0x | 927 (64.4%) | 86,574 (4,941.4%) |
| 2.0x to 2.9x | 143 (9.9%) | 1,365 (77.9%) |
| 3.0x to 3.9x | 69 (4.8%) | 179 (10.2%) |
| 4.0x or more | 301 (20.9%) | 70 (4.0%) |
| Total | 1,440 (100.0%) | 1,752 (100.0%) |
Real Estate Taxes by Mortgage Status in Pottsville
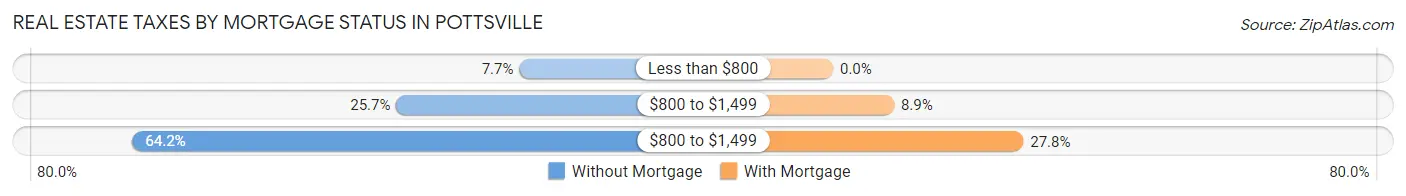
| Property Taxes | Without Mortgage | With Mortgage |
| Less than $800 | 111 (7.7%) | 0 (0.0%) |
| $800 to $1,499 | 370 (25.7%) | 156 (8.9%) |
| $800 to $1,499 | 925 (64.2%) | 487 (27.8%) |
| Total | 1,440 (100.0%) | 1,752 (100.0%) |
Health & Disability in Pottsville
Health Insurance Coverage by Age in Pottsville
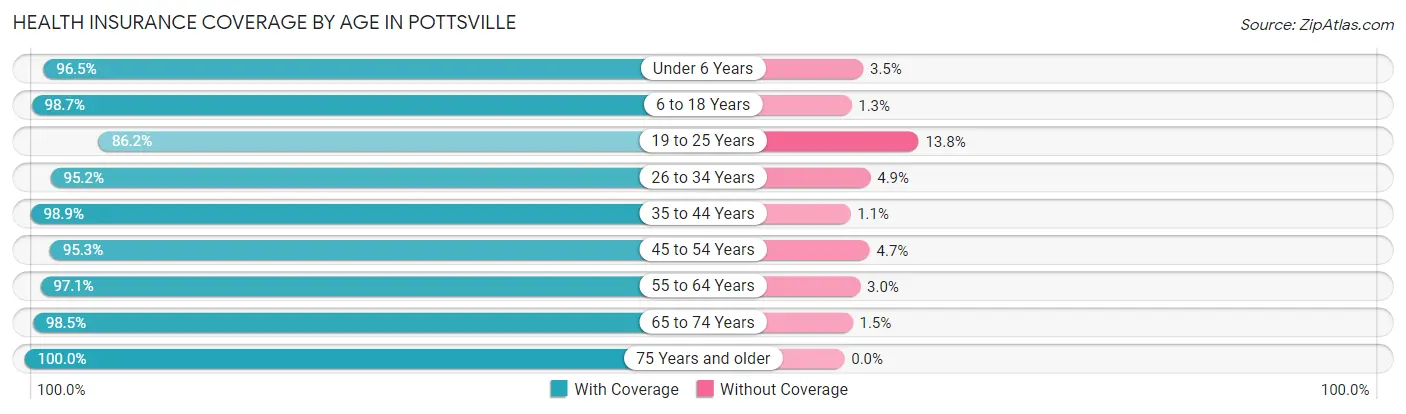
| Age Bracket | With Coverage | Without Coverage |
| Under 6 Years | 1,023 (96.5%) | 37 (3.5%) |
| 6 to 18 Years | 2,202 (98.7%) | 29 (1.3%) |
| 19 to 25 Years | 666 (86.2%) | 107 (13.8%) |
| 26 to 34 Years | 1,607 (95.2%) | 82 (4.9%) |
| 35 to 44 Years | 1,534 (98.9%) | 17 (1.1%) |
| 45 to 54 Years | 1,534 (95.3%) | 76 (4.7%) |
| 55 to 64 Years | 1,483 (97.1%) | 45 (2.9%) |
| 65 to 74 Years | 1,221 (98.5%) | 19 (1.5%) |
| 75 Years and older | 1,032 (100.0%) | 0 (0.0%) |
| Total | 12,302 (96.8%) | 412 (3.2%) |
Health Insurance Coverage by Citizenship Status in Pottsville
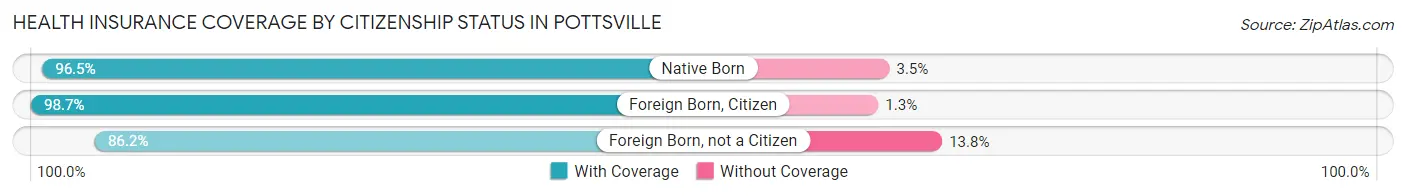
| Citizenship Status | With Coverage | Without Coverage |
| Native Born | 1,023 (96.5%) | 37 (3.5%) |
| Foreign Born, Citizen | 2,202 (98.7%) | 29 (1.3%) |
| Foreign Born, not a Citizen | 666 (86.2%) | 107 (13.8%) |
Health Insurance Coverage by Household Income in Pottsville
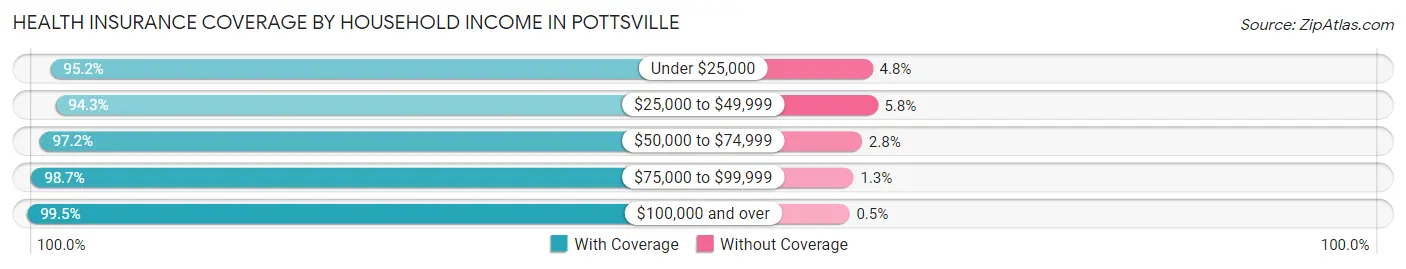
| Household Income | With Coverage | Without Coverage |
| Under $25,000 | 2,694 (95.2%) | 137 (4.8%) |
| $25,000 to $49,999 | 2,801 (94.3%) | 171 (5.8%) |
| $50,000 to $74,999 | 2,230 (97.2%) | 65 (2.8%) |
| $75,000 to $99,999 | 1,958 (98.7%) | 25 (1.3%) |
| $100,000 and over | 2,602 (99.5%) | 13 (0.5%) |
Public vs Private Health Insurance Coverage by Age in Pottsville
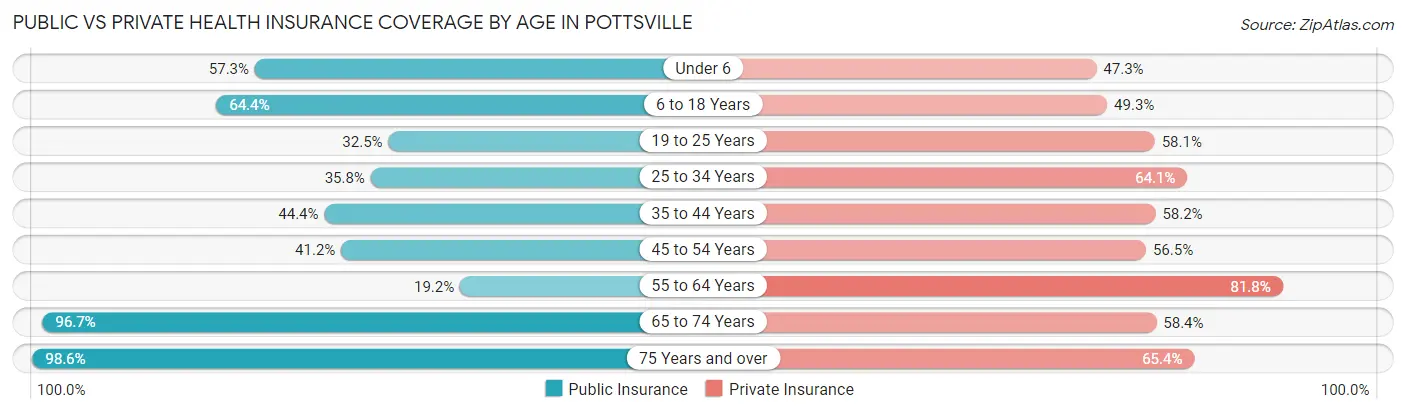
| Age Bracket | Public Insurance | Private Insurance |
| Under 6 | 607 (57.3%) | 501 (47.3%) |
| 6 to 18 Years | 1,437 (64.4%) | 1,099 (49.3%) |
| 19 to 25 Years | 251 (32.5%) | 449 (58.1%) |
| 25 to 34 Years | 604 (35.8%) | 1,083 (64.1%) |
| 35 to 44 Years | 688 (44.4%) | 903 (58.2%) |
| 45 to 54 Years | 664 (41.2%) | 909 (56.5%) |
| 55 to 64 Years | 293 (19.2%) | 1,250 (81.8%) |
| 65 to 74 Years | 1,199 (96.7%) | 724 (58.4%) |
| 75 Years and over | 1,017 (98.6%) | 675 (65.4%) |
| Total | 6,760 (53.2%) | 7,593 (59.7%) |
Disability Status by Sex by Age in Pottsville
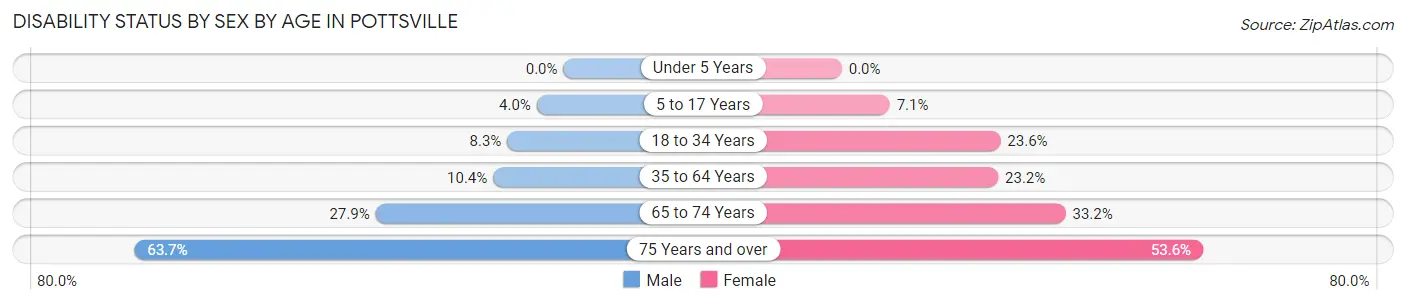
| Age Bracket | Male | Female |
| Under 5 Years | 0 (0.0%) | 0 (0.0%) |
| 5 to 17 Years | 27 (4.0%) | 102 (7.1%) |
| 18 to 34 Years | 80 (8.3%) | 410 (23.5%) |
| 35 to 64 Years | 250 (10.4%) | 532 (23.2%) |
| 65 to 74 Years | 173 (27.9%) | 206 (33.2%) |
| 75 Years and over | 244 (63.7%) | 348 (53.6%) |
Disability Class by Sex by Age in Pottsville
Disability Class: Hearing Difficulty
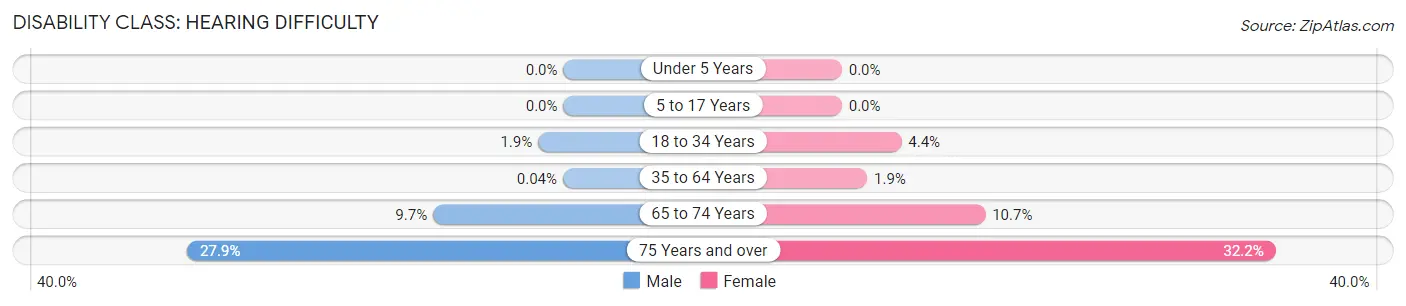
| Age Bracket | Male | Female |
| Under 5 Years | 0 (0.0%) | 0 (0.0%) |
| 5 to 17 Years | 0 (0.0%) | 0 (0.0%) |
| 18 to 34 Years | 18 (1.9%) | 77 (4.4%) |
| 35 to 64 Years | 1 (0.0%) | 43 (1.9%) |
| 65 to 74 Years | 60 (9.7%) | 66 (10.6%) |
| 75 Years and over | 107 (27.9%) | 209 (32.2%) |
Disability Class: Vision Difficulty
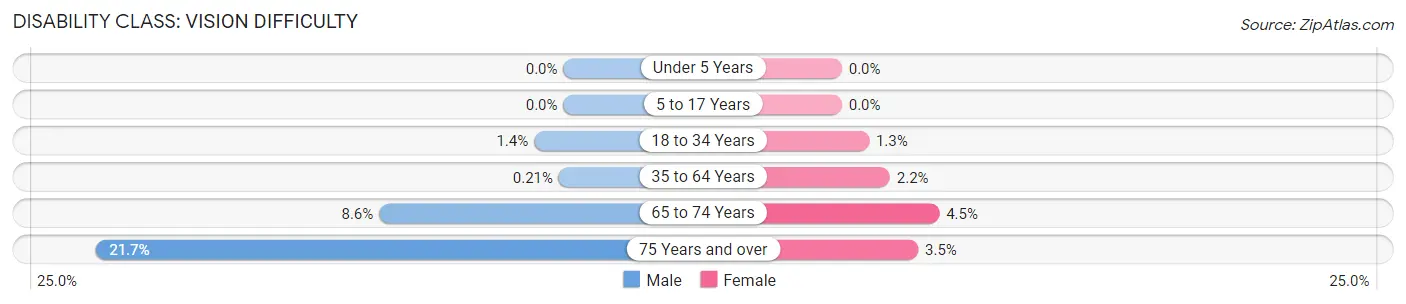
| Age Bracket | Male | Female |
| Under 5 Years | 0 (0.0%) | 0 (0.0%) |
| 5 to 17 Years | 0 (0.0%) | 0 (0.0%) |
| 18 to 34 Years | 13 (1.4%) | 22 (1.3%) |
| 35 to 64 Years | 5 (0.2%) | 51 (2.2%) |
| 65 to 74 Years | 53 (8.6%) | 28 (4.5%) |
| 75 Years and over | 83 (21.7%) | 23 (3.5%) |
Disability Class: Cognitive Difficulty
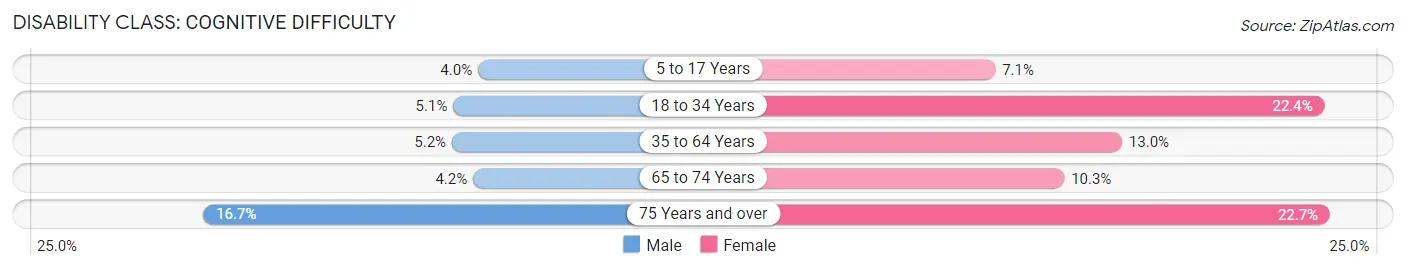
| Age Bracket | Male | Female |
| 5 to 17 Years | 27 (4.0%) | 102 (7.1%) |
| 18 to 34 Years | 49 (5.1%) | 390 (22.4%) |
| 35 to 64 Years | 124 (5.2%) | 298 (13.0%) |
| 65 to 74 Years | 26 (4.2%) | 64 (10.3%) |
| 75 Years and over | 64 (16.7%) | 147 (22.7%) |
Disability Class: Ambulatory Difficulty
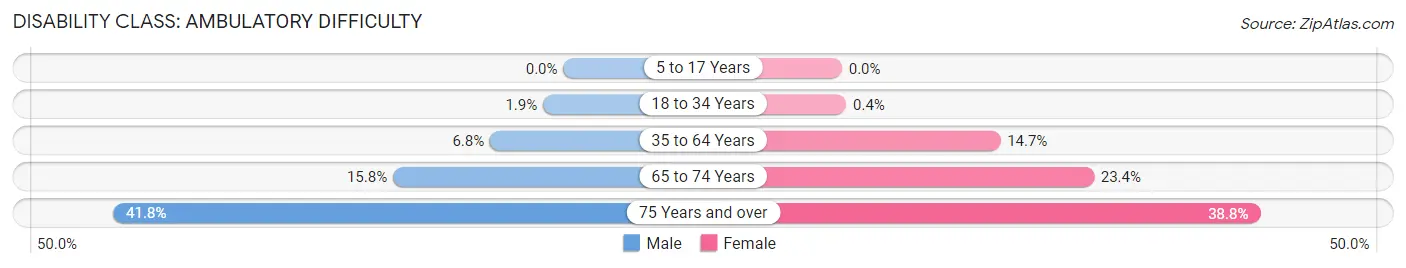
| Age Bracket | Male | Female |
| 5 to 17 Years | 0 (0.0%) | 0 (0.0%) |
| 18 to 34 Years | 18 (1.9%) | 7 (0.4%) |
| 35 to 64 Years | 163 (6.8%) | 337 (14.7%) |
| 65 to 74 Years | 98 (15.8%) | 145 (23.4%) |
| 75 Years and over | 160 (41.8%) | 252 (38.8%) |
Disability Class: Self-Care Difficulty
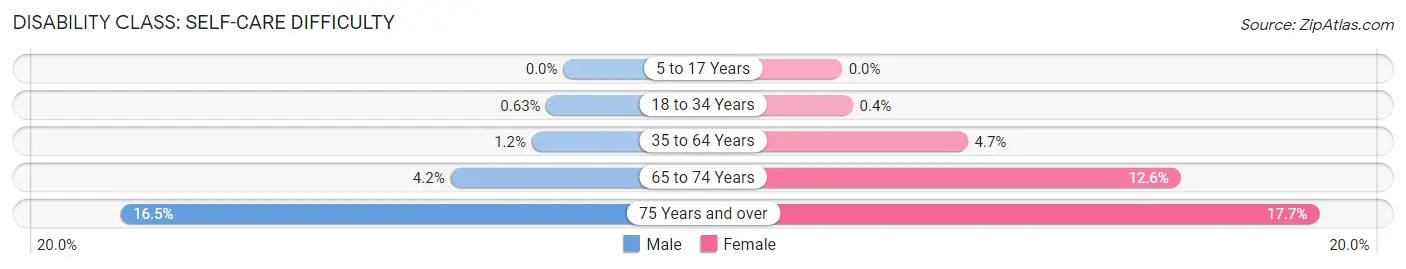
| Age Bracket | Male | Female |
| 5 to 17 Years | 0 (0.0%) | 0 (0.0%) |
| 18 to 34 Years | 6 (0.6%) | 7 (0.4%) |
| 35 to 64 Years | 28 (1.2%) | 107 (4.7%) |
| 65 to 74 Years | 26 (4.2%) | 78 (12.6%) |
| 75 Years and over | 63 (16.5%) | 115 (17.7%) |
Technology Access in Pottsville
Computing Device Access in Pottsville
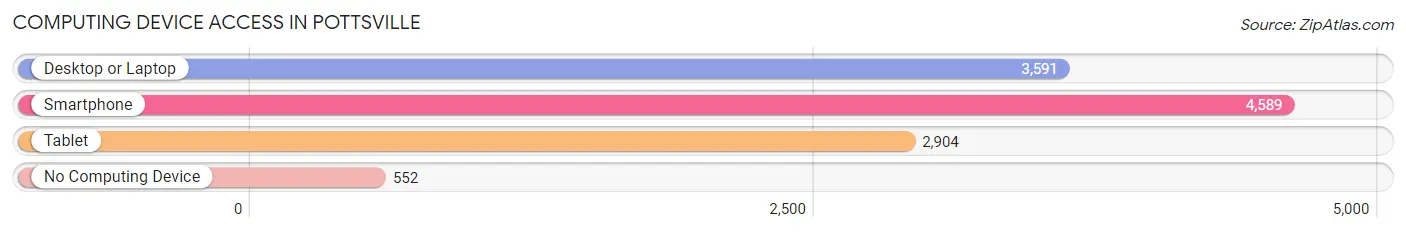
| Device Type | # Households | % Households |
| Desktop or Laptop | 3,591 | 63.5% |
| Smartphone | 4,589 | 81.1% |
| Tablet | 2,904 | 51.3% |
| No Computing Device | 552 | 9.8% |
| Total | 5,655 | 100.0% |
Internet Access in Pottsville
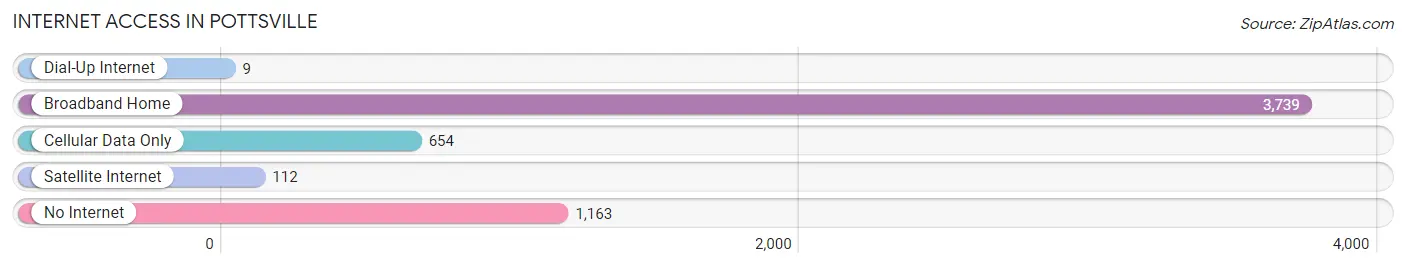
| Internet Type | # Households | % Households |
| Dial-Up Internet | 9 | 0.2% |
| Broadband Home | 3,739 | 66.1% |
| Cellular Data Only | 654 | 11.6% |
| Satellite Internet | 112 | 2.0% |
| No Internet | 1,163 | 20.6% |
| Total | 5,655 | 100.0% |
Pottsville Summary
Pottsville, Pennsylvania is a city located in Schuylkill County, Pennsylvania. It is the county seat of Schuylkill County and is located in the southeastern part of the state. The city is situated in the anthracite coal region of the state and is the largest city in Schuylkill County. The population of Pottsville was 14,324 at the 2010 census.
History
Pottsville was founded in 1806 by John Pott, a Welsh immigrant. The city was named after him and was incorporated as a borough in 1828. The city was an important center of the coal mining industry in the 19th century and was the site of the first commercially successful anthracite coal mine in the United States. The city was also the site of the first brewery in the United States, the Yuengling Brewery, which is still in operation today.
Geography
Pottsville is located in the southeastern part of Pennsylvania, in Schuylkill County. It is situated in the anthracite coal region of the state and is the largest city in Schuylkill County. The city is located at the confluence of the Schuylkill River and the Little Schuylkill River. The city has a total area of 4.2 square miles, all of which is land.
Economy
Pottsville’s economy is largely based on the coal mining industry. The city is home to several coal mines, including the Reading Anthracite Company, which is the largest coal mining company in the United States. The city is also home to the Yuengling Brewery, which is the oldest brewery in the United States. The brewery is a major employer in the city and produces a variety of beers. The city is also home to several other businesses, including manufacturing, retail, and healthcare.
Demographics
As of the 2010 census, the population of Pottsville was 14,324. The racial makeup of the city was 94.3% White, 2.7% African American, 0.2% Native American, 0.7% Asian, 0.1% Pacific Islander, 0.7% from other races, and 1.4% from two or more races. Hispanic or Latino of any race were 2.3% of the population. The median income for a household in the city was $35,945 and the median income for a family was $45,945. The per capita income for the city was $19,945.
Conclusion
Pottsville, Pennsylvania is a city located in Schuylkill County, Pennsylvania. It is the county seat of Schuylkill County and is located in the southeastern part of the state. The city is situated in the anthracite coal region of the state and is the largest city in Schuylkill County. The city was founded in 1806 by John Pott, a Welsh immigrant, and was incorporated as a borough in 1828. The city’s economy is largely based on the coal mining industry and the Yuengling Brewery, which is the oldest brewery in the United States. As of the 2010 census, the population of Pottsville was 14,324. The racial makeup of the city was 94.3% White, 2.7% African American, 0.2% Native American, 0.7% Asian, 0.1% Pacific Islander, 0.7% from other races, and 1.4% from two or more races. The median income for a household in the city was $35,945 and the median income for a family was $45,945.
Common Questions
What is Per Capita Income in Pottsville?
Per Capita income in Pottsville is $27,200.
What is the Median Family Income in Pottsville?
Median Family Income in Pottsville is $57,934.
What is the Median Household income in Pottsville?
Median Household Income in Pottsville is $46,081.
What is Income or Wage Gap in Pottsville?
Income or Wage Gap in Pottsville is 37.5%.
Women in Pottsville earn 62.5 cents for every dollar earned by a man.
What is Family Income Deficit in Pottsville?
Family Income Deficit in Pottsville is $11,086.
Families that are below poverty line in Pottsville earn $11,086 less on average than the poverty threshold level.
What is Inequality or Gini Index in Pottsville?
Inequality or Gini Index in Pottsville is 0.45.
What is the Total Population of Pottsville?
Total Population of Pottsville is 13,386.
What is the Total Male Population of Pottsville?
Total Male Population of Pottsville is 5,914.
What is the Total Female Population of Pottsville?
Total Female Population of Pottsville is 7,472.
What is the Ratio of Males per 100 Females in Pottsville?
There are 79.15 Males per 100 Females in Pottsville.
What is the Ratio of Females per 100 Males in Pottsville?
There are 126.34 Females per 100 Males in Pottsville.
What is the Median Population Age in Pottsville?
Median Population Age in Pottsville is 39.6 Years.
What is the Average Family Size in Pottsville
Average Family Size in Pottsville is 2.9 People.
What is the Average Household Size in Pottsville
Average Household Size in Pottsville is 2.2 People.
How Large is the Labor Force in Pottsville?
There are 6,594 People in the Labor Forcein in Pottsville.
What is the Percentage of People in the Labor Force in Pottsville?
61.7% of People are in the Labor Force in Pottsville.
What is the Unemployment Rate in Pottsville?
Unemployment Rate in Pottsville is 9.5%.