Penns Creek, PA Map & Demographics
Penns Creek Map
Penns Creek Overview
$20,238
PER CAPITA INCOME
$44,868
AVG FAMILY INCOME
$48,145
AVG HOUSEHOLD INCOME
$4,833
FAMILY INCOME DEFICIT
0.34
INEQUALITY / GINI INDEX
794
TOTAL POPULATION
383
MALE POPULATION
411
FEMALE POPULATION
93.19
MALES / 100 FEMALES
107.31
FEMALES / 100 MALES
39.3
MEDIAN AGE
2.8
AVG FAMILY SIZE
2.6
AVG HOUSEHOLD SIZE
412
LABOR FORCE [ PEOPLE ]
59.9%
PERCENT IN LABOR FORCE
7.5%
UNEMPLOYMENT RATE
Penns Creek Zip Codes
Penns Creek Area Codes
Income in Penns Creek
Income Overview in Penns Creek
Per Capita Income in Penns Creek is $20,238, while median incomes of families and households are $44,868 and $48,145 respectively.
| Characteristic | Number | Measure |
| Per Capita Income | 794 | $20,238 |
| Median Family Income | 226 | $44,868 |
| Mean Family Income | 226 | $60,808 |
| Median Household Income | 272 | $48,145 |
| Mean Household Income | 272 | $58,272 |
| Income Deficit | 226 | $4,833 |
| Wage / Income Gap (%) | 794 | 0.00% |
| Wage / Income Gap ($) | 794 | 100.00¢ per $1 |
| Gini / Inequality Index | 794 | 0.34 |
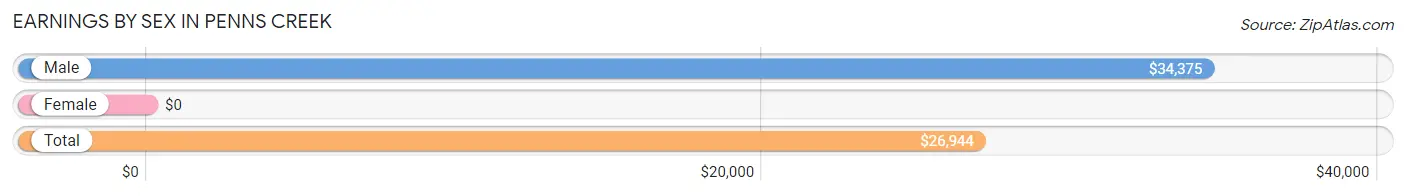
Earnings by Sex in Penns Creek
| Sex | Number | Average Earnings |
| Male | 218 (53.4%) | $34,375 |
| Female | 190 (46.6%) | $0 |
| Total | 408 (100.0%) | $26,944 |
Earnings by Sex by Income Bracket in Penns Creek
The most common earnings brackets in Penns Creek are $2,500 to $4,999 for men (28 | 12.8%) and $30,000 to $34,999 for women (42 | 22.1%).

| Income | Male | Female |
| $2,499 or less | 7 (3.2%) | 10 (5.3%) |
| $2,500 to $4,999 | 28 (12.8%) | 10 (5.3%) |
| $5,000 to $7,499 | 12 (5.5%) | 26 (13.7%) |
| $7,500 to $9,999 | 0 (0.0%) | 23 (12.1%) |
| $10,000 to $12,499 | 1 (0.5%) | 15 (7.9%) |
| $12,500 to $14,999 | 8 (3.7%) | 16 (8.4%) |
| $15,000 to $17,499 | 6 (2.8%) | 0 (0.0%) |
| $17,500 to $19,999 | 15 (6.9%) | 0 (0.0%) |
| $20,000 to $22,499 | 0 (0.0%) | 0 (0.0%) |
| $22,500 to $24,999 | 9 (4.1%) | 11 (5.8%) |
| $25,000 to $29,999 | 9 (4.1%) | 3 (1.6%) |
| $30,000 to $34,999 | 17 (7.8%) | 42 (22.1%) |
| $35,000 to $39,999 | 9 (4.1%) | 5 (2.6%) |
| $40,000 to $44,999 | 26 (11.9%) | 13 (6.8%) |
| $45,000 to $49,999 | 5 (2.3%) | 0 (0.0%) |
| $50,000 to $54,999 | 18 (8.3%) | 0 (0.0%) |
| $55,000 to $64,999 | 24 (11.0%) | 16 (8.4%) |
| $65,000 to $74,999 | 3 (1.4%) | 0 (0.0%) |
| $75,000 to $99,999 | 5 (2.3%) | 0 (0.0%) |
| $100,000+ | 16 (7.3%) | 0 (0.0%) |
| Total | 218 (100.0%) | 190 (100.0%) |
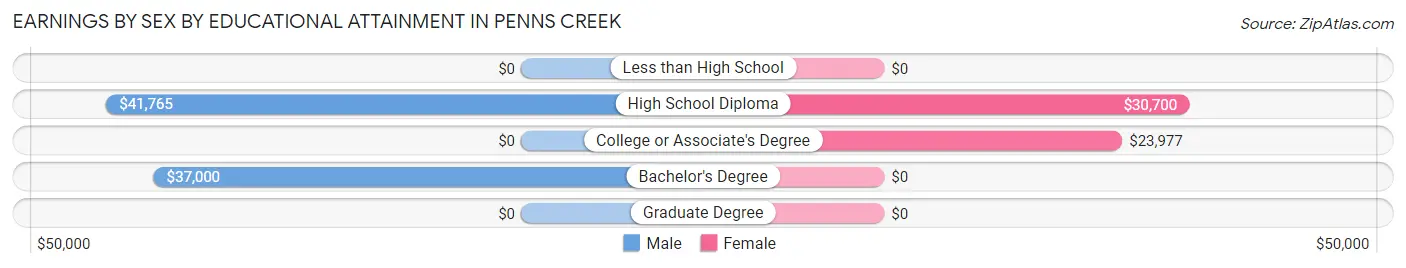
Earnings by Sex by Educational Attainment in Penns Creek
Average earnings in Penns Creek are $42,279 for men and $30,298 for women, a difference of 28.3%. Men with an educational attainment of high school diploma enjoy the highest average annual earnings of $41,765, while those with bachelor's degree education earn the least with $37,000. Women with an educational attainment of high school diploma earn the most with the average annual earnings of $30,700, while those with college or associate's degree education have the smallest earnings of $23,977.
| Educational Attainment | Male Income | Female Income |
| Less than High School | - | - |
| High School Diploma | $41,765 | $30,700 |
| College or Associate's Degree | - | - |
| Bachelor's Degree | $37,000 | $0 |
| Graduate Degree | - | - |
| Total | $42,279 | $30,298 |
Family Income in Penns Creek
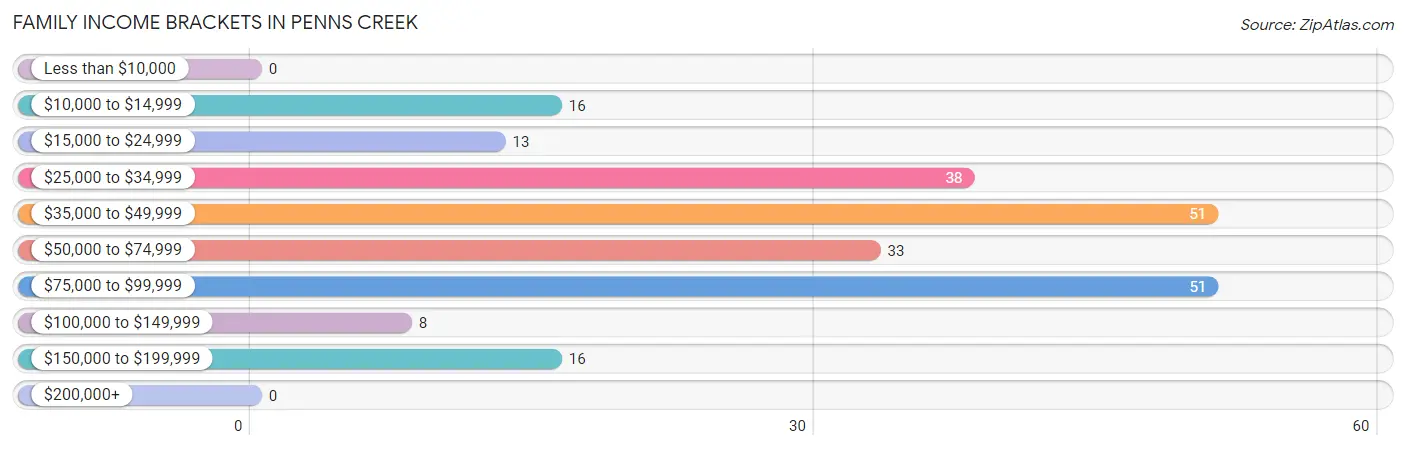
Family Income Brackets in Penns Creek
According to the Penns Creek family income data, there are 51 families falling into the $35,000 to $49,999 income range, which is the most common income bracket and makes up 22.6% of all families.
| Income Bracket | # Families | % Families |
| Less than $10,000 | 0 | 0.0% |
| $10,000 to $14,999 | 16 | 7.1% |
| $15,000 to $24,999 | 13 | 5.8% |
| $25,000 to $34,999 | 38 | 16.8% |
| $35,000 to $49,999 | 51 | 22.6% |
| $50,000 to $74,999 | 33 | 14.6% |
| $75,000 to $99,999 | 51 | 22.6% |
| $100,000 to $149,999 | 8 | 3.5% |
| $150,000 to $199,999 | 16 | 7.1% |
| $200,000+ | 0 | 0.0% |
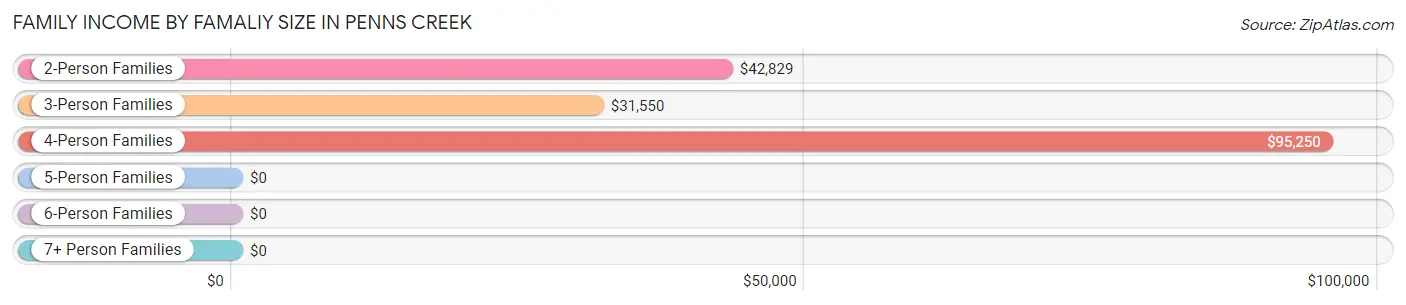
Family Income by Famaliy Size in Penns Creek
4-person families (47 | 20.8%) account for the highest median family income in Penns Creek with $95,250 per family, while 4-person families (47 | 20.8%) have the highest median income of $23,812 per family member.
| Income Bracket | # Families | Median Income |
| 2-Person Families | 135 (59.7%) | $42,829 |
| 3-Person Families | 31 (13.7%) | $31,550 |
| 4-Person Families | 47 (20.8%) | $95,250 |
| 5-Person Families | 8 (3.5%) | $0 |
| 6-Person Families | 5 (2.2%) | $0 |
| 7+ Person Families | 0 (0.0%) | $0 |
| Total | 226 (100.0%) | $44,868 |
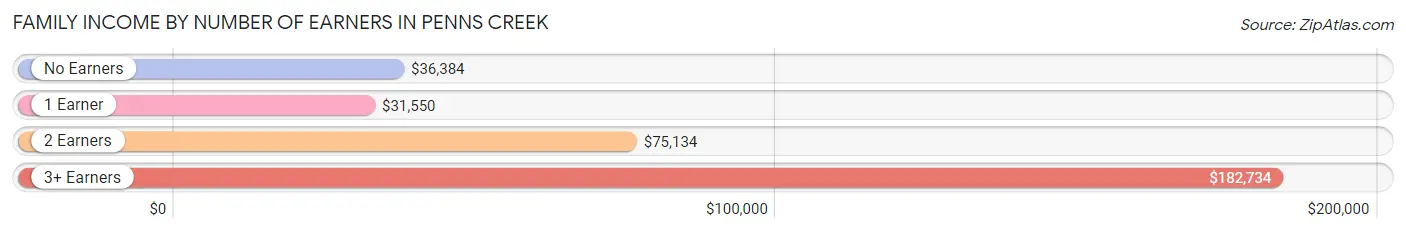
Family Income by Number of Earners in Penns Creek
The median family income in Penns Creek is $44,868, with families comprising 3+ earners (29) having the highest median family income of $182,734, while families with 1 earner (65) have the lowest median family income of $31,550, accounting for 12.8% and 28.8% of families, respectively.
| Number of Earners | # Families | Median Income |
| No Earners | 53 (23.4%) | $36,384 |
| 1 Earner | 65 (28.8%) | $31,550 |
| 2 Earners | 79 (35.0%) | $75,134 |
| 3+ Earners | 29 (12.8%) | $182,734 |
| Total | 226 (100.0%) | $44,868 |
Household Income in Penns Creek
Household Income Brackets in Penns Creek
With 82 households falling in the category, the $35,000 to $49,999 income range is the most frequent in Penns Creek, accounting for 30.1% of all households.
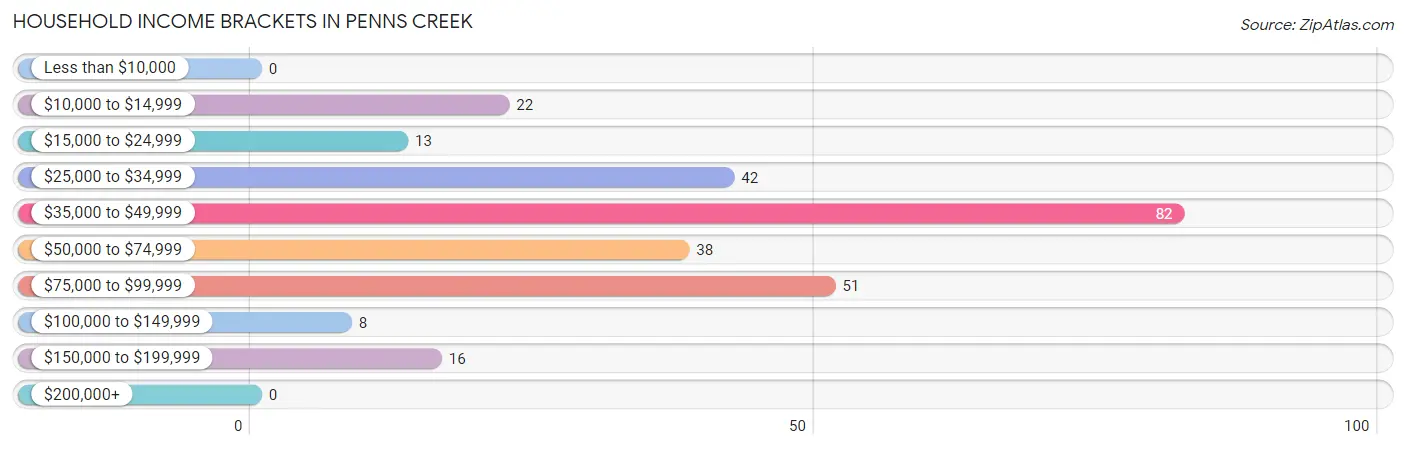
| Income Bracket | # Households | % Households |
| Less than $10,000 | 0 | 0.0% |
| $10,000 to $14,999 | 22 | 8.1% |
| $15,000 to $24,999 | 13 | 4.8% |
| $25,000 to $34,999 | 42 | 15.4% |
| $35,000 to $49,999 | 82 | 30.1% |
| $50,000 to $74,999 | 38 | 14.0% |
| $75,000 to $99,999 | 51 | 18.8% |
| $100,000 to $149,999 | 8 | 2.9% |
| $150,000 to $199,999 | 16 | 5.9% |
| $200,000+ | 0 | 0.0% |
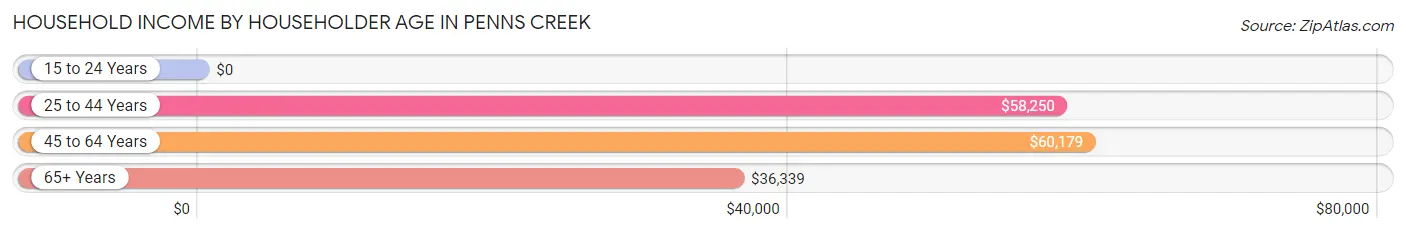
Household Income by Householder Age in Penns Creek
The median household income in Penns Creek is $48,145, with the highest median household income of $60,179 found in the 45 to 64 years age bracket for the primary householder. A total of 114 households (41.9%) fall into this category. Meanwhile, the 15 to 24 years age bracket for the primary householder has the lowest median household income of $0, with 5 households (1.8%) in this group.
| Income Bracket | # Households | Median Income |
| 15 to 24 Years | 5 (1.8%) | $0 |
| 25 to 44 Years | 89 (32.7%) | $58,250 |
| 45 to 64 Years | 114 (41.9%) | $60,179 |
| 65+ Years | 64 (23.5%) | $36,339 |
| Total | 272 (100.0%) | $48,145 |
Poverty in Penns Creek
Income Below Poverty by Sex and Age in Penns Creek
With 13.6% poverty level for males and 13.7% for females among the residents of Penns Creek, under 5 year old males and 45 to 54 year old females are the most vulnerable to poverty, with 4 males (100.0%) and 31 females (59.6%) in their respective age groups living below the poverty level.
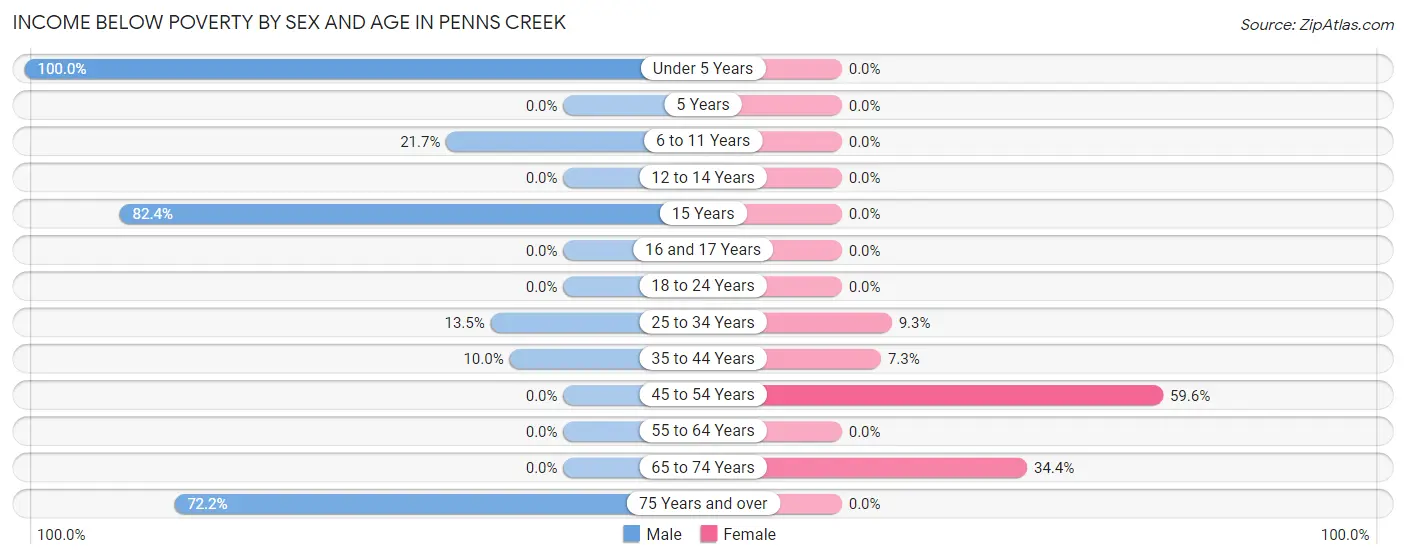
| Age Bracket | Male | Female |
| Under 5 Years | 4 (100.0%) | 0 (0.0%) |
| 5 Years | 0 (0.0%) | 0 (0.0%) |
| 6 to 11 Years | 5 (21.7%) | 0 (0.0%) |
| 12 to 14 Years | 0 (0.0%) | 0 (0.0%) |
| 15 Years | 14 (82.4%) | 0 (0.0%) |
| 16 and 17 Years | 0 (0.0%) | 0 (0.0%) |
| 18 to 24 Years | 0 (0.0%) | 0 (0.0%) |
| 25 to 34 Years | 5 (13.5%) | 5 (9.3%) |
| 35 to 44 Years | 5 (10.0%) | 4 (7.3%) |
| 45 to 54 Years | 0 (0.0%) | 31 (59.6%) |
| 55 to 64 Years | 0 (0.0%) | 0 (0.0%) |
| 65 to 74 Years | 0 (0.0%) | 11 (34.4%) |
| 75 Years and over | 13 (72.2%) | 0 (0.0%) |
| Total | 46 (13.6%) | 51 (13.7%) |
Income Above Poverty by Sex and Age in Penns Creek
According to the poverty statistics in Penns Creek, males aged 5 years and females aged under 5 years are the age groups that are most secure financially, with 100.0% of males and 100.0% of females in these age groups living above the poverty line.
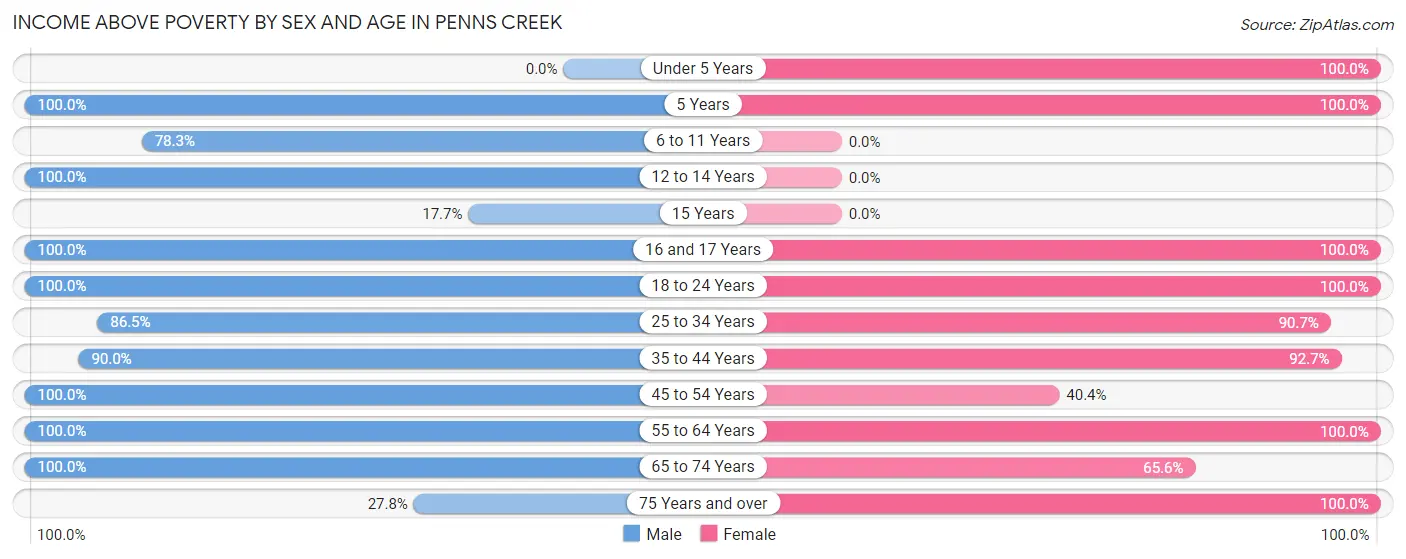
| Age Bracket | Male | Female |
| Under 5 Years | 0 (0.0%) | 21 (100.0%) |
| 5 Years | 4 (100.0%) | 13 (100.0%) |
| 6 to 11 Years | 18 (78.3%) | 0 (0.0%) |
| 12 to 14 Years | 24 (100.0%) | 0 (0.0%) |
| 15 Years | 3 (17.6%) | 0 (0.0%) |
| 16 and 17 Years | 12 (100.0%) | 5 (100.0%) |
| 18 to 24 Years | 28 (100.0%) | 48 (100.0%) |
| 25 to 34 Years | 32 (86.5%) | 49 (90.7%) |
| 35 to 44 Years | 45 (90.0%) | 51 (92.7%) |
| 45 to 54 Years | 22 (100.0%) | 21 (40.4%) |
| 55 to 64 Years | 55 (100.0%) | 64 (100.0%) |
| 65 to 74 Years | 44 (100.0%) | 21 (65.6%) |
| 75 Years and over | 5 (27.8%) | 28 (100.0%) |
| Total | 292 (86.4%) | 321 (86.3%) |
Income Below Poverty Among Married-Couple Families in Penns Creek
The poverty statistics for married-couple families in Penns Creek show that 11.4% or 21 of the total 184 families live below the poverty line. Families with 1 or 2 children have the highest poverty rate of 21.7%, comprising of 5 families. On the other hand, families with 3 or 4 children have the lowest poverty rate of 0.0%, which includes 0 families.
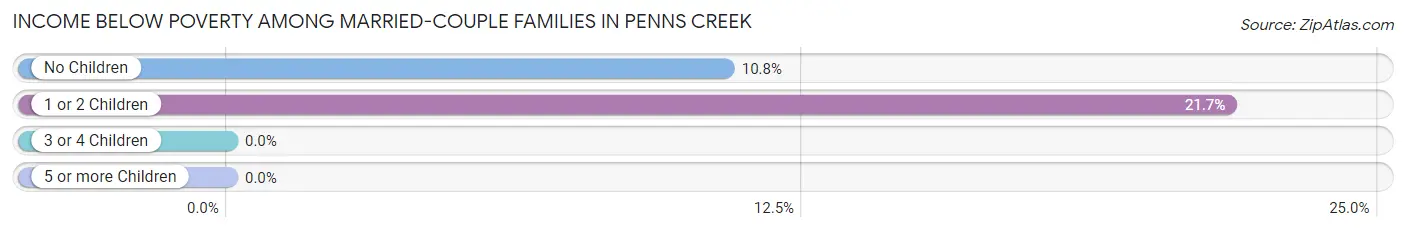
| Children | Above Poverty | Below Poverty |
| No Children | 132 (89.2%) | 16 (10.8%) |
| 1 or 2 Children | 18 (78.3%) | 5 (21.7%) |
| 3 or 4 Children | 13 (100.0%) | 0 (0.0%) |
| 5 or more Children | 0 (0.0%) | 0 (0.0%) |
| Total | 163 (88.6%) | 21 (11.4%) |
Income Below Poverty Among Single-Parent Households in Penns Creek
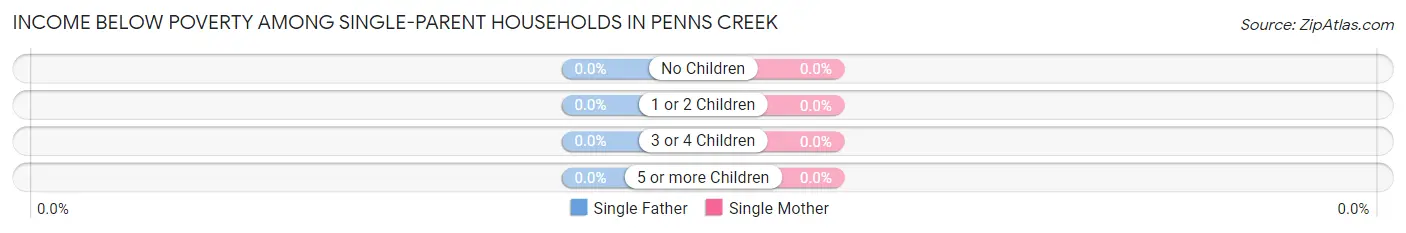
| Children | Single Father | Single Mother |
| No Children | 0 (0.0%) | 0 (0.0%) |
| 1 or 2 Children | 0 (0.0%) | 0 (0.0%) |
| 3 or 4 Children | 0 (0.0%) | 0 (0.0%) |
| 5 or more Children | 0 (0.0%) | 0 (0.0%) |
| Total | 0 (0.0%) | 0 (0.0%) |
Income Below Poverty Among Married-Couple vs Single-Parent Households in Penns Creek
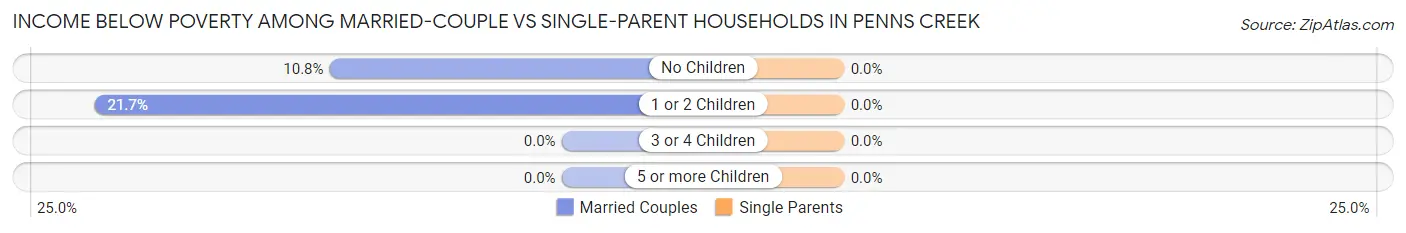
| Children | Married-Couple Families | Single-Parent Households |
| No Children | 16 (10.8%) | 0 (0.0%) |
| 1 or 2 Children | 5 (21.7%) | 0 (0.0%) |
| 3 or 4 Children | 0 (0.0%) | 0 (0.0%) |
| 5 or more Children | 0 (0.0%) | 0 (0.0%) |
| Total | 21 (11.4%) | 0 (0.0%) |
Race in Penns Creek
The most populous races in Penns Creek are White / Caucasian (671 | 84.5%), Hispanic or Latino (90 | 11.3%), and Two or more Races (85 | 10.7%).
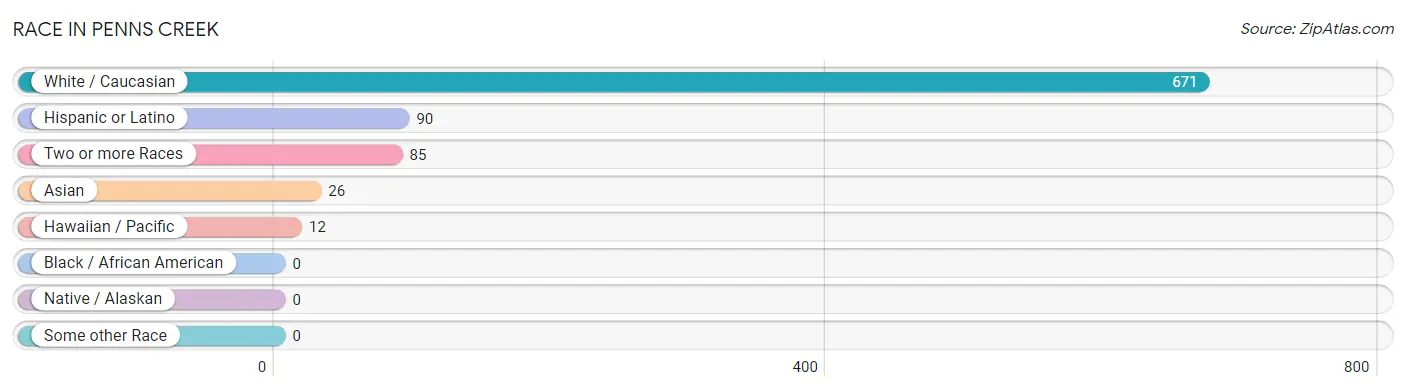
| Race | # Population | % Population |
| Asian | 26 | 3.3% |
| Black / African American | 0 | 0.0% |
| Hawaiian / Pacific | 12 | 1.5% |
| Hispanic or Latino | 90 | 11.3% |
| Native / Alaskan | 0 | 0.0% |
| White / Caucasian | 671 | 84.5% |
| Two or more Races | 85 | 10.7% |
| Some other Race | 0 | 0.0% |
| Total | 794 | 100.0% |
Ancestry in Penns Creek
The most populous ancestries reported in Penns Creek are German (222 | 28.0%), American (72 | 9.1%), Puerto Rican (48 | 6.0%), Irish (42 | 5.3%), and English (36 | 4.5%), together accounting for 52.9% of all Penns Creek residents.
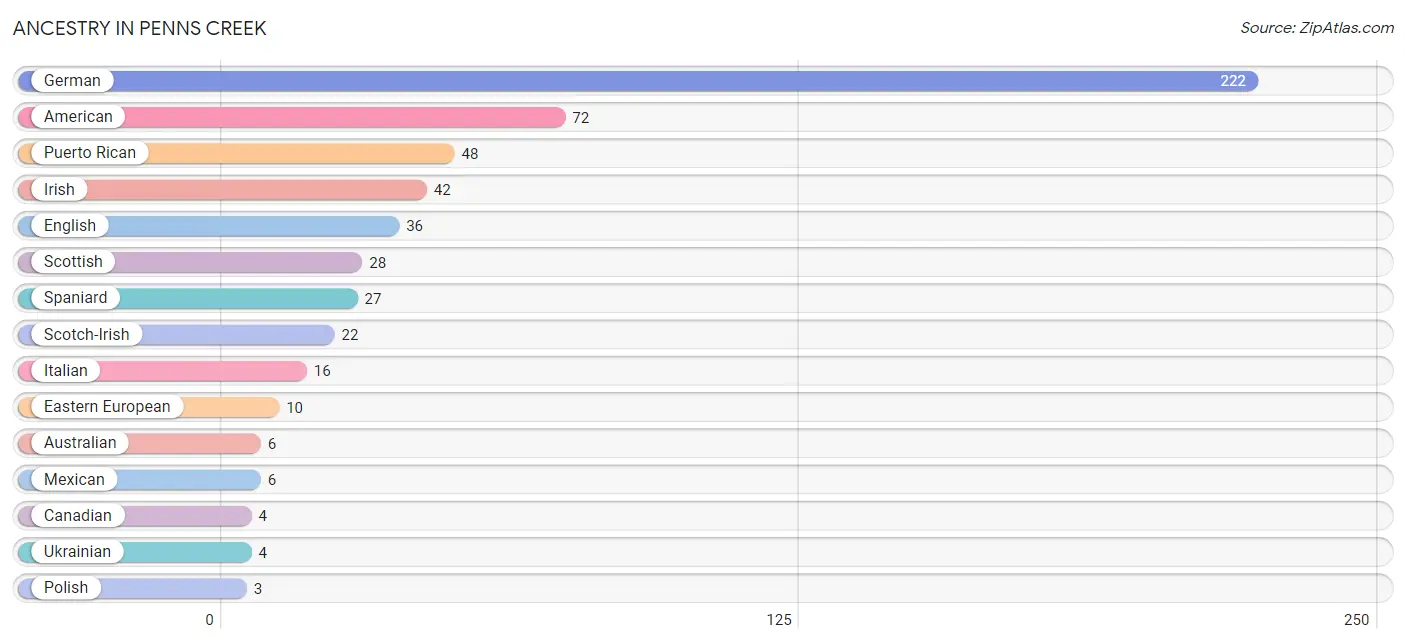
| Ancestry | # Population | % Population |
| American | 72 | 9.1% |
| Australian | 6 | 0.8% |
| Canadian | 4 | 0.5% |
| Eastern European | 10 | 1.3% |
| English | 36 | 4.5% |
| German | 222 | 28.0% |
| Irish | 42 | 5.3% |
| Italian | 16 | 2.0% |
| Mexican | 6 | 0.8% |
| Polish | 3 | 0.4% |
| Puerto Rican | 48 | 6.0% |
| Scotch-Irish | 22 | 2.8% |
| Scottish | 28 | 3.5% |
| Spaniard | 27 | 3.4% |
| Ukrainian | 4 | 0.5% | View All 15 Rows |
Immigrants in Penns Creek
The most numerous immigrant groups reported in Penns Creek came from Oceania (21 | 2.6%), Asia (17 | 2.1%), Pakistan (12 | 1.5%), South Central Asia (12 | 1.5%), and China (5 | 0.6%), together accounting for 8.4% of all Penns Creek residents.
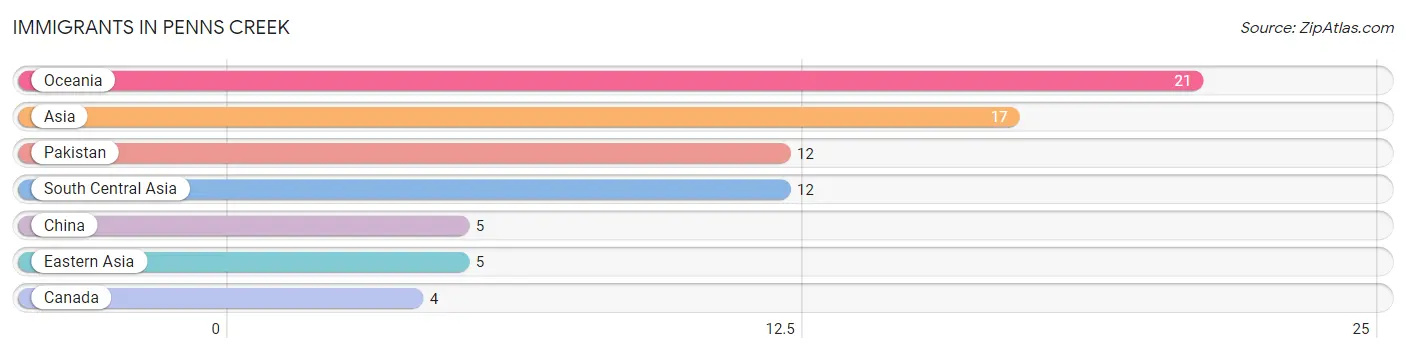
| Immigration Origin | # Population | % Population |
| Asia | 17 | 2.1% |
| Canada | 4 | 0.5% |
| China | 5 | 0.6% |
| Eastern Asia | 5 | 0.6% |
| Oceania | 21 | 2.6% |
| Pakistan | 12 | 1.5% |
| South Central Asia | 12 | 1.5% | View All 7 Rows |
Sex and Age in Penns Creek
Sex and Age in Penns Creek
The most populous age groups in Penns Creek are 15 to 19 Years (57 | 14.9%) for men and 60 to 64 Years (54 | 13.1%) for women.
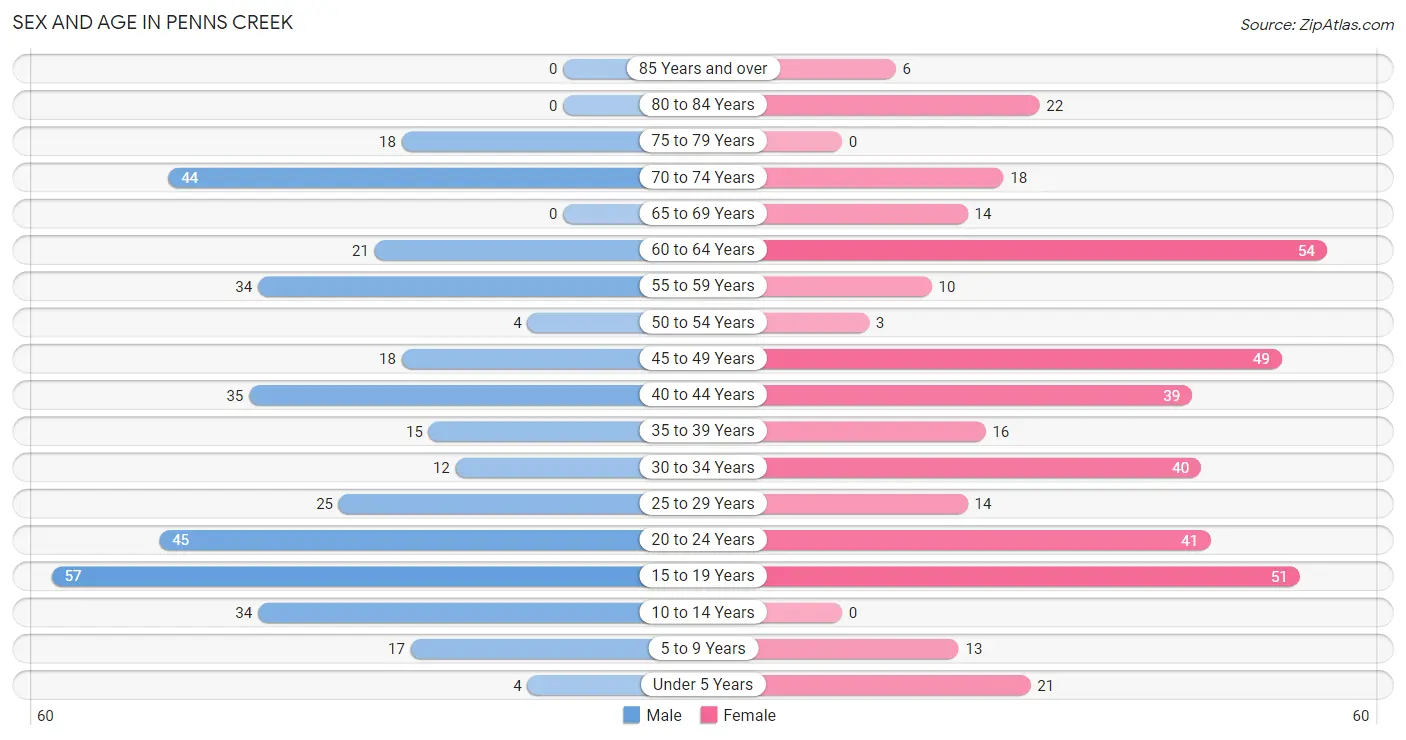
| Age Bracket | Male | Female |
| Under 5 Years | 4 (1.0%) | 21 (5.1%) |
| 5 to 9 Years | 17 (4.4%) | 13 (3.2%) |
| 10 to 14 Years | 34 (8.9%) | 0 (0.0%) |
| 15 to 19 Years | 57 (14.9%) | 51 (12.4%) |
| 20 to 24 Years | 45 (11.7%) | 41 (10.0%) |
| 25 to 29 Years | 25 (6.5%) | 14 (3.4%) |
| 30 to 34 Years | 12 (3.1%) | 40 (9.7%) |
| 35 to 39 Years | 15 (3.9%) | 16 (3.9%) |
| 40 to 44 Years | 35 (9.1%) | 39 (9.5%) |
| 45 to 49 Years | 18 (4.7%) | 49 (11.9%) |
| 50 to 54 Years | 4 (1.0%) | 3 (0.7%) |
| 55 to 59 Years | 34 (8.9%) | 10 (2.4%) |
| 60 to 64 Years | 21 (5.5%) | 54 (13.1%) |
| 65 to 69 Years | 0 (0.0%) | 14 (3.4%) |
| 70 to 74 Years | 44 (11.5%) | 18 (4.4%) |
| 75 to 79 Years | 18 (4.7%) | 0 (0.0%) |
| 80 to 84 Years | 0 (0.0%) | 22 (5.3%) |
| 85 Years and over | 0 (0.0%) | 6 (1.5%) |
| Total | 383 (100.0%) | 411 (100.0%) |
Families and Households in Penns Creek
Median Family Size in Penns Creek
The median family size in Penns Creek is 2.78 persons per family, with single female/mother families (25 | 11.1%) accounting for the largest median family size of 3.08 persons per family. On the other hand, single male/father families (17 | 7.5%) represent the smallest median family size with 2.29 persons per family.
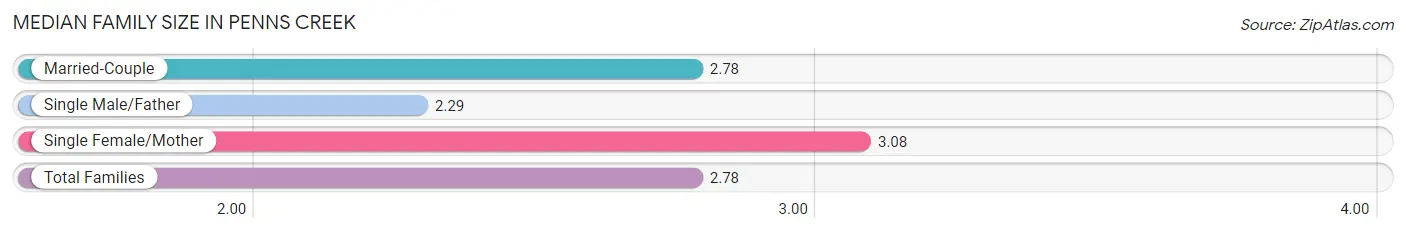
| Family Type | # Families | Family Size |
| Married-Couple | 184 (81.4%) | 2.78 |
| Single Male/Father | 17 (7.5%) | 2.29 |
| Single Female/Mother | 25 (11.1%) | 3.08 |
| Total Families | 226 (100.0%) | 2.78 |
Median Household Size in Penns Creek
The median household size in Penns Creek is 2.61 persons per household, with single female/mother households (25 | 9.2%) accounting for the largest median household size of 3.64 persons per household. non-family households (46 | 16.9%) represent the smallest median household size with 1.48 persons per household.
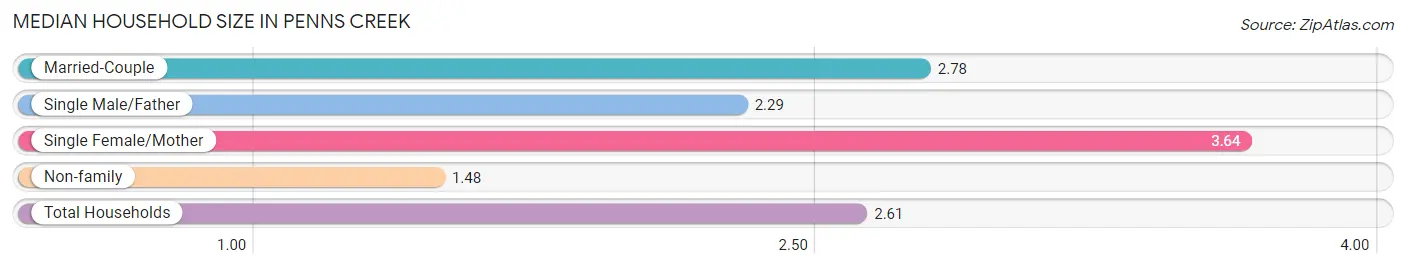
| Household Type | # Households | Household Size |
| Married-Couple | 184 (67.6%) | 2.78 |
| Single Male/Father | 17 (6.2%) | 2.29 |
| Single Female/Mother | 25 (9.2%) | 3.64 |
| Non-family | 46 (16.9%) | 1.48 |
| Total Households | 272 (100.0%) | 2.61 |
Household Size by Marriage Status in Penns Creek
Out of a total of 272 households in Penns Creek, 226 (83.1%) are family households, while 46 (16.9%) are nonfamily households. The most numerous type of family households are 2-person households, comprising 135, and the most common type of nonfamily households are 2-person households, comprising 36.
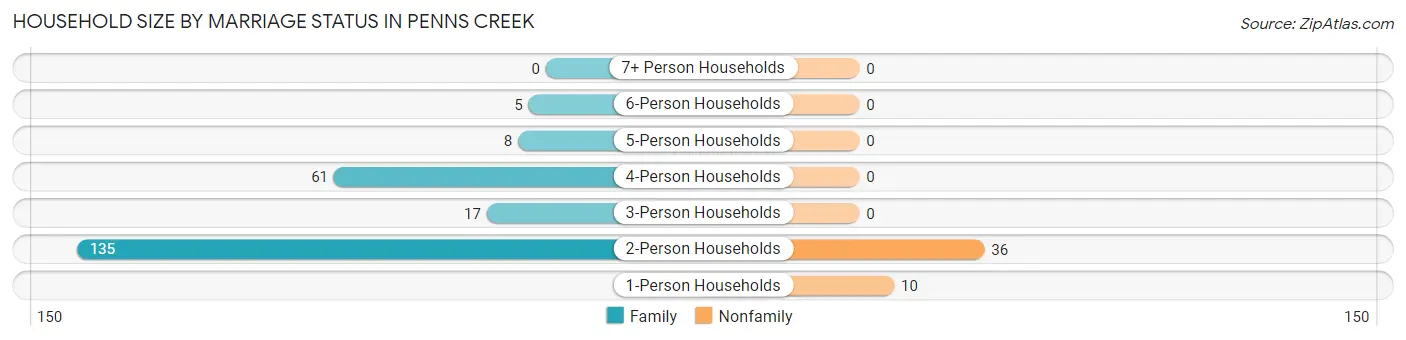
| Household Size | Family Households | Nonfamily Households |
| 1-Person Households | - | 10 (3.7%) |
| 2-Person Households | 135 (49.6%) | 36 (13.2%) |
| 3-Person Households | 17 (6.2%) | 0 (0.0%) |
| 4-Person Households | 61 (22.4%) | 0 (0.0%) |
| 5-Person Households | 8 (2.9%) | 0 (0.0%) |
| 6-Person Households | 5 (1.8%) | 0 (0.0%) |
| 7+ Person Households | 0 (0.0%) | 0 (0.0%) |
| Total | 226 (83.1%) | 46 (16.9%) |
Female Fertility in Penns Creek
Fertility by Age in Penns Creek
Average fertility rate in Penns Creek is 16.0 births per 1,000 women. Women in the age bracket of 35 to 50 years have the highest fertility rate with 38.0 births per 1,000 women. Women in the age bracket of 35 to 50 years acount for 100.0% of all women with births.
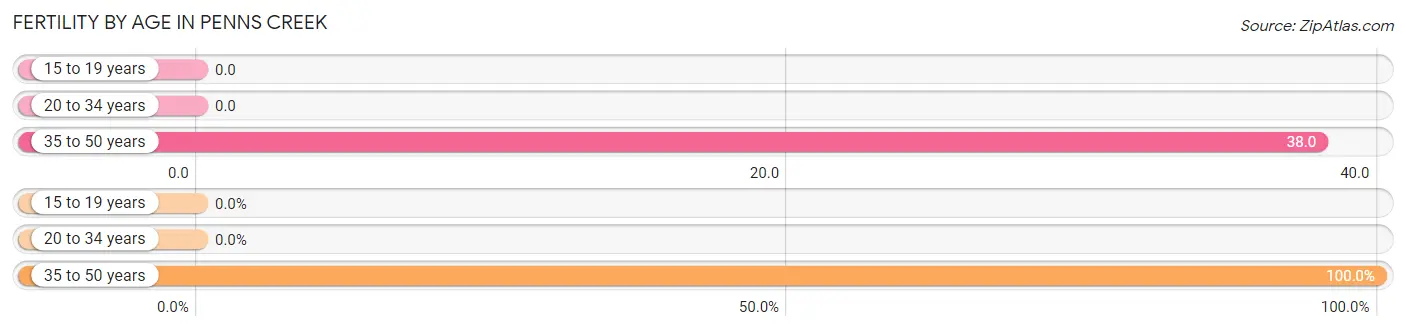
| Age Bracket | Women with Births | Births / 1,000 Women |
| 15 to 19 years | 0 (0.0%) | 0.0 |
| 20 to 34 years | 0 (0.0%) | 0.0 |
| 35 to 50 years | 4 (100.0%) | 38.0 |
| Total | 4 (100.0%) | 16.0 |
Fertility by Age by Marriage Status in Penns Creek
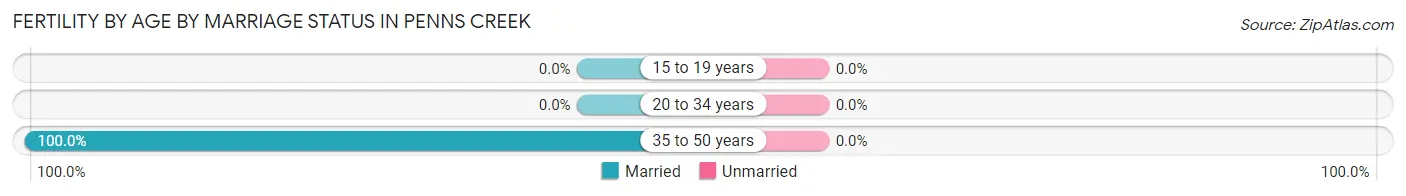
| Age Bracket | Married | Unmarried |
| 15 to 19 years | 0 (0.0%) | 0 (0.0%) |
| 20 to 34 years | 0 (0.0%) | 0 (0.0%) |
| 35 to 50 years | 4 (100.0%) | 0 (0.0%) |
| Total | 4 (100.0%) | 0 (0.0%) |
Fertility by Education in Penns Creek
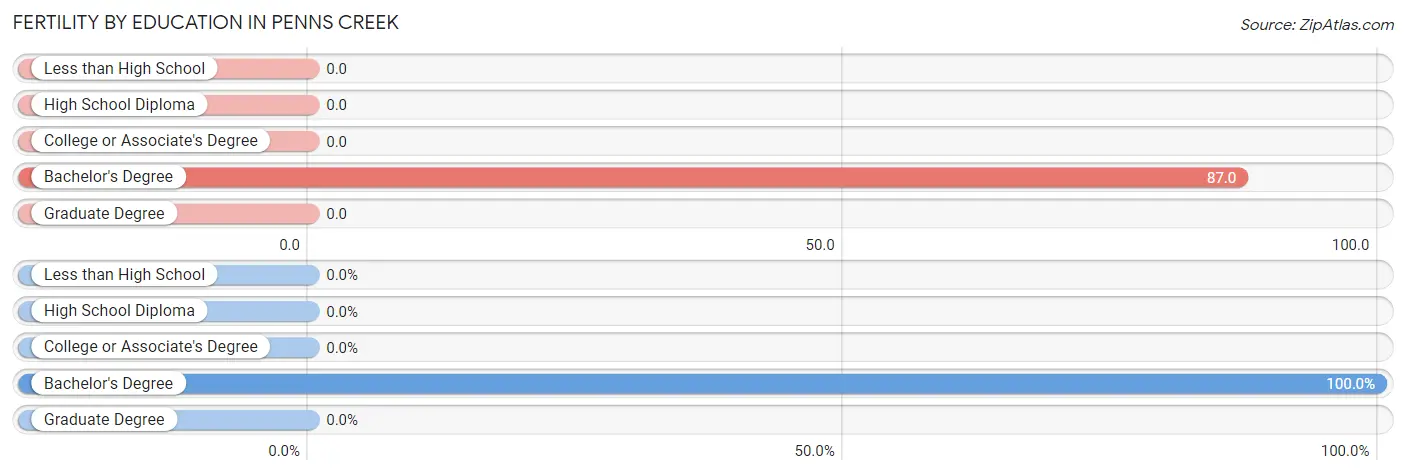
| Educational Attainment | Women with Births | Births / 1,000 Women |
| Less than High School | 0 (0.0%) | 0.0 |
| High School Diploma | 0 (0.0%) | 0.0 |
| College or Associate's Degree | 0 (0.0%) | 0.0 |
| Bachelor's Degree | 4 (100.0%) | 87.0 |
| Graduate Degree | 0 (0.0%) | 0.0 |
| Total | 4 (100.0%) | 16.0 |
Fertility by Education by Marriage Status in Penns Creek
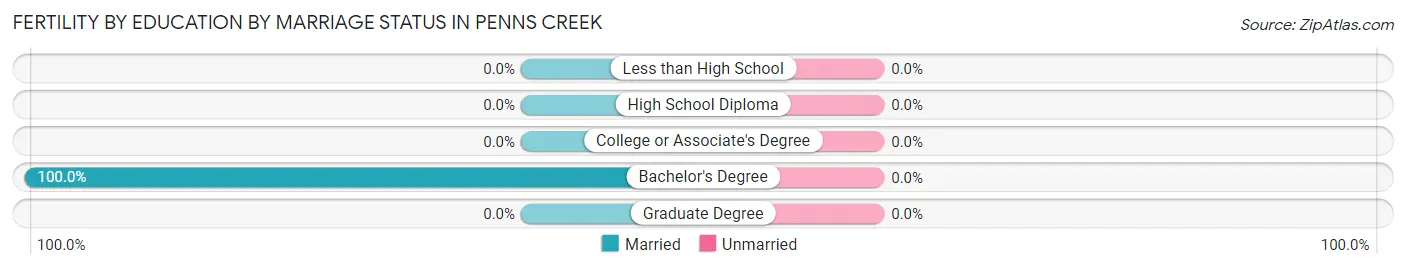
| Educational Attainment | Married | Unmarried |
| Less than High School | 0 (0.0%) | 0 (0.0%) |
| High School Diploma | 0 (0.0%) | 0 (0.0%) |
| College or Associate's Degree | 0 (0.0%) | 0 (0.0%) |
| Bachelor's Degree | 4 (100.0%) | 0 (0.0%) |
| Graduate Degree | 0 (0.0%) | 0 (0.0%) |
| Total | 4 (100.0%) | 0 (0.0%) |
Employment Characteristics in Penns Creek
Employment by Class of Employer in Penns Creek
Among the 361 employed individuals in Penns Creek, private company employees (249 | 69.0%), not-for-profit organizations (58 | 16.1%), and self-employed (not incorporated) (23 | 6.4%) make up the most common classes of employment.
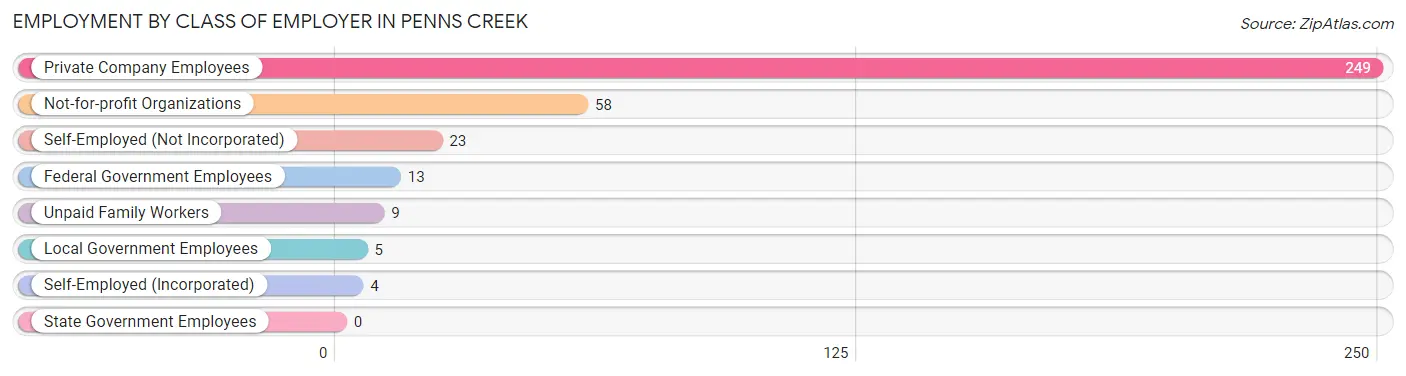
| Employer Class | # Employees | % Employees |
| Private Company Employees | 249 | 69.0% |
| Self-Employed (Incorporated) | 4 | 1.1% |
| Self-Employed (Not Incorporated) | 23 | 6.4% |
| Not-for-profit Organizations | 58 | 16.1% |
| Local Government Employees | 5 | 1.4% |
| State Government Employees | 0 | 0.0% |
| Federal Government Employees | 13 | 3.6% |
| Unpaid Family Workers | 9 | 2.5% |
| Total | 361 | 100.0% |
Employment Status by Age in Penns Creek
According to the labor force statistics for Penns Creek, out of the total population over 16 years of age (688), 59.9% or 412 individuals are in the labor force, with 7.5% or 31 of them unemployed. The age group with the highest labor force participation rate is 25 to 29 years, with 100.0% or 39 individuals in the labor force. Within the labor force, the 16 to 19 years age range has the highest percentage of unemployed individuals, with 48.1% or 25 of them being unemployed.
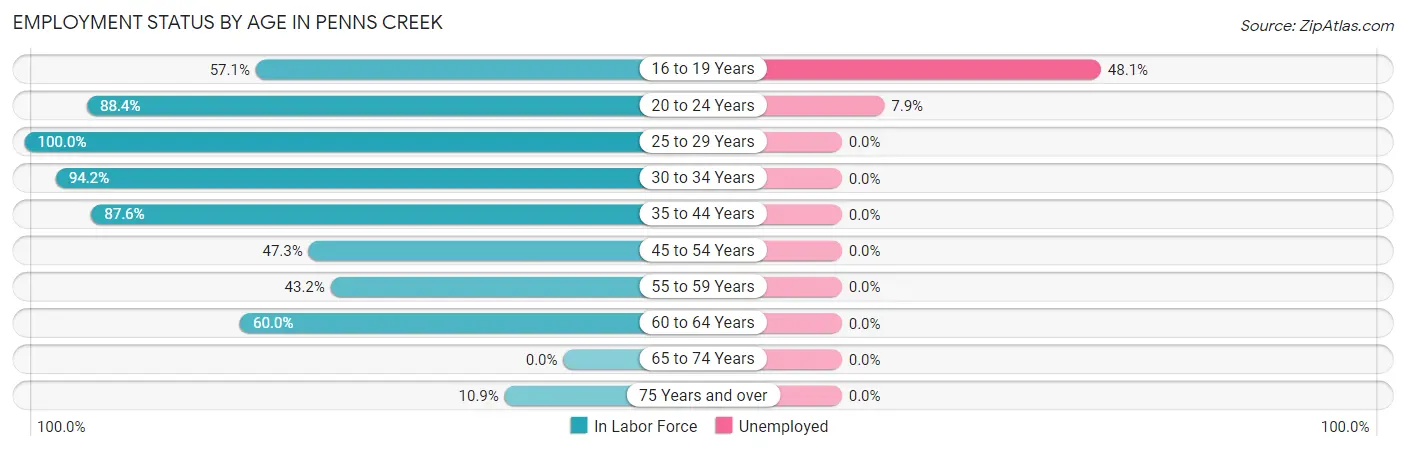
| Age Bracket | In Labor Force | Unemployed |
| 16 to 19 Years | 52 (57.1%) | 25 (48.1%) |
| 20 to 24 Years | 76 (88.4%) | 6 (7.9%) |
| 25 to 29 Years | 39 (100.0%) | 0 (0.0%) |
| 30 to 34 Years | 49 (94.2%) | 0 (0.0%) |
| 35 to 44 Years | 92 (87.6%) | 0 (0.0%) |
| 45 to 54 Years | 35 (47.3%) | 0 (0.0%) |
| 55 to 59 Years | 19 (43.2%) | 0 (0.0%) |
| 60 to 64 Years | 45 (60.0%) | 0 (0.0%) |
| 65 to 74 Years | 0 (0.0%) | 0 (0.0%) |
| 75 Years and over | 5 (10.9%) | 0 (0.0%) |
| Total | 412 (59.9%) | 31 (7.5%) |
Employment Status by Educational Attainment in Penns Creek
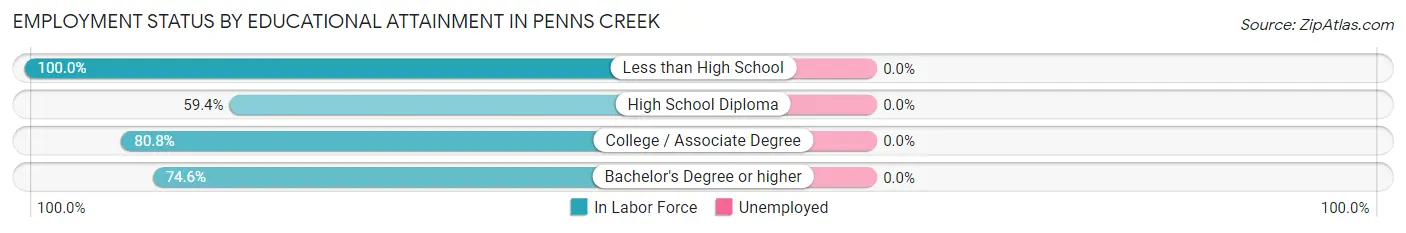
| Educational Attainment | In Labor Force | Unemployed |
| Less than High School | 37 (100.0%) | 0 (0.0%) |
| High School Diploma | 98 (59.4%) | 0 (0.0%) |
| College / Associate Degree | 59 (80.8%) | 0 (0.0%) |
| Bachelor's Degree or higher | 85 (74.6%) | 0 (0.0%) |
| Total | 279 (71.7%) | 0 (0.0%) |
Employment Occupations by Sex in Penns Creek
Management, Business, Science and Arts Occupations
The most common Management, Business, Science and Arts occupations in Penns Creek are Community & Social Service (53 | 13.9%), Education Instruction & Library (34 | 8.9%), Management (29 | 7.6%), Health Diagnosing & Treating (21 | 5.5%), and Arts, Media & Entertainment (19 | 5.0%).
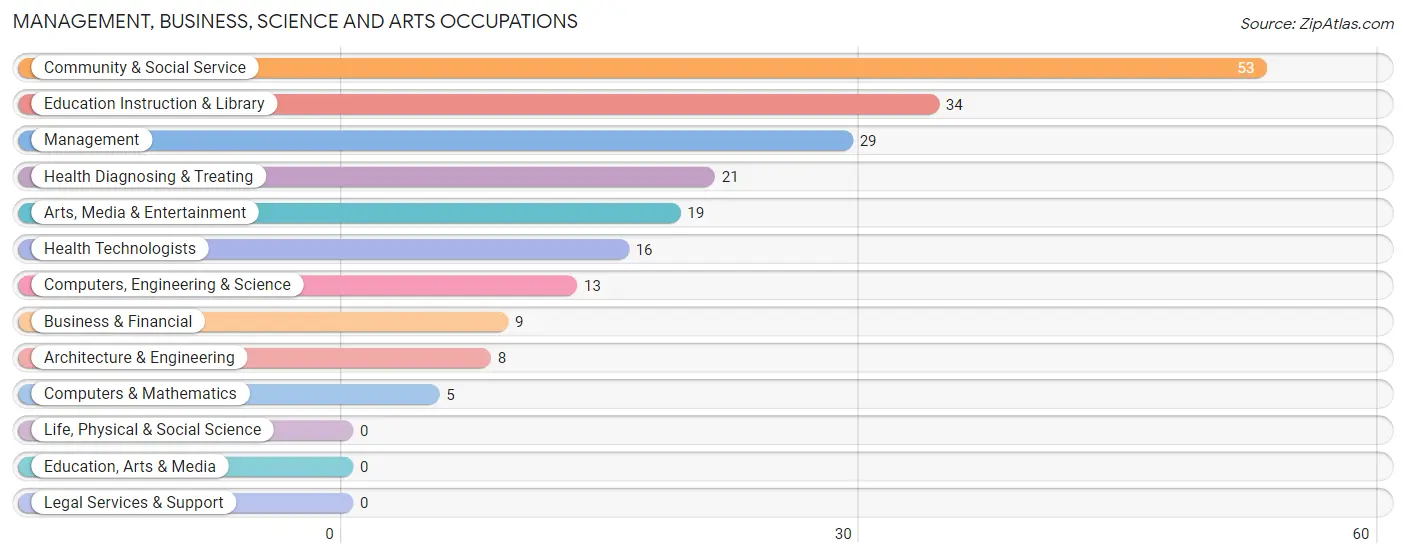
Management, Business, Science and Arts Occupations by Sex
Within the Management, Business, Science and Arts occupations in Penns Creek, the most male-oriented occupations are Computers, Engineering & Science (100.0%), Computers & Mathematics (100.0%), and Architecture & Engineering (100.0%), while the most female-oriented occupations are Business & Financial (100.0%), Health Technologists (100.0%), and Health Diagnosing & Treating (76.2%).
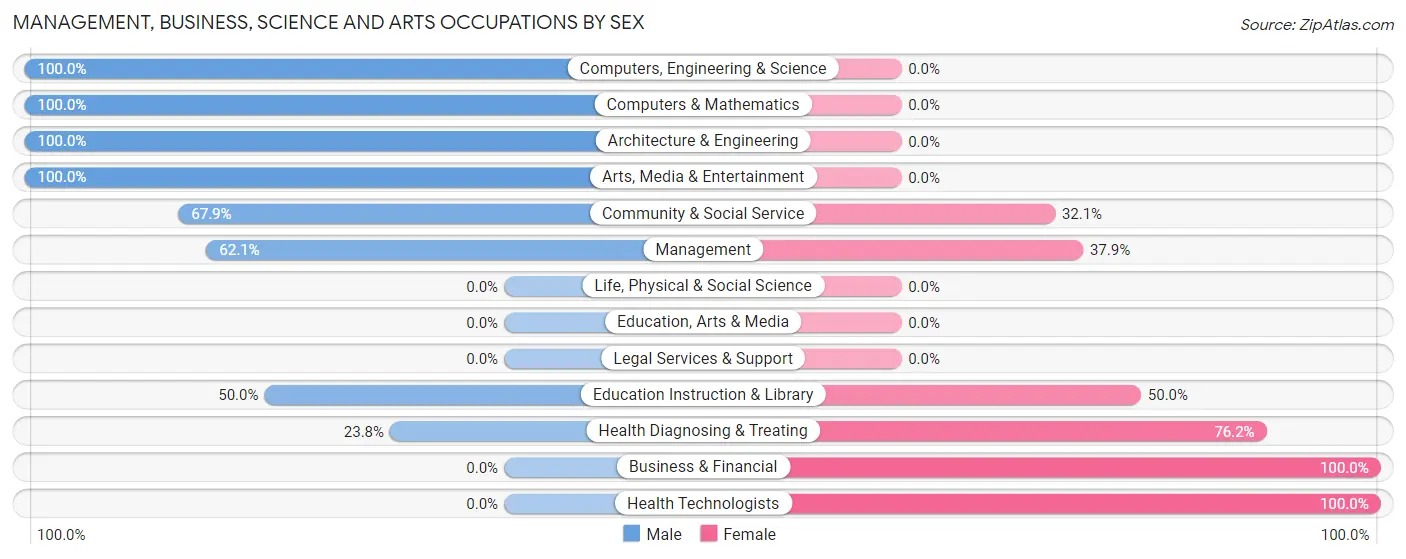
| Occupation | Male | Female |
| Management | 18 (62.1%) | 11 (37.9%) |
| Business & Financial | 0 (0.0%) | 9 (100.0%) |
| Computers, Engineering & Science | 13 (100.0%) | 0 (0.0%) |
| Computers & Mathematics | 5 (100.0%) | 0 (0.0%) |
| Architecture & Engineering | 8 (100.0%) | 0 (0.0%) |
| Life, Physical & Social Science | 0 (0.0%) | 0 (0.0%) |
| Community & Social Service | 36 (67.9%) | 17 (32.1%) |
| Education, Arts & Media | 0 (0.0%) | 0 (0.0%) |
| Legal Services & Support | 0 (0.0%) | 0 (0.0%) |
| Education Instruction & Library | 17 (50.0%) | 17 (50.0%) |
| Arts, Media & Entertainment | 19 (100.0%) | 0 (0.0%) |
| Health Diagnosing & Treating | 5 (23.8%) | 16 (76.2%) |
| Health Technologists | 0 (0.0%) | 16 (100.0%) |
| Total (Category) | 72 (57.6%) | 53 (42.4%) |
| Total (Overall) | 197 (51.7%) | 184 (48.3%) |
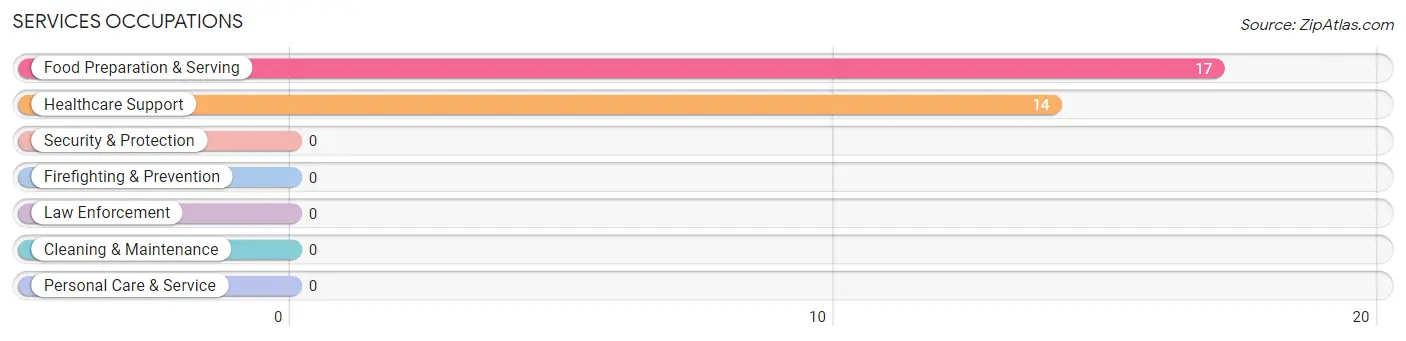
Services Occupations
The most common Services occupations in Penns Creek are Food Preparation & Serving (17 | 4.5%), and Healthcare Support (14 | 3.7%).
Services Occupations by Sex
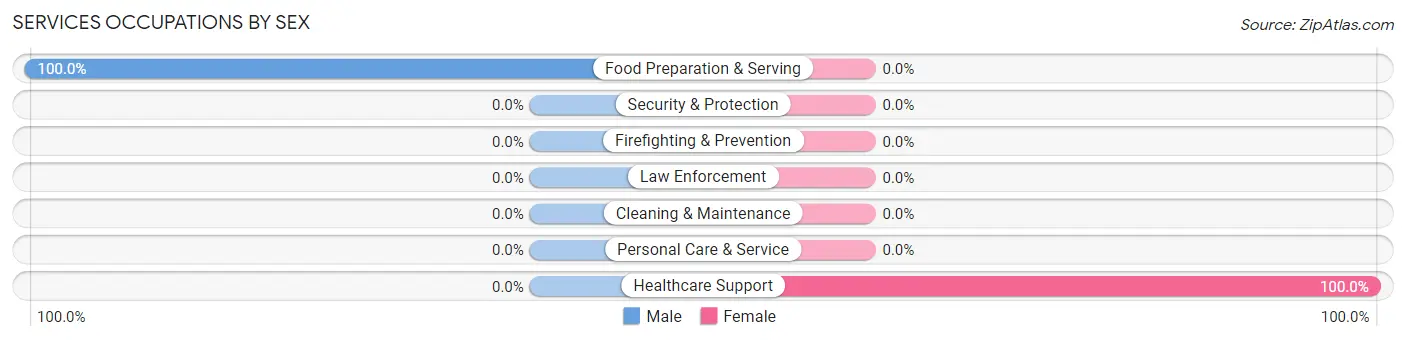
| Occupation | Male | Female |
| Healthcare Support | 0 (0.0%) | 14 (100.0%) |
| Security & Protection | 0 (0.0%) | 0 (0.0%) |
| Firefighting & Prevention | 0 (0.0%) | 0 (0.0%) |
| Law Enforcement | 0 (0.0%) | 0 (0.0%) |
| Food Preparation & Serving | 17 (100.0%) | 0 (0.0%) |
| Cleaning & Maintenance | 0 (0.0%) | 0 (0.0%) |
| Personal Care & Service | 0 (0.0%) | 0 (0.0%) |
| Total (Category) | 17 (54.8%) | 14 (45.2%) |
| Total (Overall) | 197 (51.7%) | 184 (48.3%) |
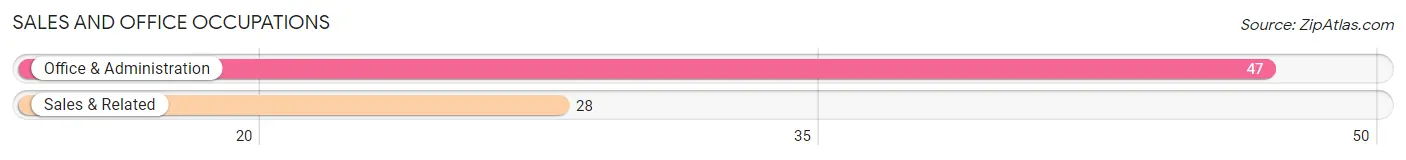
Sales and Office Occupations
The most common Sales and Office occupations in Penns Creek are Office & Administration (47 | 12.3%), and Sales & Related (28 | 7.3%).
Sales and Office Occupations by Sex

| Occupation | Male | Female |
| Sales & Related | 1 (3.6%) | 27 (96.4%) |
| Office & Administration | 9 (19.2%) | 38 (80.8%) |
| Total (Category) | 10 (13.3%) | 65 (86.7%) |
| Total (Overall) | 197 (51.7%) | 184 (48.3%) |
Natural Resources, Construction and Maintenance Occupations
The most common Natural Resources, Construction and Maintenance occupations in Penns Creek are , and Construction & Extraction (46 | 12.1%).
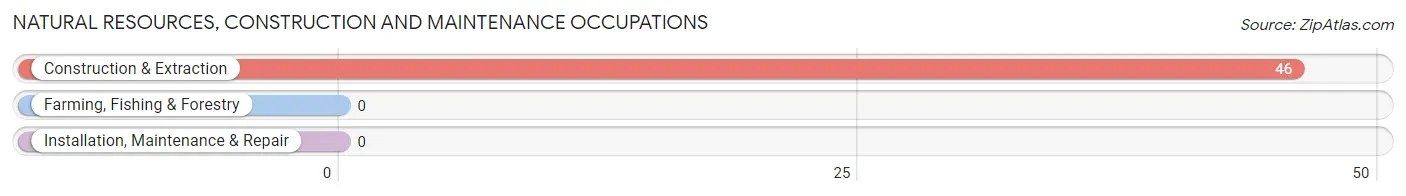
Natural Resources, Construction and Maintenance Occupations by Sex
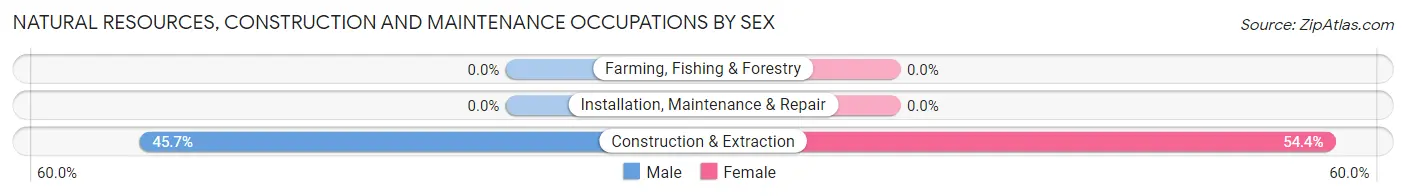
| Occupation | Male | Female |
| Farming, Fishing & Forestry | 0 (0.0%) | 0 (0.0%) |
| Construction & Extraction | 21 (45.7%) | 25 (54.3%) |
| Installation, Maintenance & Repair | 0 (0.0%) | 0 (0.0%) |
| Total (Category) | 21 (45.7%) | 25 (54.3%) |
| Total (Overall) | 197 (51.7%) | 184 (48.3%) |
Production, Transportation and Moving Occupations
The most common Production, Transportation and Moving occupations in Penns Creek are Material Moving (58 | 15.2%), Production (31 | 8.1%), and Transportation (15 | 3.9%).
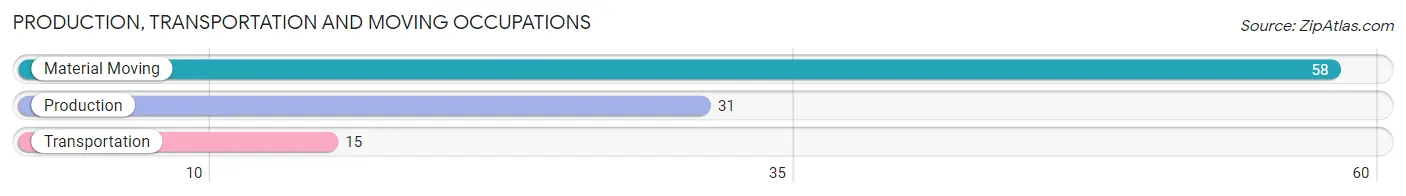
Production, Transportation and Moving Occupations by Sex
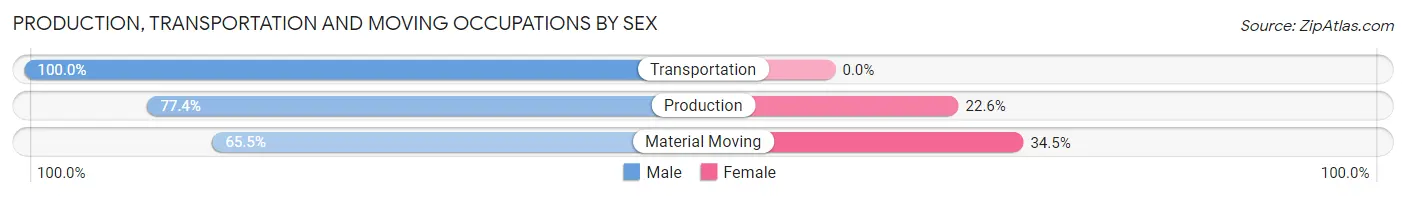
| Occupation | Male | Female |
| Production | 24 (77.4%) | 7 (22.6%) |
| Transportation | 15 (100.0%) | 0 (0.0%) |
| Material Moving | 38 (65.5%) | 20 (34.5%) |
| Total (Category) | 77 (74.0%) | 27 (26.0%) |
| Total (Overall) | 197 (51.7%) | 184 (48.3%) |
Employment Industries by Sex in Penns Creek
Employment Industries in Penns Creek
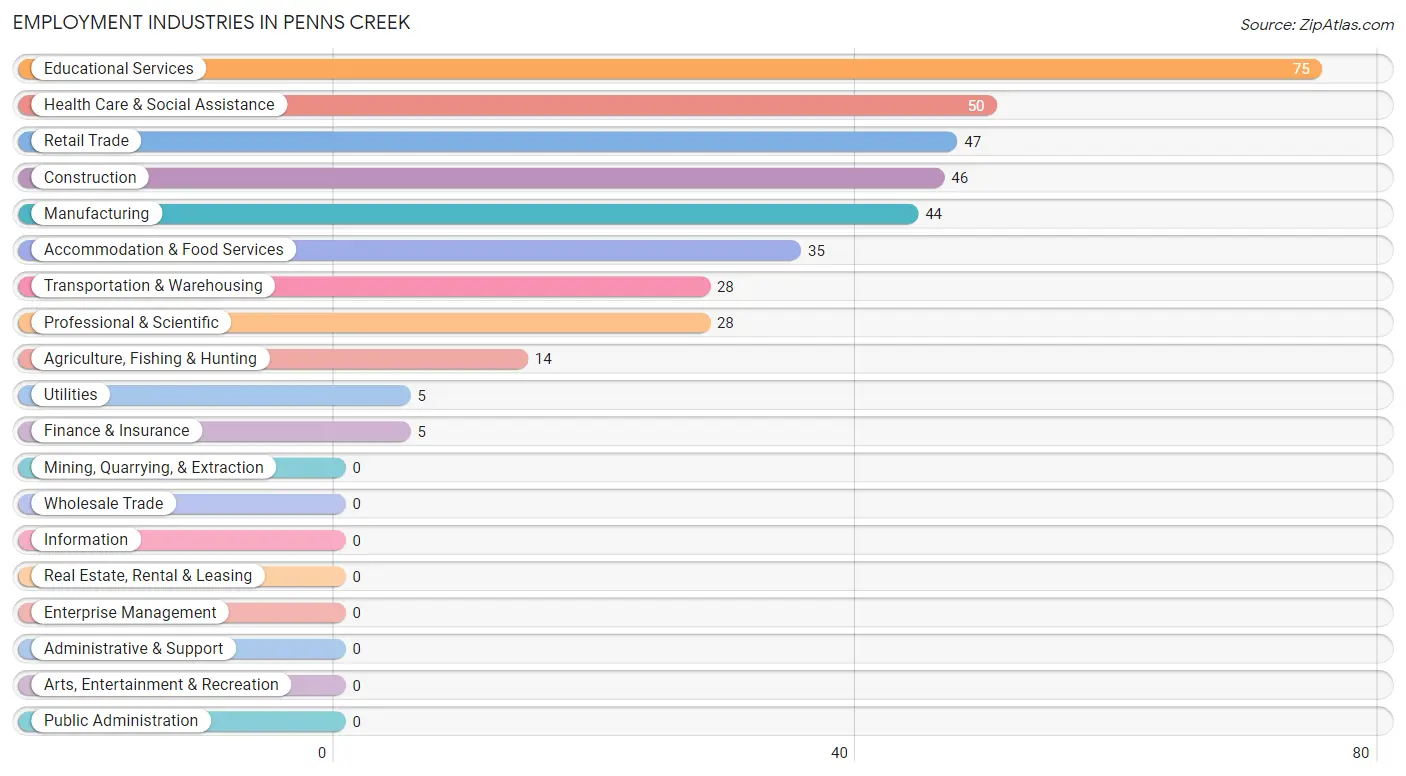
The major employment industries in Penns Creek include Educational Services (75 | 19.7%), Health Care & Social Assistance (50 | 13.1%), Retail Trade (47 | 12.3%), Construction (46 | 12.1%), and Manufacturing (44 | 11.6%).
Employment Industries by Sex in Penns Creek
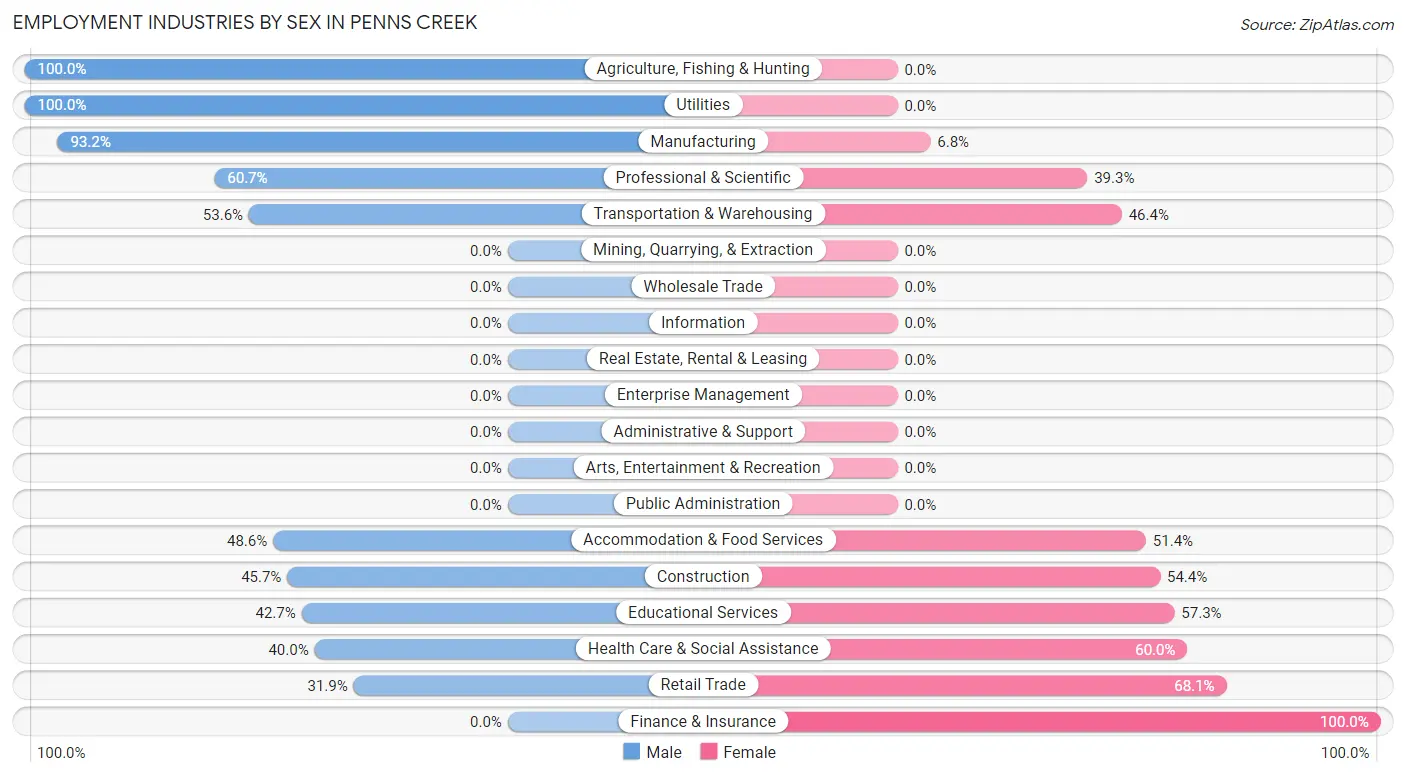
The Penns Creek industries that see more men than women are Agriculture, Fishing & Hunting (100.0%), Utilities (100.0%), and Manufacturing (93.2%), whereas the industries that tend to have a higher number of women are Finance & Insurance (100.0%), Retail Trade (68.1%), and Health Care & Social Assistance (60.0%).
| Industry | Male | Female |
| Agriculture, Fishing & Hunting | 14 (100.0%) | 0 (0.0%) |
| Mining, Quarrying, & Extraction | 0 (0.0%) | 0 (0.0%) |
| Construction | 21 (45.7%) | 25 (54.3%) |
| Manufacturing | 41 (93.2%) | 3 (6.8%) |
| Wholesale Trade | 0 (0.0%) | 0 (0.0%) |
| Retail Trade | 15 (31.9%) | 32 (68.1%) |
| Transportation & Warehousing | 15 (53.6%) | 13 (46.4%) |
| Utilities | 5 (100.0%) | 0 (0.0%) |
| Information | 0 (0.0%) | 0 (0.0%) |
| Finance & Insurance | 0 (0.0%) | 5 (100.0%) |
| Real Estate, Rental & Leasing | 0 (0.0%) | 0 (0.0%) |
| Professional & Scientific | 17 (60.7%) | 11 (39.3%) |
| Enterprise Management | 0 (0.0%) | 0 (0.0%) |
| Administrative & Support | 0 (0.0%) | 0 (0.0%) |
| Educational Services | 32 (42.7%) | 43 (57.3%) |
| Health Care & Social Assistance | 20 (40.0%) | 30 (60.0%) |
| Arts, Entertainment & Recreation | 0 (0.0%) | 0 (0.0%) |
| Accommodation & Food Services | 17 (48.6%) | 18 (51.4%) |
| Public Administration | 0 (0.0%) | 0 (0.0%) |
| Total | 197 (51.7%) | 184 (48.3%) |
Education in Penns Creek
School Enrollment in Penns Creek
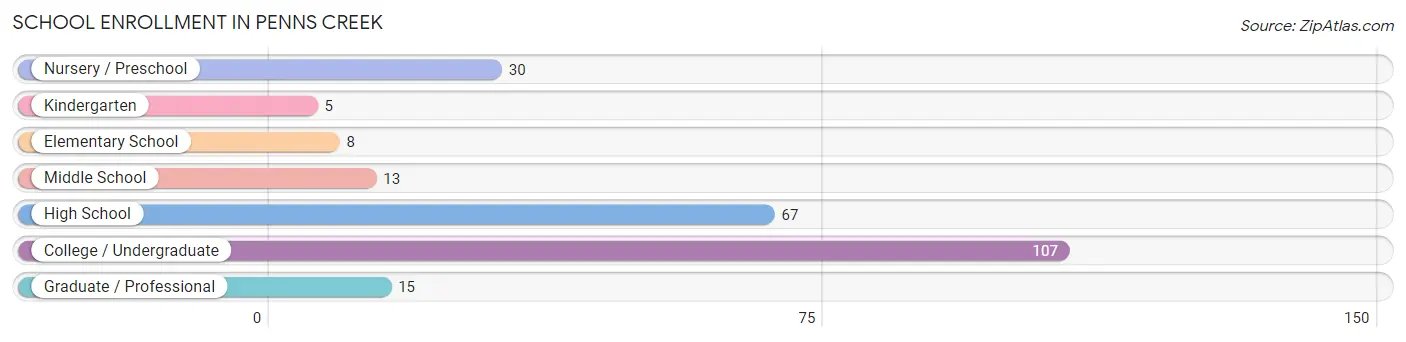
The most common levels of schooling among the 245 students in Penns Creek are college / undergraduate (107 | 43.7%), high school (67 | 27.4%), and nursery / preschool (30 | 12.2%).
| School Level | # Students | % Students |
| Nursery / Preschool | 30 | 12.2% |
| Kindergarten | 5 | 2.0% |
| Elementary School | 8 | 3.3% |
| Middle School | 13 | 5.3% |
| High School | 67 | 27.4% |
| College / Undergraduate | 107 | 43.7% |
| Graduate / Professional | 15 | 6.1% |
| Total | 245 | 100.0% |
School Enrollment by Age by Funding Source in Penns Creek
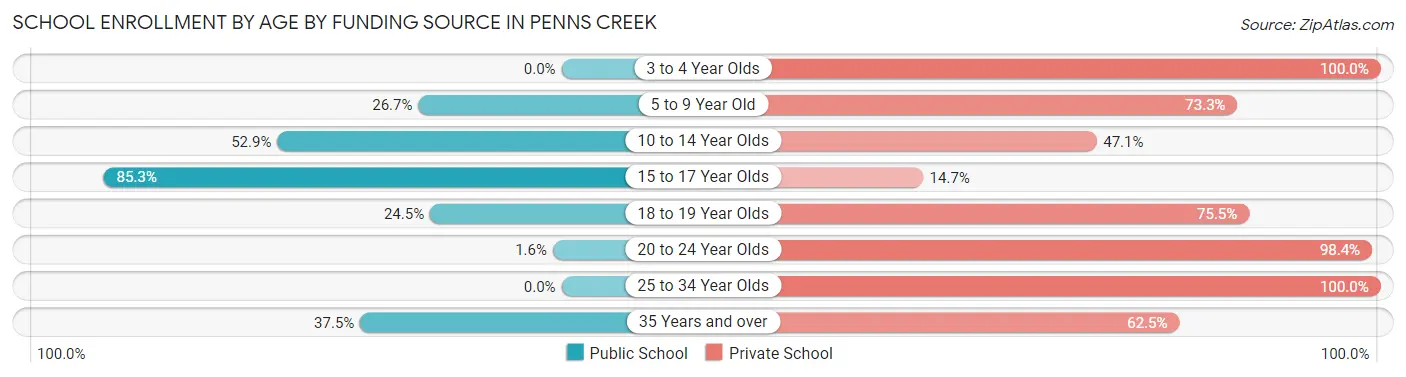
Out of a total of 245 students who are enrolled in schools in Penns Creek, 174 (71.0%) attend a private institution, while the remaining 71 (29.0%) are enrolled in public schools. The age group of 3 to 4 year olds has the highest likelihood of being enrolled in private schools, with 13 (100.0% in the age bracket) enrolled. Conversely, the age group of 15 to 17 year olds has the lowest likelihood of being enrolled in a private school, with 29 (85.3% in the age bracket) attending a public institution.
| Age Bracket | Public School | Private School |
| 3 to 4 Year Olds | 0 (0.0%) | 13 (100.0%) |
| 5 to 9 Year Old | 8 (26.7%) | 22 (73.3%) |
| 10 to 14 Year Olds | 18 (52.9%) | 16 (47.1%) |
| 15 to 17 Year Olds | 29 (85.3%) | 5 (14.7%) |
| 18 to 19 Year Olds | 12 (24.5%) | 37 (75.5%) |
| 20 to 24 Year Olds | 1 (1.6%) | 61 (98.4%) |
| 25 to 34 Year Olds | 0 (0.0%) | 15 (100.0%) |
| 35 Years and over | 3 (37.5%) | 5 (62.5%) |
| Total | 71 (29.0%) | 174 (71.0%) |
Educational Attainment by Field of Study in Penns Creek
Education (37 | 31.4%), liberal arts & history (17 | 14.4%), science & technology (16 | 13.6%), bio, nature & agricultural (15 | 12.7%), and business (12 | 10.2%) are the most common fields of study among 118 individuals in Penns Creek who have obtained a bachelor's degree or higher.
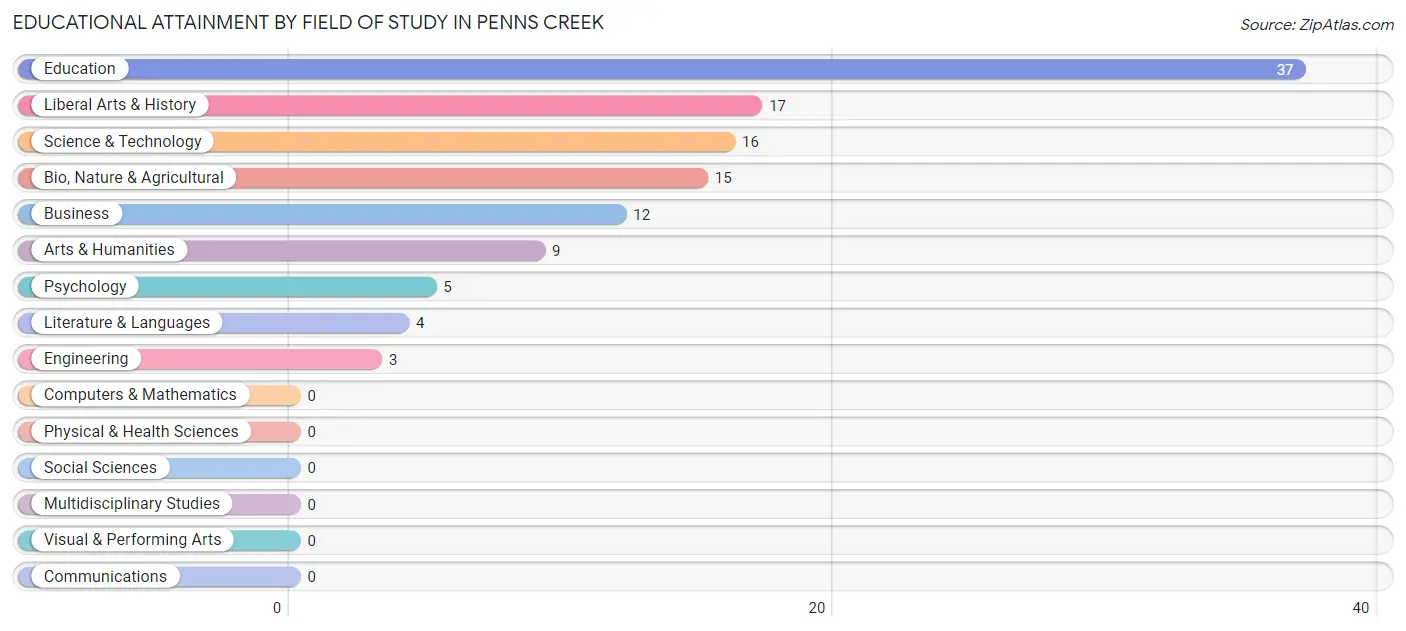
| Field of Study | # Graduates | % Graduates |
| Computers & Mathematics | 0 | 0.0% |
| Bio, Nature & Agricultural | 15 | 12.7% |
| Physical & Health Sciences | 0 | 0.0% |
| Psychology | 5 | 4.2% |
| Social Sciences | 0 | 0.0% |
| Engineering | 3 | 2.5% |
| Multidisciplinary Studies | 0 | 0.0% |
| Science & Technology | 16 | 13.6% |
| Business | 12 | 10.2% |
| Education | 37 | 31.4% |
| Literature & Languages | 4 | 3.4% |
| Liberal Arts & History | 17 | 14.4% |
| Visual & Performing Arts | 0 | 0.0% |
| Communications | 0 | 0.0% |
| Arts & Humanities | 9 | 7.6% |
| Total | 118 | 100.0% |
Transportation & Commute in Penns Creek
Vehicle Availability by Sex in Penns Creek
The most prevalent vehicle ownership categories in Penns Creek are males with 2 vehicles (65, accounting for 45.1%) and females with 2 vehicles (34, making up 40.6%).
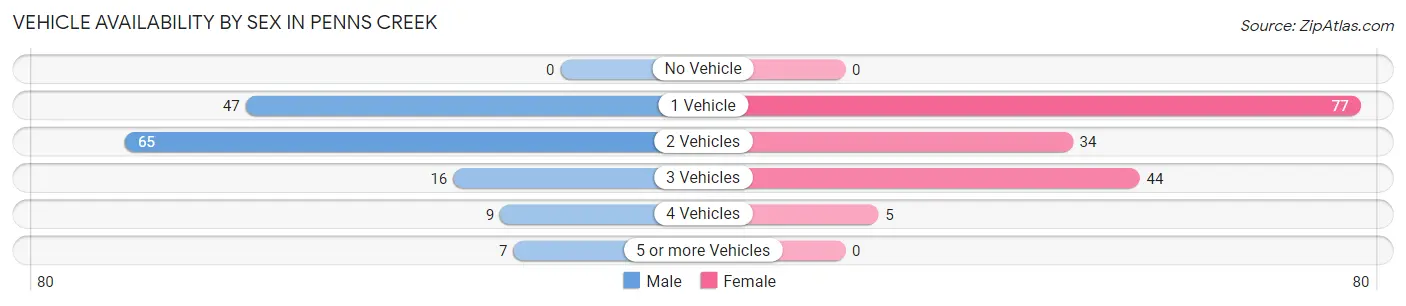
| Vehicles Available | Male | Female |
| No Vehicle | 0 (0.0%) | 0 (0.0%) |
| 1 Vehicle | 47 (32.6%) | 77 (48.1%) |
| 2 Vehicles | 65 (45.1%) | 34 (21.2%) |
| 3 Vehicles | 16 (11.1%) | 44 (27.5%) |
| 4 Vehicles | 9 (6.2%) | 5 (3.1%) |
| 5 or more Vehicles | 7 (4.9%) | 0 (0.0%) |
| Total | 144 (100.0%) | 160 (100.0%) |
Commute Time in Penns Creek
The most frequently occuring commute durations in Penns Creek are 5 to 9 minutes (115 commuters, 34.1%), less than 5 minutes (53 commuters, 15.7%), and 30 to 34 minutes (43 commuters, 12.8%).
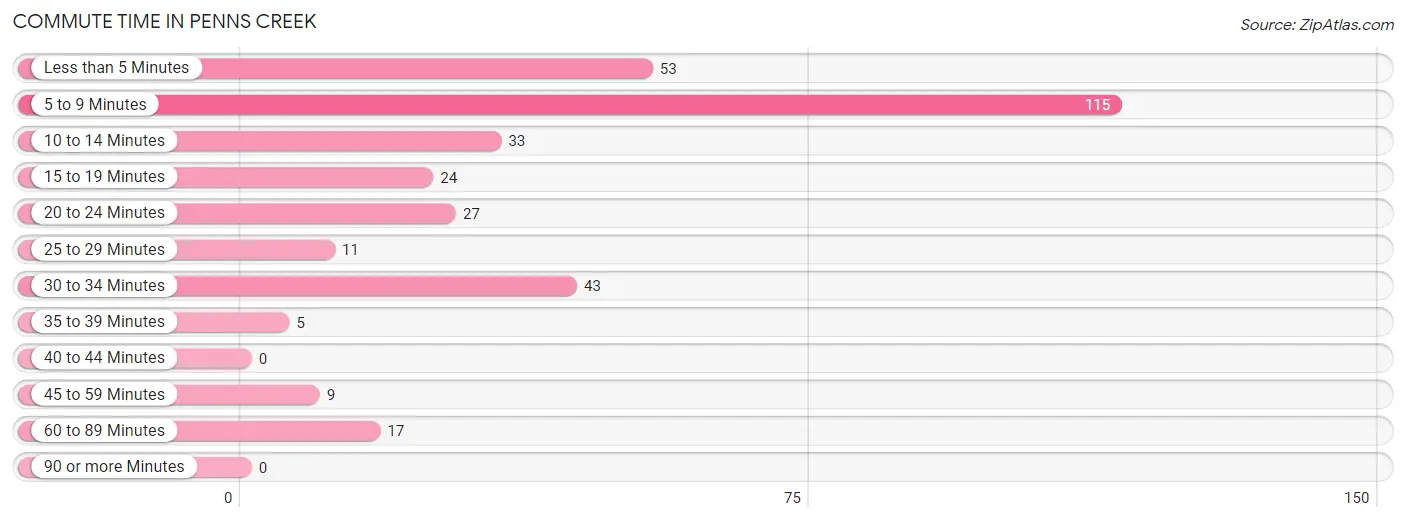
| Commute Time | # Commuters | % Commuters |
| Less than 5 Minutes | 53 | 15.7% |
| 5 to 9 Minutes | 115 | 34.1% |
| 10 to 14 Minutes | 33 | 9.8% |
| 15 to 19 Minutes | 24 | 7.1% |
| 20 to 24 Minutes | 27 | 8.0% |
| 25 to 29 Minutes | 11 | 3.3% |
| 30 to 34 Minutes | 43 | 12.8% |
| 35 to 39 Minutes | 5 | 1.5% |
| 40 to 44 Minutes | 0 | 0.0% |
| 45 to 59 Minutes | 9 | 2.7% |
| 60 to 89 Minutes | 17 | 5.0% |
| 90 or more Minutes | 0 | 0.0% |
Commute Time by Sex in Penns Creek
The most common commute times in Penns Creek are 5 to 9 minutes (44 commuters, 27.0%) for males and 5 to 9 minutes (71 commuters, 40.8%) for females.
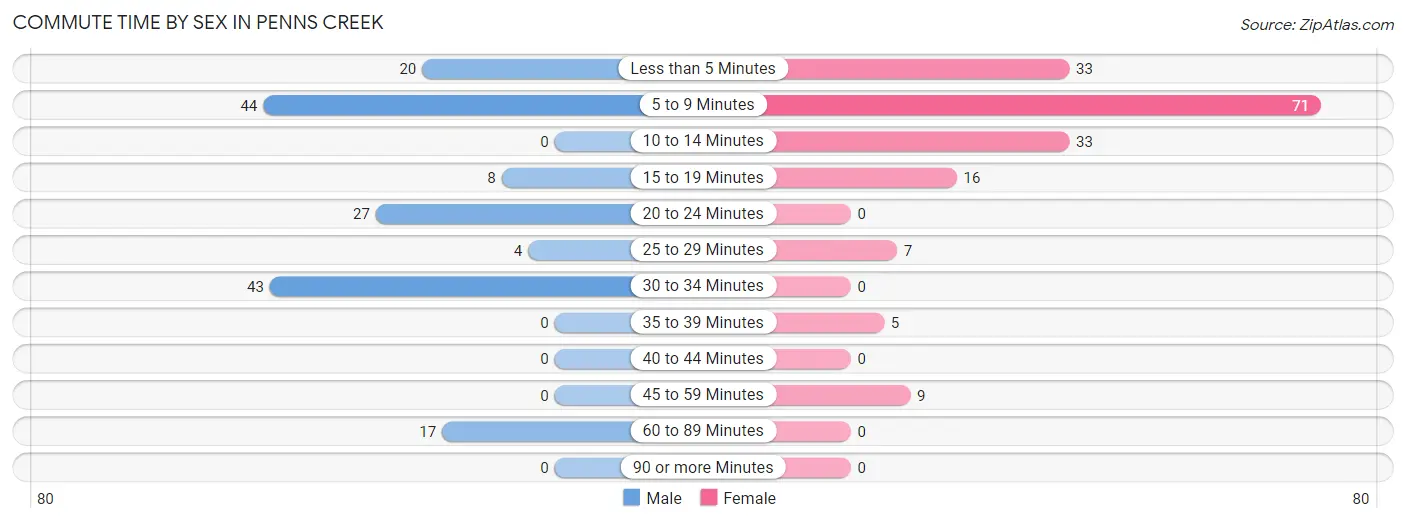
| Commute Time | Male | Female |
| Less than 5 Minutes | 20 (12.3%) | 33 (19.0%) |
| 5 to 9 Minutes | 44 (27.0%) | 71 (40.8%) |
| 10 to 14 Minutes | 0 (0.0%) | 33 (19.0%) |
| 15 to 19 Minutes | 8 (4.9%) | 16 (9.2%) |
| 20 to 24 Minutes | 27 (16.6%) | 0 (0.0%) |
| 25 to 29 Minutes | 4 (2.5%) | 7 (4.0%) |
| 30 to 34 Minutes | 43 (26.4%) | 0 (0.0%) |
| 35 to 39 Minutes | 0 (0.0%) | 5 (2.9%) |
| 40 to 44 Minutes | 0 (0.0%) | 0 (0.0%) |
| 45 to 59 Minutes | 0 (0.0%) | 9 (5.2%) |
| 60 to 89 Minutes | 17 (10.4%) | 0 (0.0%) |
| 90 or more Minutes | 0 (0.0%) | 0 (0.0%) |
Time of Departure to Work by Sex in Penns Creek
The most frequent times of departure to work in Penns Creek are 4:00 PM to 11:59 PM (29, 17.8%) for males and 7:30 AM to 7:59 AM (38, 21.8%) for females.
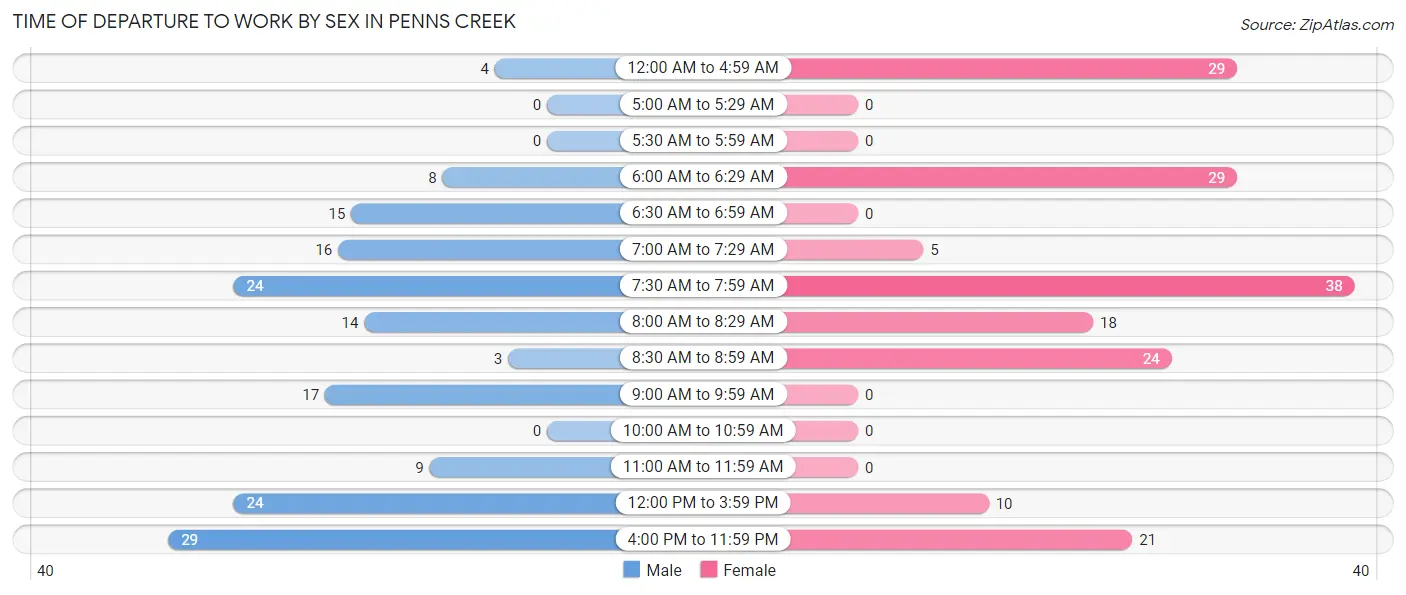
| Time of Departure | Male | Female |
| 12:00 AM to 4:59 AM | 4 (2.5%) | 29 (16.7%) |
| 5:00 AM to 5:29 AM | 0 (0.0%) | 0 (0.0%) |
| 5:30 AM to 5:59 AM | 0 (0.0%) | 0 (0.0%) |
| 6:00 AM to 6:29 AM | 8 (4.9%) | 29 (16.7%) |
| 6:30 AM to 6:59 AM | 15 (9.2%) | 0 (0.0%) |
| 7:00 AM to 7:29 AM | 16 (9.8%) | 5 (2.9%) |
| 7:30 AM to 7:59 AM | 24 (14.7%) | 38 (21.8%) |
| 8:00 AM to 8:29 AM | 14 (8.6%) | 18 (10.3%) |
| 8:30 AM to 8:59 AM | 3 (1.8%) | 24 (13.8%) |
| 9:00 AM to 9:59 AM | 17 (10.4%) | 0 (0.0%) |
| 10:00 AM to 10:59 AM | 0 (0.0%) | 0 (0.0%) |
| 11:00 AM to 11:59 AM | 9 (5.5%) | 0 (0.0%) |
| 12:00 PM to 3:59 PM | 24 (14.7%) | 10 (5.8%) |
| 4:00 PM to 11:59 PM | 29 (17.8%) | 21 (12.1%) |
| Total | 163 (100.0%) | 174 (100.0%) |
Housing Occupancy in Penns Creek
Occupancy by Ownership in Penns Creek
Of the total 272 dwellings in Penns Creek, owner-occupied units account for 130 (47.8%), while renter-occupied units make up 142 (52.2%).
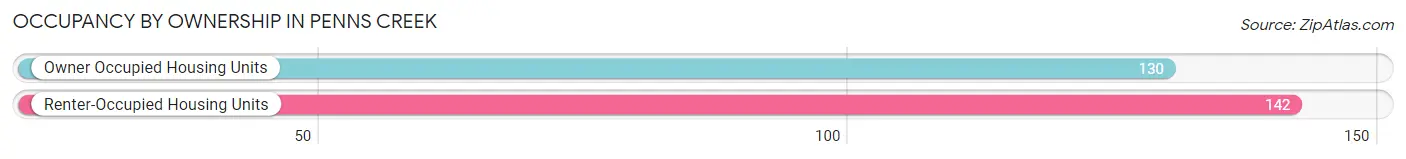
| Occupancy | # Housing Units | % Housing Units |
| Owner Occupied Housing Units | 130 | 47.8% |
| Renter-Occupied Housing Units | 142 | 52.2% |
| Total Occupied Housing Units | 272 | 100.0% |
Occupancy by Household Size in Penns Creek
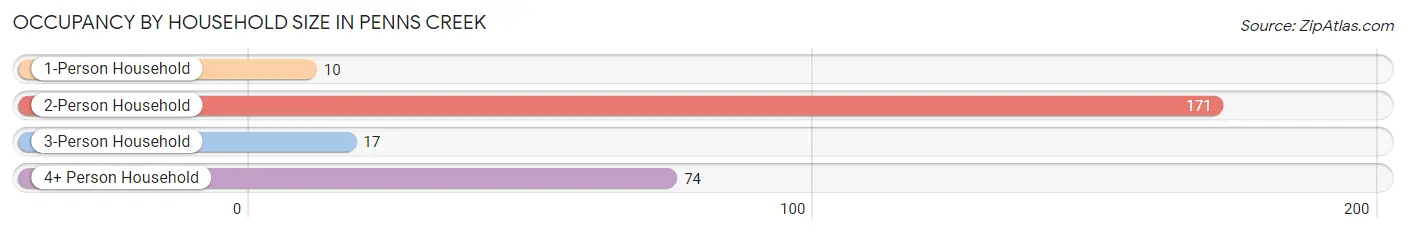
| Household Size | # Housing Units | % Housing Units |
| 1-Person Household | 10 | 3.7% |
| 2-Person Household | 171 | 62.9% |
| 3-Person Household | 17 | 6.2% |
| 4+ Person Household | 74 | 27.2% |
| Total Housing Units | 272 | 100.0% |
Occupancy by Ownership by Household Size in Penns Creek
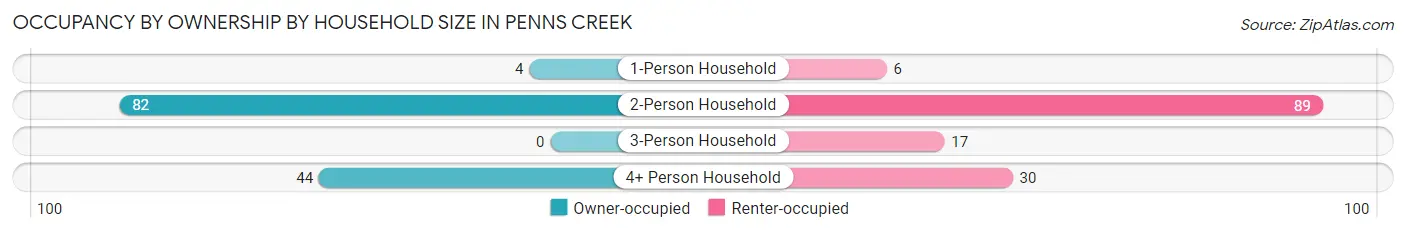
| Household Size | Owner-occupied | Renter-occupied |
| 1-Person Household | 4 (40.0%) | 6 (60.0%) |
| 2-Person Household | 82 (47.9%) | 89 (52.0%) |
| 3-Person Household | 0 (0.0%) | 17 (100.0%) |
| 4+ Person Household | 44 (59.5%) | 30 (40.5%) |
| Total Housing Units | 130 (47.8%) | 142 (52.2%) |
Occupancy by Educational Attainment in Penns Creek
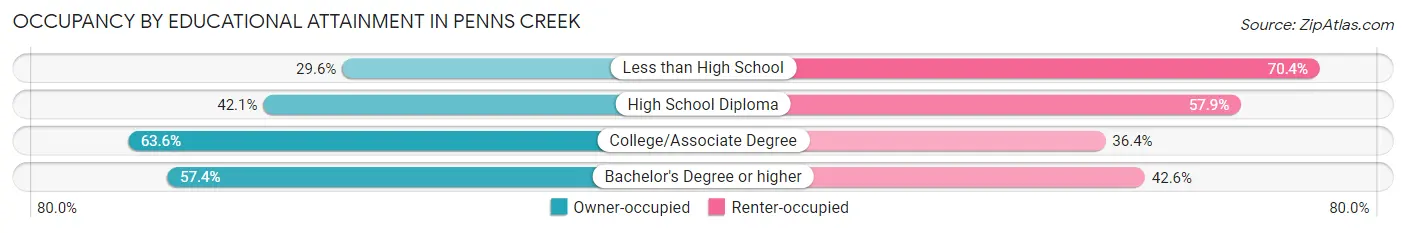
| Household Size | Owner-occupied | Renter-occupied |
| Less than High School | 8 (29.6%) | 19 (70.4%) |
| High School Diploma | 59 (42.1%) | 81 (57.9%) |
| College/Associate Degree | 28 (63.6%) | 16 (36.4%) |
| Bachelor's Degree or higher | 35 (57.4%) | 26 (42.6%) |
Occupancy by Age of Householder in Penns Creek
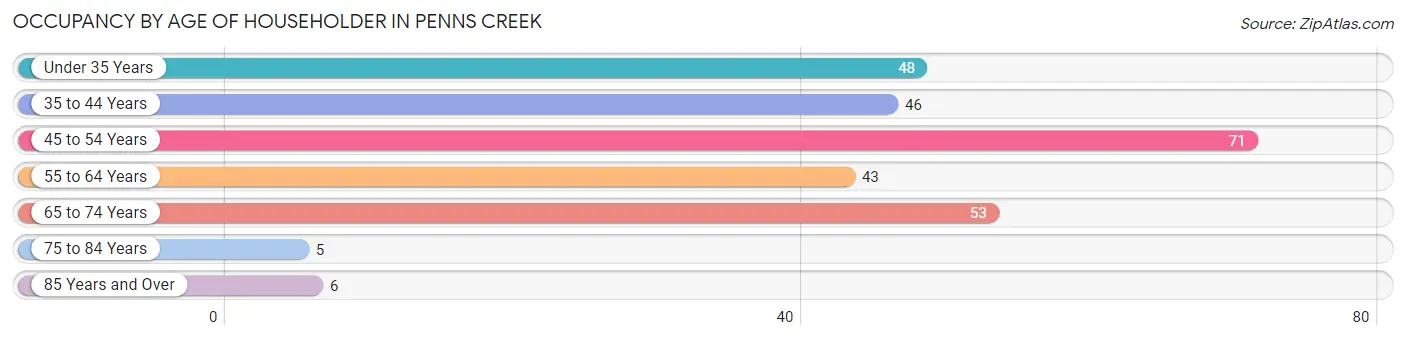
| Age Bracket | # Households | % Households |
| Under 35 Years | 48 | 17.6% |
| 35 to 44 Years | 46 | 16.9% |
| 45 to 54 Years | 71 | 26.1% |
| 55 to 64 Years | 43 | 15.8% |
| 65 to 74 Years | 53 | 19.5% |
| 75 to 84 Years | 5 | 1.8% |
| 85 Years and Over | 6 | 2.2% |
| Total | 272 | 100.0% |
Housing Finances in Penns Creek
Median Income by Occupancy in Penns Creek
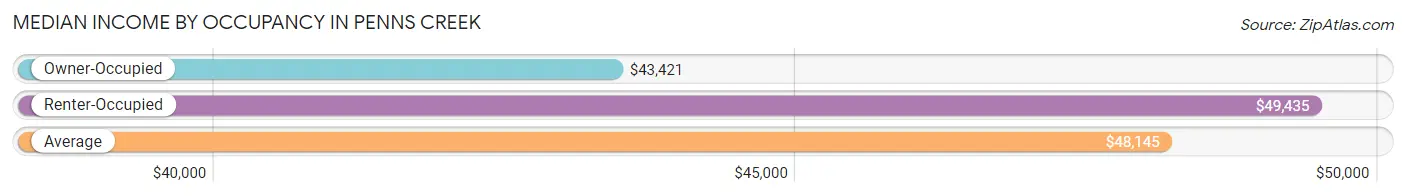
| Occupancy Type | # Households | Median Income |
| Owner-Occupied | 130 (47.8%) | $43,421 |
| Renter-Occupied | 142 (52.2%) | $49,435 |
| Average | 272 (100.0%) | $48,145 |
Occupancy by Householder Income Bracket in Penns Creek
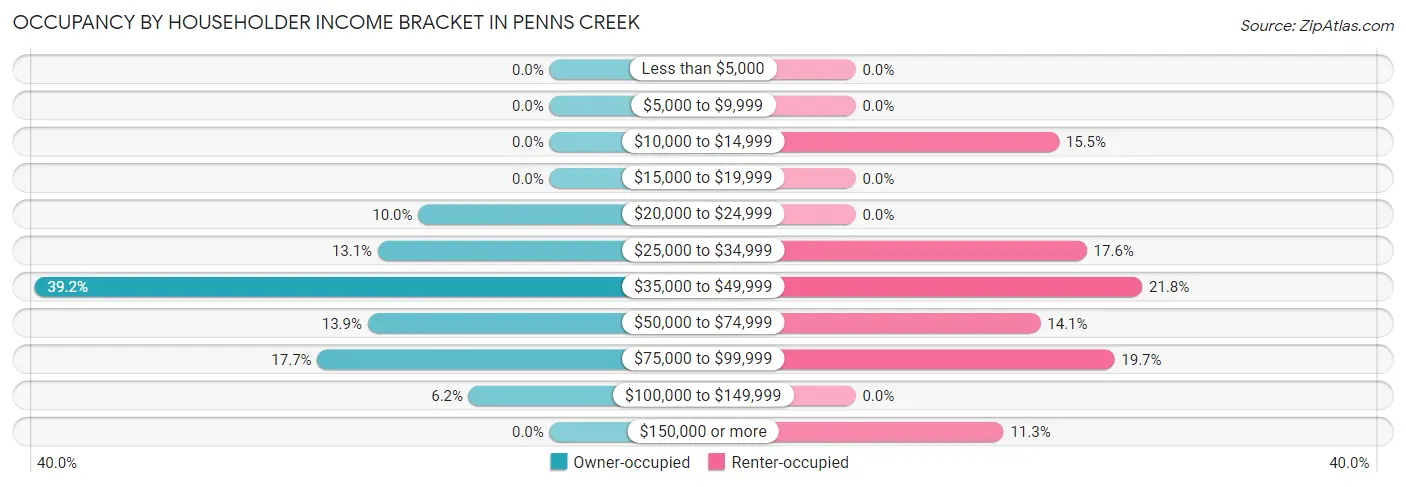
| Income Bracket | Owner-occupied | Renter-occupied |
| Less than $5,000 | 0 (0.0%) | 0 (0.0%) |
| $5,000 to $9,999 | 0 (0.0%) | 0 (0.0%) |
| $10,000 to $14,999 | 0 (0.0%) | 22 (15.5%) |
| $15,000 to $19,999 | 0 (0.0%) | 0 (0.0%) |
| $20,000 to $24,999 | 13 (10.0%) | 0 (0.0%) |
| $25,000 to $34,999 | 17 (13.1%) | 25 (17.6%) |
| $35,000 to $49,999 | 51 (39.2%) | 31 (21.8%) |
| $50,000 to $74,999 | 18 (13.9%) | 20 (14.1%) |
| $75,000 to $99,999 | 23 (17.7%) | 28 (19.7%) |
| $100,000 to $149,999 | 8 (6.1%) | 0 (0.0%) |
| $150,000 or more | 0 (0.0%) | 16 (11.3%) |
| Total | 130 (100.0%) | 142 (100.0%) |
Monthly Housing Cost Tiers in Penns Creek
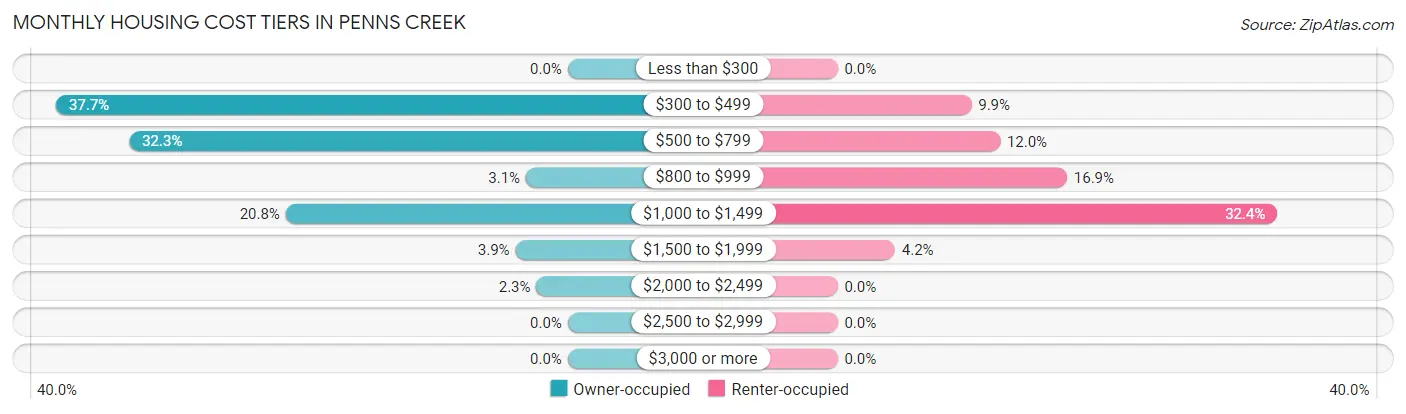
| Monthly Cost | Owner-occupied | Renter-occupied |
| Less than $300 | 0 (0.0%) | 0 (0.0%) |
| $300 to $499 | 49 (37.7%) | 14 (9.9%) |
| $500 to $799 | 42 (32.3%) | 17 (12.0%) |
| $800 to $999 | 4 (3.1%) | 24 (16.9%) |
| $1,000 to $1,499 | 27 (20.8%) | 46 (32.4%) |
| $1,500 to $1,999 | 5 (3.8%) | 6 (4.2%) |
| $2,000 to $2,499 | 3 (2.3%) | 0 (0.0%) |
| $2,500 to $2,999 | 0 (0.0%) | 0 (0.0%) |
| $3,000 or more | 0 (0.0%) | 0 (0.0%) |
| Total | 130 (100.0%) | 142 (100.0%) |
Physical Housing Characteristics in Penns Creek
Housing Structures in Penns Creek
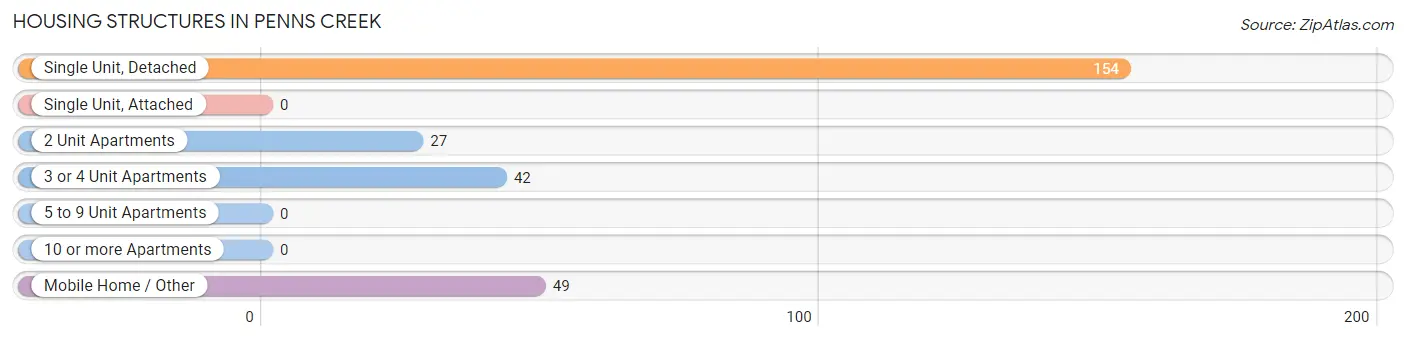
| Structure Type | # Housing Units | % Housing Units |
| Single Unit, Detached | 154 | 56.6% |
| Single Unit, Attached | 0 | 0.0% |
| 2 Unit Apartments | 27 | 9.9% |
| 3 or 4 Unit Apartments | 42 | 15.4% |
| 5 to 9 Unit Apartments | 0 | 0.0% |
| 10 or more Apartments | 0 | 0.0% |
| Mobile Home / Other | 49 | 18.0% |
| Total | 272 | 100.0% |
Housing Structures by Occupancy in Penns Creek
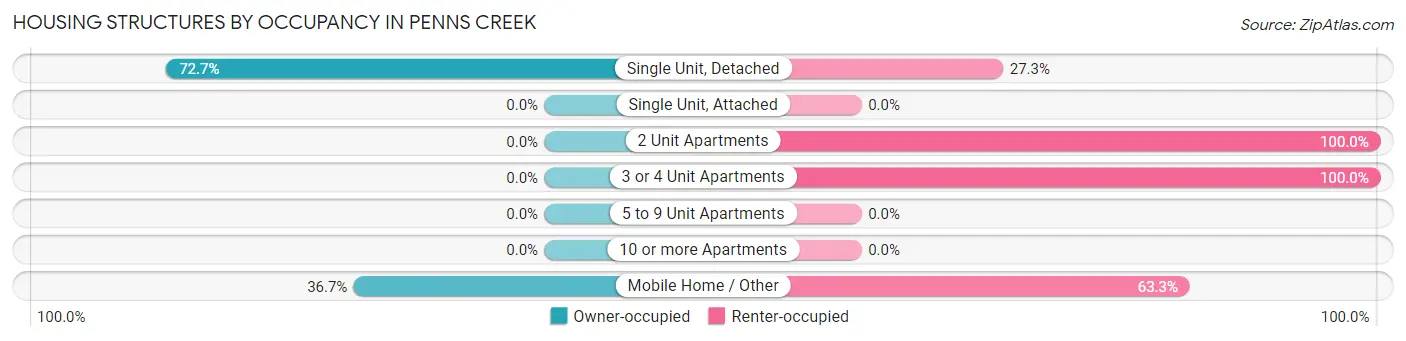
| Structure Type | Owner-occupied | Renter-occupied |
| Single Unit, Detached | 112 (72.7%) | 42 (27.3%) |
| Single Unit, Attached | 0 (0.0%) | 0 (0.0%) |
| 2 Unit Apartments | 0 (0.0%) | 27 (100.0%) |
| 3 or 4 Unit Apartments | 0 (0.0%) | 42 (100.0%) |
| 5 to 9 Unit Apartments | 0 (0.0%) | 0 (0.0%) |
| 10 or more Apartments | 0 (0.0%) | 0 (0.0%) |
| Mobile Home / Other | 18 (36.7%) | 31 (63.3%) |
| Total | 130 (47.8%) | 142 (52.2%) |
Housing Structures by Number of Rooms in Penns Creek
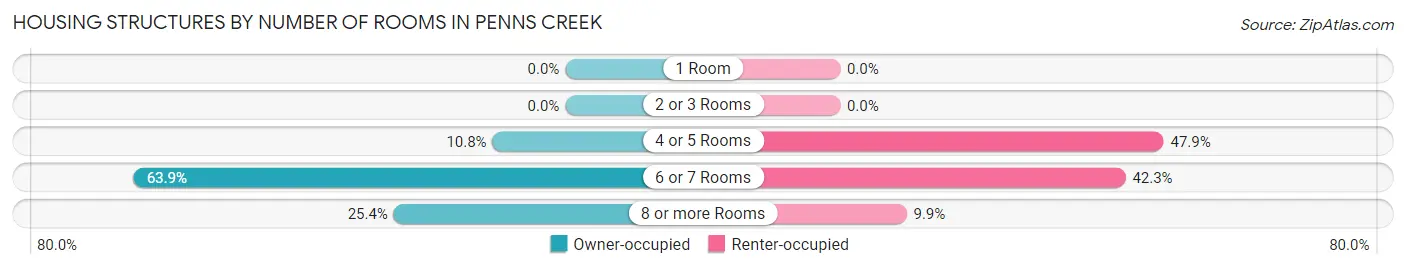
| Number of Rooms | Owner-occupied | Renter-occupied |
| 1 Room | 0 (0.0%) | 0 (0.0%) |
| 2 or 3 Rooms | 0 (0.0%) | 0 (0.0%) |
| 4 or 5 Rooms | 14 (10.8%) | 68 (47.9%) |
| 6 or 7 Rooms | 83 (63.8%) | 60 (42.2%) |
| 8 or more Rooms | 33 (25.4%) | 14 (9.9%) |
| Total | 130 (100.0%) | 142 (100.0%) |
Housing Structure by Heating Type in Penns Creek
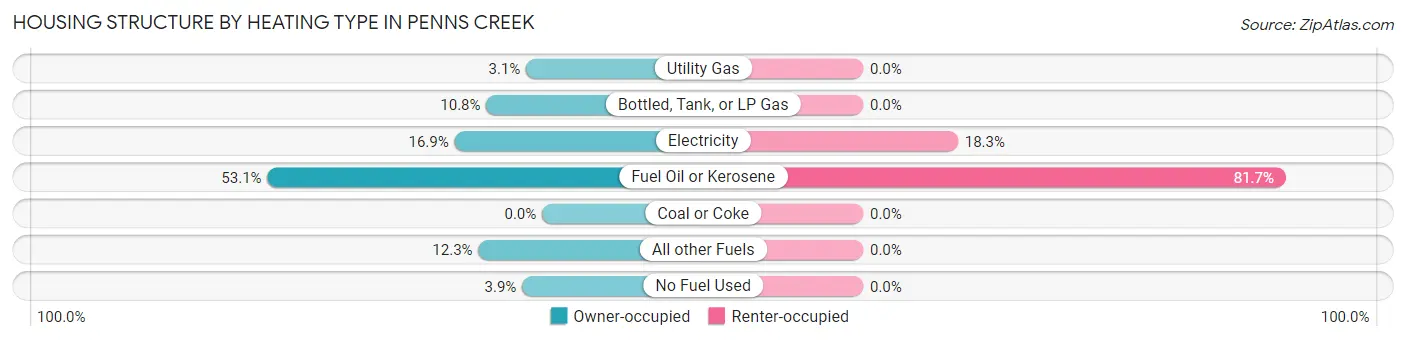
| Heating Type | Owner-occupied | Renter-occupied |
| Utility Gas | 4 (3.1%) | 0 (0.0%) |
| Bottled, Tank, or LP Gas | 14 (10.8%) | 0 (0.0%) |
| Electricity | 22 (16.9%) | 26 (18.3%) |
| Fuel Oil or Kerosene | 69 (53.1%) | 116 (81.7%) |
| Coal or Coke | 0 (0.0%) | 0 (0.0%) |
| All other Fuels | 16 (12.3%) | 0 (0.0%) |
| No Fuel Used | 5 (3.8%) | 0 (0.0%) |
| Total | 130 (100.0%) | 142 (100.0%) |
Household Vehicle Usage in Penns Creek
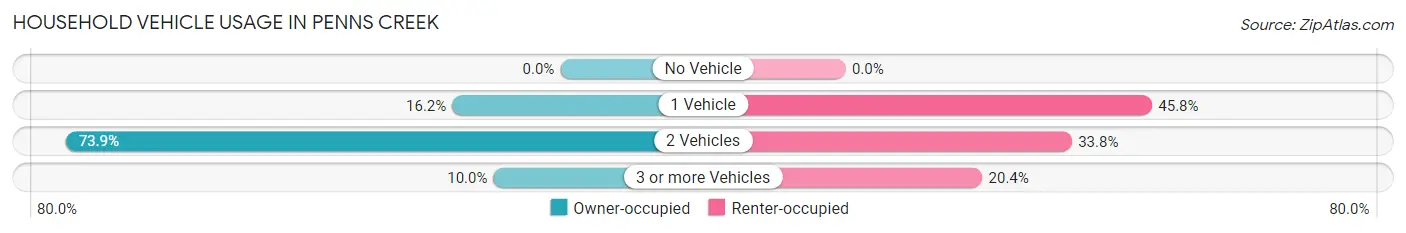
| Vehicles per Household | Owner-occupied | Renter-occupied |
| No Vehicle | 0 (0.0%) | 0 (0.0%) |
| 1 Vehicle | 21 (16.2%) | 65 (45.8%) |
| 2 Vehicles | 96 (73.9%) | 48 (33.8%) |
| 3 or more Vehicles | 13 (10.0%) | 29 (20.4%) |
| Total | 130 (100.0%) | 142 (100.0%) |
Real Estate & Mortgages in Penns Creek
Real Estate and Mortgage Overview in Penns Creek
| Characteristic | Without Mortgage | With Mortgage |
| Housing Units | 87 | 43 |
| Median Property Value | $167,500 | $117,400 |
| Median Household Income | $36,563 | $0 |
| Monthly Housing Costs | $494 | $0 |
| Real Estate Taxes | $1,364 | $5 |
Property Value by Mortgage Status in Penns Creek
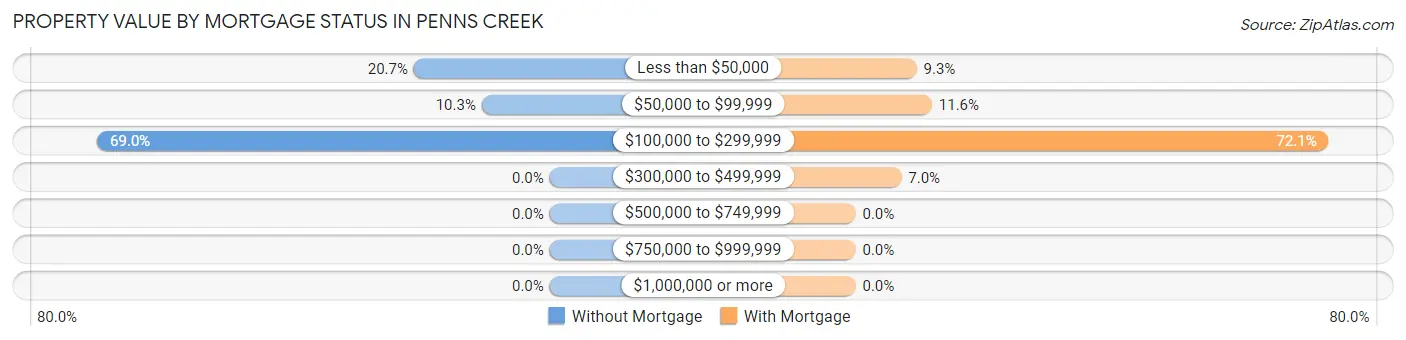
| Property Value | Without Mortgage | With Mortgage |
| Less than $50,000 | 18 (20.7%) | 4 (9.3%) |
| $50,000 to $99,999 | 9 (10.3%) | 5 (11.6%) |
| $100,000 to $299,999 | 60 (69.0%) | 31 (72.1%) |
| $300,000 to $499,999 | 0 (0.0%) | 3 (7.0%) |
| $500,000 to $749,999 | 0 (0.0%) | 0 (0.0%) |
| $750,000 to $999,999 | 0 (0.0%) | 0 (0.0%) |
| $1,000,000 or more | 0 (0.0%) | 0 (0.0%) |
| Total | 87 (100.0%) | 43 (100.0%) |
Household Income by Mortgage Status in Penns Creek
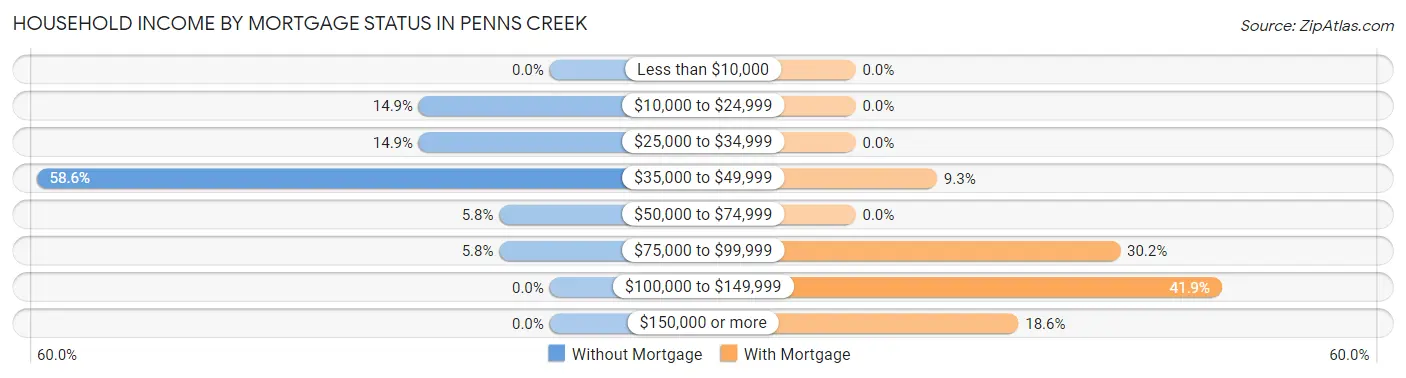
| Household Income | Without Mortgage | With Mortgage |
| Less than $10,000 | 0 (0.0%) | 0 (0.0%) |
| $10,000 to $24,999 | 13 (14.9%) | 0 (0.0%) |
| $25,000 to $34,999 | 13 (14.9%) | 0 (0.0%) |
| $35,000 to $49,999 | 51 (58.6%) | 4 (9.3%) |
| $50,000 to $74,999 | 5 (5.8%) | 0 (0.0%) |
| $75,000 to $99,999 | 5 (5.8%) | 13 (30.2%) |
| $100,000 to $149,999 | 0 (0.0%) | 18 (41.9%) |
| $150,000 or more | 0 (0.0%) | 8 (18.6%) |
| Total | 87 (100.0%) | 43 (100.0%) |
Property Value to Household Income Ratio in Penns Creek
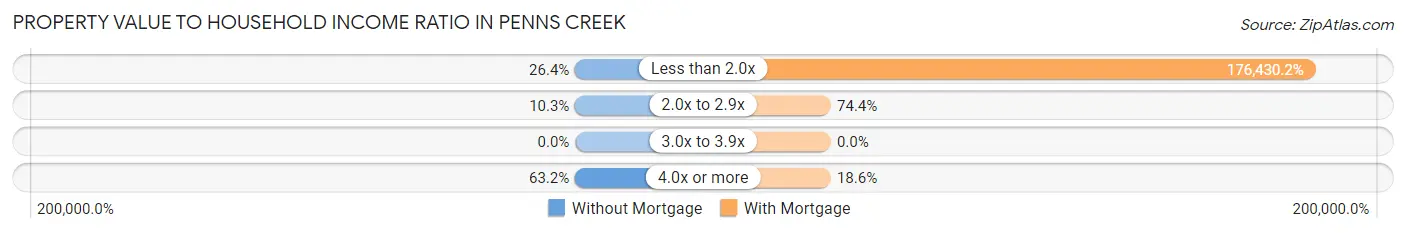
| Value-to-Income Ratio | Without Mortgage | With Mortgage |
| Less than 2.0x | 23 (26.4%) | 75,865 (176,430.2%) |
| 2.0x to 2.9x | 9 (10.3%) | 32 (74.4%) |
| 3.0x to 3.9x | 0 (0.0%) | 0 (0.0%) |
| 4.0x or more | 55 (63.2%) | 8 (18.6%) |
| Total | 87 (100.0%) | 43 (100.0%) |
Real Estate Taxes by Mortgage Status in Penns Creek
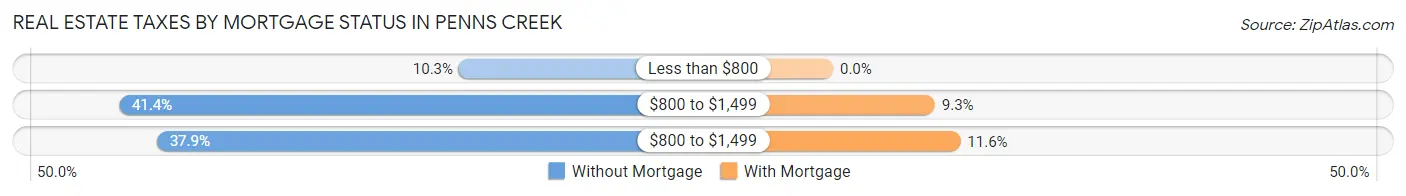
| Property Taxes | Without Mortgage | With Mortgage |
| Less than $800 | 9 (10.3%) | 0 (0.0%) |
| $800 to $1,499 | 36 (41.4%) | 4 (9.3%) |
| $800 to $1,499 | 33 (37.9%) | 5 (11.6%) |
| Total | 87 (100.0%) | 43 (100.0%) |
Health & Disability in Penns Creek
Health Insurance Coverage by Age in Penns Creek
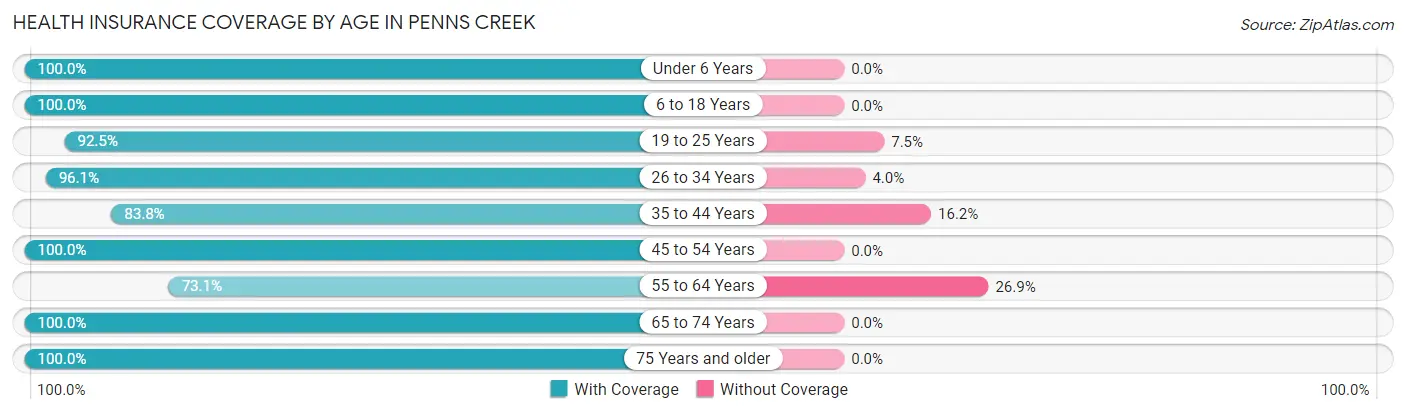
| Age Bracket | With Coverage | Without Coverage |
| Under 6 Years | 42 (100.0%) | 0 (0.0%) |
| 6 to 18 Years | 122 (100.0%) | 0 (0.0%) |
| 19 to 25 Years | 124 (92.5%) | 10 (7.5%) |
| 26 to 34 Years | 73 (96.1%) | 3 (4.0%) |
| 35 to 44 Years | 88 (83.8%) | 17 (16.2%) |
| 45 to 54 Years | 74 (100.0%) | 0 (0.0%) |
| 55 to 64 Years | 87 (73.1%) | 32 (26.9%) |
| 65 to 74 Years | 76 (100.0%) | 0 (0.0%) |
| 75 Years and older | 46 (100.0%) | 0 (0.0%) |
| Total | 732 (92.2%) | 62 (7.8%) |
Health Insurance Coverage by Citizenship Status in Penns Creek
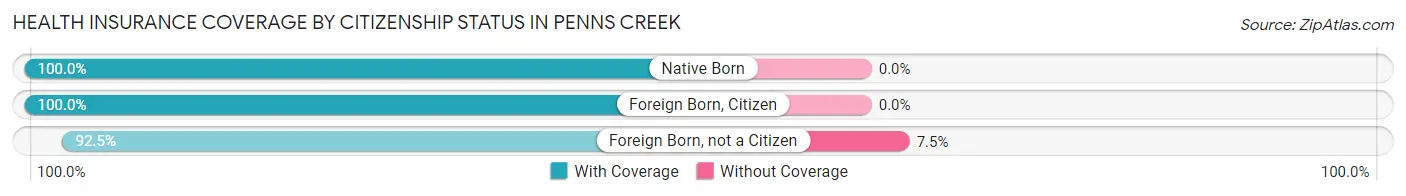
| Citizenship Status | With Coverage | Without Coverage |
| Native Born | 42 (100.0%) | 0 (0.0%) |
| Foreign Born, Citizen | 122 (100.0%) | 0 (0.0%) |
| Foreign Born, not a Citizen | 124 (92.5%) | 10 (7.5%) |
Health Insurance Coverage by Household Income in Penns Creek
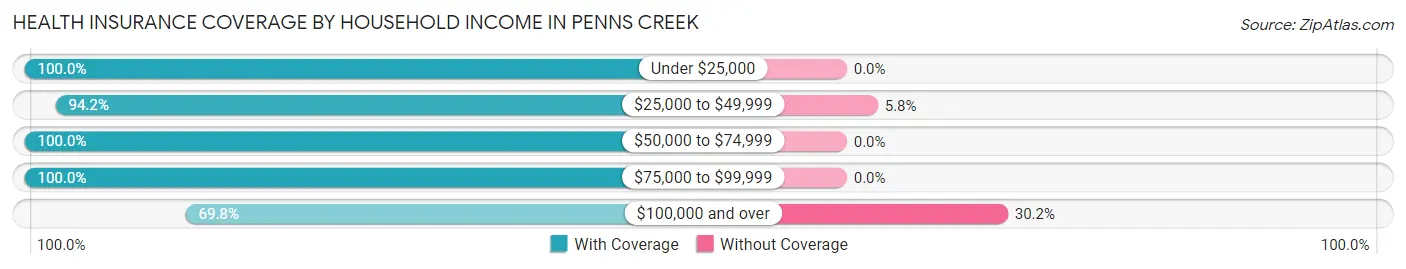
| Household Income | With Coverage | Without Coverage |
| Under $25,000 | 66 (100.0%) | 0 (0.0%) |
| $25,000 to $49,999 | 276 (94.2%) | 17 (5.8%) |
| $50,000 to $74,999 | 101 (100.0%) | 0 (0.0%) |
| $75,000 to $99,999 | 134 (100.0%) | 0 (0.0%) |
| $100,000 and over | 81 (69.8%) | 35 (30.2%) |
Public vs Private Health Insurance Coverage by Age in Penns Creek
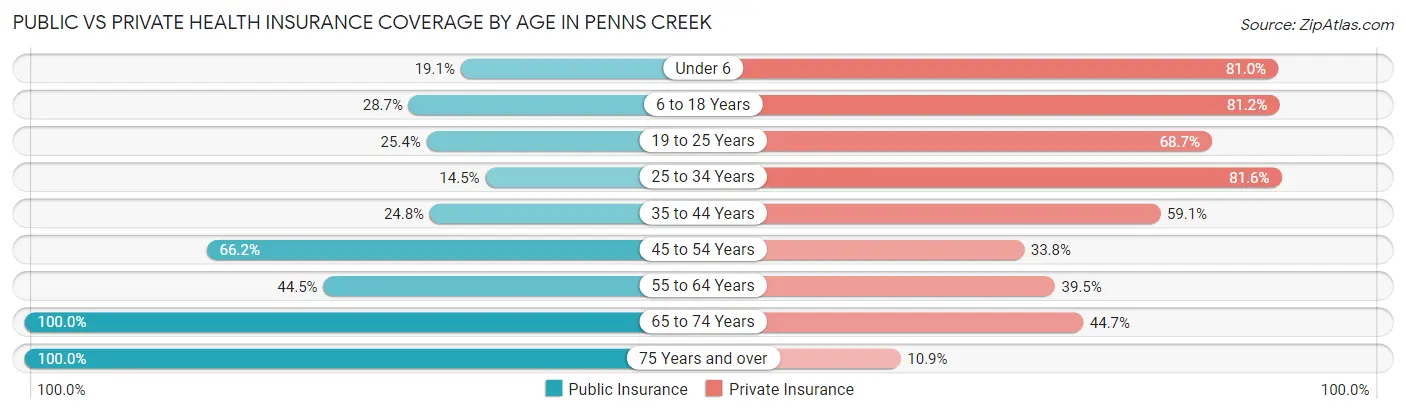
| Age Bracket | Public Insurance | Private Insurance |
| Under 6 | 8 (19.1%) | 34 (80.9%) |
| 6 to 18 Years | 35 (28.7%) | 99 (81.1%) |
| 19 to 25 Years | 34 (25.4%) | 92 (68.7%) |
| 25 to 34 Years | 11 (14.5%) | 62 (81.6%) |
| 35 to 44 Years | 26 (24.8%) | 62 (59.1%) |
| 45 to 54 Years | 49 (66.2%) | 25 (33.8%) |
| 55 to 64 Years | 53 (44.5%) | 47 (39.5%) |
| 65 to 74 Years | 76 (100.0%) | 34 (44.7%) |
| 75 Years and over | 46 (100.0%) | 5 (10.9%) |
| Total | 338 (42.6%) | 460 (57.9%) |
Disability Status by Sex by Age in Penns Creek
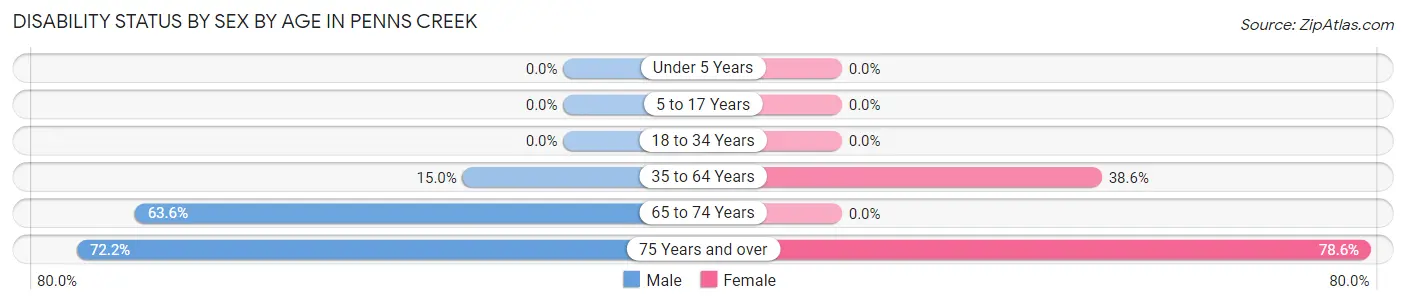
| Age Bracket | Male | Female |
| Under 5 Years | 0 (0.0%) | 0 (0.0%) |
| 5 to 17 Years | 0 (0.0%) | 0 (0.0%) |
| 18 to 34 Years | 0 (0.0%) | 0 (0.0%) |
| 35 to 64 Years | 19 (15.0%) | 66 (38.6%) |
| 65 to 74 Years | 28 (63.6%) | 0 (0.0%) |
| 75 Years and over | 13 (72.2%) | 22 (78.6%) |
Disability Class by Sex by Age in Penns Creek
Disability Class: Hearing Difficulty
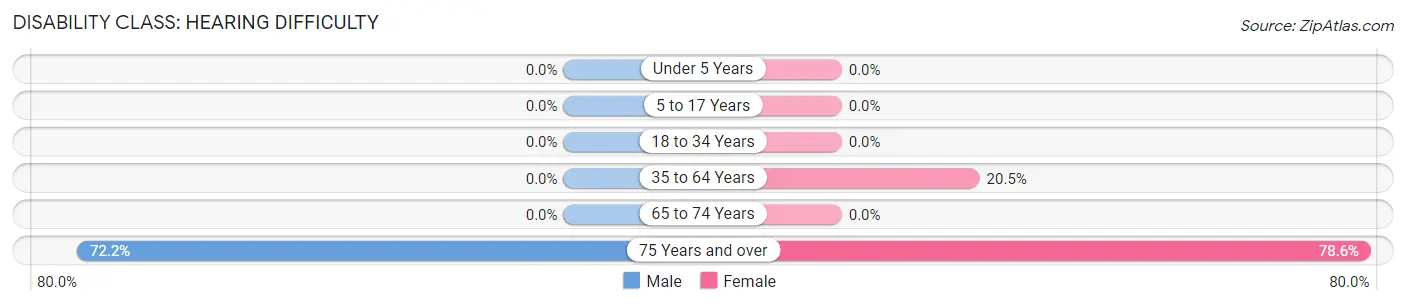
| Age Bracket | Male | Female |
| Under 5 Years | 0 (0.0%) | 0 (0.0%) |
| 5 to 17 Years | 0 (0.0%) | 0 (0.0%) |
| 18 to 34 Years | 0 (0.0%) | 0 (0.0%) |
| 35 to 64 Years | 0 (0.0%) | 35 (20.5%) |
| 65 to 74 Years | 0 (0.0%) | 0 (0.0%) |
| 75 Years and over | 13 (72.2%) | 22 (78.6%) |
Disability Class: Vision Difficulty
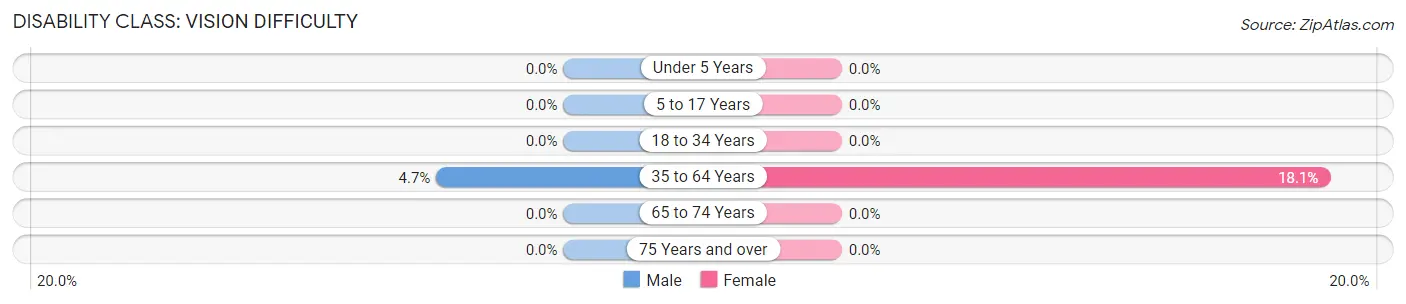
| Age Bracket | Male | Female |
| Under 5 Years | 0 (0.0%) | 0 (0.0%) |
| 5 to 17 Years | 0 (0.0%) | 0 (0.0%) |
| 18 to 34 Years | 0 (0.0%) | 0 (0.0%) |
| 35 to 64 Years | 6 (4.7%) | 31 (18.1%) |
| 65 to 74 Years | 0 (0.0%) | 0 (0.0%) |
| 75 Years and over | 0 (0.0%) | 0 (0.0%) |
Disability Class: Cognitive Difficulty
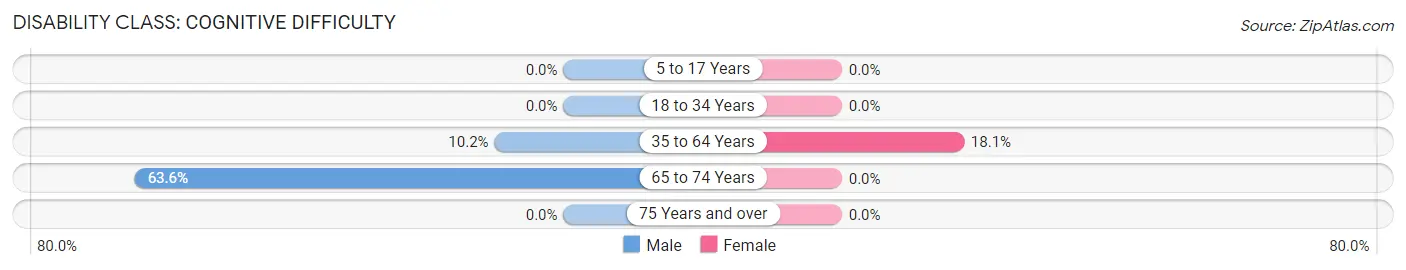
| Age Bracket | Male | Female |
| 5 to 17 Years | 0 (0.0%) | 0 (0.0%) |
| 18 to 34 Years | 0 (0.0%) | 0 (0.0%) |
| 35 to 64 Years | 13 (10.2%) | 31 (18.1%) |
| 65 to 74 Years | 28 (63.6%) | 0 (0.0%) |
| 75 Years and over | 0 (0.0%) | 0 (0.0%) |
Disability Class: Ambulatory Difficulty

| Age Bracket | Male | Female |
| 5 to 17 Years | 0 (0.0%) | 0 (0.0%) |
| 18 to 34 Years | 0 (0.0%) | 0 (0.0%) |
| 35 to 64 Years | 6 (4.7%) | 56 (32.8%) |
| 65 to 74 Years | 0 (0.0%) | 0 (0.0%) |
| 75 Years and over | 13 (72.2%) | 22 (78.6%) |
Disability Class: Self-Care Difficulty
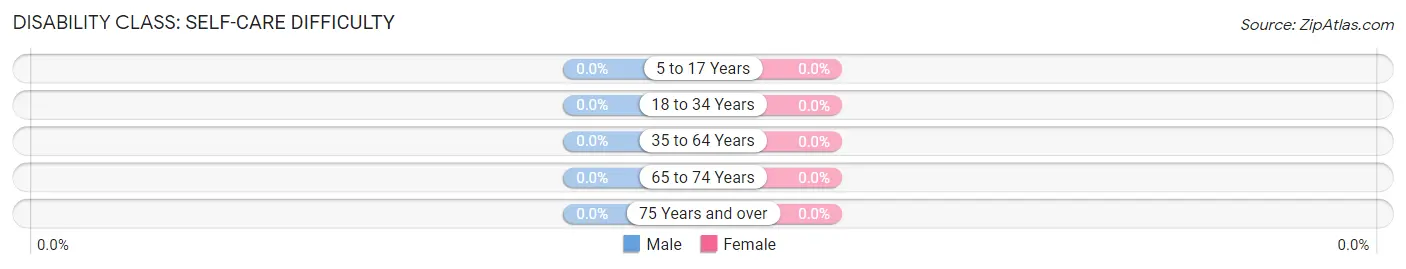
| Age Bracket | Male | Female |
| 5 to 17 Years | 0 (0.0%) | 0 (0.0%) |
| 18 to 34 Years | 0 (0.0%) | 0 (0.0%) |
| 35 to 64 Years | 0 (0.0%) | 0 (0.0%) |
| 65 to 74 Years | 0 (0.0%) | 0 (0.0%) |
| 75 Years and over | 0 (0.0%) | 0 (0.0%) |
Technology Access in Penns Creek
Computing Device Access in Penns Creek
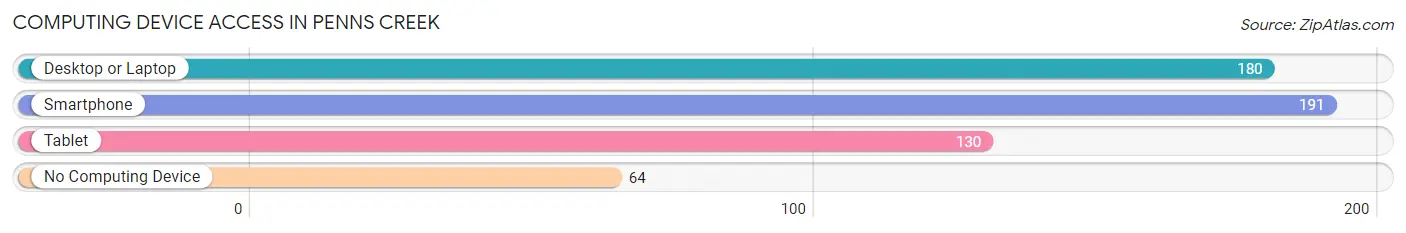
| Device Type | # Households | % Households |
| Desktop or Laptop | 180 | 66.2% |
| Smartphone | 191 | 70.2% |
| Tablet | 130 | 47.8% |
| No Computing Device | 64 | 23.5% |
| Total | 272 | 100.0% |
Internet Access in Penns Creek
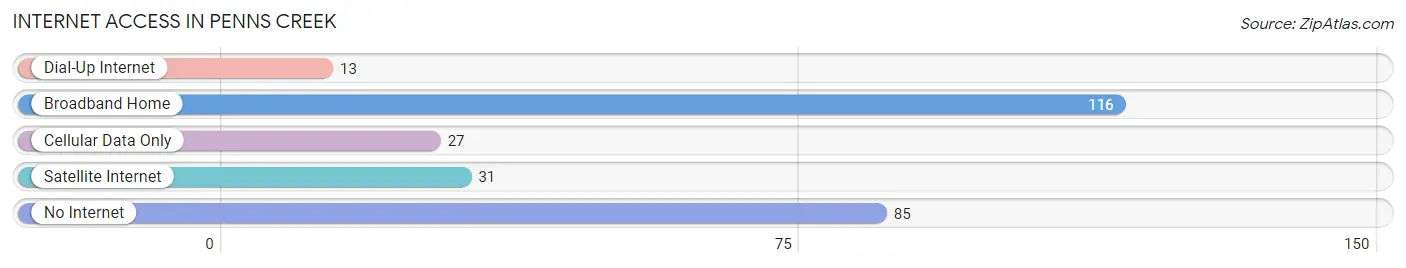
| Internet Type | # Households | % Households |
| Dial-Up Internet | 13 | 4.8% |
| Broadband Home | 116 | 42.6% |
| Cellular Data Only | 27 | 9.9% |
| Satellite Internet | 31 | 11.4% |
| No Internet | 85 | 31.2% |
| Total | 272 | 100.0% |
Penns Creek Summary
Penns Creek is a small borough located in Snyder County, Pennsylvania. It is situated along the banks of Penns Creek, a tributary of the Susquehanna River. The population of Penns Creek was 545 at the 2010 census.
History
The area that is now Penns Creek was first settled in 1755 by German immigrants. The town was originally known as “Friedenshütten”, which translates to “Peace Hut”. The town was renamed Penns Creek in 1820, after the creek that runs through it.
The town was an important stop on the Underground Railroad, with many of the town’s residents helping to hide and transport escaped slaves. The town was also the site of a Civil War battle in 1863, when Confederate troops attempted to cross the creek. The Union forces were able to repel the attack and the town was spared from destruction.
Geography
Penns Creek is located at 40°45'17" North, 76°51'45" West (40.754722, -76.862500). It is situated along the banks of Penns Creek, a tributary of the Susquehanna River. The town is located in the Ridge and Valley physiographic province of the Appalachian Mountains.
The town has a total area of 0.3 square miles, all of which is land. The elevation of the town is 590 feet above sea level.
Economy
The economy of Penns Creek is largely based on agriculture. The town is home to several farms, which produce a variety of crops, including corn, soybeans, wheat, and hay. The town is also home to several small businesses, including a hardware store, a grocery store, and a restaurant.
Demographics
As of the 2010 census, the population of Penns Creek was 545. The racial makeup of the town was 97.3% White, 0.7% African American, 0.2% Native American, 0.2% Asian, and 1.6% from two or more races. The median household income was $41,250, and the median family income was $50,000.
The town is served by the Midd-West School District. The town is home to the Penns Creek Elementary School, which serves students in grades K-6. The town is also home to the Midd-West High School, which serves students in grades 7-12.
Conclusion
Penns Creek is a small borough located in Snyder County, Pennsylvania. It is situated along the banks of Penns Creek, a tributary of the Susquehanna River. The town has a long history, dating back to the 18th century, and has been an important stop on the Underground Railroad. The economy of the town is largely based on agriculture, and the town is served by the Midd-West School District. The population of Penns Creek was 545 at the 2010 census.
Common Questions
What is Per Capita Income in Penns Creek?
Per Capita income in Penns Creek is $20,238.
What is the Median Family Income in Penns Creek?
Median Family Income in Penns Creek is $44,868.
What is the Median Household income in Penns Creek?
Median Household Income in Penns Creek is $48,145.
What is Family Income Deficit in Penns Creek?
Family Income Deficit in Penns Creek is $4,833.
Families that are below poverty line in Penns Creek earn $4,833 less on average than the poverty threshold level.
What is Inequality or Gini Index in Penns Creek?
Inequality or Gini Index in Penns Creek is 0.34.
What is the Total Population of Penns Creek?
Total Population of Penns Creek is 794.
What is the Total Male Population of Penns Creek?
Total Male Population of Penns Creek is 383.
What is the Total Female Population of Penns Creek?
Total Female Population of Penns Creek is 411.
What is the Ratio of Males per 100 Females in Penns Creek?
There are 93.19 Males per 100 Females in Penns Creek.
What is the Ratio of Females per 100 Males in Penns Creek?
There are 107.31 Females per 100 Males in Penns Creek.
What is the Median Population Age in Penns Creek?
Median Population Age in Penns Creek is 39.3 Years.
What is the Average Family Size in Penns Creek
Average Family Size in Penns Creek is 2.8 People.
What is the Average Household Size in Penns Creek
Average Household Size in Penns Creek is 2.6 People.
How Large is the Labor Force in Penns Creek?
There are 412 People in the Labor Forcein in Penns Creek.
What is the Percentage of People in the Labor Force in Penns Creek?
59.9% of People are in the Labor Force in Penns Creek.
What is the Unemployment Rate in Penns Creek?
Unemployment Rate in Penns Creek is 7.5%.