Zip Codes with the Highest Percentage of Population Employed in Arts, Entertainment & Recreation in Norristown, PA
RELATED REPORTS & OPTIONS
Arts, Entertainment & Recreation
Norristown
Compare Zip Codes
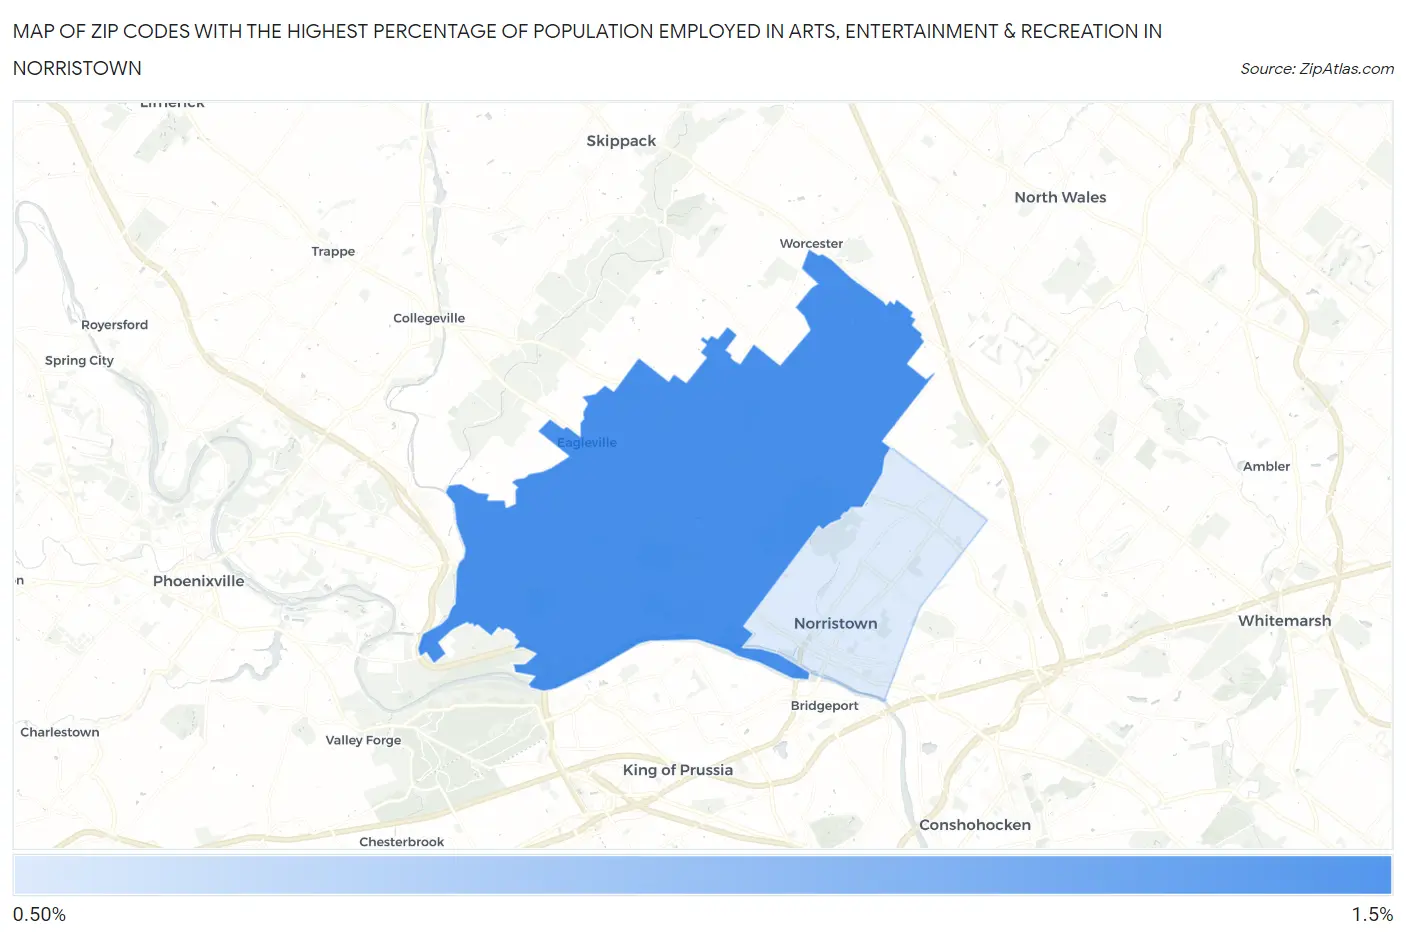
Map of Zip Codes with the Highest Percentage of Population Employed in Arts, Entertainment & Recreation in Norristown
0.76%
1.4%
Zip Codes with the Highest Percentage of Population Employed in Arts, Entertainment & Recreation in Norristown, PA
| Zip Code | % Employed | vs State | vs National | |
| 1. | 19403 | 1.4% | 1.8%(-0.391)#659 | 2.1%(-0.674)#13,928 |
| 2. | 19401 | 0.76% | 1.8%(-1.03)#934 | 2.1%(-1.32)#18,653 |
1
Common Questions
What are the Top Zip Codes with the Highest Percentage of Population Employed in Arts, Entertainment & Recreation in Norristown, PA?
Top Zip Codes with the Highest Percentage of Population Employed in Arts, Entertainment & Recreation in Norristown, PA are:
What zip code has the Highest Percentage of Population Employed in Arts, Entertainment & Recreation in Norristown, PA?
19403 has the Highest Percentage of Population Employed in Arts, Entertainment & Recreation in Norristown, PA with 1.4%.
What is the Percentage of Population Employed in Arts, Entertainment & Recreation in Pennsylvania?
Percentage of Population Employed in Arts, Entertainment & Recreation in Pennsylvania is 1.8%.
What is the Percentage of Population Employed in Arts, Entertainment & Recreation in the United States?
Percentage of Population Employed in Arts, Entertainment & Recreation in the United States is 2.1%.