New Columbia, PA Map & Demographics
New Columbia Map
New Columbia Overview
$35,210
PER CAPITA INCOME
$90,096
AVG FAMILY INCOME
$56,500
AVG HOUSEHOLD INCOME
63.6%
WAGE / INCOME GAP [ % ]
36.4¢/ $1
WAGE / INCOME GAP [ $ ]
0.37
INEQUALITY / GINI INDEX
855
TOTAL POPULATION
362
MALE POPULATION
493
FEMALE POPULATION
73.43
MALES / 100 FEMALES
136.19
FEMALES / 100 MALES
56.1
MEDIAN AGE
2.4
AVG FAMILY SIZE
2.0
AVG HOUSEHOLD SIZE
488
LABOR FORCE [ PEOPLE ]
62.3%
PERCENT IN LABOR FORCE
New Columbia Zip Codes
New Columbia Area Codes
Income in New Columbia
Income Overview in New Columbia
Per Capita Income in New Columbia is $35,210, while median incomes of families and households are $90,096 and $56,500 respectively.
| Characteristic | Number | Measure |
| Per Capita Income | 855 | $35,210 |
| Median Family Income | 295 | $90,096 |
| Mean Family Income | 295 | $88,108 |
| Median Household Income | 426 | $56,500 |
| Mean Household Income | 426 | $70,372 |
| Income Deficit | 295 | $0 |
| Wage / Income Gap (%) | 855 | 63.55% |
| Wage / Income Gap ($) | 855 | 36.45¢ per $1 |
| Gini / Inequality Index | 855 | 0.37 |
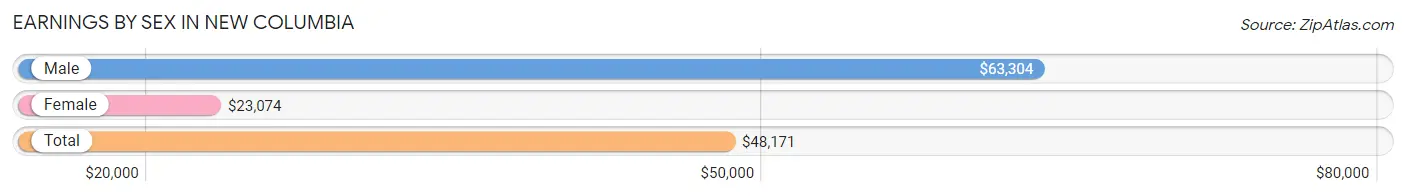
Earnings by Sex in New Columbia
Average Earnings in New Columbia are $48,171, $63,304 for men and $23,074 for women, a difference of 63.5%.
| Sex | Number | Average Earnings |
| Male | 245 (46.2%) | $63,304 |
| Female | 285 (53.8%) | $23,074 |
| Total | 530 (100.0%) | $48,171 |
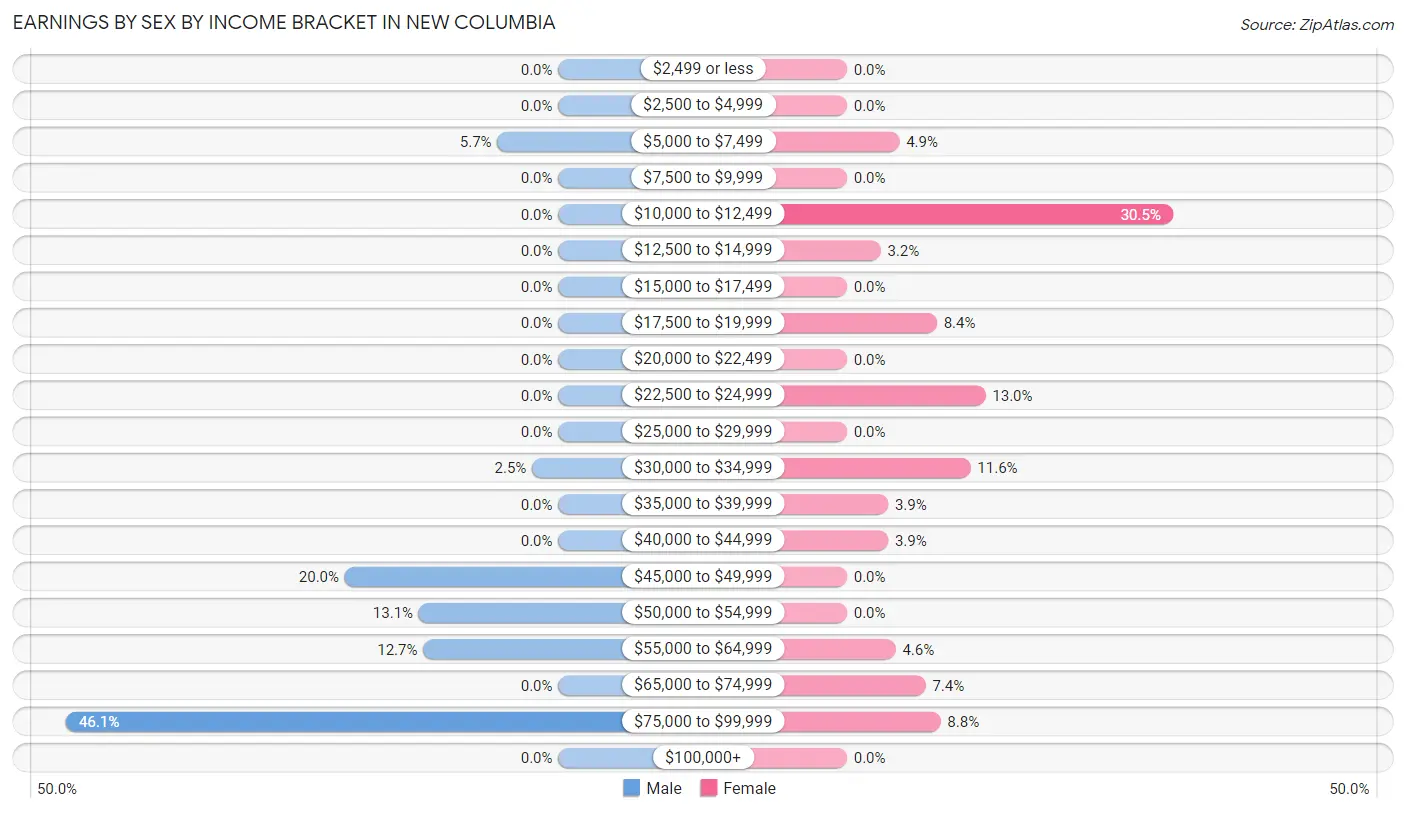
Earnings by Sex by Income Bracket in New Columbia
The most common earnings brackets in New Columbia are $75,000 to $99,999 for men (113 | 46.1%) and $10,000 to $12,499 for women (87 | 30.5%).
| Income | Male | Female |
| $2,499 or less | 0 (0.0%) | 0 (0.0%) |
| $2,500 to $4,999 | 0 (0.0%) | 0 (0.0%) |
| $5,000 to $7,499 | 14 (5.7%) | 14 (4.9%) |
| $7,500 to $9,999 | 0 (0.0%) | 0 (0.0%) |
| $10,000 to $12,499 | 0 (0.0%) | 87 (30.5%) |
| $12,500 to $14,999 | 0 (0.0%) | 9 (3.2%) |
| $15,000 to $17,499 | 0 (0.0%) | 0 (0.0%) |
| $17,500 to $19,999 | 0 (0.0%) | 24 (8.4%) |
| $20,000 to $22,499 | 0 (0.0%) | 0 (0.0%) |
| $22,500 to $24,999 | 0 (0.0%) | 37 (13.0%) |
| $25,000 to $29,999 | 0 (0.0%) | 0 (0.0%) |
| $30,000 to $34,999 | 6 (2.5%) | 33 (11.6%) |
| $35,000 to $39,999 | 0 (0.0%) | 11 (3.9%) |
| $40,000 to $44,999 | 0 (0.0%) | 11 (3.9%) |
| $45,000 to $49,999 | 49 (20.0%) | 0 (0.0%) |
| $50,000 to $54,999 | 32 (13.1%) | 0 (0.0%) |
| $55,000 to $64,999 | 31 (12.7%) | 13 (4.6%) |
| $65,000 to $74,999 | 0 (0.0%) | 21 (7.4%) |
| $75,000 to $99,999 | 113 (46.1%) | 25 (8.8%) |
| $100,000+ | 0 (0.0%) | 0 (0.0%) |
| Total | 245 (100.0%) | 285 (100.0%) |
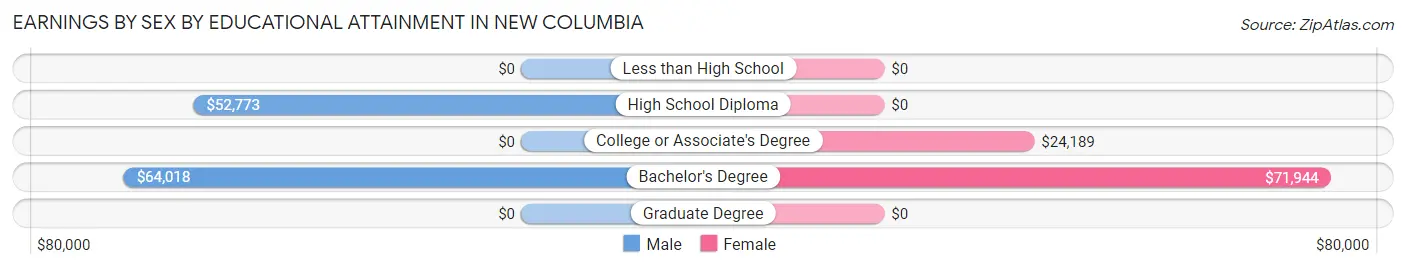
Earnings by Sex by Educational Attainment in New Columbia
Average earnings in New Columbia are $63,839 for men and $23,682 for women, a difference of 62.9%. Men with an educational attainment of bachelor's degree enjoy the highest average annual earnings of $64,018, while those with high school diploma education earn the least with $52,773. Women with an educational attainment of bachelor's degree earn the most with the average annual earnings of $71,944, while those with college or associate's degree education have the smallest earnings of $24,189.
| Educational Attainment | Male Income | Female Income |
| Less than High School | - | - |
| High School Diploma | $52,773 | $0 |
| College or Associate's Degree | - | - |
| Bachelor's Degree | $64,018 | $71,944 |
| Graduate Degree | - | - |
| Total | $63,839 | $23,682 |
Family Income in New Columbia
Family Income Brackets in New Columbia
According to the New Columbia family income data, there are 118 families falling into the $100,000 to $149,999 income range, which is the most common income bracket and makes up 40.0% of all families.
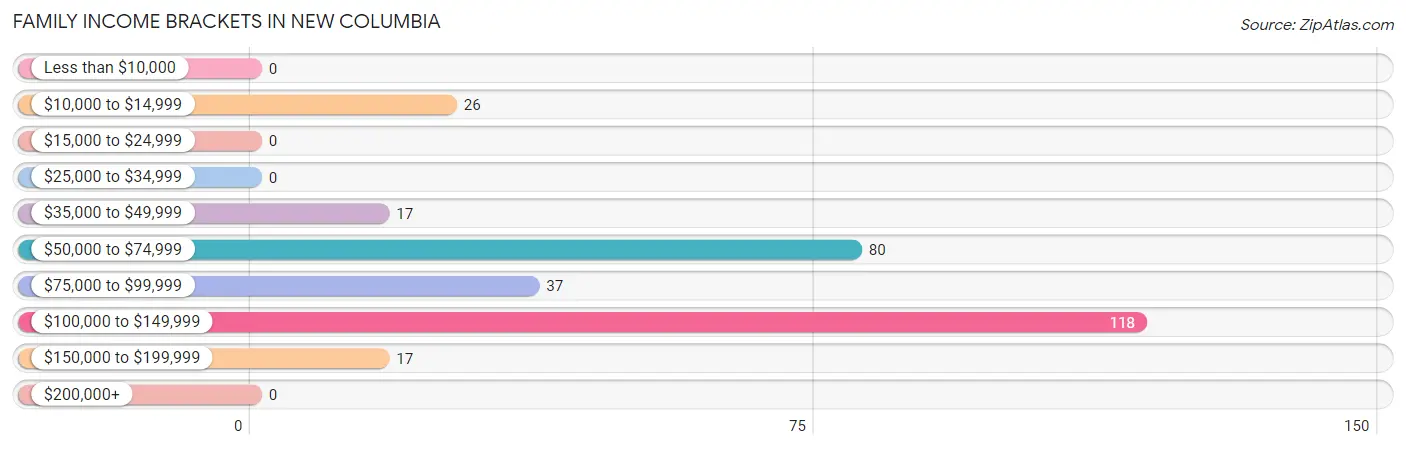
| Income Bracket | # Families | % Families |
| Less than $10,000 | 0 | 0.0% |
| $10,000 to $14,999 | 26 | 8.8% |
| $15,000 to $24,999 | 0 | 0.0% |
| $25,000 to $34,999 | 0 | 0.0% |
| $35,000 to $49,999 | 17 | 5.8% |
| $50,000 to $74,999 | 80 | 27.1% |
| $75,000 to $99,999 | 37 | 12.5% |
| $100,000 to $149,999 | 118 | 40.0% |
| $150,000 to $199,999 | 17 | 5.8% |
| $200,000+ | 0 | 0.0% |
Family Income by Famaliy Size in New Columbia
3-person families (43 | 14.6%) account for the highest median family income in New Columbia with $146,635 per family, while 3-person families (43 | 14.6%) have the highest median income of $48,878 per family member.
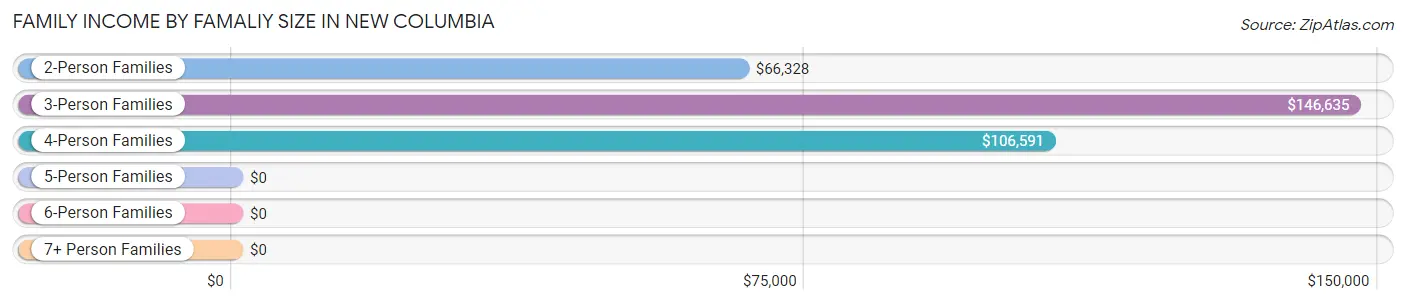
| Income Bracket | # Families | Median Income |
| 2-Person Families | 216 (73.2%) | $66,328 |
| 3-Person Families | 43 (14.6%) | $146,635 |
| 4-Person Families | 36 (12.2%) | $106,591 |
| 5-Person Families | 0 (0.0%) | $0 |
| 6-Person Families | 0 (0.0%) | $0 |
| 7+ Person Families | 0 (0.0%) | $0 |
| Total | 295 (100.0%) | $90,096 |
Family Income by Number of Earners in New Columbia
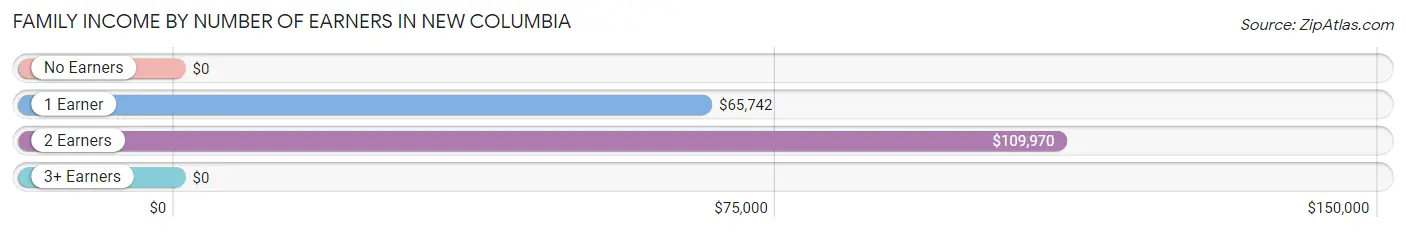
| Number of Earners | # Families | Median Income |
| No Earners | 65 (22.0%) | $0 |
| 1 Earner | 71 (24.1%) | $65,742 |
| 2 Earners | 131 (44.4%) | $109,970 |
| 3+ Earners | 28 (9.5%) | $0 |
| Total | 295 (100.0%) | $90,096 |
Household Income in New Columbia
Household Income Brackets in New Columbia
With 118 households falling in the category, the $100,000 to $149,999 income range is the most frequent in New Columbia, accounting for 27.7% of all households.
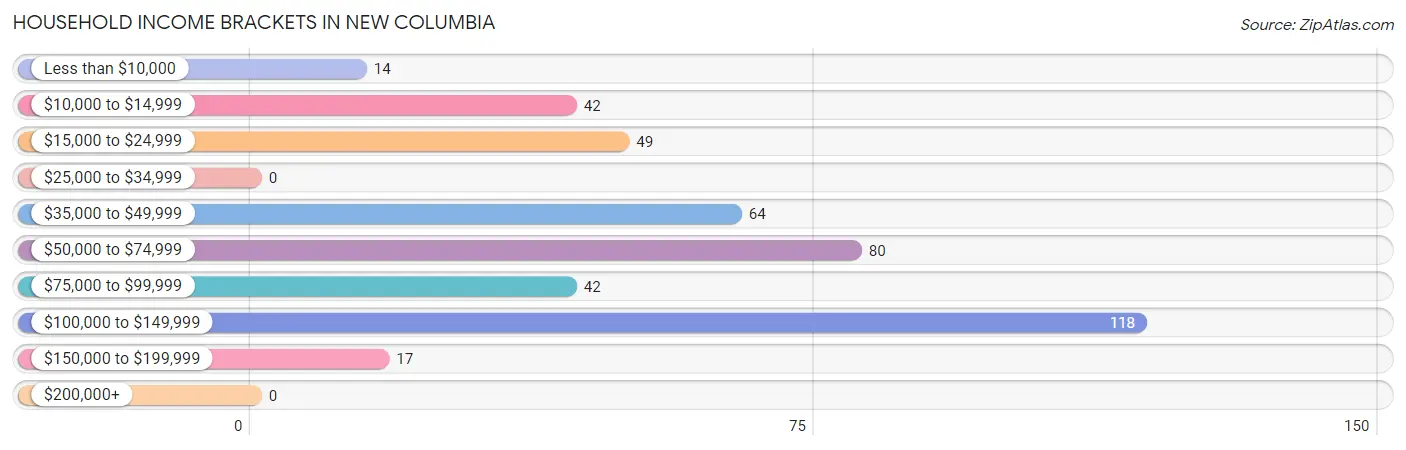
| Income Bracket | # Households | % Households |
| Less than $10,000 | 14 | 3.3% |
| $10,000 to $14,999 | 42 | 9.9% |
| $15,000 to $24,999 | 49 | 11.5% |
| $25,000 to $34,999 | 0 | 0.0% |
| $35,000 to $49,999 | 64 | 15.0% |
| $50,000 to $74,999 | 80 | 18.8% |
| $75,000 to $99,999 | 42 | 9.9% |
| $100,000 to $149,999 | 118 | 27.7% |
| $150,000 to $199,999 | 17 | 4.0% |
| $200,000+ | 0 | 0.0% |
Household Income by Householder Age in New Columbia
The median household income in New Columbia is $56,500, with the highest median household income of $107,798 found in the 45 to 64 years age bracket for the primary householder. A total of 204 households (47.9%) fall into this category. Meanwhile, the 15 to 24 years age bracket for the primary householder has the lowest median household income of $0, with 6 households (1.4%) in this group.
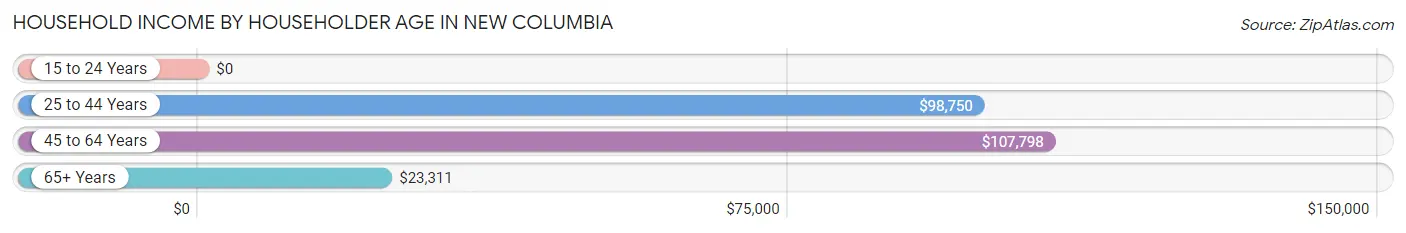
| Income Bracket | # Households | Median Income |
| 15 to 24 Years | 6 (1.4%) | $0 |
| 25 to 44 Years | 56 (13.2%) | $98,750 |
| 45 to 64 Years | 204 (47.9%) | $107,798 |
| 65+ Years | 160 (37.6%) | $23,311 |
| Total | 426 (100.0%) | $56,500 |
Poverty in New Columbia
Income Below Poverty by Sex and Age in New Columbia
With 8.3% poverty level for males and 13.4% for females among the residents of New Columbia, 25 to 34 year old males and 75 year old and over females are the most vulnerable to poverty, with 30 males (34.5%) and 14 females (53.8%) in their respective age groups living below the poverty level.
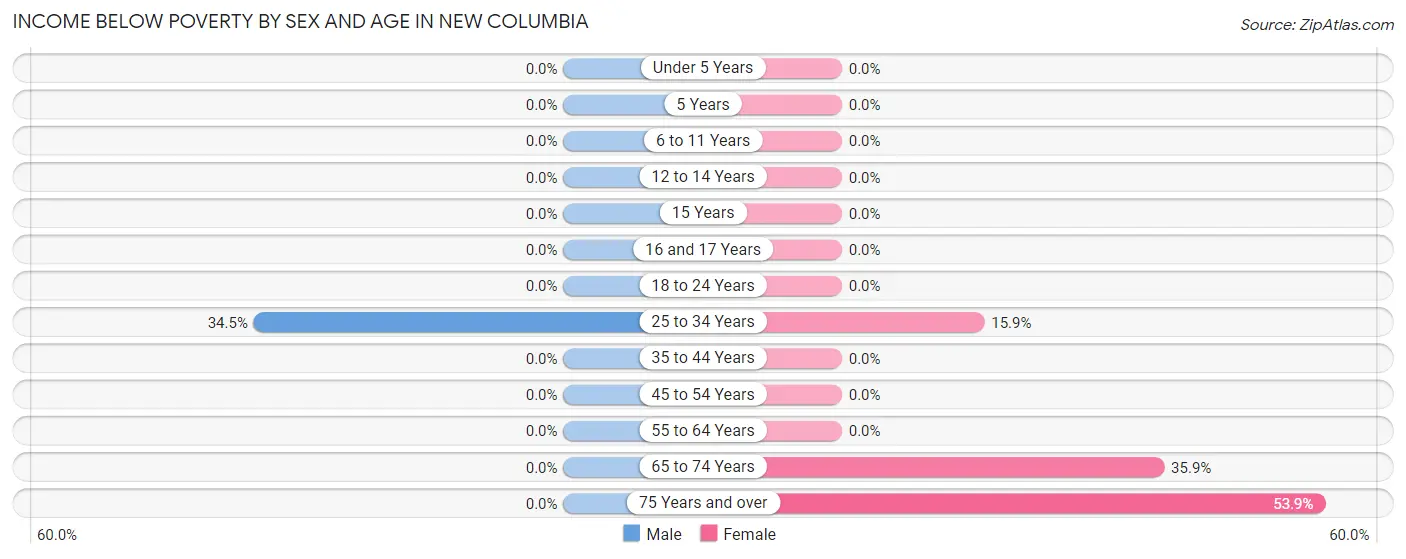
| Age Bracket | Male | Female |
| Under 5 Years | 0 (0.0%) | 0 (0.0%) |
| 5 Years | 0 (0.0%) | 0 (0.0%) |
| 6 to 11 Years | 0 (0.0%) | 0 (0.0%) |
| 12 to 14 Years | 0 (0.0%) | 0 (0.0%) |
| 15 Years | 0 (0.0%) | 0 (0.0%) |
| 16 and 17 Years | 0 (0.0%) | 0 (0.0%) |
| 18 to 24 Years | 0 (0.0%) | 0 (0.0%) |
| 25 to 34 Years | 30 (34.5%) | 10 (15.9%) |
| 35 to 44 Years | 0 (0.0%) | 0 (0.0%) |
| 45 to 54 Years | 0 (0.0%) | 0 (0.0%) |
| 55 to 64 Years | 0 (0.0%) | 0 (0.0%) |
| 65 to 74 Years | 0 (0.0%) | 42 (35.9%) |
| 75 Years and over | 0 (0.0%) | 14 (53.8%) |
| Total | 30 (8.3%) | 66 (13.4%) |
Income Above Poverty by Sex and Age in New Columbia
According to the poverty statistics in New Columbia, males aged under 5 years and females aged under 5 years are the age groups that are most secure financially, with 100.0% of males and 100.0% of females in these age groups living above the poverty line.
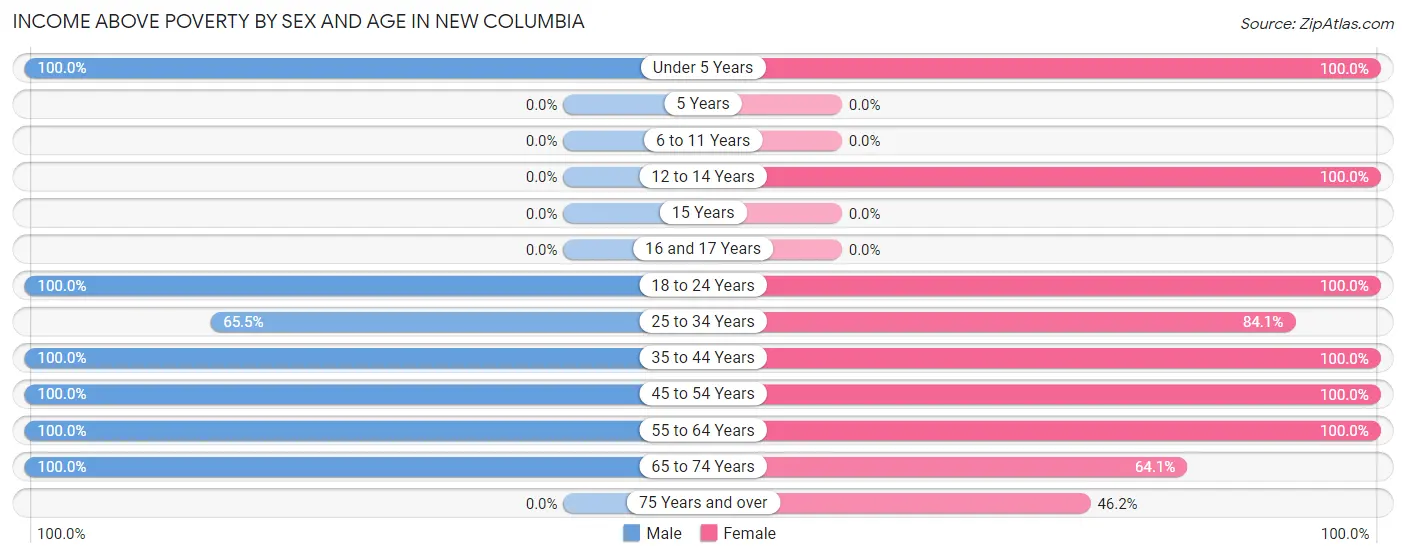
| Age Bracket | Male | Female |
| Under 5 Years | 9 (100.0%) | 39 (100.0%) |
| 5 Years | 0 (0.0%) | 0 (0.0%) |
| 6 to 11 Years | 0 (0.0%) | 0 (0.0%) |
| 12 to 14 Years | 0 (0.0%) | 24 (100.0%) |
| 15 Years | 0 (0.0%) | 0 (0.0%) |
| 16 and 17 Years | 0 (0.0%) | 0 (0.0%) |
| 18 to 24 Years | 6 (100.0%) | 33 (100.0%) |
| 25 to 34 Years | 57 (65.5%) | 53 (84.1%) |
| 35 to 44 Years | 13 (100.0%) | 36 (100.0%) |
| 45 to 54 Years | 80 (100.0%) | 29 (100.0%) |
| 55 to 64 Years | 112 (100.0%) | 126 (100.0%) |
| 65 to 74 Years | 55 (100.0%) | 75 (64.1%) |
| 75 Years and over | 0 (0.0%) | 12 (46.2%) |
| Total | 332 (91.7%) | 427 (86.6%) |
Income Below Poverty Among Married-Couple Families in New Columbia
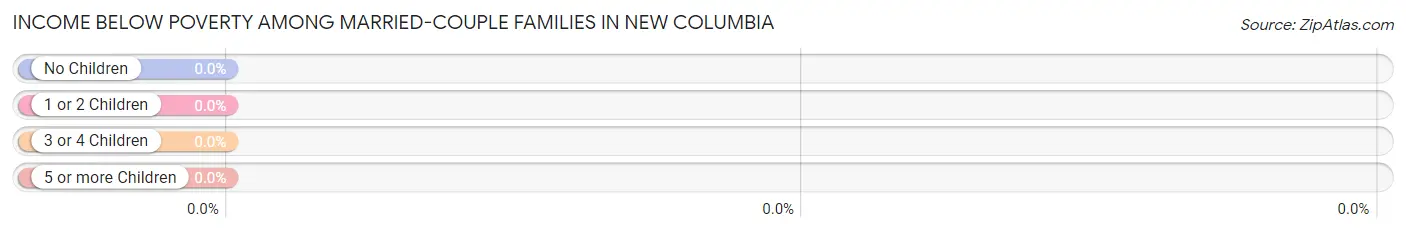
| Children | Above Poverty | Below Poverty |
| No Children | 220 (100.0%) | 0 (0.0%) |
| 1 or 2 Children | 38 (100.0%) | 0 (0.0%) |
| 3 or 4 Children | 0 (0.0%) | 0 (0.0%) |
| 5 or more Children | 0 (0.0%) | 0 (0.0%) |
| Total | 258 (100.0%) | 0 (0.0%) |
Income Below Poverty Among Single-Parent Households in New Columbia
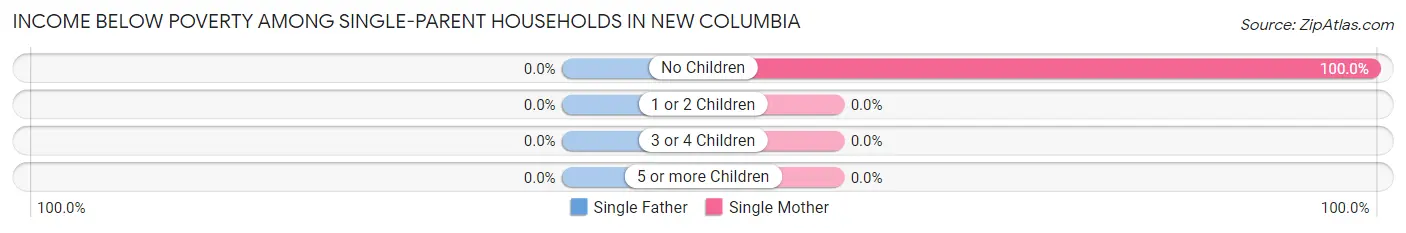
| Children | Single Father | Single Mother |
| No Children | 0 (0.0%) | 26 (100.0%) |
| 1 or 2 Children | 0 (0.0%) | 0 (0.0%) |
| 3 or 4 Children | 0 (0.0%) | 0 (0.0%) |
| 5 or more Children | 0 (0.0%) | 0 (0.0%) |
| Total | 0 (0.0%) | 26 (70.3%) |
Income Below Poverty Among Married-Couple vs Single-Parent Households in New Columbia
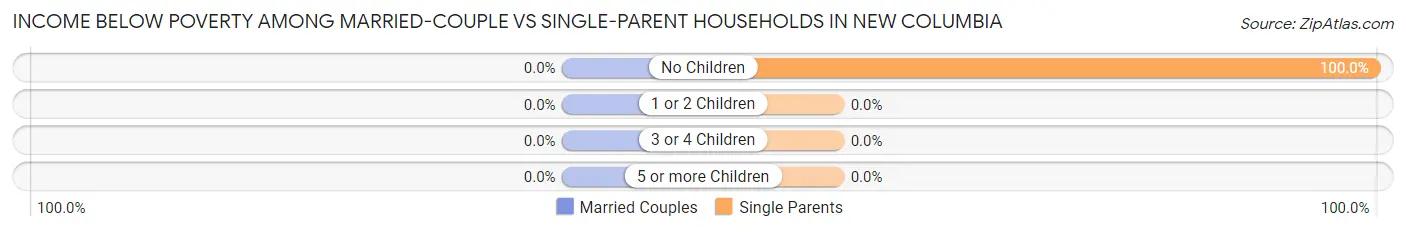
| Children | Married-Couple Families | Single-Parent Households |
| No Children | 0 (0.0%) | 26 (100.0%) |
| 1 or 2 Children | 0 (0.0%) | 0 (0.0%) |
| 3 or 4 Children | 0 (0.0%) | 0 (0.0%) |
| 5 or more Children | 0 (0.0%) | 0 (0.0%) |
| Total | 0 (0.0%) | 26 (70.3%) |
Race in New Columbia
The most populous races in New Columbia are , and White / Caucasian (855 | 100.0%).
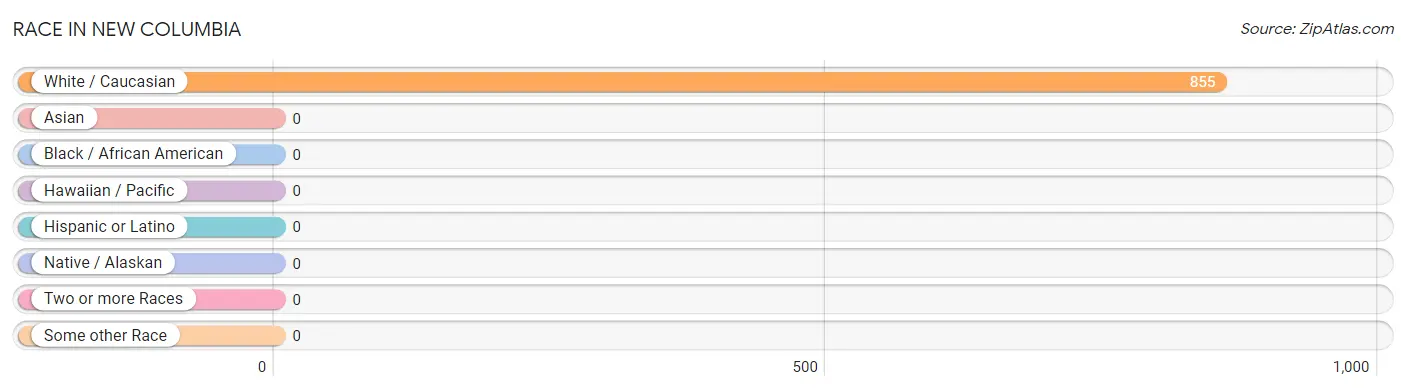
| Race | # Population | % Population |
| Asian | 0 | 0.0% |
| Black / African American | 0 | 0.0% |
| Hawaiian / Pacific | 0 | 0.0% |
| Hispanic or Latino | 0 | 0.0% |
| Native / Alaskan | 0 | 0.0% |
| White / Caucasian | 855 | 100.0% |
| Two or more Races | 0 | 0.0% |
| Some other Race | 0 | 0.0% |
| Total | 855 | 100.0% |
Ancestry in New Columbia
The most populous ancestries reported in New Columbia are German (335 | 39.2%), Irish (69 | 8.1%), American (62 | 7.2%), Norwegian (61 | 7.1%), and Pennsylvania German (56 | 6.6%), together accounting for 68.2% of all New Columbia residents.
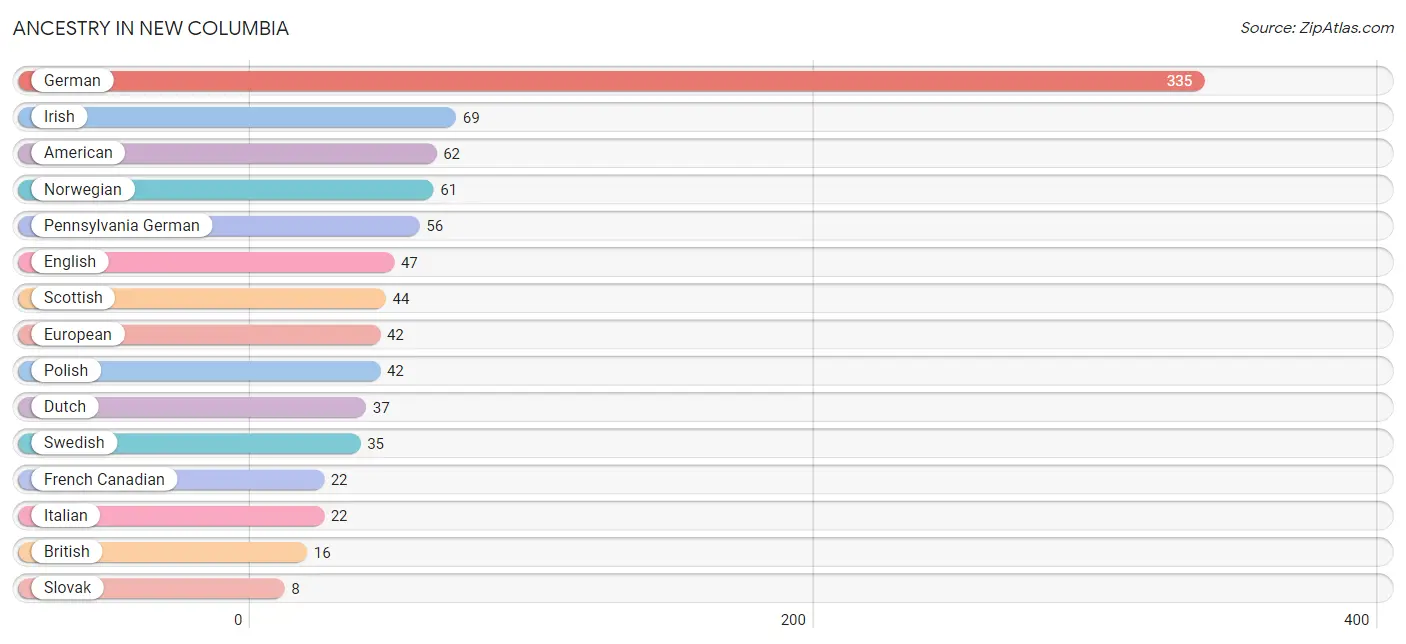
| Ancestry | # Population | % Population |
| American | 62 | 7.2% |
| British | 16 | 1.9% |
| Dutch | 37 | 4.3% |
| English | 47 | 5.5% |
| European | 42 | 4.9% |
| French Canadian | 22 | 2.6% |
| German | 335 | 39.2% |
| Irish | 69 | 8.1% |
| Italian | 22 | 2.6% |
| Norwegian | 61 | 7.1% |
| Pennsylvania German | 56 | 6.6% |
| Polish | 42 | 4.9% |
| Scottish | 44 | 5.1% |
| Slovak | 8 | 0.9% |
| Swedish | 35 | 4.1% |
| Welsh | 5 | 0.6% | View All 16 Rows |
Immigrants in New Columbia

| Immigration Origin | # Population | % Population | View All 0 Rows |
Sex and Age in New Columbia
Sex and Age in New Columbia
The most populous age groups in New Columbia are 30 to 34 Years (87 | 24.0%) for men and 65 to 69 Years (108 | 21.9%) for women.
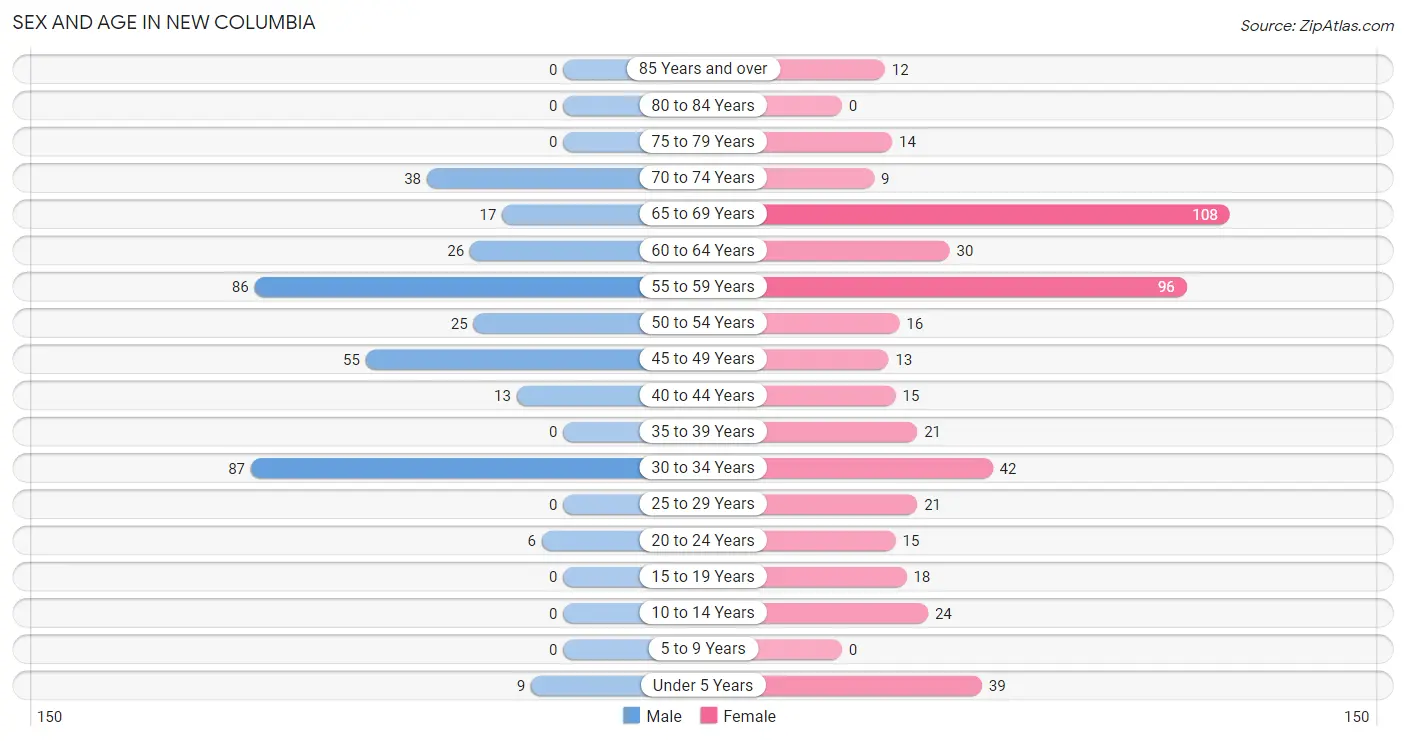
| Age Bracket | Male | Female |
| Under 5 Years | 9 (2.5%) | 39 (7.9%) |
| 5 to 9 Years | 0 (0.0%) | 0 (0.0%) |
| 10 to 14 Years | 0 (0.0%) | 24 (4.9%) |
| 15 to 19 Years | 0 (0.0%) | 18 (3.6%) |
| 20 to 24 Years | 6 (1.7%) | 15 (3.0%) |
| 25 to 29 Years | 0 (0.0%) | 21 (4.3%) |
| 30 to 34 Years | 87 (24.0%) | 42 (8.5%) |
| 35 to 39 Years | 0 (0.0%) | 21 (4.3%) |
| 40 to 44 Years | 13 (3.6%) | 15 (3.0%) |
| 45 to 49 Years | 55 (15.2%) | 13 (2.6%) |
| 50 to 54 Years | 25 (6.9%) | 16 (3.3%) |
| 55 to 59 Years | 86 (23.8%) | 96 (19.5%) |
| 60 to 64 Years | 26 (7.2%) | 30 (6.1%) |
| 65 to 69 Years | 17 (4.7%) | 108 (21.9%) |
| 70 to 74 Years | 38 (10.5%) | 9 (1.8%) |
| 75 to 79 Years | 0 (0.0%) | 14 (2.8%) |
| 80 to 84 Years | 0 (0.0%) | 0 (0.0%) |
| 85 Years and over | 0 (0.0%) | 12 (2.4%) |
| Total | 362 (100.0%) | 493 (100.0%) |
Families and Households in New Columbia
Median Family Size in New Columbia
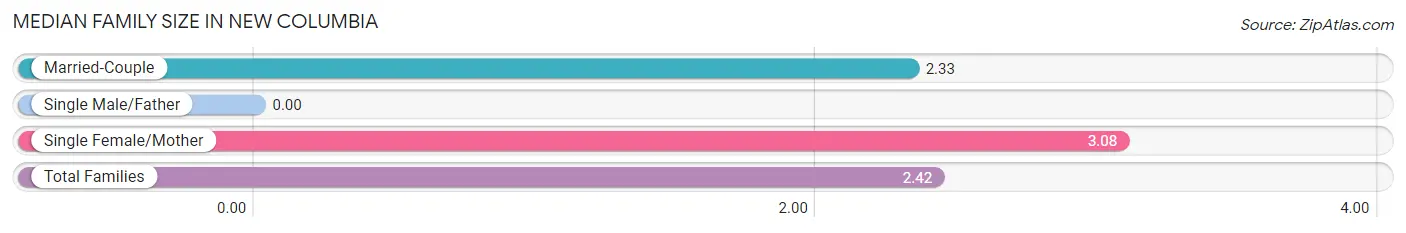
| Family Type | # Families | Family Size |
| Married-Couple | 258 (87.5%) | 2.33 |
| Single Male/Father | 0 (0.0%) | - |
| Single Female/Mother | 37 (12.5%) | 3.08 |
| Total Families | 295 (100.0%) | 2.42 |
Median Household Size in New Columbia
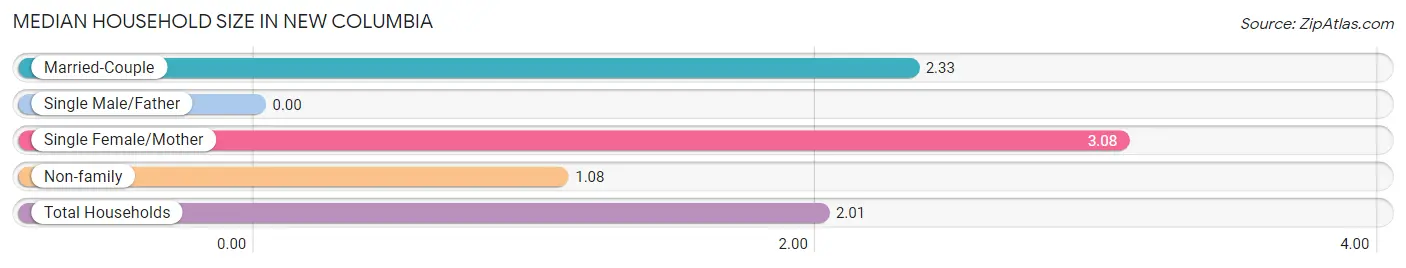
| Household Type | # Households | Household Size |
| Married-Couple | 258 (60.6%) | 2.33 |
| Single Male/Father | 0 (0.0%) | - |
| Single Female/Mother | 37 (8.7%) | 3.08 |
| Non-family | 131 (30.7%) | 1.08 |
| Total Households | 426 (100.0%) | 2.01 |
Household Size by Marriage Status in New Columbia
Out of a total of 426 households in New Columbia, 295 (69.3%) are family households, while 131 (30.7%) are nonfamily households. The most numerous type of family households are 2-person households, comprising 216, and the most common type of nonfamily households are 1-person households, comprising 125.
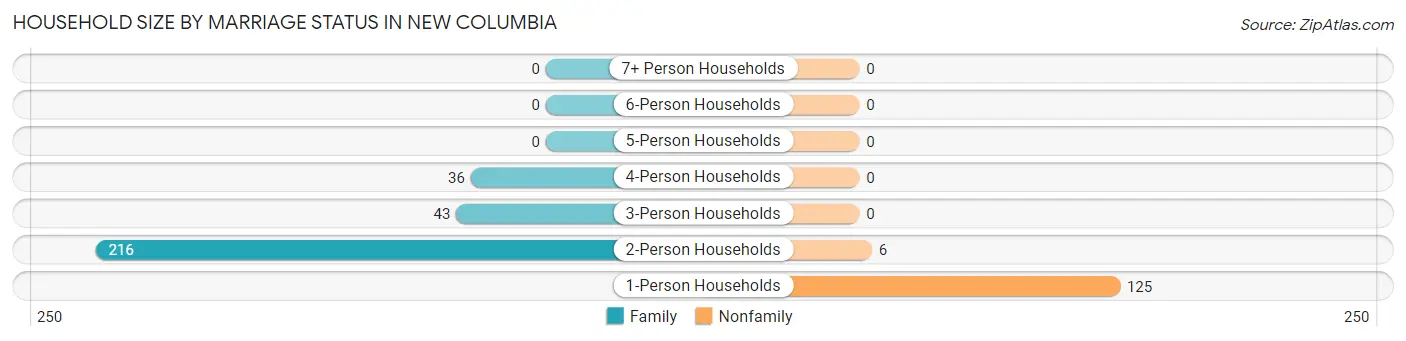
| Household Size | Family Households | Nonfamily Households |
| 1-Person Households | - | 125 (29.3%) |
| 2-Person Households | 216 (50.7%) | 6 (1.4%) |
| 3-Person Households | 43 (10.1%) | 0 (0.0%) |
| 4-Person Households | 36 (8.5%) | 0 (0.0%) |
| 5-Person Households | 0 (0.0%) | 0 (0.0%) |
| 6-Person Households | 0 (0.0%) | 0 (0.0%) |
| 7+ Person Households | 0 (0.0%) | 0 (0.0%) |
| Total | 295 (69.3%) | 131 (30.7%) |
Female Fertility in New Columbia
Fertility by Age in New Columbia
Average fertility rate in New Columbia is 297.0 births per 1,000 women. Women in the age bracket of 35 to 50 years have the highest fertility rate with 429.0 births per 1,000 women. Women in the age bracket of 20 to 34 years acount for 51.2% of all women with births.
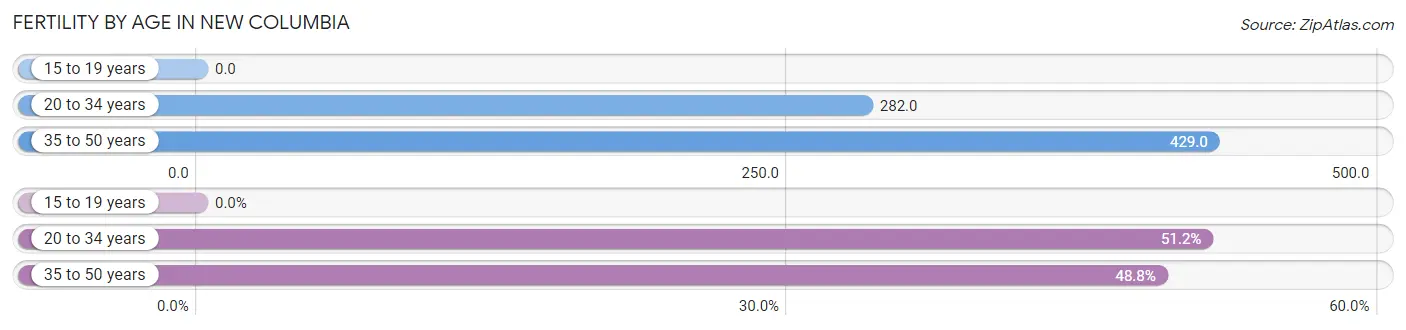
| Age Bracket | Women with Births | Births / 1,000 Women |
| 15 to 19 years | 0 (0.0%) | 0.0 |
| 20 to 34 years | 22 (51.2%) | 282.0 |
| 35 to 50 years | 21 (48.8%) | 429.0 |
| Total | 43 (100.0%) | 297.0 |
Fertility by Age by Marriage Status in New Columbia
51.2% of women with births (43) in New Columbia are married. The highest percentage of unmarried women with births falls into 35 to 50 years age bracket with 100.0% of them unmarried at the time of birth, while the lowest percentage of unmarried women with births belong to 20 to 34 years age bracket with 0.0% of them unmarried.
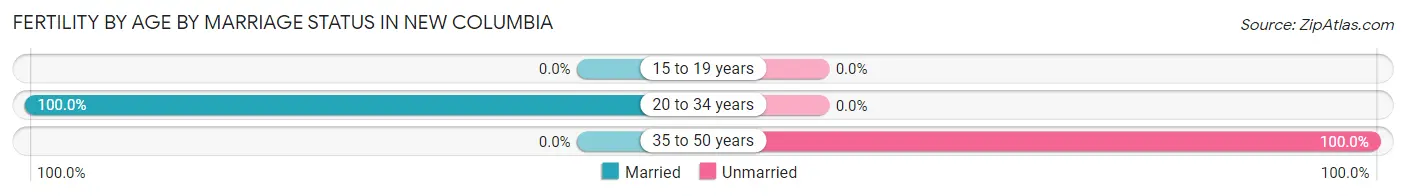
| Age Bracket | Married | Unmarried |
| 15 to 19 years | 0 (0.0%) | 0 (0.0%) |
| 20 to 34 years | 22 (100.0%) | 0 (0.0%) |
| 35 to 50 years | 0 (0.0%) | 21 (100.0%) |
| Total | 22 (51.2%) | 21 (48.8%) |
Fertility by Education in New Columbia
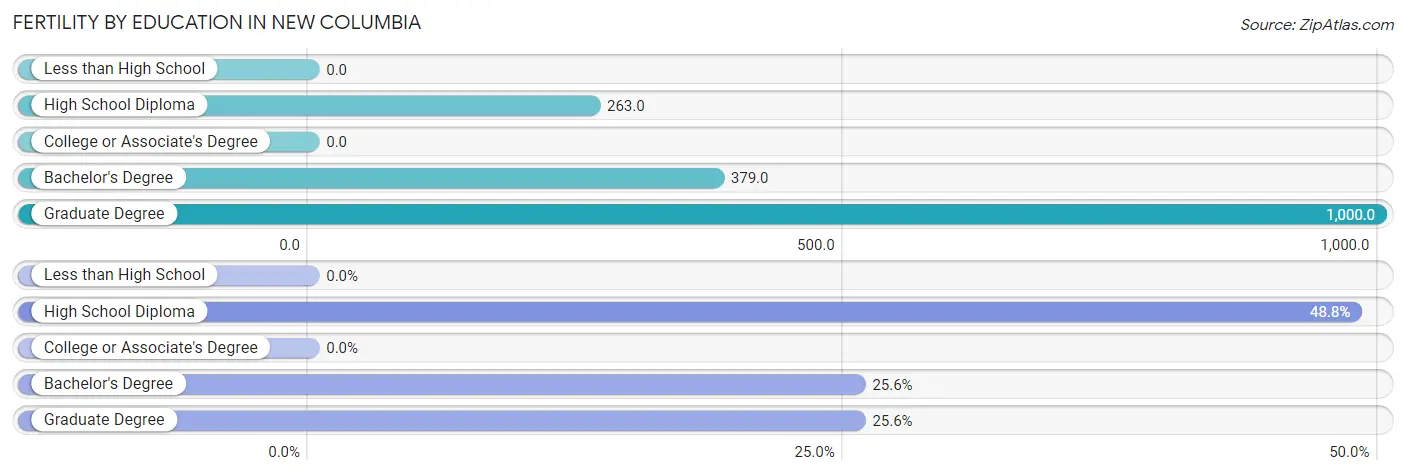
| Educational Attainment | Women with Births | Births / 1,000 Women |
| Less than High School | 0 (0.0%) | 0.0 |
| High School Diploma | 21 (48.8%) | 263.0 |
| College or Associate's Degree | 0 (0.0%) | 0.0 |
| Bachelor's Degree | 11 (25.6%) | 379.0 |
| Graduate Degree | 11 (25.6%) | 1,000.0 |
| Total | 43 (100.0%) | 297.0 |
Fertility by Education by Marriage Status in New Columbia
48.8% of women with births in New Columbia are unmarried. Women with the educational attainment of bachelor's degree are most likely to be married with 100.0% of them married at childbirth, while women with the educational attainment of high school diploma are least likely to be married with 100.0% of them unmarried at childbirth.
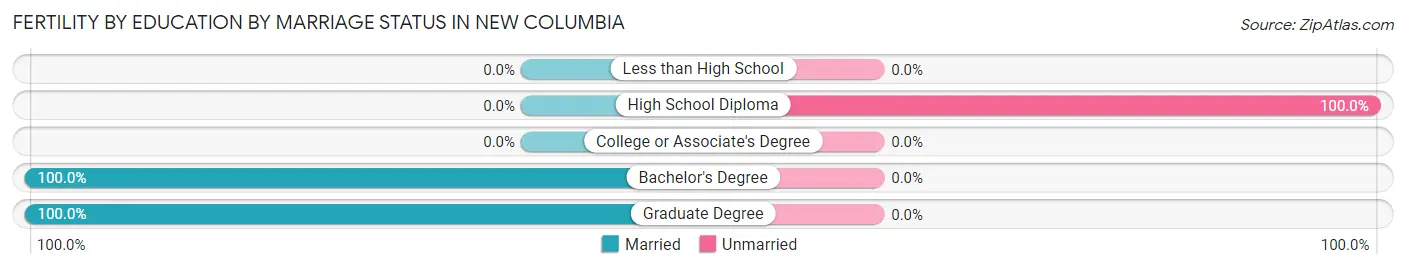
| Educational Attainment | Married | Unmarried |
| Less than High School | 0 (0.0%) | 0 (0.0%) |
| High School Diploma | 0 (0.0%) | 21 (100.0%) |
| College or Associate's Degree | 0 (0.0%) | 0 (0.0%) |
| Bachelor's Degree | 11 (100.0%) | 0 (0.0%) |
| Graduate Degree | 11 (100.0%) | 0 (0.0%) |
| Total | 22 (51.2%) | 21 (48.8%) |
Employment Characteristics in New Columbia
Employment by Class of Employer in New Columbia
Among the 477 employed individuals in New Columbia, private company employees (387 | 81.1%), not-for-profit organizations (78 | 16.4%), and federal government employees (12 | 2.5%) make up the most common classes of employment.
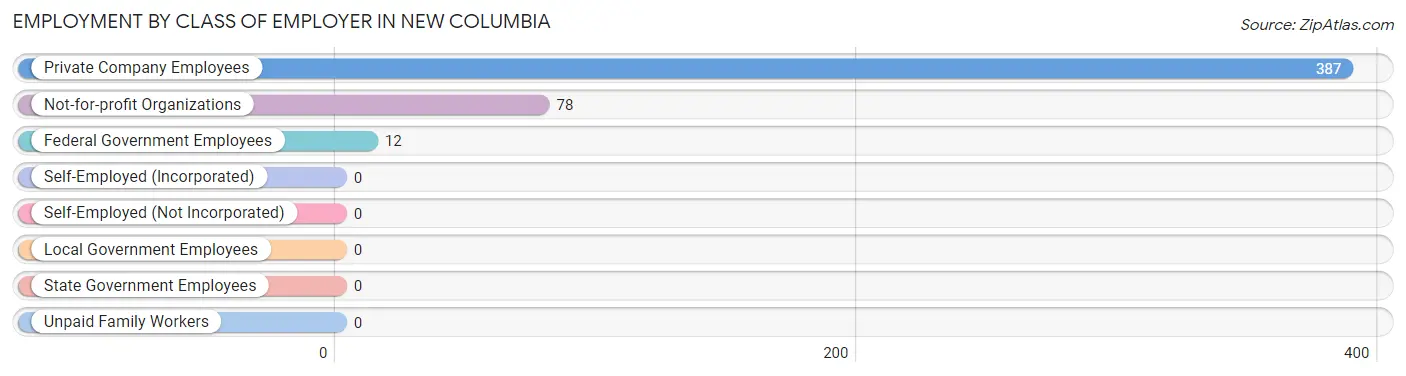
| Employer Class | # Employees | % Employees |
| Private Company Employees | 387 | 81.1% |
| Self-Employed (Incorporated) | 0 | 0.0% |
| Self-Employed (Not Incorporated) | 0 | 0.0% |
| Not-for-profit Organizations | 78 | 16.4% |
| Local Government Employees | 0 | 0.0% |
| State Government Employees | 0 | 0.0% |
| Federal Government Employees | 12 | 2.5% |
| Unpaid Family Workers | 0 | 0.0% |
| Total | 477 | 100.0% |
Employment Status by Age in New Columbia
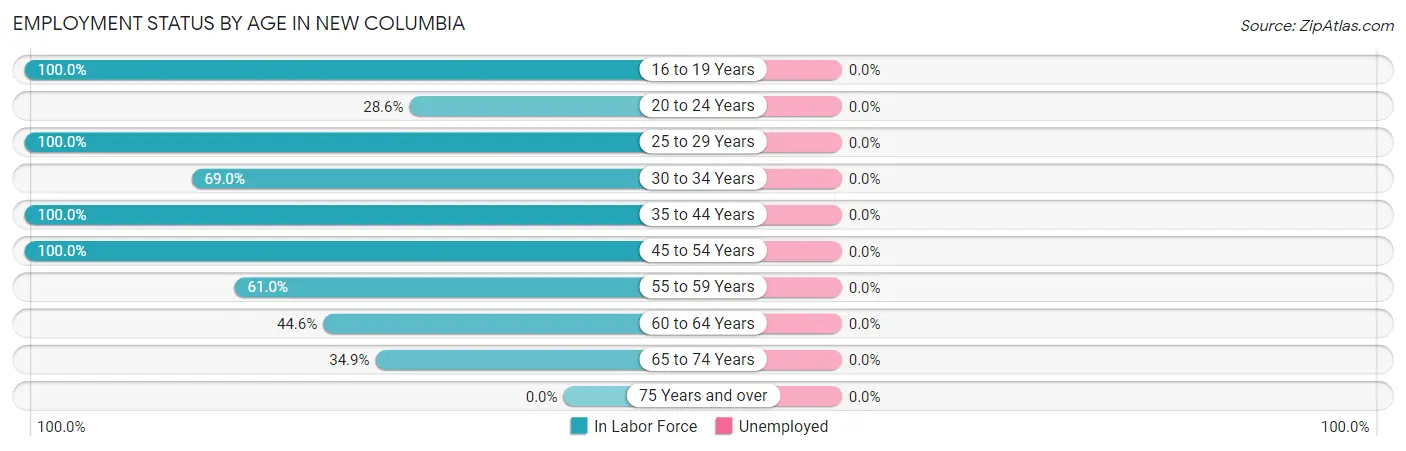
| Age Bracket | In Labor Force | Unemployed |
| 16 to 19 Years | 18 (100.0%) | 0 (0.0%) |
| 20 to 24 Years | 6 (28.6%) | 0 (0.0%) |
| 25 to 29 Years | 21 (100.0%) | 0 (0.0%) |
| 30 to 34 Years | 89 (69.0%) | 0 (0.0%) |
| 35 to 44 Years | 49 (100.0%) | 0 (0.0%) |
| 45 to 54 Years | 109 (100.0%) | 0 (0.0%) |
| 55 to 59 Years | 111 (61.0%) | 0 (0.0%) |
| 60 to 64 Years | 25 (44.6%) | 0 (0.0%) |
| 65 to 74 Years | 60 (34.9%) | 0 (0.0%) |
| 75 Years and over | 0 (0.0%) | 0 (0.0%) |
| Total | 488 (62.3%) | 0 (0.0%) |
Employment Status by Educational Attainment in New Columbia
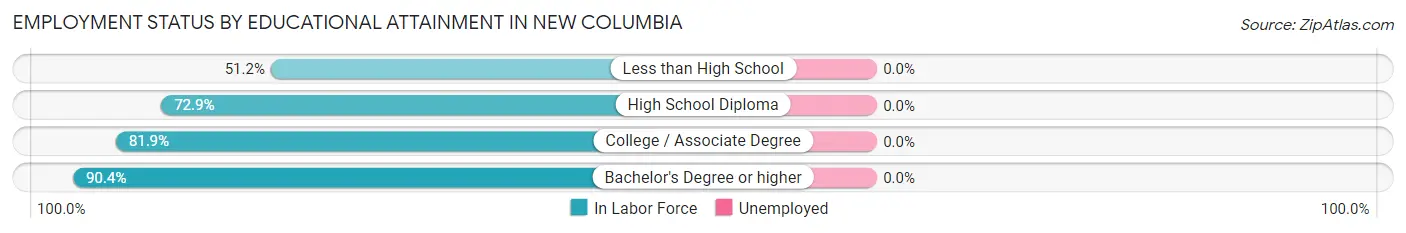
| Educational Attainment | In Labor Force | Unemployed |
| Less than High School | 44 (51.2%) | 0 (0.0%) |
| High School Diploma | 207 (72.9%) | 0 (0.0%) |
| College / Associate Degree | 59 (81.9%) | 0 (0.0%) |
| Bachelor's Degree or higher | 94 (90.4%) | 0 (0.0%) |
| Total | 404 (74.0%) | 0 (0.0%) |
Employment Occupations by Sex in New Columbia
Management, Business, Science and Arts Occupations
The most common Management, Business, Science and Arts occupations in New Columbia are Management (82 | 16.8%), Health Diagnosing & Treating (57 | 11.7%), Health Technologists (36 | 7.4%), Business & Financial (28 | 5.7%), and Computers, Engineering & Science (20 | 4.1%).
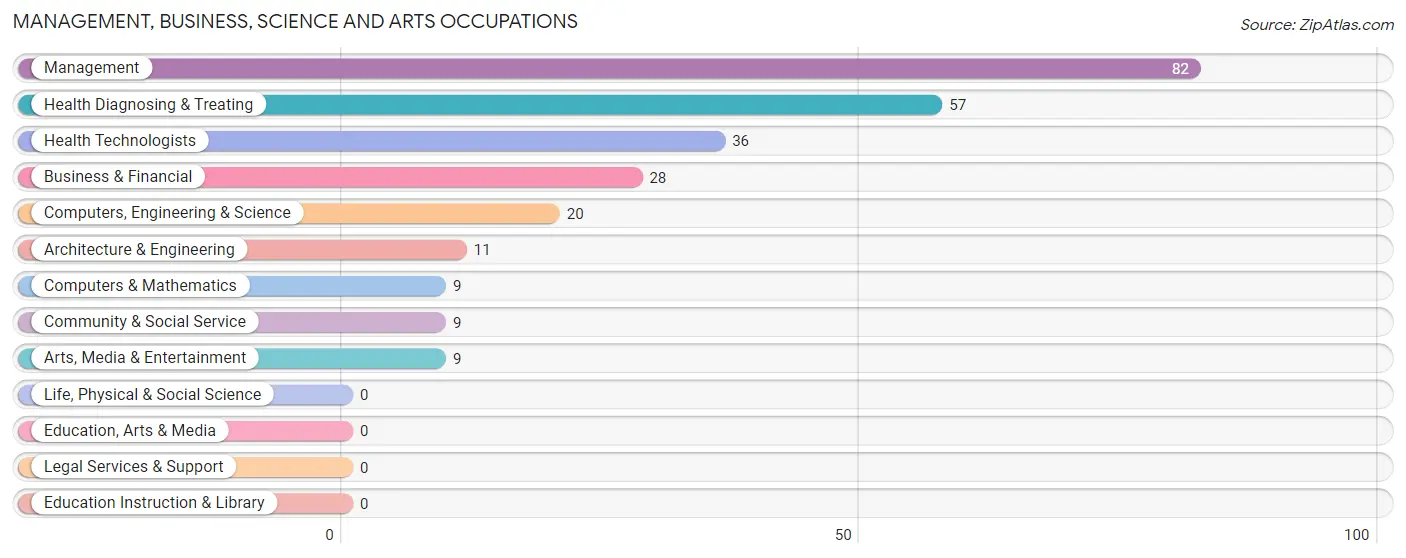
Management, Business, Science and Arts Occupations by Sex
Within the Management, Business, Science and Arts occupations in New Columbia, the most male-oriented occupations are Computers, Engineering & Science (100.0%), Computers & Mathematics (100.0%), and Architecture & Engineering (100.0%), while the most female-oriented occupations are Community & Social Service (100.0%), Arts, Media & Entertainment (100.0%), and Health Diagnosing & Treating (100.0%).
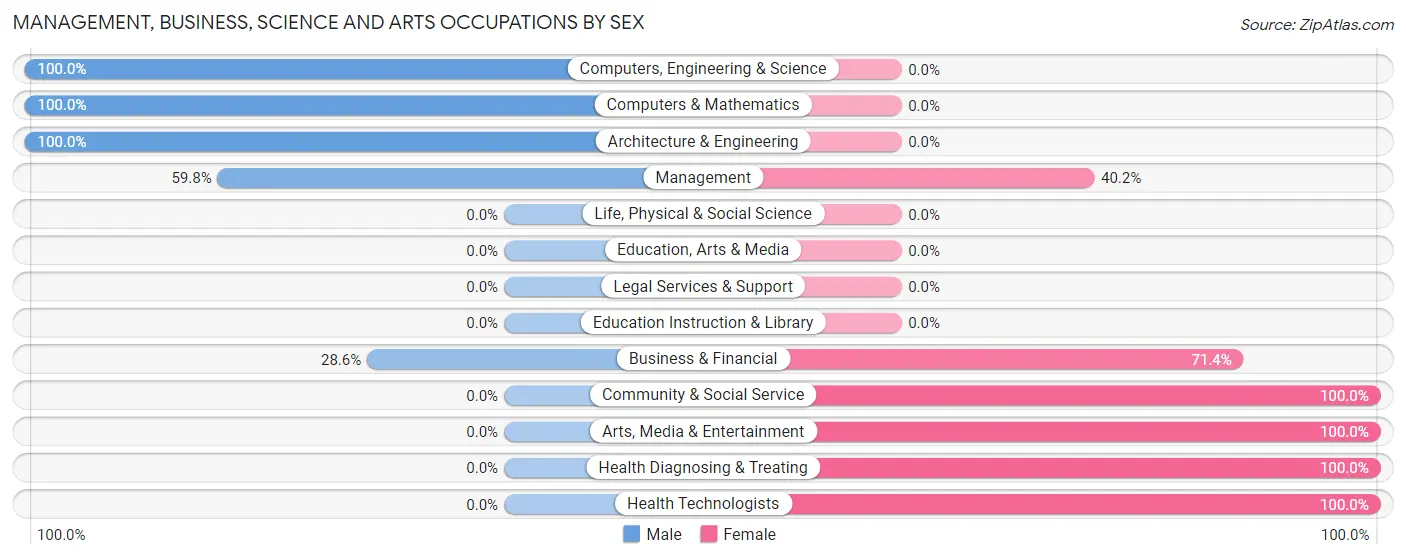
| Occupation | Male | Female |
| Management | 49 (59.8%) | 33 (40.2%) |
| Business & Financial | 8 (28.6%) | 20 (71.4%) |
| Computers, Engineering & Science | 20 (100.0%) | 0 (0.0%) |
| Computers & Mathematics | 9 (100.0%) | 0 (0.0%) |
| Architecture & Engineering | 11 (100.0%) | 0 (0.0%) |
| Life, Physical & Social Science | 0 (0.0%) | 0 (0.0%) |
| Community & Social Service | 0 (0.0%) | 9 (100.0%) |
| Education, Arts & Media | 0 (0.0%) | 0 (0.0%) |
| Legal Services & Support | 0 (0.0%) | 0 (0.0%) |
| Education Instruction & Library | 0 (0.0%) | 0 (0.0%) |
| Arts, Media & Entertainment | 0 (0.0%) | 9 (100.0%) |
| Health Diagnosing & Treating | 0 (0.0%) | 57 (100.0%) |
| Health Technologists | 0 (0.0%) | 36 (100.0%) |
| Total (Category) | 77 (39.3%) | 119 (60.7%) |
| Total (Overall) | 203 (41.6%) | 285 (58.4%) |
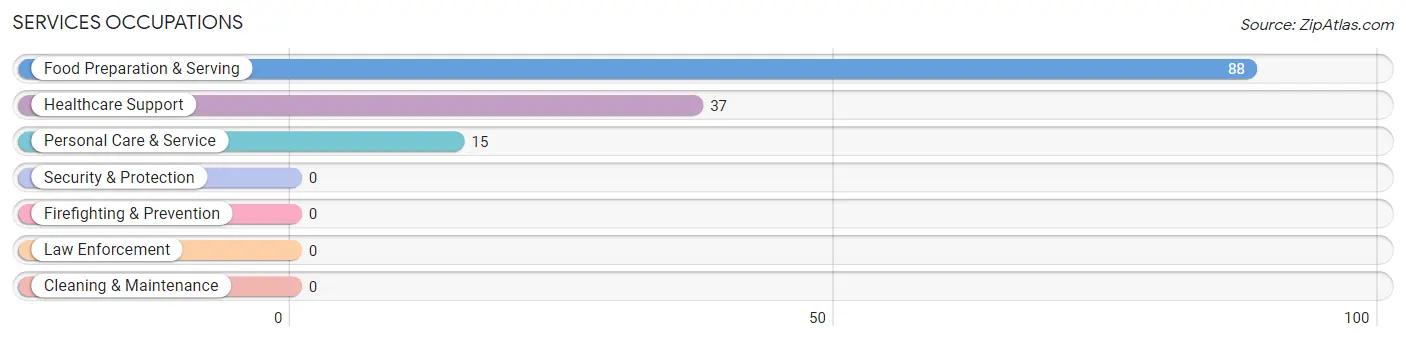
Services Occupations
The most common Services occupations in New Columbia are Food Preparation & Serving (88 | 18.0%), Healthcare Support (37 | 7.6%), and Personal Care & Service (15 | 3.1%).
Services Occupations by Sex
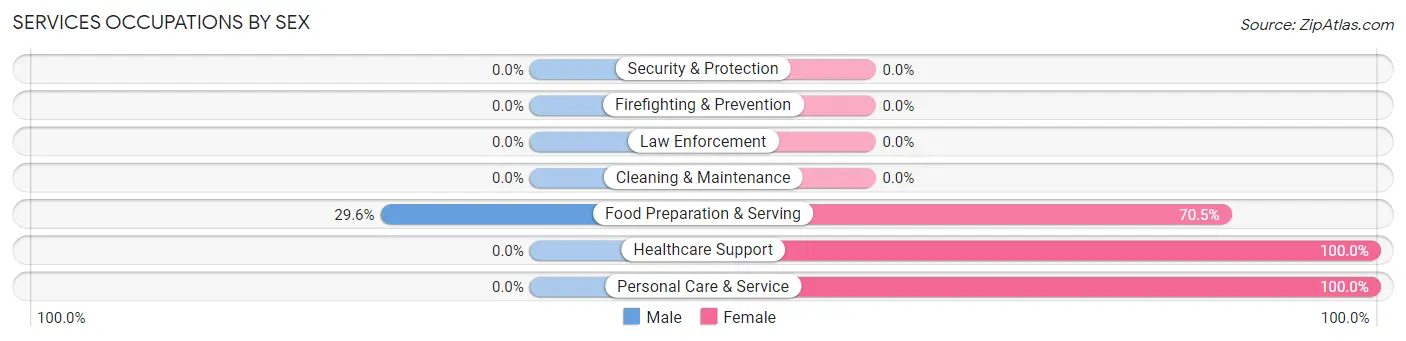
| Occupation | Male | Female |
| Healthcare Support | 0 (0.0%) | 37 (100.0%) |
| Security & Protection | 0 (0.0%) | 0 (0.0%) |
| Firefighting & Prevention | 0 (0.0%) | 0 (0.0%) |
| Law Enforcement | 0 (0.0%) | 0 (0.0%) |
| Food Preparation & Serving | 26 (29.5%) | 62 (70.5%) |
| Cleaning & Maintenance | 0 (0.0%) | 0 (0.0%) |
| Personal Care & Service | 0 (0.0%) | 15 (100.0%) |
| Total (Category) | 26 (18.6%) | 114 (81.4%) |
| Total (Overall) | 203 (41.6%) | 285 (58.4%) |
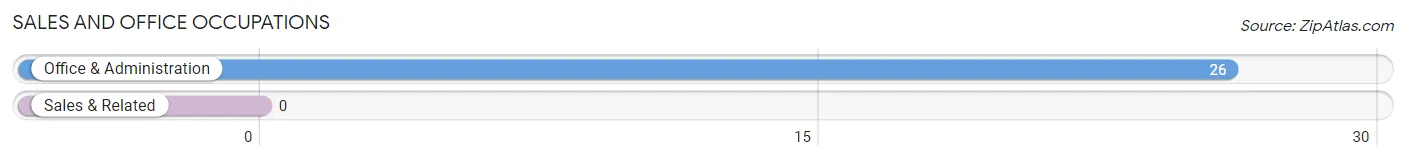
Sales and Office Occupations
The most common Sales and Office occupations in New Columbia are , and Office & Administration (26 | 5.3%).
Sales and Office Occupations by Sex
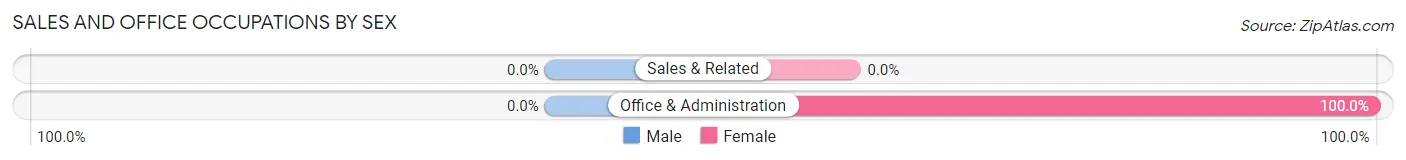
| Occupation | Male | Female |
| Sales & Related | 0 (0.0%) | 0 (0.0%) |
| Office & Administration | 0 (0.0%) | 26 (100.0%) |
| Total (Category) | 0 (0.0%) | 26 (100.0%) |
| Total (Overall) | 203 (41.6%) | 285 (58.4%) |
Natural Resources, Construction and Maintenance Occupations
The most common Natural Resources, Construction and Maintenance occupations in New Columbia are , and Installation, Maintenance & Repair (19 | 3.9%).
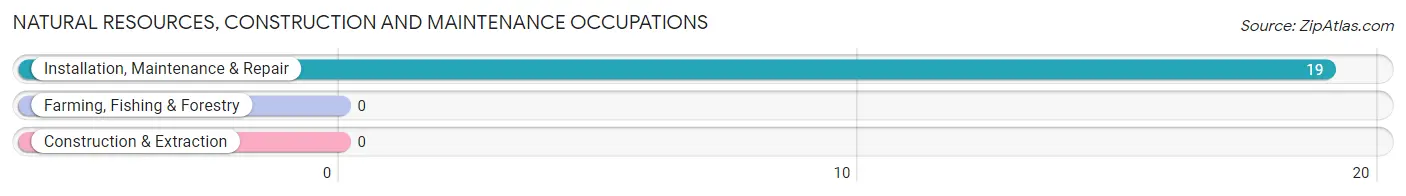
Natural Resources, Construction and Maintenance Occupations by Sex
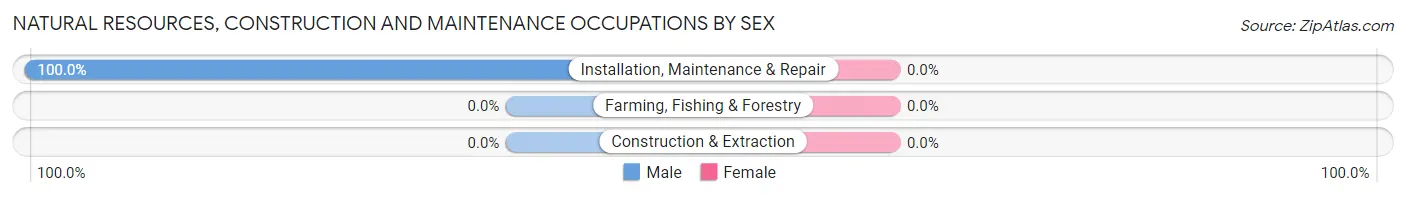
| Occupation | Male | Female |
| Farming, Fishing & Forestry | 0 (0.0%) | 0 (0.0%) |
| Construction & Extraction | 0 (0.0%) | 0 (0.0%) |
| Installation, Maintenance & Repair | 19 (100.0%) | 0 (0.0%) |
| Total (Category) | 19 (100.0%) | 0 (0.0%) |
| Total (Overall) | 203 (41.6%) | 285 (58.4%) |
Production, Transportation and Moving Occupations
The most common Production, Transportation and Moving occupations in New Columbia are Material Moving (58 | 11.9%), Production (41 | 8.4%), and Transportation (8 | 1.6%).
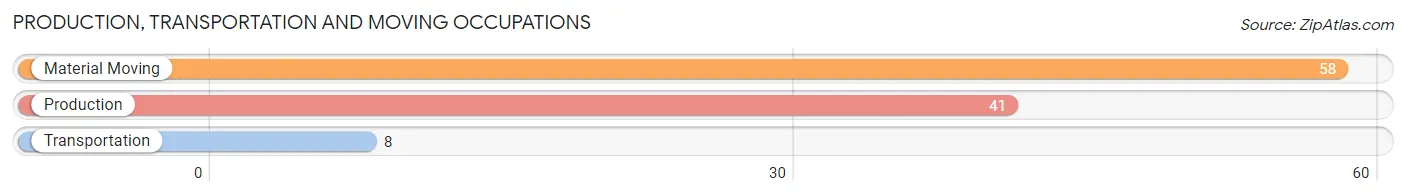
Production, Transportation and Moving Occupations by Sex
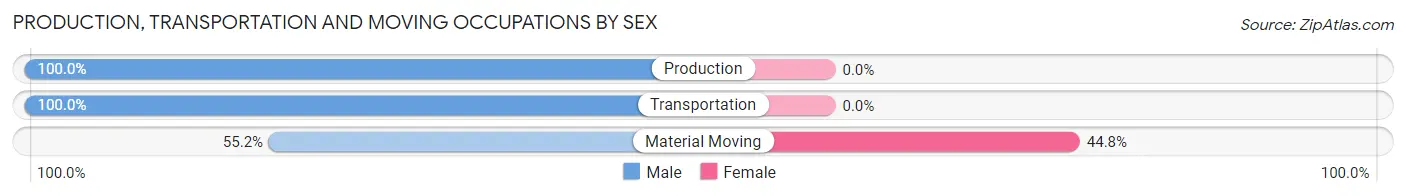
| Occupation | Male | Female |
| Production | 41 (100.0%) | 0 (0.0%) |
| Transportation | 8 (100.0%) | 0 (0.0%) |
| Material Moving | 32 (55.2%) | 26 (44.8%) |
| Total (Category) | 81 (75.7%) | 26 (24.3%) |
| Total (Overall) | 203 (41.6%) | 285 (58.4%) |
Employment Industries by Sex in New Columbia
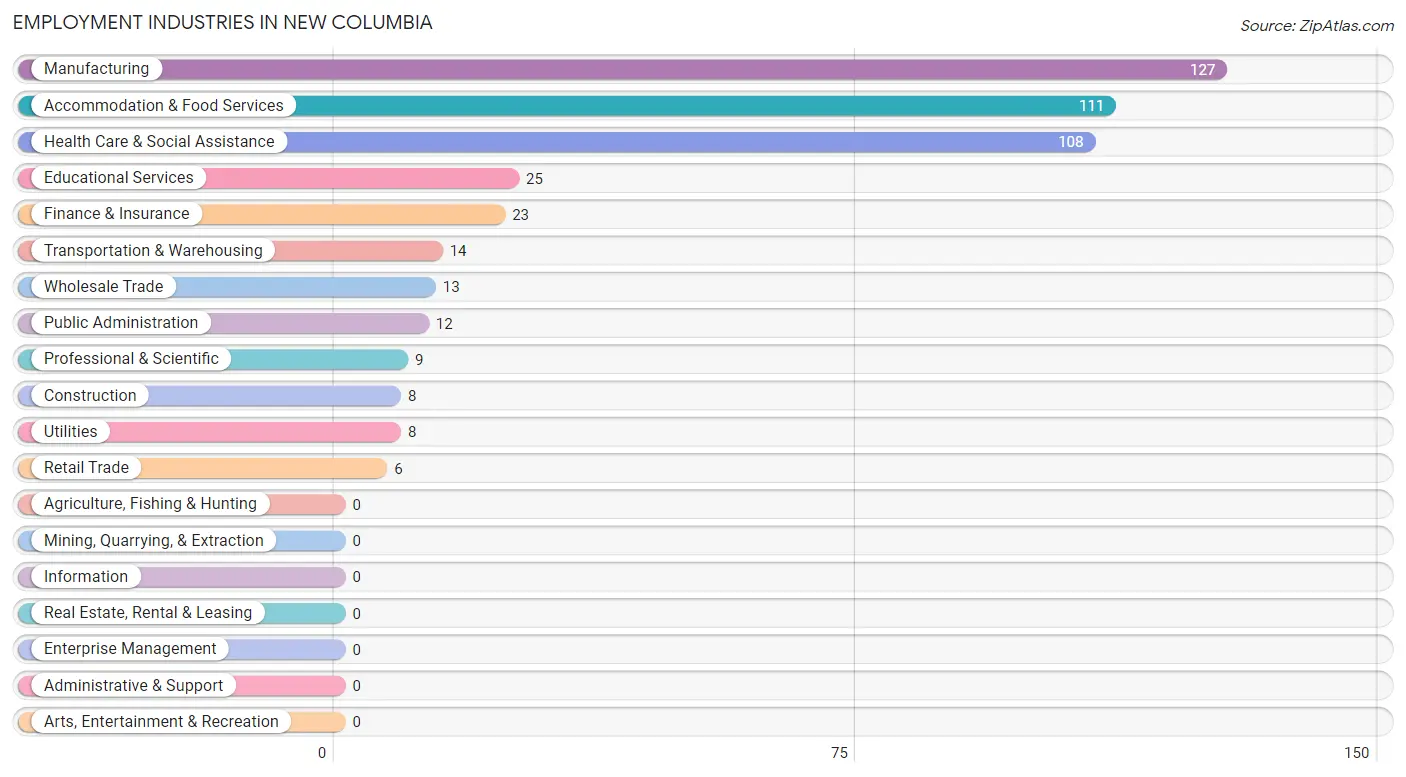
Employment Industries in New Columbia
The major employment industries in New Columbia include Manufacturing (127 | 26.0%), Accommodation & Food Services (111 | 22.8%), Health Care & Social Assistance (108 | 22.1%), Educational Services (25 | 5.1%), and Finance & Insurance (23 | 4.7%).
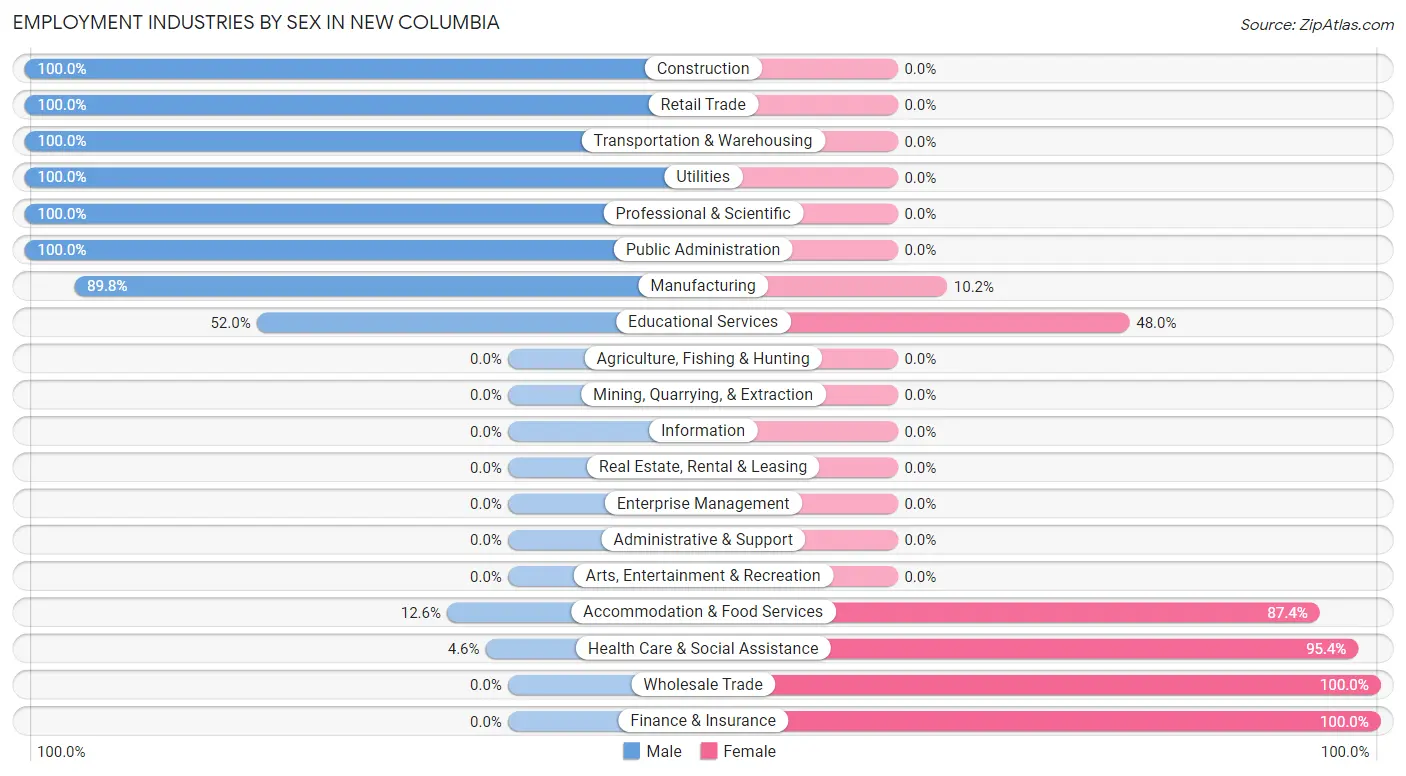
Employment Industries by Sex in New Columbia
The New Columbia industries that see more men than women are Construction (100.0%), Retail Trade (100.0%), and Transportation & Warehousing (100.0%), whereas the industries that tend to have a higher number of women are Wholesale Trade (100.0%), Finance & Insurance (100.0%), and Health Care & Social Assistance (95.4%).
| Industry | Male | Female |
| Agriculture, Fishing & Hunting | 0 (0.0%) | 0 (0.0%) |
| Mining, Quarrying, & Extraction | 0 (0.0%) | 0 (0.0%) |
| Construction | 8 (100.0%) | 0 (0.0%) |
| Manufacturing | 114 (89.8%) | 13 (10.2%) |
| Wholesale Trade | 0 (0.0%) | 13 (100.0%) |
| Retail Trade | 6 (100.0%) | 0 (0.0%) |
| Transportation & Warehousing | 14 (100.0%) | 0 (0.0%) |
| Utilities | 8 (100.0%) | 0 (0.0%) |
| Information | 0 (0.0%) | 0 (0.0%) |
| Finance & Insurance | 0 (0.0%) | 23 (100.0%) |
| Real Estate, Rental & Leasing | 0 (0.0%) | 0 (0.0%) |
| Professional & Scientific | 9 (100.0%) | 0 (0.0%) |
| Enterprise Management | 0 (0.0%) | 0 (0.0%) |
| Administrative & Support | 0 (0.0%) | 0 (0.0%) |
| Educational Services | 13 (52.0%) | 12 (48.0%) |
| Health Care & Social Assistance | 5 (4.6%) | 103 (95.4%) |
| Arts, Entertainment & Recreation | 0 (0.0%) | 0 (0.0%) |
| Accommodation & Food Services | 14 (12.6%) | 97 (87.4%) |
| Public Administration | 12 (100.0%) | 0 (0.0%) |
| Total | 203 (41.6%) | 285 (58.4%) |
Education in New Columbia
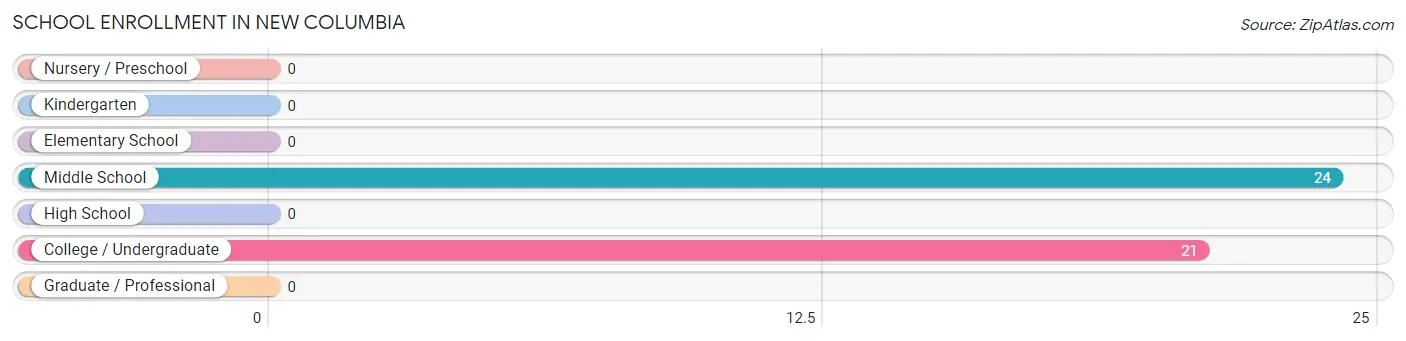
School Enrollment in New Columbia
The most common levels of schooling among the 45 students in New Columbia are middle school (24 | 53.3%), and college / undergraduate (21 | 46.7%).
| School Level | # Students | % Students |
| Nursery / Preschool | 0 | 0.0% |
| Kindergarten | 0 | 0.0% |
| Elementary School | 0 | 0.0% |
| Middle School | 24 | 53.3% |
| High School | 0 | 0.0% |
| College / Undergraduate | 21 | 46.7% |
| Graduate / Professional | 0 | 0.0% |
| Total | 45 | 100.0% |
School Enrollment by Age by Funding Source in New Columbia
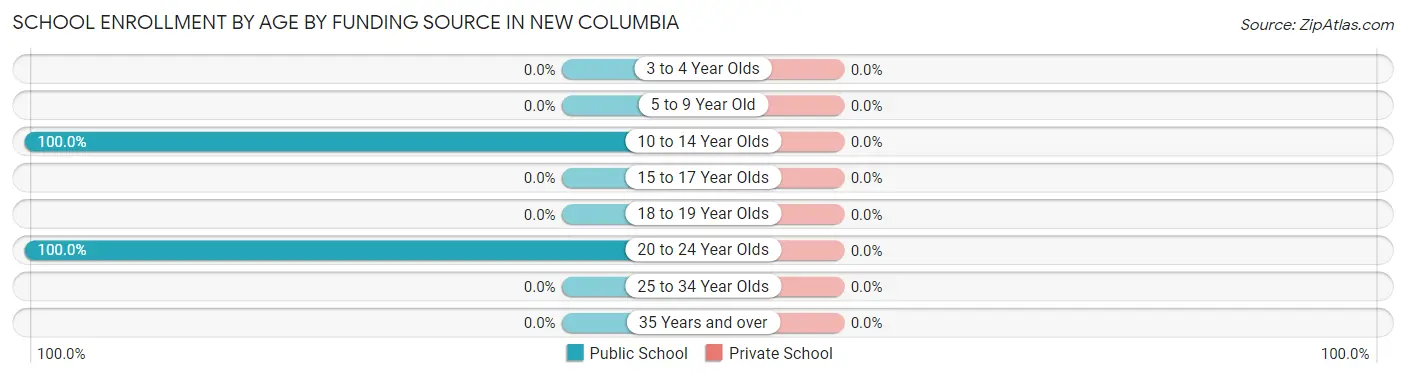
| Age Bracket | Public School | Private School |
| 3 to 4 Year Olds | 0 (0.0%) | 0 (0.0%) |
| 5 to 9 Year Old | 0 (0.0%) | 0 (0.0%) |
| 10 to 14 Year Olds | 24 (100.0%) | 0 (0.0%) |
| 15 to 17 Year Olds | 0 (0.0%) | 0 (0.0%) |
| 18 to 19 Year Olds | 0 (0.0%) | 0 (0.0%) |
| 20 to 24 Year Olds | 21 (100.0%) | 0 (0.0%) |
| 25 to 34 Year Olds | 0 (0.0%) | 0 (0.0%) |
| 35 Years and over | 0 (0.0%) | 0 (0.0%) |
| Total | 45 (100.0%) | 0 (0.0%) |
Educational Attainment by Field of Study in New Columbia
Science & technology (36 | 29.0%), business (23 | 18.5%), education (19 | 15.3%), computers & mathematics (11 | 8.9%), and physical & health sciences (11 | 8.9%) are the most common fields of study among 124 individuals in New Columbia who have obtained a bachelor's degree or higher.
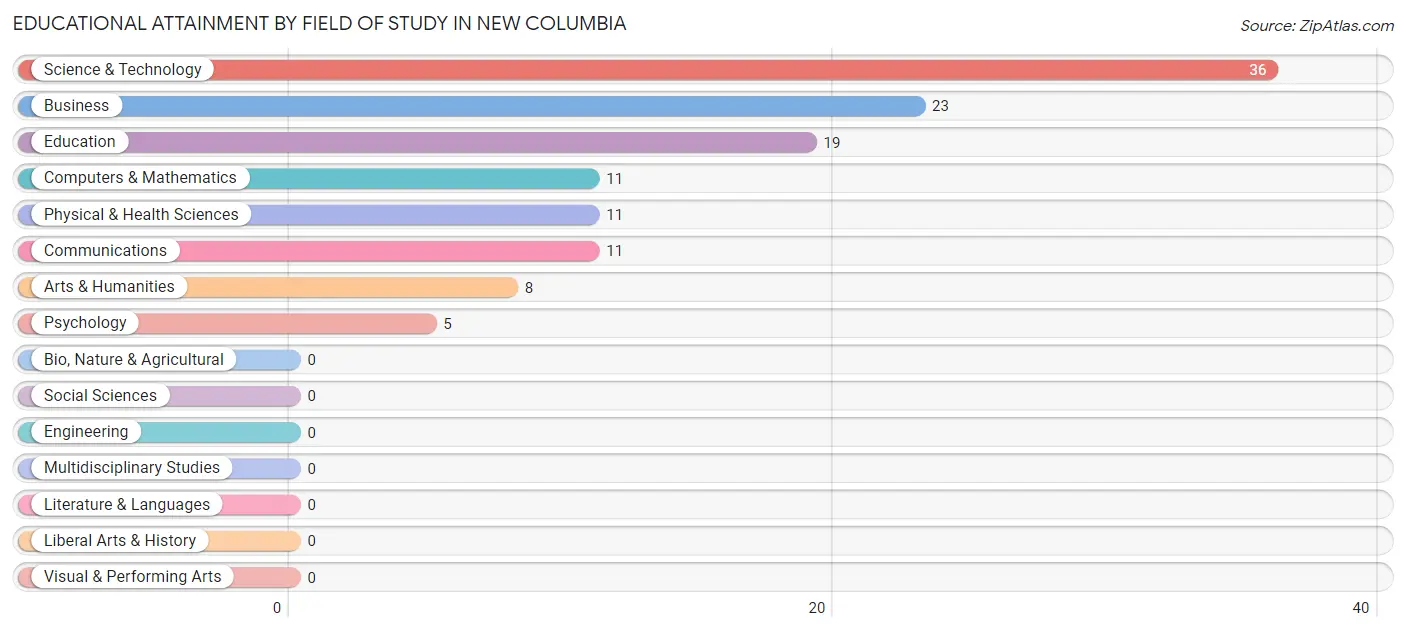
| Field of Study | # Graduates | % Graduates |
| Computers & Mathematics | 11 | 8.9% |
| Bio, Nature & Agricultural | 0 | 0.0% |
| Physical & Health Sciences | 11 | 8.9% |
| Psychology | 5 | 4.0% |
| Social Sciences | 0 | 0.0% |
| Engineering | 0 | 0.0% |
| Multidisciplinary Studies | 0 | 0.0% |
| Science & Technology | 36 | 29.0% |
| Business | 23 | 18.5% |
| Education | 19 | 15.3% |
| Literature & Languages | 0 | 0.0% |
| Liberal Arts & History | 0 | 0.0% |
| Visual & Performing Arts | 0 | 0.0% |
| Communications | 11 | 8.9% |
| Arts & Humanities | 8 | 6.5% |
| Total | 124 | 100.0% |
Transportation & Commute in New Columbia
Vehicle Availability by Sex in New Columbia
The most prevalent vehicle ownership categories in New Columbia are males with 1 vehicle (78, accounting for 38.4%) and females with 1 vehicle (0, making up 28.5%).
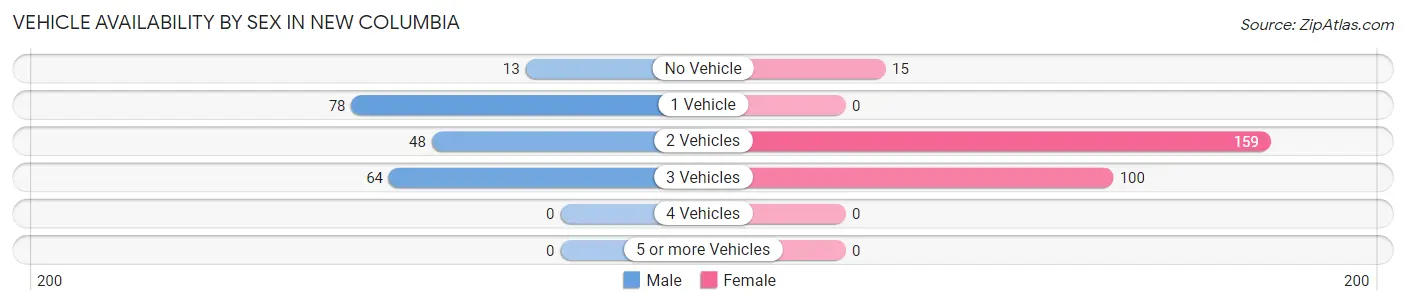
| Vehicles Available | Male | Female |
| No Vehicle | 13 (6.4%) | 15 (5.5%) |
| 1 Vehicle | 78 (38.4%) | 0 (0.0%) |
| 2 Vehicles | 48 (23.6%) | 159 (58.0%) |
| 3 Vehicles | 64 (31.5%) | 100 (36.5%) |
| 4 Vehicles | 0 (0.0%) | 0 (0.0%) |
| 5 or more Vehicles | 0 (0.0%) | 0 (0.0%) |
| Total | 203 (100.0%) | 274 (100.0%) |
Commute Time in New Columbia
The most frequently occuring commute durations in New Columbia are 10 to 14 minutes (184 commuters, 39.2%), 5 to 9 minutes (76 commuters, 16.2%), and 15 to 19 minutes (69 commuters, 14.7%).
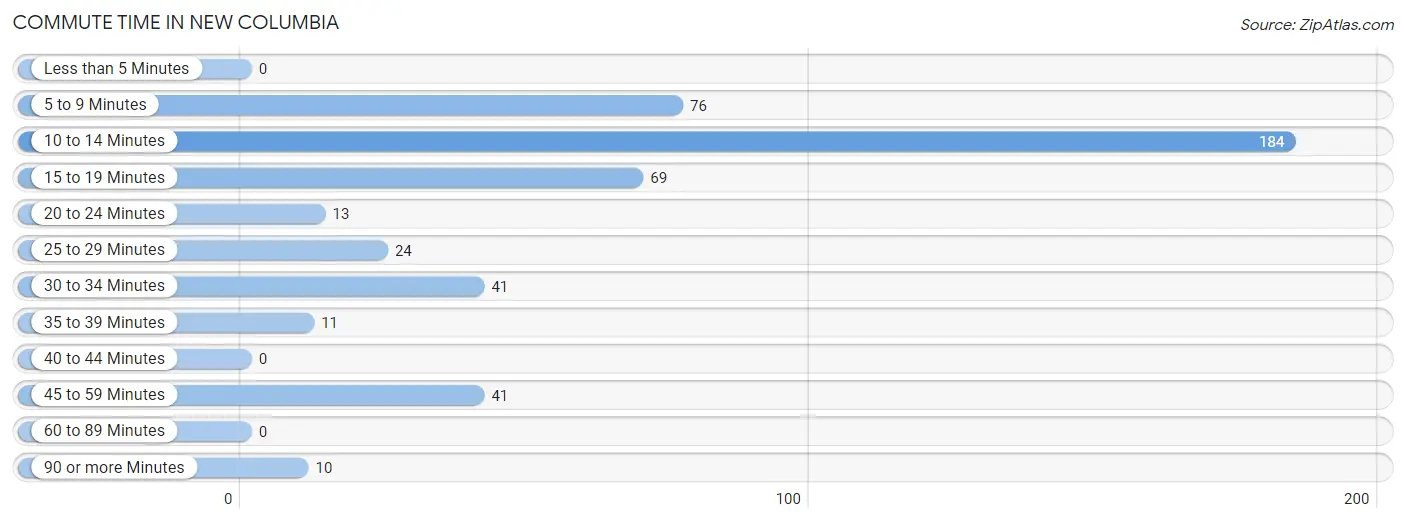
| Commute Time | # Commuters | % Commuters |
| Less than 5 Minutes | 0 | 0.0% |
| 5 to 9 Minutes | 76 | 16.2% |
| 10 to 14 Minutes | 184 | 39.2% |
| 15 to 19 Minutes | 69 | 14.7% |
| 20 to 24 Minutes | 13 | 2.8% |
| 25 to 29 Minutes | 24 | 5.1% |
| 30 to 34 Minutes | 41 | 8.7% |
| 35 to 39 Minutes | 11 | 2.4% |
| 40 to 44 Minutes | 0 | 0.0% |
| 45 to 59 Minutes | 41 | 8.7% |
| 60 to 89 Minutes | 0 | 0.0% |
| 90 or more Minutes | 10 | 2.1% |
Commute Time by Sex in New Columbia
The most common commute times in New Columbia are 10 to 14 minutes (84 commuters, 43.1%) for males and 10 to 14 minutes (100 commuters, 36.5%) for females.
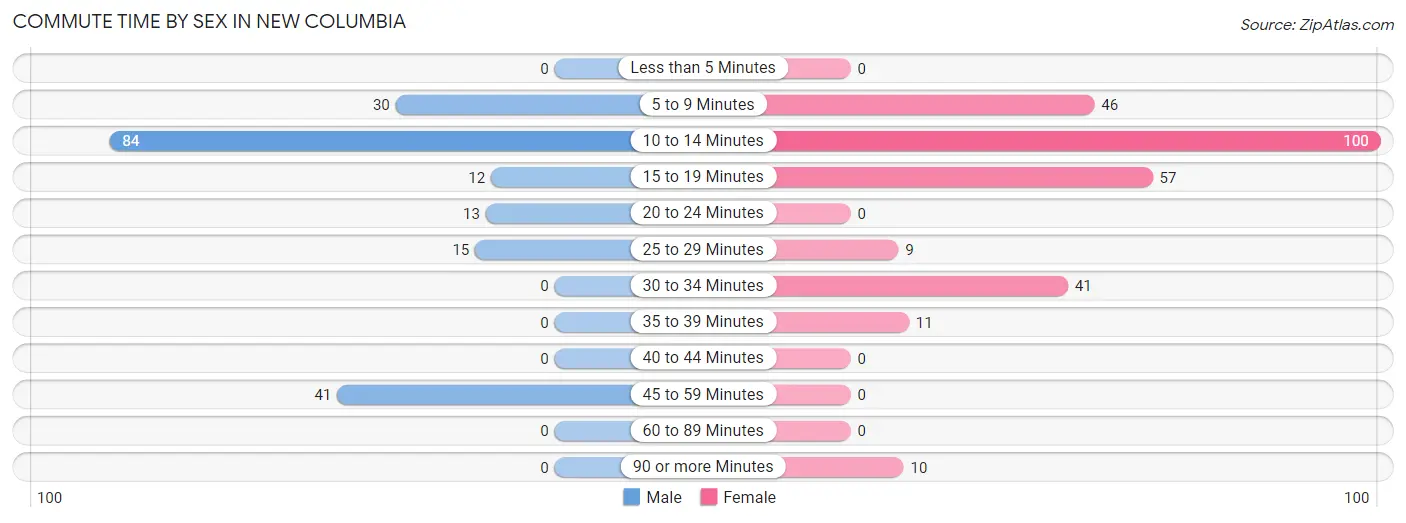
| Commute Time | Male | Female |
| Less than 5 Minutes | 0 (0.0%) | 0 (0.0%) |
| 5 to 9 Minutes | 30 (15.4%) | 46 (16.8%) |
| 10 to 14 Minutes | 84 (43.1%) | 100 (36.5%) |
| 15 to 19 Minutes | 12 (6.1%) | 57 (20.8%) |
| 20 to 24 Minutes | 13 (6.7%) | 0 (0.0%) |
| 25 to 29 Minutes | 15 (7.7%) | 9 (3.3%) |
| 30 to 34 Minutes | 0 (0.0%) | 41 (15.0%) |
| 35 to 39 Minutes | 0 (0.0%) | 11 (4.0%) |
| 40 to 44 Minutes | 0 (0.0%) | 0 (0.0%) |
| 45 to 59 Minutes | 41 (21.0%) | 0 (0.0%) |
| 60 to 89 Minutes | 0 (0.0%) | 0 (0.0%) |
| 90 or more Minutes | 0 (0.0%) | 10 (3.6%) |
Time of Departure to Work by Sex in New Columbia
The most frequent times of departure to work in New Columbia are 6:30 AM to 6:59 AM (73, 37.4%) for males and 7:00 AM to 7:29 AM (121, 44.2%) for females.
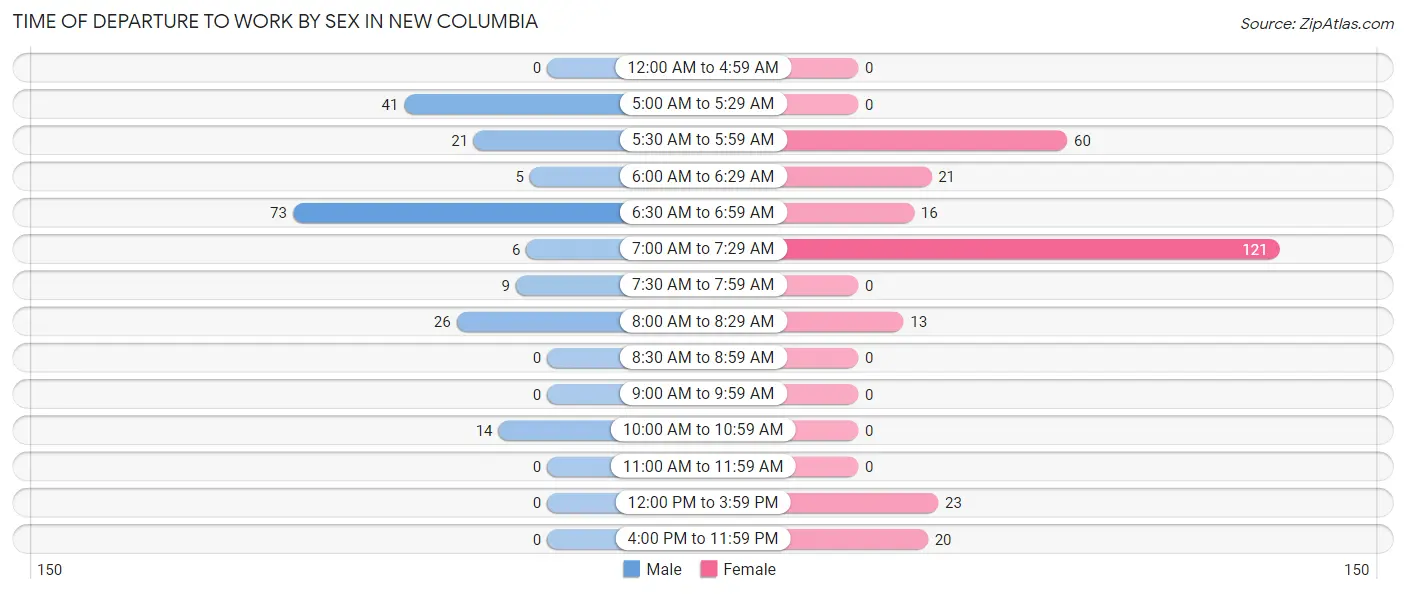
| Time of Departure | Male | Female |
| 12:00 AM to 4:59 AM | 0 (0.0%) | 0 (0.0%) |
| 5:00 AM to 5:29 AM | 41 (21.0%) | 0 (0.0%) |
| 5:30 AM to 5:59 AM | 21 (10.8%) | 60 (21.9%) |
| 6:00 AM to 6:29 AM | 5 (2.6%) | 21 (7.7%) |
| 6:30 AM to 6:59 AM | 73 (37.4%) | 16 (5.8%) |
| 7:00 AM to 7:29 AM | 6 (3.1%) | 121 (44.2%) |
| 7:30 AM to 7:59 AM | 9 (4.6%) | 0 (0.0%) |
| 8:00 AM to 8:29 AM | 26 (13.3%) | 13 (4.7%) |
| 8:30 AM to 8:59 AM | 0 (0.0%) | 0 (0.0%) |
| 9:00 AM to 9:59 AM | 0 (0.0%) | 0 (0.0%) |
| 10:00 AM to 10:59 AM | 14 (7.2%) | 0 (0.0%) |
| 11:00 AM to 11:59 AM | 0 (0.0%) | 0 (0.0%) |
| 12:00 PM to 3:59 PM | 0 (0.0%) | 23 (8.4%) |
| 4:00 PM to 11:59 PM | 0 (0.0%) | 20 (7.3%) |
| Total | 195 (100.0%) | 274 (100.0%) |
Housing Occupancy in New Columbia
Occupancy by Ownership in New Columbia
Of the total 426 dwellings in New Columbia, owner-occupied units account for 386 (90.6%), while renter-occupied units make up 40 (9.4%).
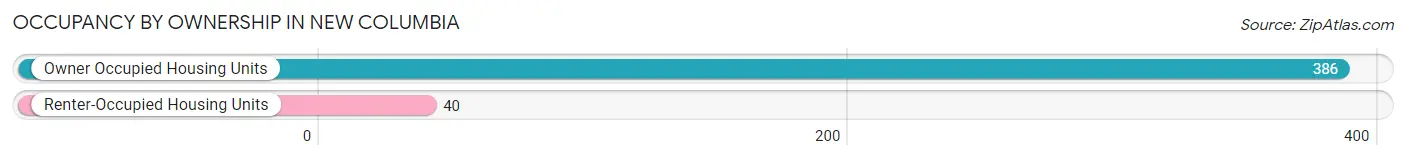
| Occupancy | # Housing Units | % Housing Units |
| Owner Occupied Housing Units | 386 | 90.6% |
| Renter-Occupied Housing Units | 40 | 9.4% |
| Total Occupied Housing Units | 426 | 100.0% |
Occupancy by Household Size in New Columbia
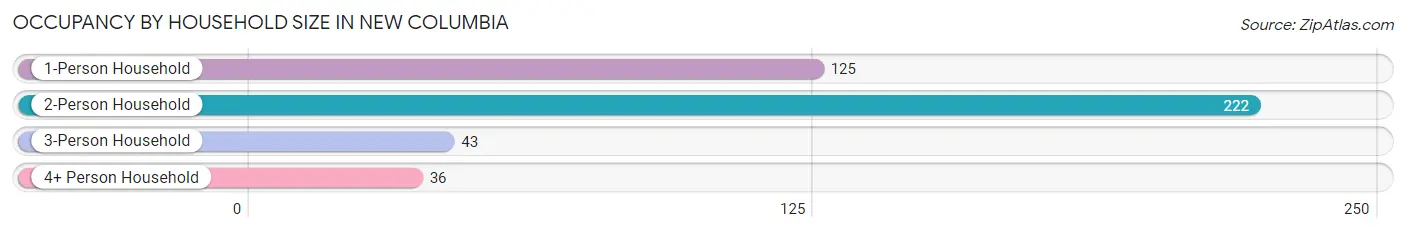
| Household Size | # Housing Units | % Housing Units |
| 1-Person Household | 125 | 29.3% |
| 2-Person Household | 222 | 52.1% |
| 3-Person Household | 43 | 10.1% |
| 4+ Person Household | 36 | 8.5% |
| Total Housing Units | 426 | 100.0% |
Occupancy by Ownership by Household Size in New Columbia
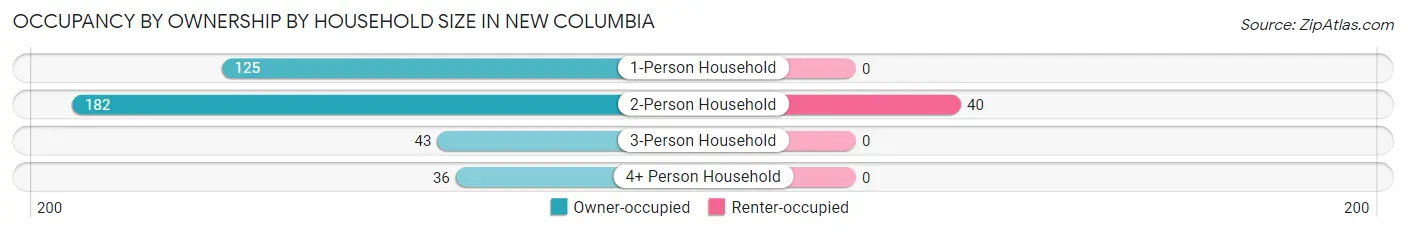
| Household Size | Owner-occupied | Renter-occupied |
| 1-Person Household | 125 (100.0%) | 0 (0.0%) |
| 2-Person Household | 182 (82.0%) | 40 (18.0%) |
| 3-Person Household | 43 (100.0%) | 0 (0.0%) |
| 4+ Person Household | 36 (100.0%) | 0 (0.0%) |
| Total Housing Units | 386 (90.6%) | 40 (9.4%) |
Occupancy by Educational Attainment in New Columbia
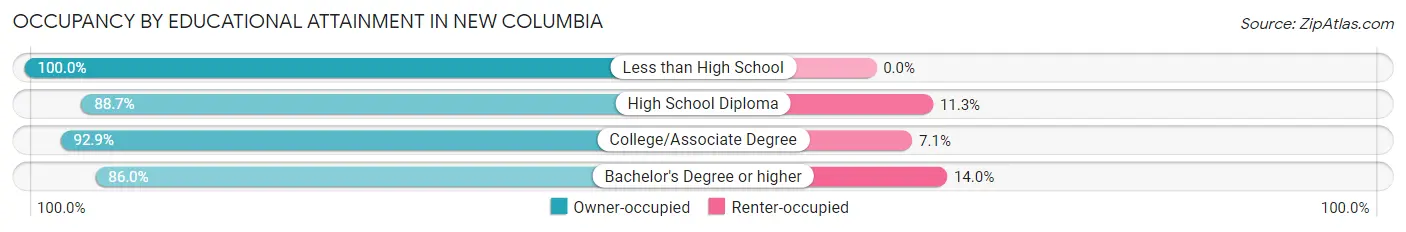
| Household Size | Owner-occupied | Renter-occupied |
| Less than High School | 54 (100.0%) | 0 (0.0%) |
| High School Diploma | 205 (88.7%) | 26 (11.3%) |
| College/Associate Degree | 78 (92.9%) | 6 (7.1%) |
| Bachelor's Degree or higher | 49 (86.0%) | 8 (14.0%) |
Occupancy by Age of Householder in New Columbia
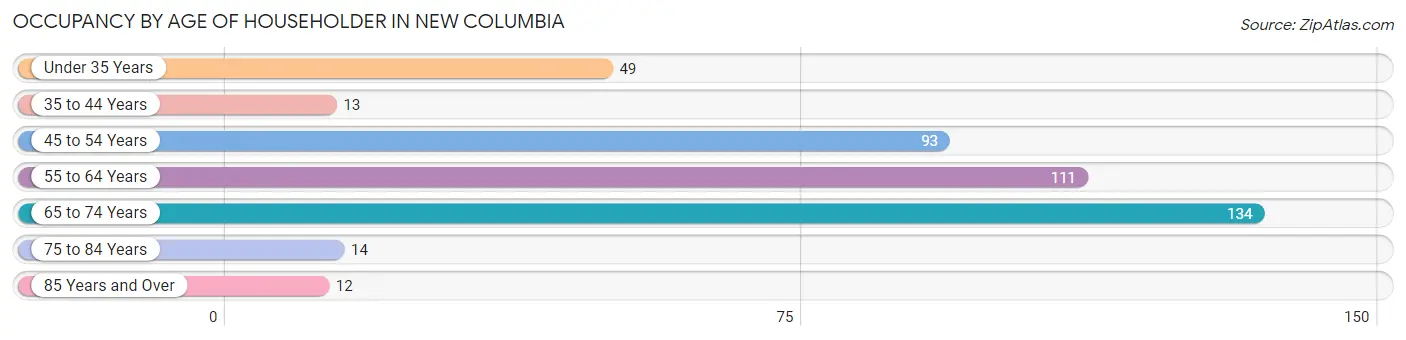
| Age Bracket | # Households | % Households |
| Under 35 Years | 49 | 11.5% |
| 35 to 44 Years | 13 | 3.0% |
| 45 to 54 Years | 93 | 21.8% |
| 55 to 64 Years | 111 | 26.1% |
| 65 to 74 Years | 134 | 31.5% |
| 75 to 84 Years | 14 | 3.3% |
| 85 Years and Over | 12 | 2.8% |
| Total | 426 | 100.0% |
Housing Finances in New Columbia
Median Income by Occupancy in New Columbia
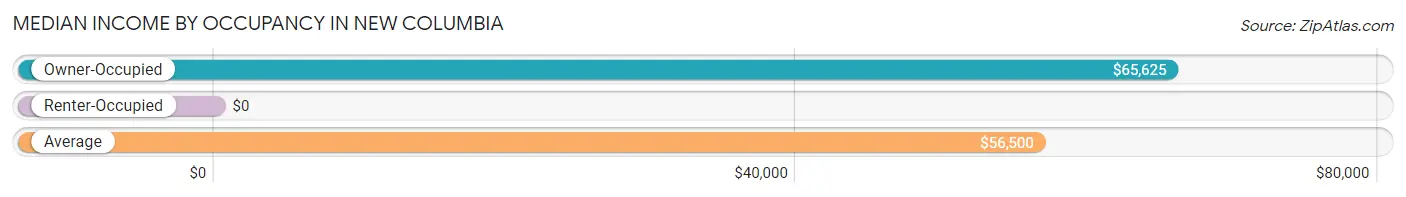
| Occupancy Type | # Households | Median Income |
| Owner-Occupied | 386 (90.6%) | $65,625 |
| Renter-Occupied | 40 (9.4%) | $0 |
| Average | 426 (100.0%) | $56,500 |
Occupancy by Householder Income Bracket in New Columbia
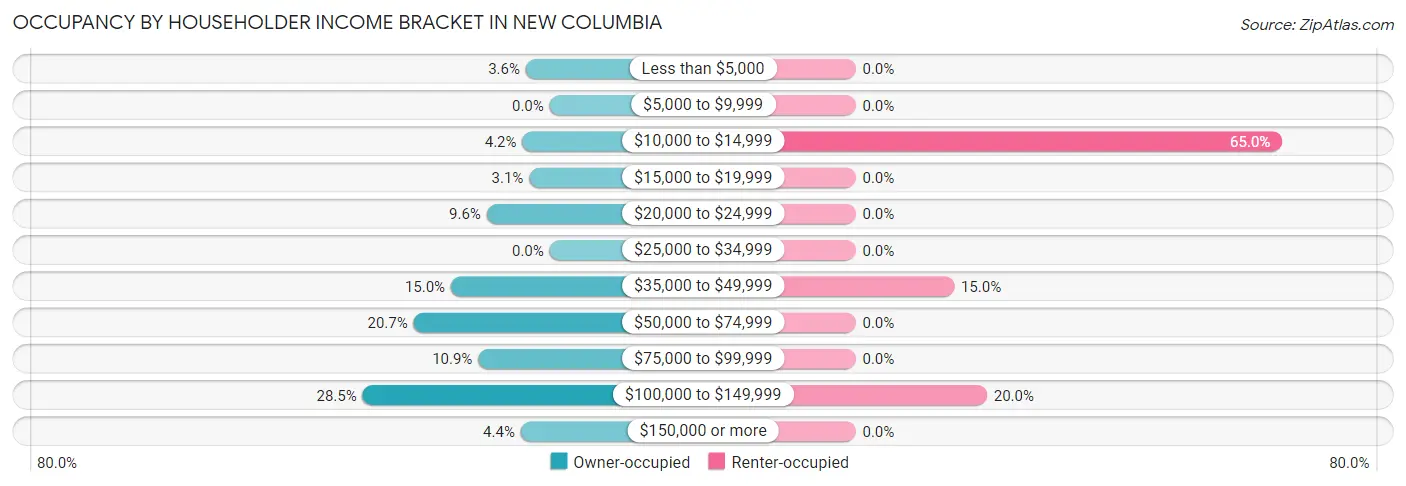
| Income Bracket | Owner-occupied | Renter-occupied |
| Less than $5,000 | 14 (3.6%) | 0 (0.0%) |
| $5,000 to $9,999 | 0 (0.0%) | 0 (0.0%) |
| $10,000 to $14,999 | 16 (4.2%) | 26 (65.0%) |
| $15,000 to $19,999 | 12 (3.1%) | 0 (0.0%) |
| $20,000 to $24,999 | 37 (9.6%) | 0 (0.0%) |
| $25,000 to $34,999 | 0 (0.0%) | 0 (0.0%) |
| $35,000 to $49,999 | 58 (15.0%) | 6 (15.0%) |
| $50,000 to $74,999 | 80 (20.7%) | 0 (0.0%) |
| $75,000 to $99,999 | 42 (10.9%) | 0 (0.0%) |
| $100,000 to $149,999 | 110 (28.5%) | 8 (20.0%) |
| $150,000 or more | 17 (4.4%) | 0 (0.0%) |
| Total | 386 (100.0%) | 40 (100.0%) |
Monthly Housing Cost Tiers in New Columbia
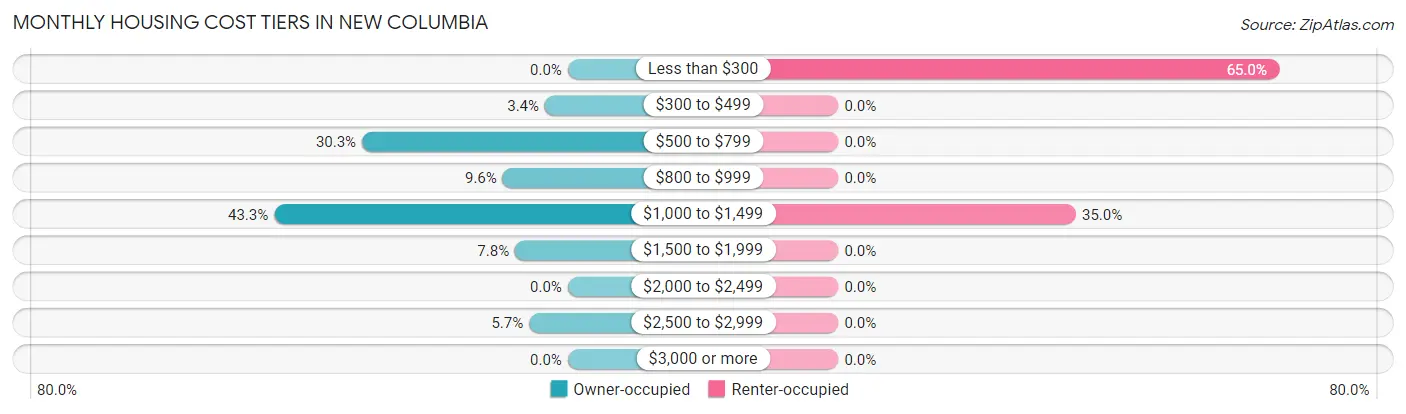
| Monthly Cost | Owner-occupied | Renter-occupied |
| Less than $300 | 0 (0.0%) | 26 (65.0%) |
| $300 to $499 | 13 (3.4%) | 0 (0.0%) |
| $500 to $799 | 117 (30.3%) | 0 (0.0%) |
| $800 to $999 | 37 (9.6%) | 0 (0.0%) |
| $1,000 to $1,499 | 167 (43.3%) | 14 (35.0%) |
| $1,500 to $1,999 | 30 (7.8%) | 0 (0.0%) |
| $2,000 to $2,499 | 0 (0.0%) | 0 (0.0%) |
| $2,500 to $2,999 | 22 (5.7%) | 0 (0.0%) |
| $3,000 or more | 0 (0.0%) | 0 (0.0%) |
| Total | 386 (100.0%) | 40 (100.0%) |
Physical Housing Characteristics in New Columbia
Housing Structures in New Columbia
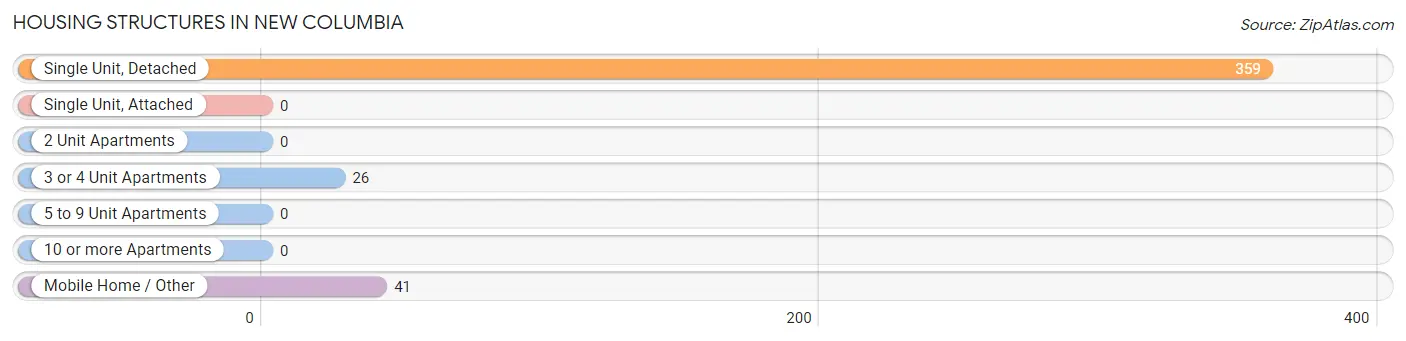
| Structure Type | # Housing Units | % Housing Units |
| Single Unit, Detached | 359 | 84.3% |
| Single Unit, Attached | 0 | 0.0% |
| 2 Unit Apartments | 0 | 0.0% |
| 3 or 4 Unit Apartments | 26 | 6.1% |
| 5 to 9 Unit Apartments | 0 | 0.0% |
| 10 or more Apartments | 0 | 0.0% |
| Mobile Home / Other | 41 | 9.6% |
| Total | 426 | 100.0% |
Housing Structures by Occupancy in New Columbia
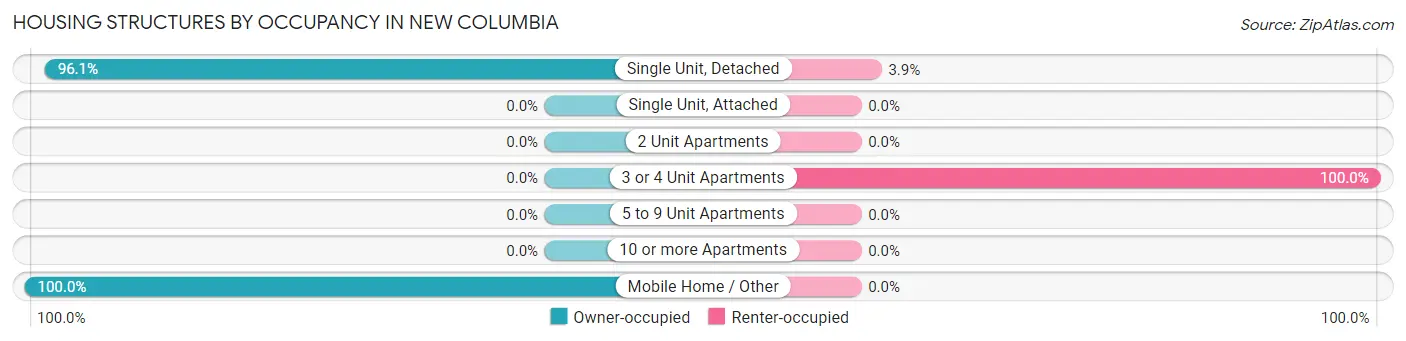
| Structure Type | Owner-occupied | Renter-occupied |
| Single Unit, Detached | 345 (96.1%) | 14 (3.9%) |
| Single Unit, Attached | 0 (0.0%) | 0 (0.0%) |
| 2 Unit Apartments | 0 (0.0%) | 0 (0.0%) |
| 3 or 4 Unit Apartments | 0 (0.0%) | 26 (100.0%) |
| 5 to 9 Unit Apartments | 0 (0.0%) | 0 (0.0%) |
| 10 or more Apartments | 0 (0.0%) | 0 (0.0%) |
| Mobile Home / Other | 41 (100.0%) | 0 (0.0%) |
| Total | 386 (90.6%) | 40 (9.4%) |
Housing Structures by Number of Rooms in New Columbia
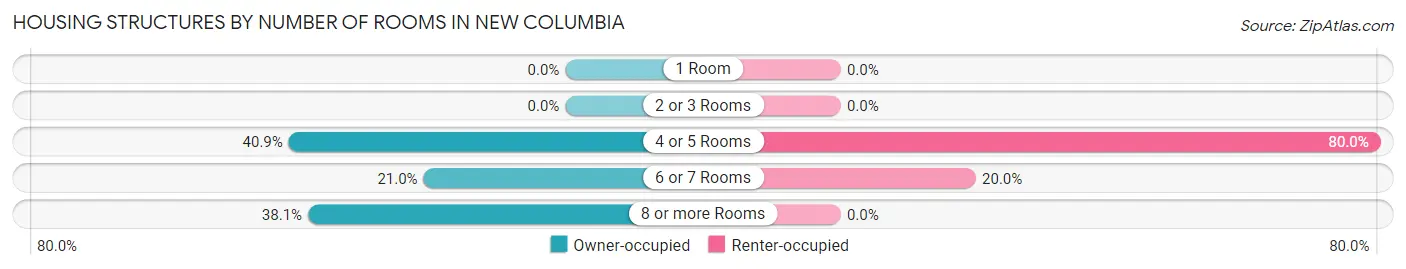
| Number of Rooms | Owner-occupied | Renter-occupied |
| 1 Room | 0 (0.0%) | 0 (0.0%) |
| 2 or 3 Rooms | 0 (0.0%) | 0 (0.0%) |
| 4 or 5 Rooms | 158 (40.9%) | 32 (80.0%) |
| 6 or 7 Rooms | 81 (21.0%) | 8 (20.0%) |
| 8 or more Rooms | 147 (38.1%) | 0 (0.0%) |
| Total | 386 (100.0%) | 40 (100.0%) |
Housing Structure by Heating Type in New Columbia
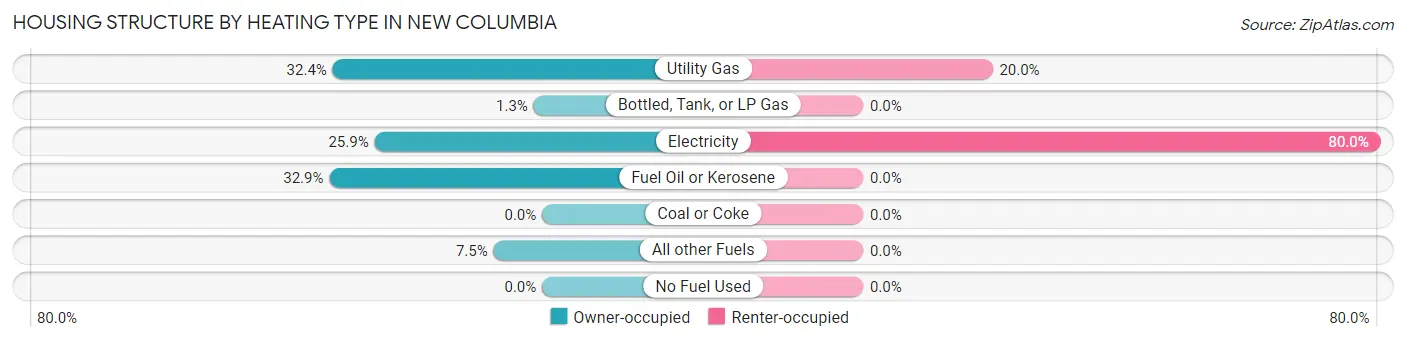
| Heating Type | Owner-occupied | Renter-occupied |
| Utility Gas | 125 (32.4%) | 8 (20.0%) |
| Bottled, Tank, or LP Gas | 5 (1.3%) | 0 (0.0%) |
| Electricity | 100 (25.9%) | 32 (80.0%) |
| Fuel Oil or Kerosene | 127 (32.9%) | 0 (0.0%) |
| Coal or Coke | 0 (0.0%) | 0 (0.0%) |
| All other Fuels | 29 (7.5%) | 0 (0.0%) |
| No Fuel Used | 0 (0.0%) | 0 (0.0%) |
| Total | 386 (100.0%) | 40 (100.0%) |
Household Vehicle Usage in New Columbia
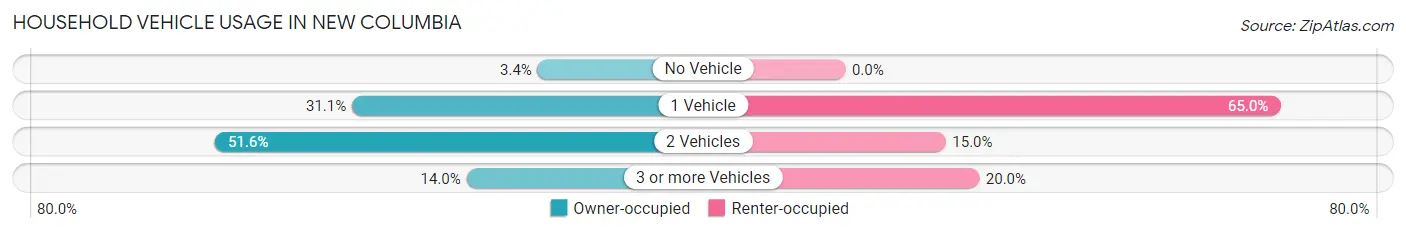
| Vehicles per Household | Owner-occupied | Renter-occupied |
| No Vehicle | 13 (3.4%) | 0 (0.0%) |
| 1 Vehicle | 120 (31.1%) | 26 (65.0%) |
| 2 Vehicles | 199 (51.5%) | 6 (15.0%) |
| 3 or more Vehicles | 54 (14.0%) | 8 (20.0%) |
| Total | 386 (100.0%) | 40 (100.0%) |
Real Estate & Mortgages in New Columbia
Real Estate and Mortgage Overview in New Columbia
| Characteristic | Without Mortgage | With Mortgage |
| Housing Units | 121 | 265 |
| Median Property Value | $162,500 | $162,000 |
| Median Household Income | $54,489 | $17 |
| Monthly Housing Costs | $715 | $0 |
| Real Estate Taxes | $1,630 | $0 |
Property Value by Mortgage Status in New Columbia
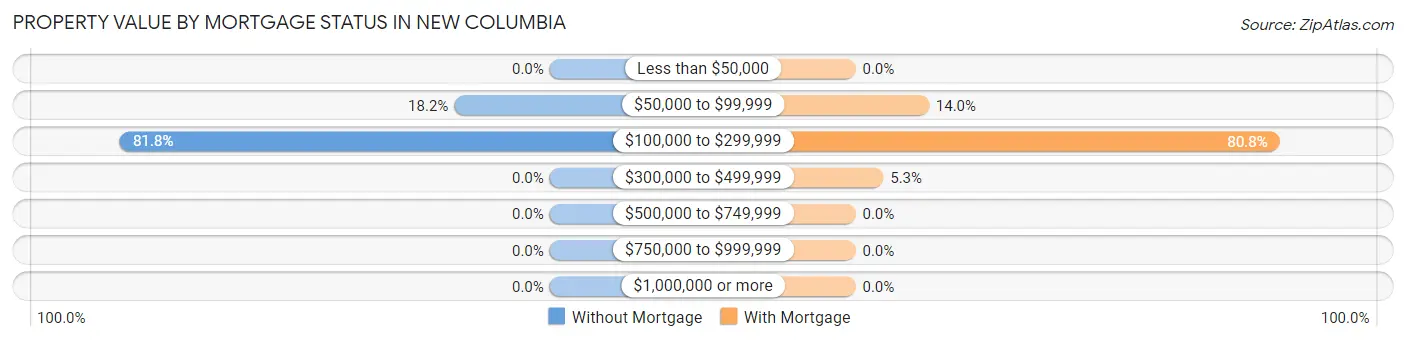
| Property Value | Without Mortgage | With Mortgage |
| Less than $50,000 | 0 (0.0%) | 0 (0.0%) |
| $50,000 to $99,999 | 22 (18.2%) | 37 (14.0%) |
| $100,000 to $299,999 | 99 (81.8%) | 214 (80.7%) |
| $300,000 to $499,999 | 0 (0.0%) | 14 (5.3%) |
| $500,000 to $749,999 | 0 (0.0%) | 0 (0.0%) |
| $750,000 to $999,999 | 0 (0.0%) | 0 (0.0%) |
| $1,000,000 or more | 0 (0.0%) | 0 (0.0%) |
| Total | 121 (100.0%) | 265 (100.0%) |
Household Income by Mortgage Status in New Columbia
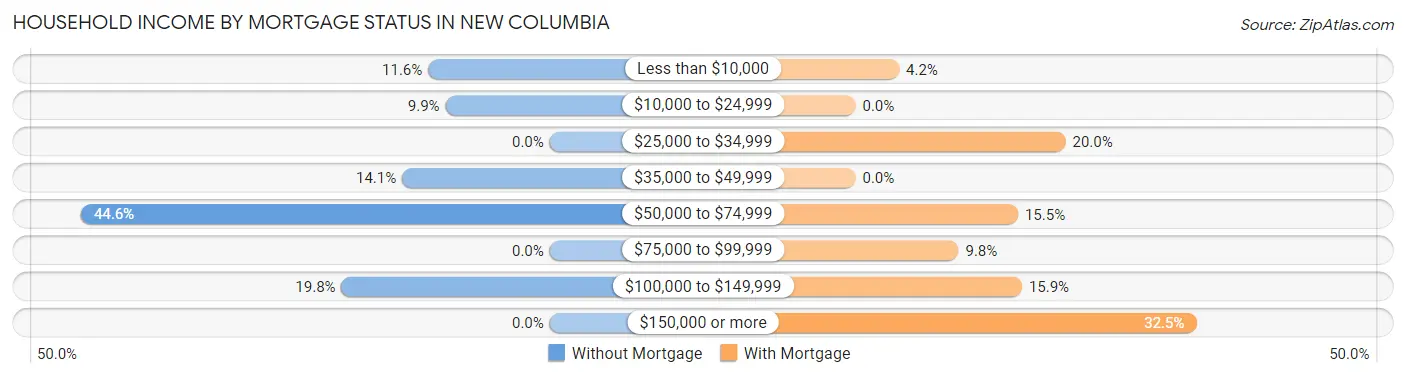
| Household Income | Without Mortgage | With Mortgage |
| Less than $10,000 | 14 (11.6%) | 11 (4.2%) |
| $10,000 to $24,999 | 12 (9.9%) | 0 (0.0%) |
| $25,000 to $34,999 | 0 (0.0%) | 53 (20.0%) |
| $35,000 to $49,999 | 17 (14.1%) | 0 (0.0%) |
| $50,000 to $74,999 | 54 (44.6%) | 41 (15.5%) |
| $75,000 to $99,999 | 0 (0.0%) | 26 (9.8%) |
| $100,000 to $149,999 | 24 (19.8%) | 42 (15.9%) |
| $150,000 or more | 0 (0.0%) | 86 (32.5%) |
| Total | 121 (100.0%) | 265 (100.0%) |
Property Value to Household Income Ratio in New Columbia
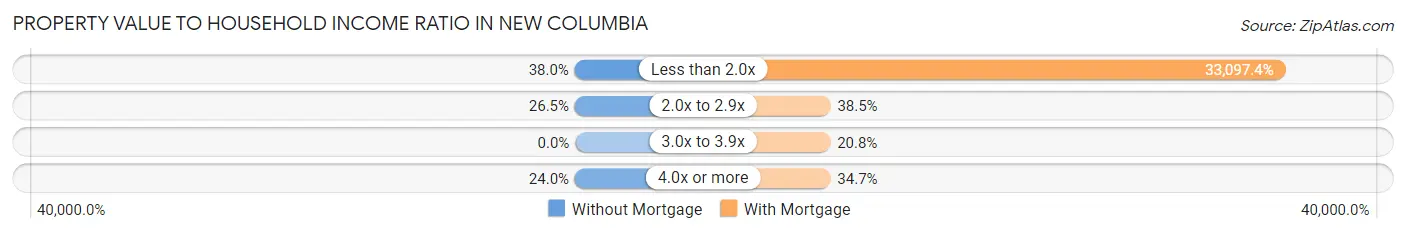
| Value-to-Income Ratio | Without Mortgage | With Mortgage |
| Less than 2.0x | 46 (38.0%) | 87,708 (33,097.4%) |
| 2.0x to 2.9x | 32 (26.5%) | 102 (38.5%) |
| 3.0x to 3.9x | 0 (0.0%) | 55 (20.7%) |
| 4.0x or more | 29 (24.0%) | 92 (34.7%) |
| Total | 121 (100.0%) | 265 (100.0%) |
Real Estate Taxes by Mortgage Status in New Columbia
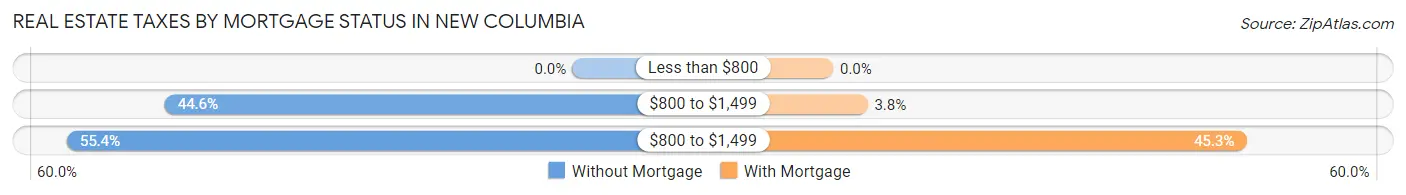
| Property Taxes | Without Mortgage | With Mortgage |
| Less than $800 | 0 (0.0%) | 0 (0.0%) |
| $800 to $1,499 | 54 (44.6%) | 10 (3.8%) |
| $800 to $1,499 | 67 (55.4%) | 120 (45.3%) |
| Total | 121 (100.0%) | 265 (100.0%) |
Health & Disability in New Columbia
Health Insurance Coverage by Age in New Columbia
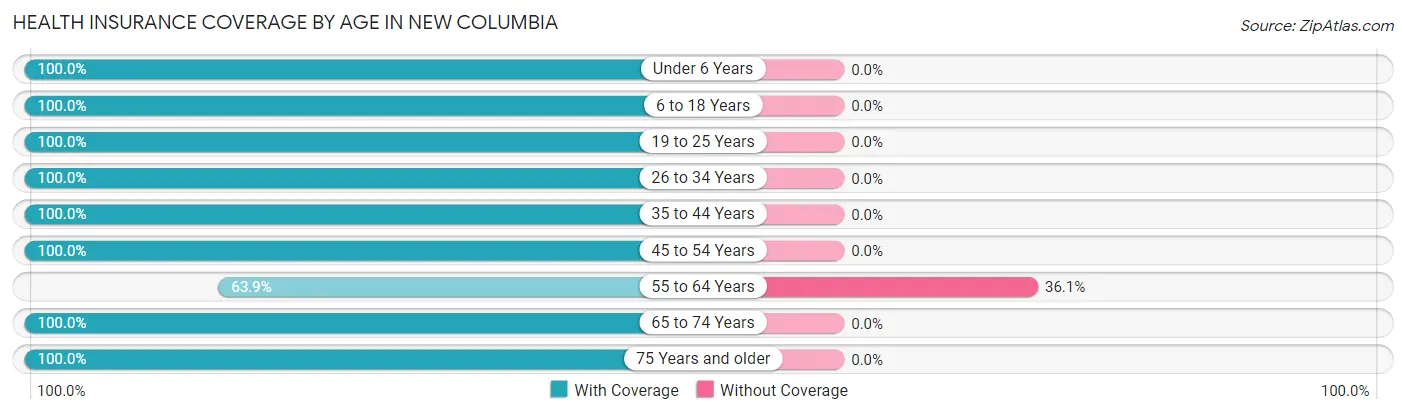
| Age Bracket | With Coverage | Without Coverage |
| Under 6 Years | 48 (100.0%) | 0 (0.0%) |
| 6 to 18 Years | 42 (100.0%) | 0 (0.0%) |
| 19 to 25 Years | 31 (100.0%) | 0 (0.0%) |
| 26 to 34 Years | 140 (100.0%) | 0 (0.0%) |
| 35 to 44 Years | 49 (100.0%) | 0 (0.0%) |
| 45 to 54 Years | 109 (100.0%) | 0 (0.0%) |
| 55 to 64 Years | 152 (63.9%) | 86 (36.1%) |
| 65 to 74 Years | 172 (100.0%) | 0 (0.0%) |
| 75 Years and older | 26 (100.0%) | 0 (0.0%) |
| Total | 769 (89.9%) | 86 (10.1%) |
Health Insurance Coverage by Citizenship Status in New Columbia
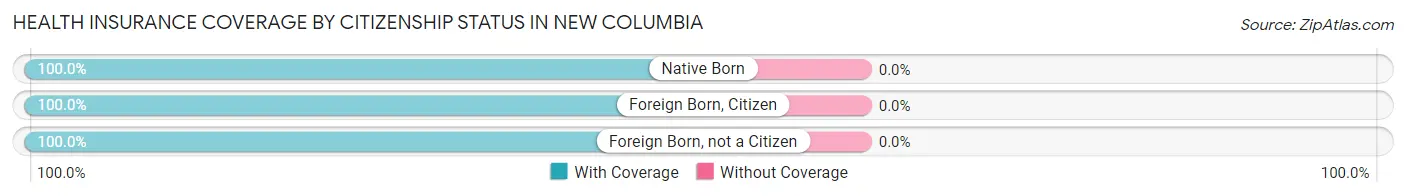
| Citizenship Status | With Coverage | Without Coverage |
| Native Born | 48 (100.0%) | 0 (0.0%) |
| Foreign Born, Citizen | 42 (100.0%) | 0 (0.0%) |
| Foreign Born, not a Citizen | 31 (100.0%) | 0 (0.0%) |
Health Insurance Coverage by Household Income in New Columbia
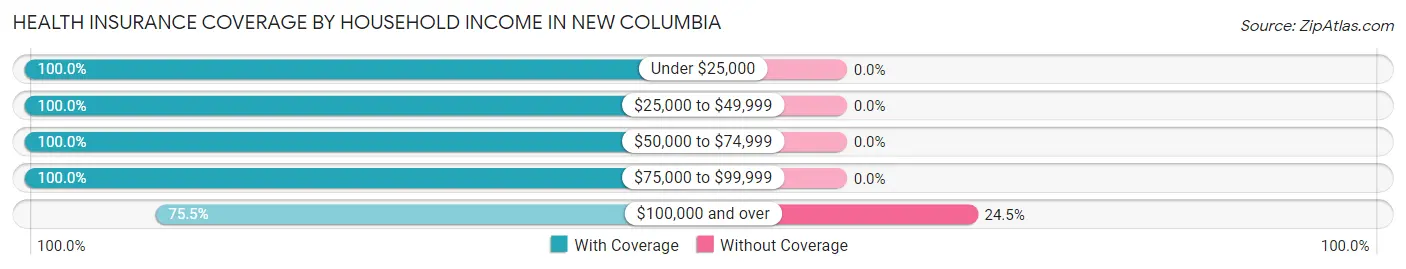
| Household Income | With Coverage | Without Coverage |
| Under $25,000 | 135 (100.0%) | 0 (0.0%) |
| $25,000 to $49,999 | 89 (100.0%) | 0 (0.0%) |
| $50,000 to $74,999 | 152 (100.0%) | 0 (0.0%) |
| $75,000 to $99,999 | 128 (100.0%) | 0 (0.0%) |
| $100,000 and over | 265 (75.5%) | 86 (24.5%) |
Public vs Private Health Insurance Coverage by Age in New Columbia
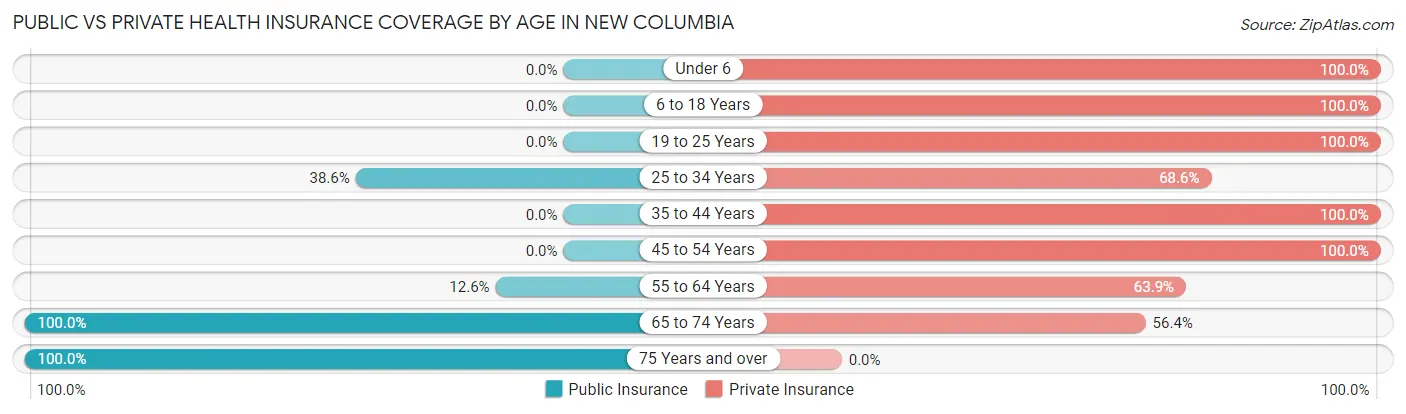
| Age Bracket | Public Insurance | Private Insurance |
| Under 6 | 0 (0.0%) | 48 (100.0%) |
| 6 to 18 Years | 0 (0.0%) | 42 (100.0%) |
| 19 to 25 Years | 0 (0.0%) | 31 (100.0%) |
| 25 to 34 Years | 54 (38.6%) | 96 (68.6%) |
| 35 to 44 Years | 0 (0.0%) | 49 (100.0%) |
| 45 to 54 Years | 0 (0.0%) | 109 (100.0%) |
| 55 to 64 Years | 30 (12.6%) | 152 (63.9%) |
| 65 to 74 Years | 172 (100.0%) | 97 (56.4%) |
| 75 Years and over | 26 (100.0%) | 0 (0.0%) |
| Total | 282 (33.0%) | 624 (73.0%) |
Disability Status by Sex by Age in New Columbia
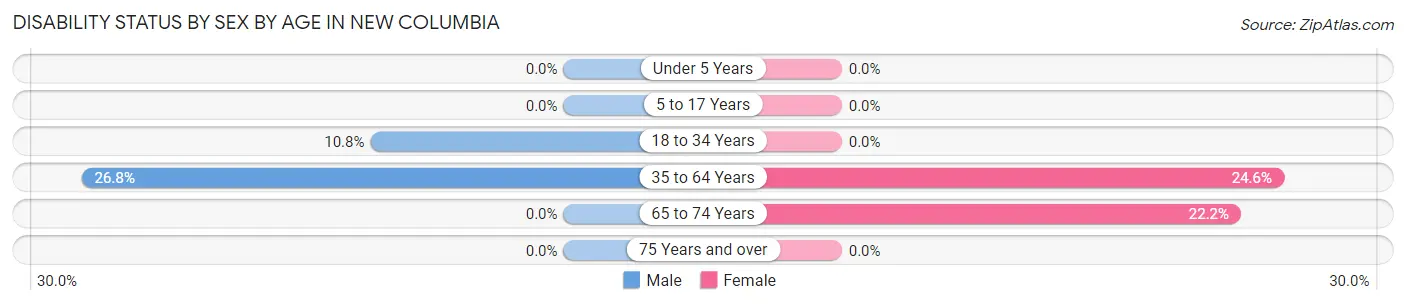
| Age Bracket | Male | Female |
| Under 5 Years | 0 (0.0%) | 0 (0.0%) |
| 5 to 17 Years | 0 (0.0%) | 0 (0.0%) |
| 18 to 34 Years | 10 (10.7%) | 0 (0.0%) |
| 35 to 64 Years | 55 (26.8%) | 47 (24.6%) |
| 65 to 74 Years | 0 (0.0%) | 26 (22.2%) |
| 75 Years and over | 0 (0.0%) | 0 (0.0%) |
Disability Class by Sex by Age in New Columbia
Disability Class: Hearing Difficulty
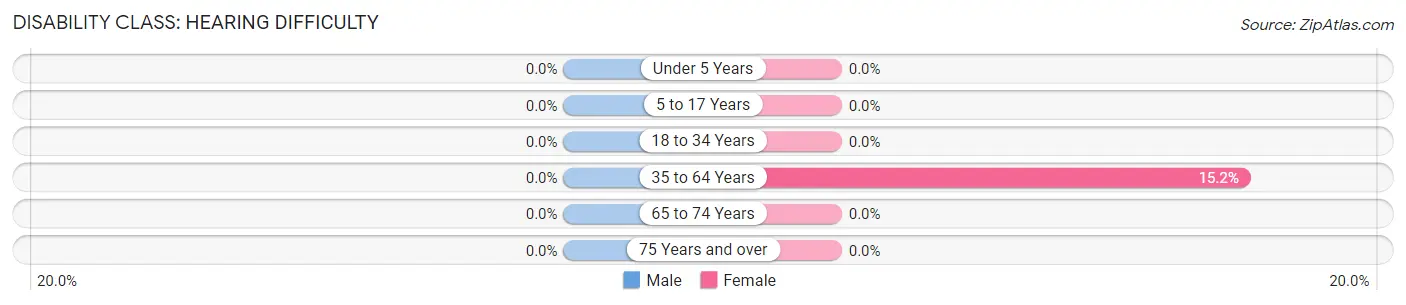
| Age Bracket | Male | Female |
| Under 5 Years | 0 (0.0%) | 0 (0.0%) |
| 5 to 17 Years | 0 (0.0%) | 0 (0.0%) |
| 18 to 34 Years | 0 (0.0%) | 0 (0.0%) |
| 35 to 64 Years | 0 (0.0%) | 29 (15.2%) |
| 65 to 74 Years | 0 (0.0%) | 0 (0.0%) |
| 75 Years and over | 0 (0.0%) | 0 (0.0%) |
Disability Class: Vision Difficulty
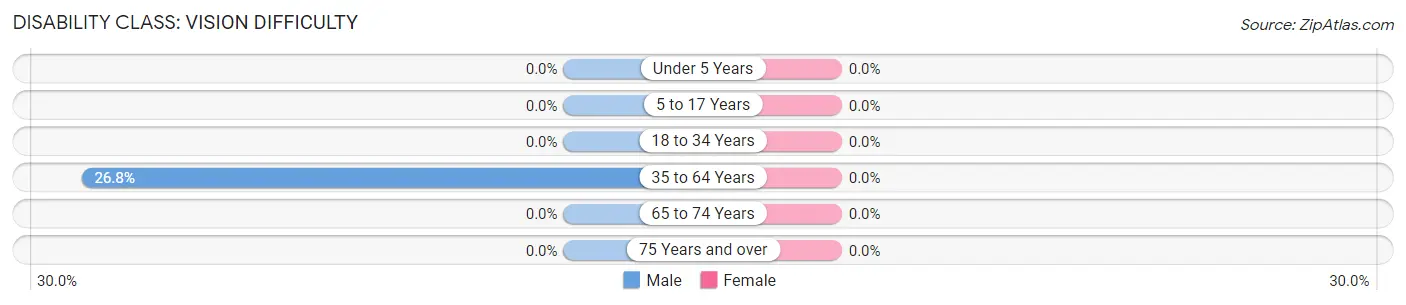
| Age Bracket | Male | Female |
| Under 5 Years | 0 (0.0%) | 0 (0.0%) |
| 5 to 17 Years | 0 (0.0%) | 0 (0.0%) |
| 18 to 34 Years | 0 (0.0%) | 0 (0.0%) |
| 35 to 64 Years | 55 (26.8%) | 0 (0.0%) |
| 65 to 74 Years | 0 (0.0%) | 0 (0.0%) |
| 75 Years and over | 0 (0.0%) | 0 (0.0%) |
Disability Class: Cognitive Difficulty
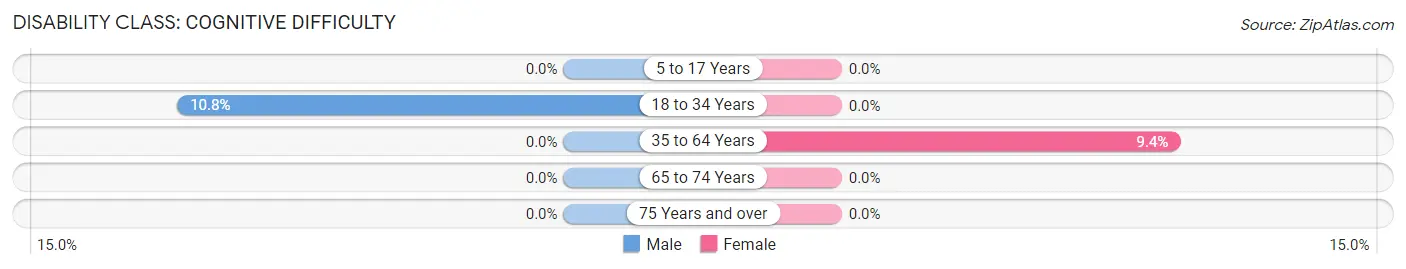
| Age Bracket | Male | Female |
| 5 to 17 Years | 0 (0.0%) | 0 (0.0%) |
| 18 to 34 Years | 10 (10.7%) | 0 (0.0%) |
| 35 to 64 Years | 0 (0.0%) | 18 (9.4%) |
| 65 to 74 Years | 0 (0.0%) | 0 (0.0%) |
| 75 Years and over | 0 (0.0%) | 0 (0.0%) |
Disability Class: Ambulatory Difficulty
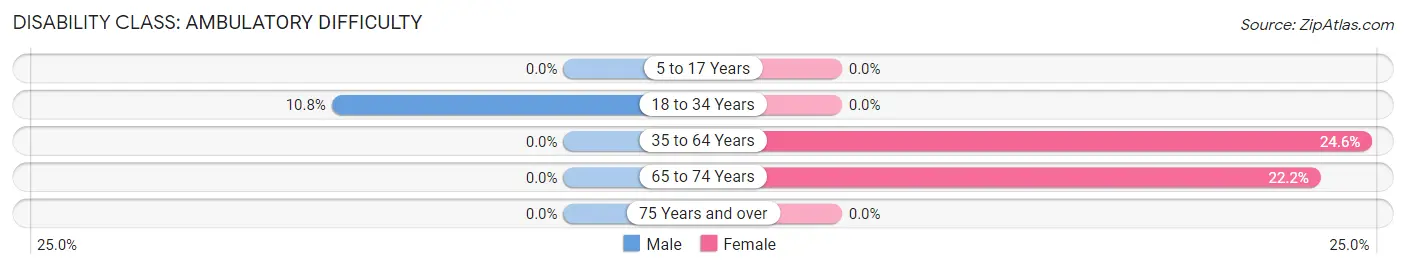
| Age Bracket | Male | Female |
| 5 to 17 Years | 0 (0.0%) | 0 (0.0%) |
| 18 to 34 Years | 10 (10.7%) | 0 (0.0%) |
| 35 to 64 Years | 0 (0.0%) | 47 (24.6%) |
| 65 to 74 Years | 0 (0.0%) | 26 (22.2%) |
| 75 Years and over | 0 (0.0%) | 0 (0.0%) |
Disability Class: Self-Care Difficulty
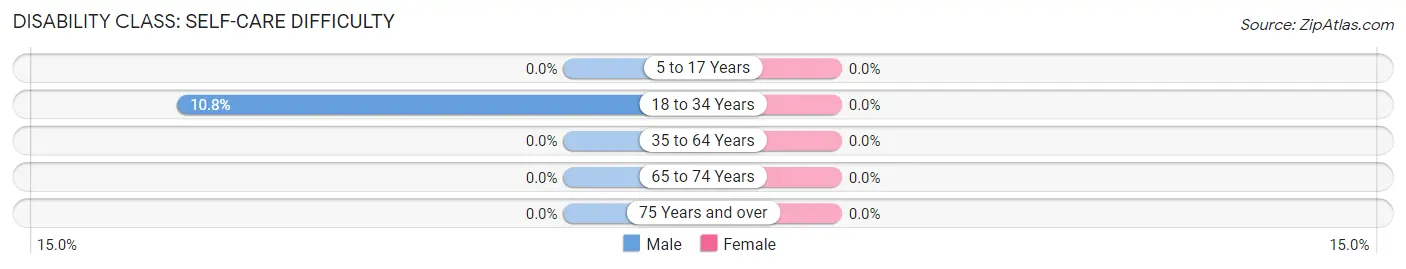
| Age Bracket | Male | Female |
| 5 to 17 Years | 0 (0.0%) | 0 (0.0%) |
| 18 to 34 Years | 10 (10.7%) | 0 (0.0%) |
| 35 to 64 Years | 0 (0.0%) | 0 (0.0%) |
| 65 to 74 Years | 0 (0.0%) | 0 (0.0%) |
| 75 Years and over | 0 (0.0%) | 0 (0.0%) |
Technology Access in New Columbia
Computing Device Access in New Columbia
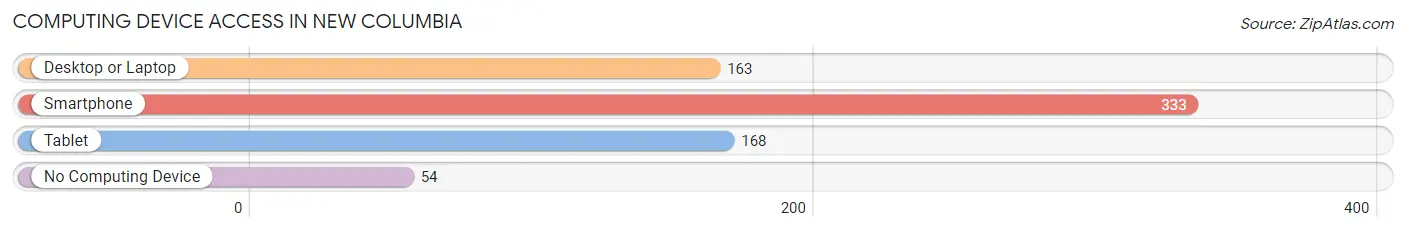
| Device Type | # Households | % Households |
| Desktop or Laptop | 163 | 38.3% |
| Smartphone | 333 | 78.2% |
| Tablet | 168 | 39.4% |
| No Computing Device | 54 | 12.7% |
| Total | 426 | 100.0% |
Internet Access in New Columbia
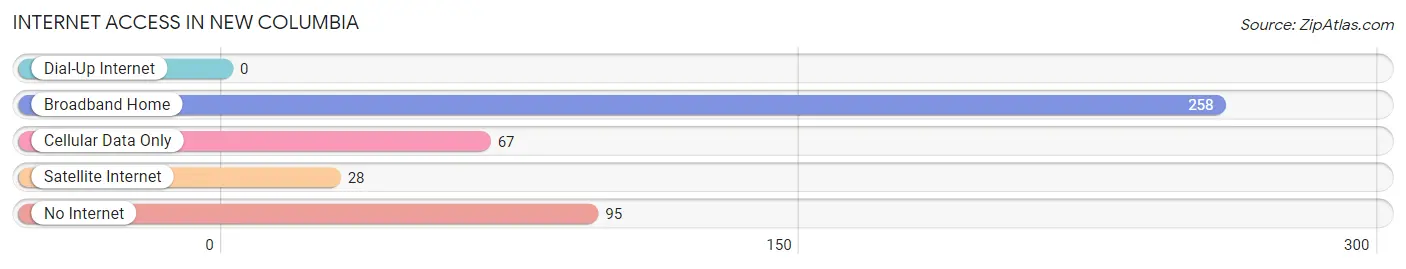
| Internet Type | # Households | % Households |
| Dial-Up Internet | 0 | 0.0% |
| Broadband Home | 258 | 60.6% |
| Cellular Data Only | 67 | 15.7% |
| Satellite Internet | 28 | 6.6% |
| No Internet | 95 | 22.3% |
| Total | 426 | 100.0% |
New Columbia Summary
New Columbia, Pennsylvania is a small borough located in Northumberland County, Pennsylvania. It is situated in the Susquehanna Valley, approximately 10 miles north of the city of Sunbury. The borough was incorporated in 1876 and has a population of approximately 1,000 people.
Geography
New Columbia is located in the Susquehanna Valley, which is a large valley that runs along the Susquehanna River. The borough is situated on the west side of the river, and is bordered by the townships of Upper Augusta, Lower Augusta, and Turbot. The terrain of the borough is mostly flat, with some rolling hills in the surrounding area. The climate is humid continental, with hot summers and cold winters.
Economy
The economy of New Columbia is largely based on agriculture and manufacturing. The borough is home to several small businesses, including a grocery store, a hardware store, and a few restaurants. The local economy is also supported by the nearby Sunbury Industrial Park, which is home to several large companies. Additionally, the borough is home to a number of small farms, which produce a variety of crops, including corn, soybeans, and hay.
Demographics
As of the 2010 census, the population of New Columbia was 1,000 people. The racial makeup of the borough was 97.2% White, 0.7% African American, 0.3% Native American, 0.3% Asian, and 1.5% from two or more races. The median household income was $41,250, and the median family income was $50,000. The per capita income was $20,000.
Conclusion
New Columbia, Pennsylvania is a small borough located in Northumberland County. It is situated in the Susquehanna Valley, and is home to approximately 1,000 people. The economy of the borough is largely based on agriculture and manufacturing, and the local economy is supported by the nearby Sunbury Industrial Park. The population of the borough is mostly White, with a small percentage of African American, Native American, and Asian residents. The median household income is $41,250, and the median family income is $50,000.
Common Questions
What is Per Capita Income in New Columbia?
Per Capita income in New Columbia is $35,210.
What is the Median Family Income in New Columbia?
Median Family Income in New Columbia is $90,096.
What is the Median Household income in New Columbia?
Median Household Income in New Columbia is $56,500.
What is Income or Wage Gap in New Columbia?
Income or Wage Gap in New Columbia is 63.6%.
Women in New Columbia earn 36.4 cents for every dollar earned by a man.
What is Inequality or Gini Index in New Columbia?
Inequality or Gini Index in New Columbia is 0.37.
What is the Total Population of New Columbia?
Total Population of New Columbia is 855.
What is the Total Male Population of New Columbia?
Total Male Population of New Columbia is 362.
What is the Total Female Population of New Columbia?
Total Female Population of New Columbia is 493.
What is the Ratio of Males per 100 Females in New Columbia?
There are 73.43 Males per 100 Females in New Columbia.
What is the Ratio of Females per 100 Males in New Columbia?
There are 136.19 Females per 100 Males in New Columbia.
What is the Median Population Age in New Columbia?
Median Population Age in New Columbia is 56.1 Years.
What is the Average Family Size in New Columbia
Average Family Size in New Columbia is 2.4 People.
What is the Average Household Size in New Columbia
Average Household Size in New Columbia is 2.0 People.
How Large is the Labor Force in New Columbia?
There are 488 People in the Labor Forcein in New Columbia.
What is the Percentage of People in the Labor Force in New Columbia?
62.3% of People are in the Labor Force in New Columbia.