Laurelton, PA Map & Demographics
Laurelton Map
Laurelton Overview
$22,630
PER CAPITA INCOME
$65,000
AVG FAMILY INCOME
$52,708
AVG HOUSEHOLD INCOME
21.0%
WAGE / INCOME GAP [ % ]
79.0¢/ $1
WAGE / INCOME GAP [ $ ]
0.33
INEQUALITY / GINI INDEX
366
TOTAL POPULATION
139
MALE POPULATION
227
FEMALE POPULATION
61.23
MALES / 100 FEMALES
163.31
FEMALES / 100 MALES
35.0
MEDIAN AGE
3.5
AVG FAMILY SIZE
3.2
AVG HOUSEHOLD SIZE
191
LABOR FORCE [ PEOPLE ]
76.1%
PERCENT IN LABOR FORCE
Laurelton Zip Codes
Laurelton Area Codes
Income in Laurelton
Income Overview in Laurelton
Per Capita Income in Laurelton is $22,630, while median incomes of families and households are $65,000 and $52,708 respectively.
| Characteristic | Number | Measure |
| Per Capita Income | 366 | $22,630 |
| Median Family Income | 96 | $65,000 |
| Mean Family Income | 96 | $78,680 |
| Median Household Income | 115 | $52,708 |
| Mean Household Income | 115 | $70,899 |
| Income Deficit | 96 | $0 |
| Wage / Income Gap (%) | 366 | 20.95% |
| Wage / Income Gap ($) | 366 | 79.05¢ per $1 |
| Gini / Inequality Index | 366 | 0.33 |
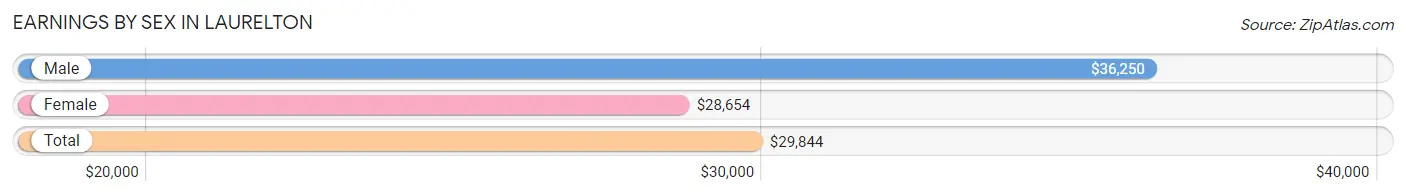
Earnings by Sex in Laurelton
Average Earnings in Laurelton are $29,844, $36,250 for men and $28,654 for women, a difference of 20.9%.
| Sex | Number | Average Earnings |
| Male | 84 (41.2%) | $36,250 |
| Female | 120 (58.8%) | $28,654 |
| Total | 204 (100.0%) | $29,844 |
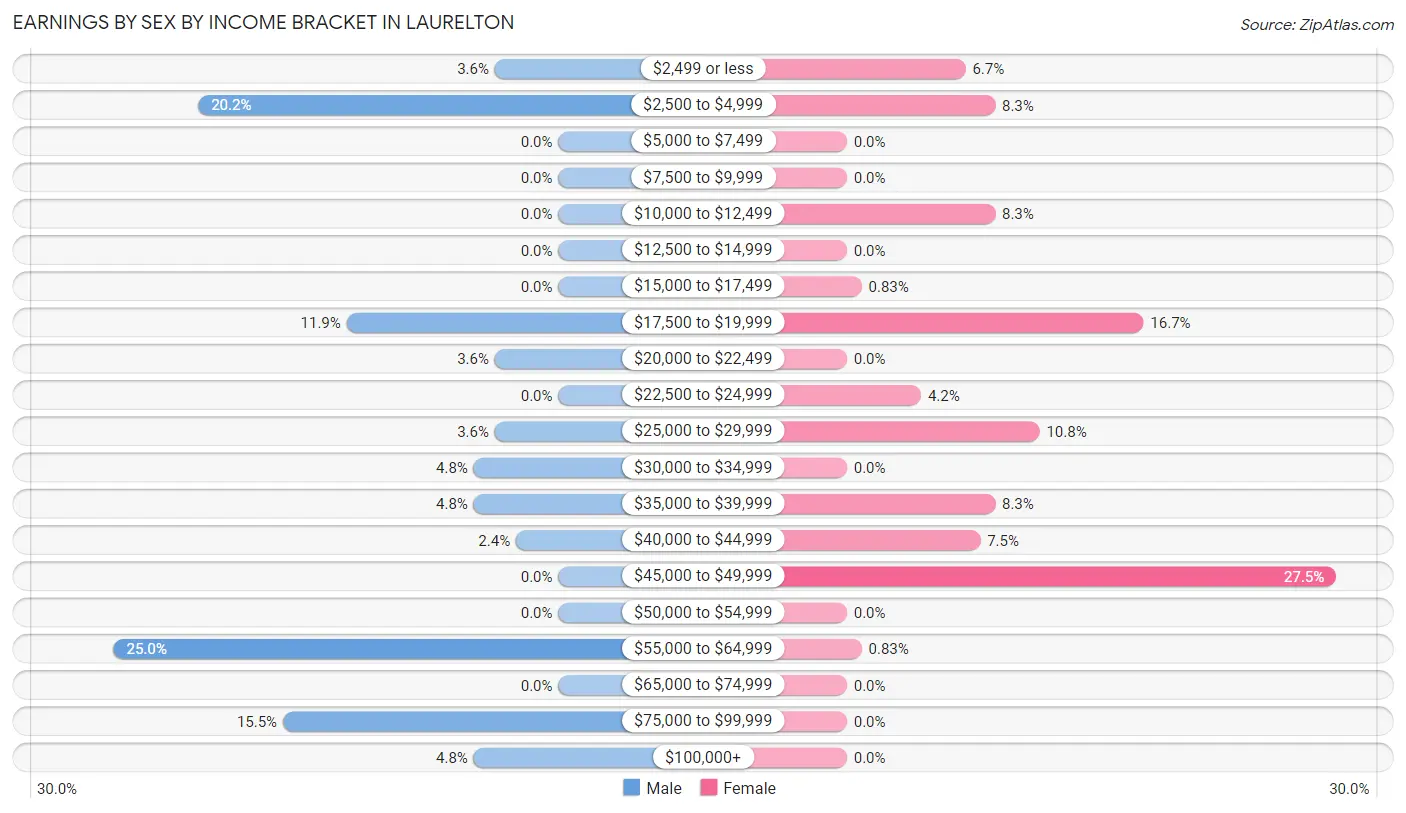
Earnings by Sex by Income Bracket in Laurelton
The most common earnings brackets in Laurelton are $55,000 to $64,999 for men (21 | 25.0%) and $45,000 to $49,999 for women (33 | 27.5%).
| Income | Male | Female |
| $2,499 or less | 3 (3.6%) | 8 (6.7%) |
| $2,500 to $4,999 | 17 (20.2%) | 10 (8.3%) |
| $5,000 to $7,499 | 0 (0.0%) | 0 (0.0%) |
| $7,500 to $9,999 | 0 (0.0%) | 0 (0.0%) |
| $10,000 to $12,499 | 0 (0.0%) | 10 (8.3%) |
| $12,500 to $14,999 | 0 (0.0%) | 0 (0.0%) |
| $15,000 to $17,499 | 0 (0.0%) | 1 (0.8%) |
| $17,500 to $19,999 | 10 (11.9%) | 20 (16.7%) |
| $20,000 to $22,499 | 3 (3.6%) | 0 (0.0%) |
| $22,500 to $24,999 | 0 (0.0%) | 5 (4.2%) |
| $25,000 to $29,999 | 3 (3.6%) | 13 (10.8%) |
| $30,000 to $34,999 | 4 (4.8%) | 0 (0.0%) |
| $35,000 to $39,999 | 4 (4.8%) | 10 (8.3%) |
| $40,000 to $44,999 | 2 (2.4%) | 9 (7.5%) |
| $45,000 to $49,999 | 0 (0.0%) | 33 (27.5%) |
| $50,000 to $54,999 | 0 (0.0%) | 0 (0.0%) |
| $55,000 to $64,999 | 21 (25.0%) | 1 (0.8%) |
| $65,000 to $74,999 | 0 (0.0%) | 0 (0.0%) |
| $75,000 to $99,999 | 13 (15.5%) | 0 (0.0%) |
| $100,000+ | 4 (4.8%) | 0 (0.0%) |
| Total | 84 (100.0%) | 120 (100.0%) |
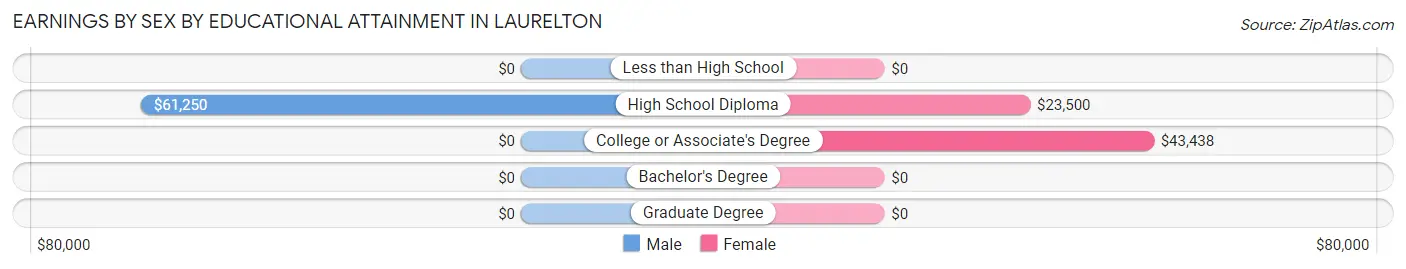
Earnings by Sex by Educational Attainment in Laurelton
Average earnings in Laurelton are $60,556 for men and $35,500 for women, a difference of 41.4%. Men with an educational attainment of high school diploma enjoy the highest average annual earnings of $61,250, while those with high school diploma education earn the least with $61,250. Women with an educational attainment of college or associate's degree earn the most with the average annual earnings of $43,438, while those with high school diploma education have the smallest earnings of $23,500.
| Educational Attainment | Male Income | Female Income |
| Less than High School | - | - |
| High School Diploma | $61,250 | $23,500 |
| College or Associate's Degree | - | - |
| Bachelor's Degree | - | - |
| Graduate Degree | - | - |
| Total | $60,556 | $35,500 |
Family Income in Laurelton
Family Income Brackets in Laurelton
According to the Laurelton family income data, there are 34 families falling into the $35,000 to $49,999 income range, which is the most common income bracket and makes up 35.4% of all families.
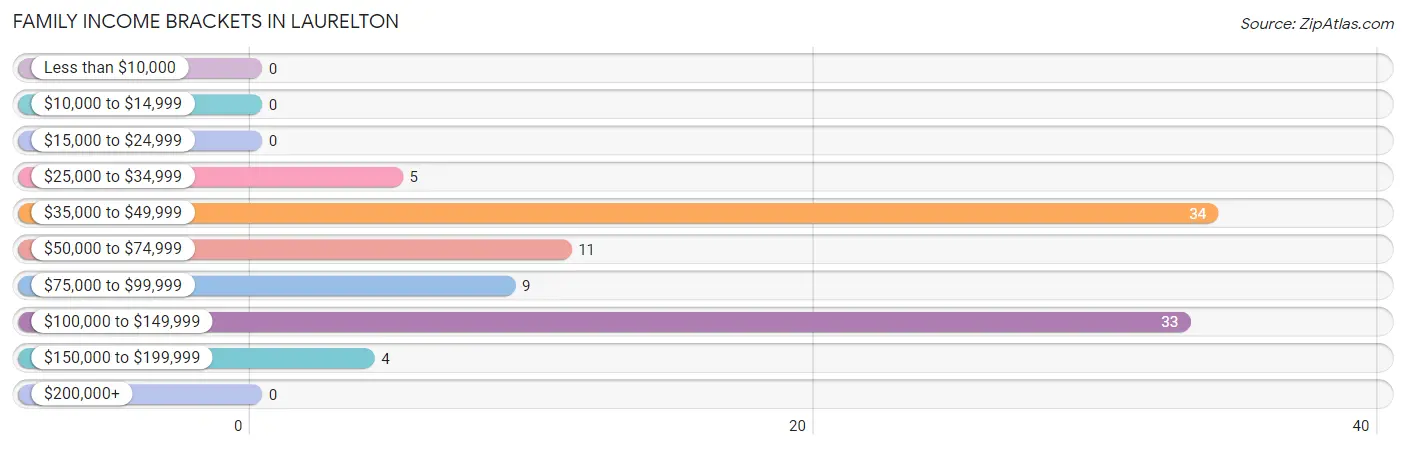
| Income Bracket | # Families | % Families |
| Less than $10,000 | 0 | 0.0% |
| $10,000 to $14,999 | 0 | 0.0% |
| $15,000 to $24,999 | 0 | 0.0% |
| $25,000 to $34,999 | 5 | 5.2% |
| $35,000 to $49,999 | 34 | 35.4% |
| $50,000 to $74,999 | 11 | 11.5% |
| $75,000 to $99,999 | 9 | 9.4% |
| $100,000 to $149,999 | 33 | 34.4% |
| $150,000 to $199,999 | 4 | 4.2% |
| $200,000+ | 0 | 0.0% |
Family Income by Famaliy Size in Laurelton
4-person families (25 | 26.0%) account for the highest median family income in Laurelton with $108,750 per family, while 2-person families (21 | 21.9%) have the highest median income of $27,396 per family member.
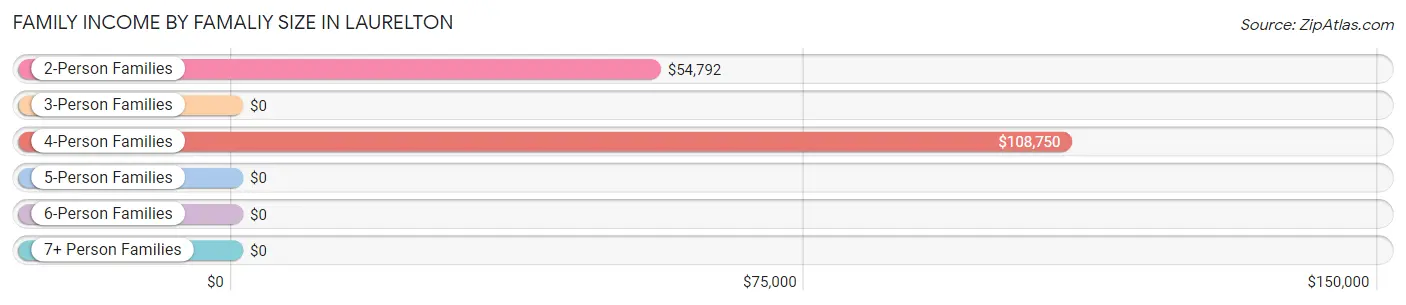
| Income Bracket | # Families | Median Income |
| 2-Person Families | 21 (21.9%) | $54,792 |
| 3-Person Families | 32 (33.3%) | $0 |
| 4-Person Families | 25 (26.0%) | $108,750 |
| 5-Person Families | 11 (11.5%) | $0 |
| 6-Person Families | 0 (0.0%) | $0 |
| 7+ Person Families | 7 (7.3%) | $0 |
| Total | 96 (100.0%) | $65,000 |
Family Income by Number of Earners in Laurelton
The median family income in Laurelton is $65,000, with families comprising 3+ earners (28) having the highest median family income of $133,250, while families with no earners (8) have the lowest median family income of $28,750, accounting for 29.2% and 8.3% of families, respectively.
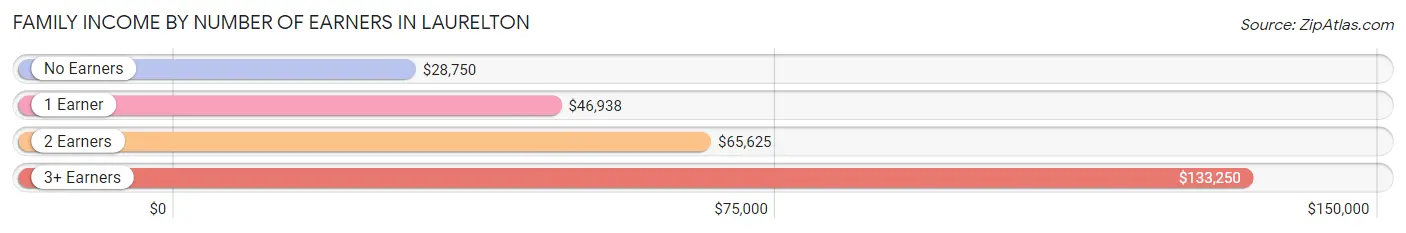
| Number of Earners | # Families | Median Income |
| No Earners | 8 (8.3%) | $28,750 |
| 1 Earner | 31 (32.3%) | $46,938 |
| 2 Earners | 29 (30.2%) | $65,625 |
| 3+ Earners | 28 (29.2%) | $133,250 |
| Total | 96 (100.0%) | $65,000 |
Household Income in Laurelton
Household Income Brackets in Laurelton
With 42 households falling in the category, the $35,000 to $49,999 income range is the most frequent in Laurelton, accounting for 36.5% of all households.
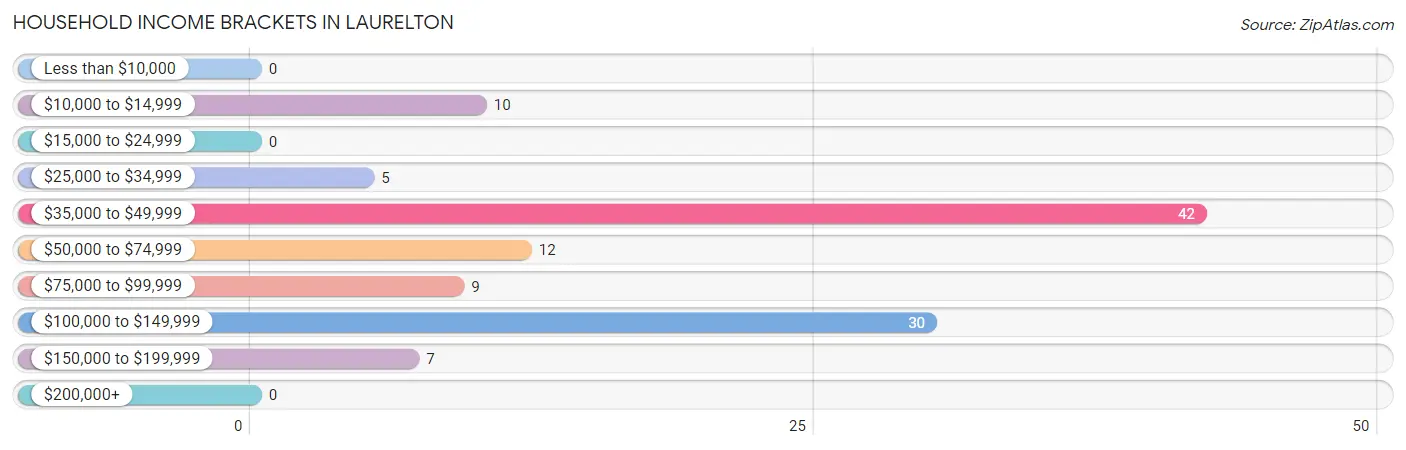
| Income Bracket | # Households | % Households |
| Less than $10,000 | 0 | 0.0% |
| $10,000 to $14,999 | 10 | 8.7% |
| $15,000 to $24,999 | 0 | 0.0% |
| $25,000 to $34,999 | 5 | 4.3% |
| $35,000 to $49,999 | 42 | 36.5% |
| $50,000 to $74,999 | 12 | 10.4% |
| $75,000 to $99,999 | 9 | 7.8% |
| $100,000 to $149,999 | 30 | 26.1% |
| $150,000 to $199,999 | 7 | 6.1% |
| $200,000+ | 0 | 0.0% |
Household Income by Householder Age in Laurelton
The median household income in Laurelton is $52,708, with the highest median household income of $108,000 found in the 45 to 64 years age bracket for the primary householder. A total of 42 households (36.5%) fall into this category.
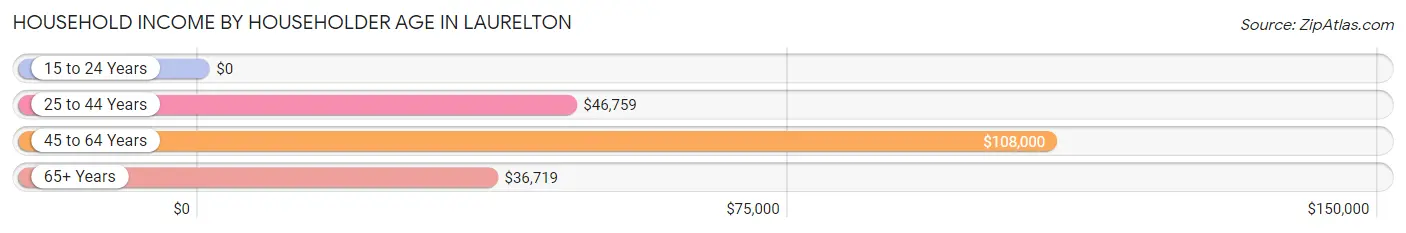
| Income Bracket | # Households | Median Income |
| 15 to 24 Years | 0 (0.0%) | $0 |
| 25 to 44 Years | 52 (45.2%) | $46,759 |
| 45 to 64 Years | 42 (36.5%) | $108,000 |
| 65+ Years | 21 (18.3%) | $36,719 |
| Total | 115 (100.0%) | $52,708 |
Poverty in Laurelton
Income Below Poverty by Sex and Age in Laurelton
With 14.4% poverty level for males and 20.3% for females among the residents of Laurelton, under 5 year old males and 25 to 34 year old females are the most vulnerable to poverty, with 10 males (100.0%) and 7 females (58.3%) in their respective age groups living below the poverty level.
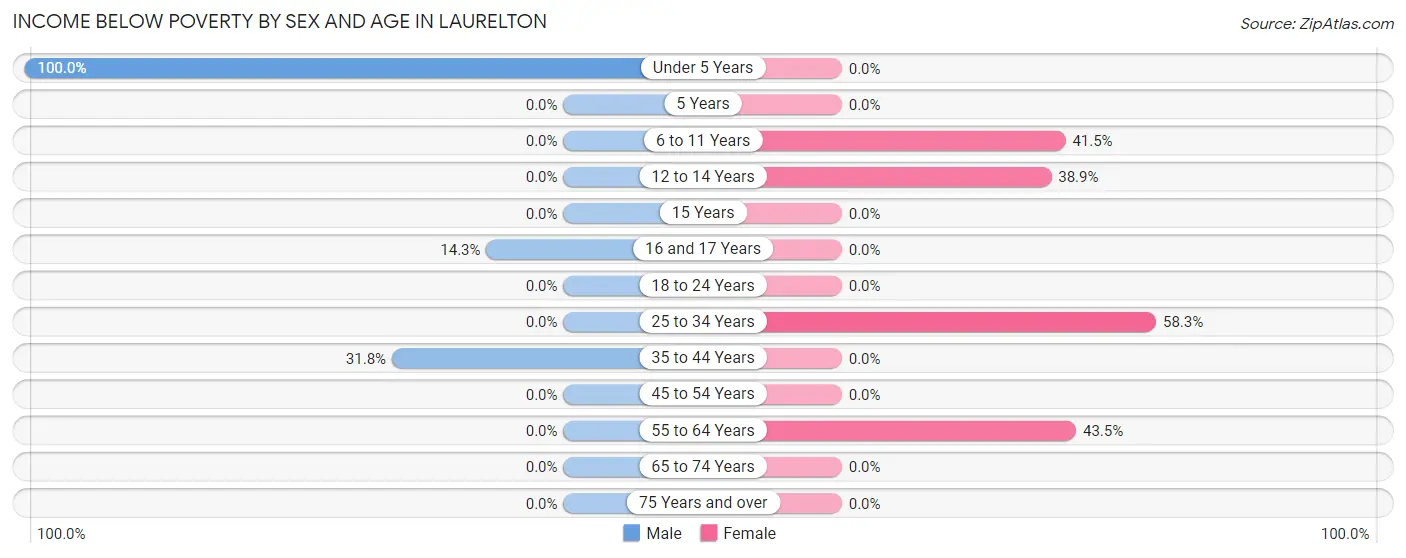
| Age Bracket | Male | Female |
| Under 5 Years | 10 (100.0%) | 0 (0.0%) |
| 5 Years | 0 (0.0%) | 0 (0.0%) |
| 6 to 11 Years | 0 (0.0%) | 22 (41.5%) |
| 12 to 14 Years | 0 (0.0%) | 7 (38.9%) |
| 15 Years | 0 (0.0%) | 0 (0.0%) |
| 16 and 17 Years | 3 (14.3%) | 0 (0.0%) |
| 18 to 24 Years | 0 (0.0%) | 0 (0.0%) |
| 25 to 34 Years | 0 (0.0%) | 7 (58.3%) |
| 35 to 44 Years | 7 (31.8%) | 0 (0.0%) |
| 45 to 54 Years | 0 (0.0%) | 0 (0.0%) |
| 55 to 64 Years | 0 (0.0%) | 10 (43.5%) |
| 65 to 74 Years | 0 (0.0%) | 0 (0.0%) |
| 75 Years and over | 0 (0.0%) | 0 (0.0%) |
| Total | 20 (14.4%) | 46 (20.3%) |
Income Above Poverty by Sex and Age in Laurelton
According to the poverty statistics in Laurelton, males aged 12 to 14 years and females aged 15 years are the age groups that are most secure financially, with 100.0% of males and 100.0% of females in these age groups living above the poverty line.
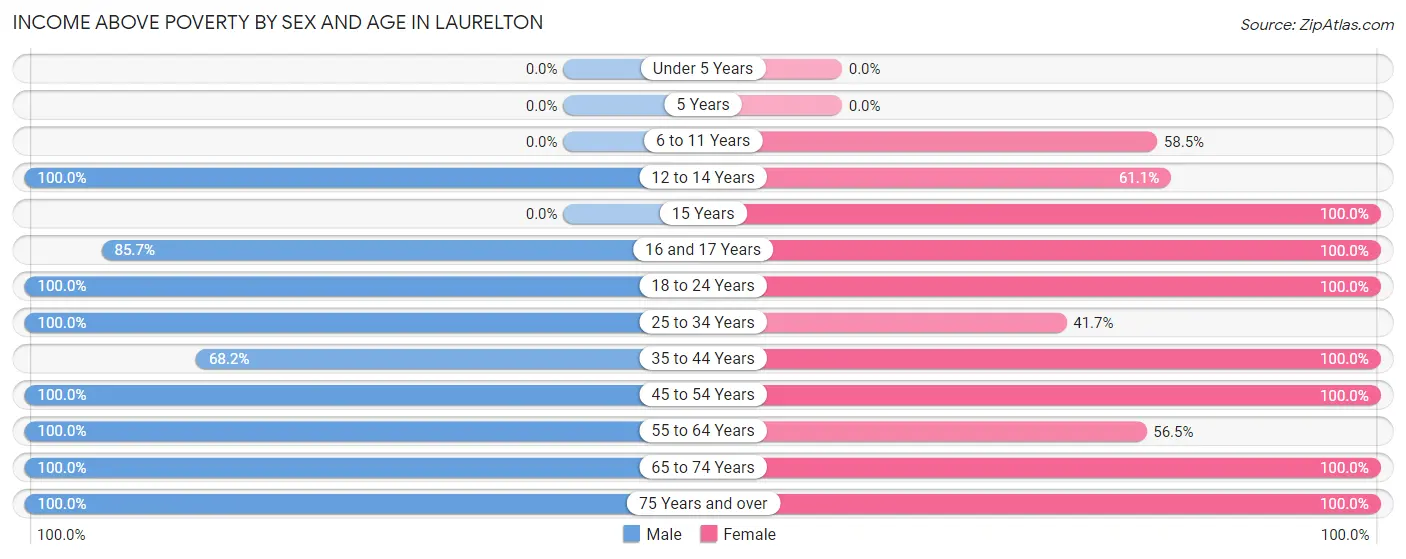
| Age Bracket | Male | Female |
| Under 5 Years | 0 (0.0%) | 0 (0.0%) |
| 5 Years | 0 (0.0%) | 0 (0.0%) |
| 6 to 11 Years | 0 (0.0%) | 31 (58.5%) |
| 12 to 14 Years | 14 (100.0%) | 11 (61.1%) |
| 15 Years | 0 (0.0%) | 20 (100.0%) |
| 16 and 17 Years | 18 (85.7%) | 8 (100.0%) |
| 18 to 24 Years | 7 (100.0%) | 10 (100.0%) |
| 25 to 34 Years | 10 (100.0%) | 5 (41.7%) |
| 35 to 44 Years | 15 (68.2%) | 44 (100.0%) |
| 45 to 54 Years | 16 (100.0%) | 16 (100.0%) |
| 55 to 64 Years | 25 (100.0%) | 13 (56.5%) |
| 65 to 74 Years | 7 (100.0%) | 9 (100.0%) |
| 75 Years and over | 7 (100.0%) | 14 (100.0%) |
| Total | 119 (85.6%) | 181 (79.7%) |
Income Below Poverty Among Married-Couple Families in Laurelton
The poverty statistics for married-couple families in Laurelton show that 9.6% or 7 of the total 73 families live below the poverty line. Families with 5 or more children have the highest poverty rate of 100.0%, comprising of 7 families. On the other hand, families with no children have the lowest poverty rate of 0.0%, which includes 0 families.
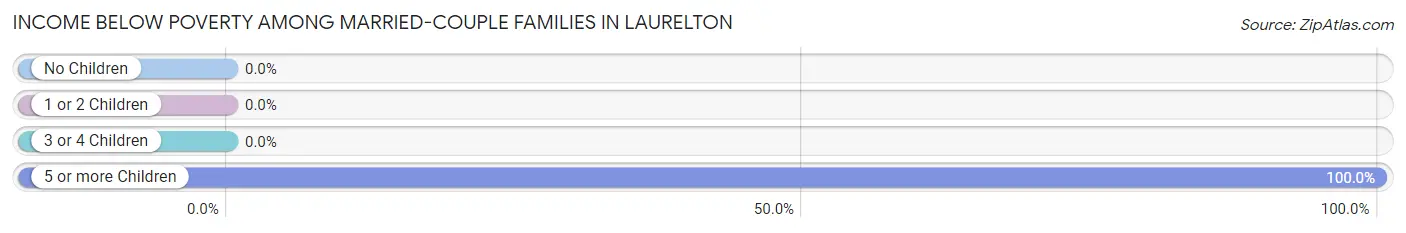
| Children | Above Poverty | Below Poverty |
| No Children | 31 (100.0%) | 0 (0.0%) |
| 1 or 2 Children | 35 (100.0%) | 0 (0.0%) |
| 3 or 4 Children | 0 (0.0%) | 0 (0.0%) |
| 5 or more Children | 0 (0.0%) | 7 (100.0%) |
| Total | 66 (90.4%) | 7 (9.6%) |
Income Below Poverty Among Single-Parent Households in Laurelton
| Children | Single Father | Single Mother |
| No Children | 0 (0.0%) | 0 (0.0%) |
| 1 or 2 Children | 0 (0.0%) | 0 (0.0%) |
| 3 or 4 Children | 0 (0.0%) | 0 (0.0%) |
| 5 or more Children | 0 (0.0%) | 0 (0.0%) |
| Total | 0 (0.0%) | 0 (0.0%) |
Income Below Poverty Among Married-Couple vs Single-Parent Households in Laurelton
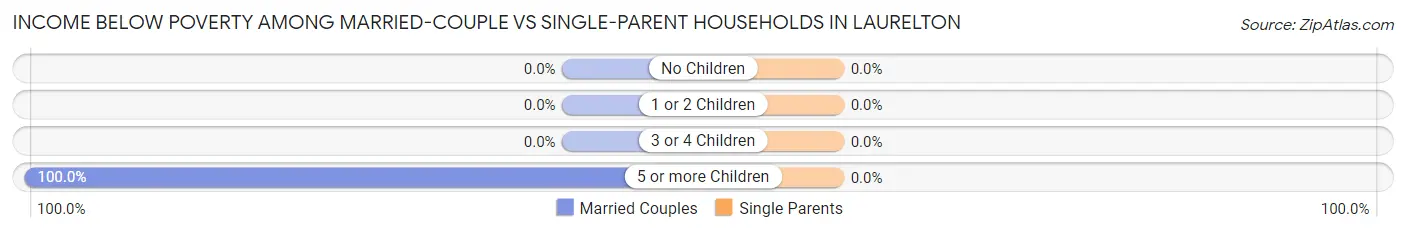
| Children | Married-Couple Families | Single-Parent Households |
| No Children | 0 (0.0%) | 0 (0.0%) |
| 1 or 2 Children | 0 (0.0%) | 0 (0.0%) |
| 3 or 4 Children | 0 (0.0%) | 0 (0.0%) |
| 5 or more Children | 7 (100.0%) | 0 (0.0%) |
| Total | 7 (9.6%) | 0 (0.0%) |
Race in Laurelton
The most populous races in Laurelton are White / Caucasian (344 | 94.0%), Two or more Races (20 | 5.5%), and Asian (2 | 0.5%).
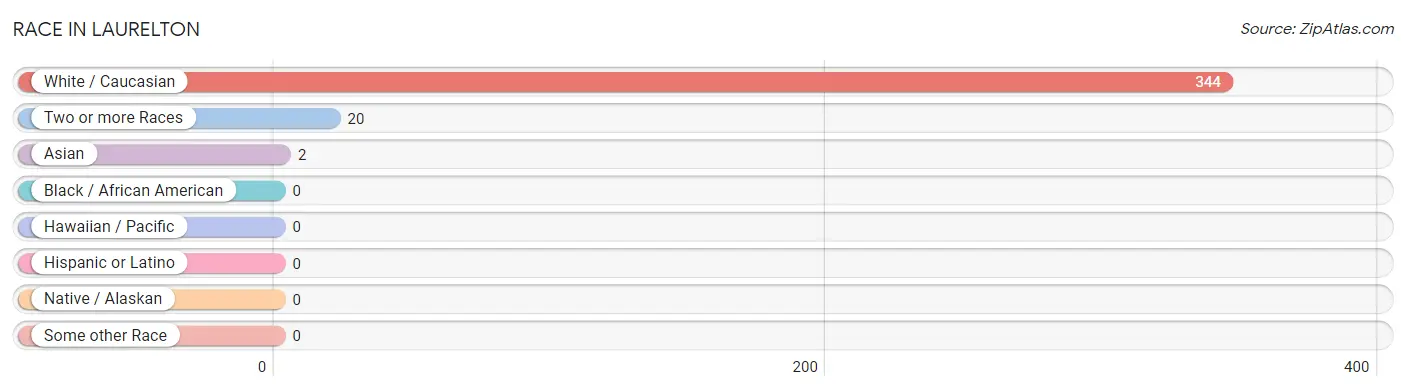
| Race | # Population | % Population |
| Asian | 2 | 0.5% |
| Black / African American | 0 | 0.0% |
| Hawaiian / Pacific | 0 | 0.0% |
| Hispanic or Latino | 0 | 0.0% |
| Native / Alaskan | 0 | 0.0% |
| White / Caucasian | 344 | 94.0% |
| Two or more Races | 20 | 5.5% |
| Some other Race | 0 | 0.0% |
| Total | 366 | 100.0% |
Ancestry in Laurelton
The most populous ancestries reported in Laurelton are German (139 | 38.0%), American (18 | 4.9%), English (18 | 4.9%), Dutch (3 | 0.8%), and French (3 | 0.8%), together accounting for 49.5% of all Laurelton residents.
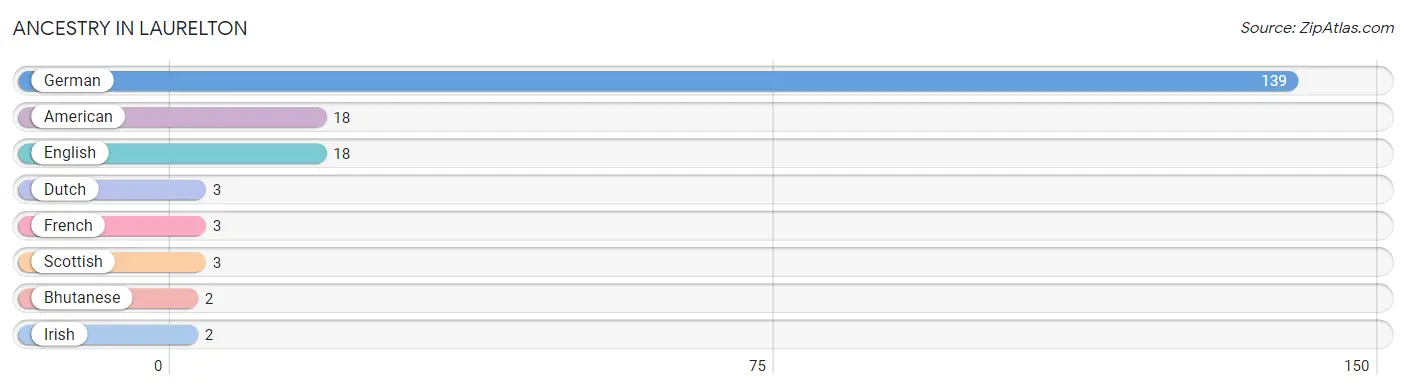
| Ancestry | # Population | % Population |
| American | 18 | 4.9% |
| Bhutanese | 2 | 0.5% |
| Dutch | 3 | 0.8% |
| English | 18 | 4.9% |
| French | 3 | 0.8% |
| German | 139 | 38.0% |
| Irish | 2 | 0.5% |
| Scottish | 3 | 0.8% | View All 8 Rows |
Immigrants in Laurelton
The most numerous immigrant groups reported in Laurelton came from Asia (2 | 0.5%), Eastern Asia (2 | 0.5%), and Japan (2 | 0.5%), together accounting for 1.7% of all Laurelton residents.
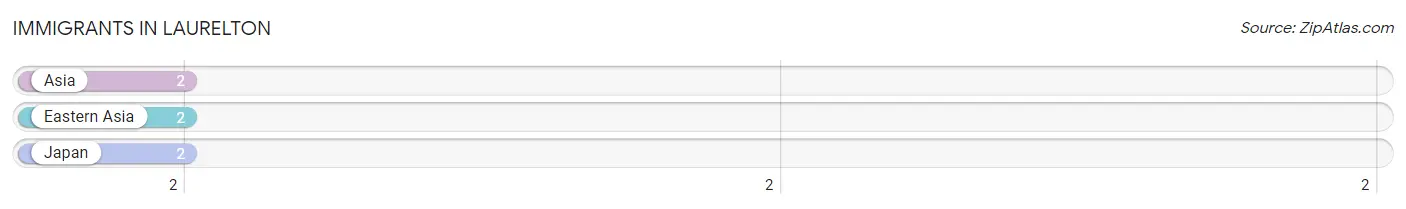
| Immigration Origin | # Population | % Population |
| Asia | 2 | 0.5% |
| Eastern Asia | 2 | 0.5% |
| Japan | 2 | 0.5% | View All 3 Rows |
Sex and Age in Laurelton
Sex and Age in Laurelton
The most populous age groups in Laurelton are 15 to 19 Years (24 | 17.3%) for men and 10 to 14 Years (52 | 22.9%) for women.
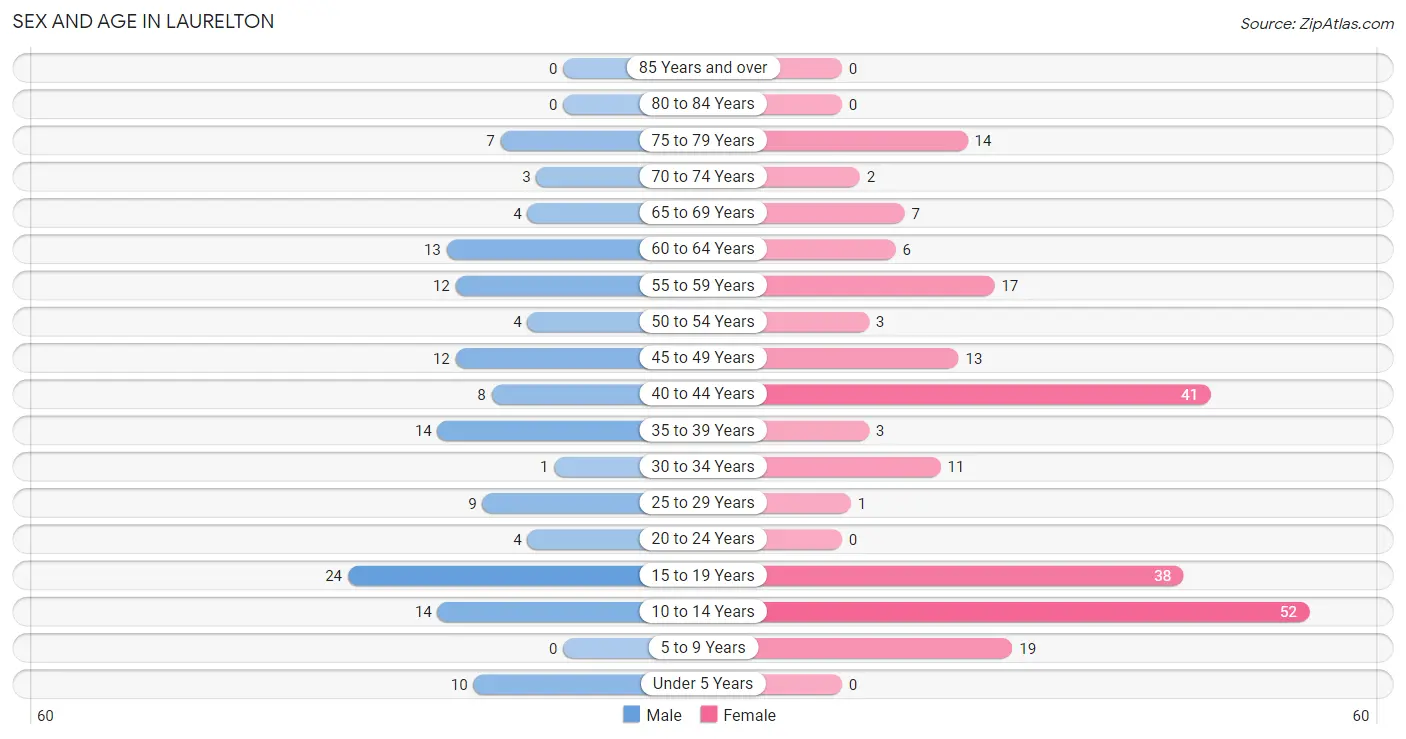
| Age Bracket | Male | Female |
| Under 5 Years | 10 (7.2%) | 0 (0.0%) |
| 5 to 9 Years | 0 (0.0%) | 19 (8.4%) |
| 10 to 14 Years | 14 (10.1%) | 52 (22.9%) |
| 15 to 19 Years | 24 (17.3%) | 38 (16.7%) |
| 20 to 24 Years | 4 (2.9%) | 0 (0.0%) |
| 25 to 29 Years | 9 (6.5%) | 1 (0.4%) |
| 30 to 34 Years | 1 (0.7%) | 11 (4.9%) |
| 35 to 39 Years | 14 (10.1%) | 3 (1.3%) |
| 40 to 44 Years | 8 (5.8%) | 41 (18.1%) |
| 45 to 49 Years | 12 (8.6%) | 13 (5.7%) |
| 50 to 54 Years | 4 (2.9%) | 3 (1.3%) |
| 55 to 59 Years | 12 (8.6%) | 17 (7.5%) |
| 60 to 64 Years | 13 (9.3%) | 6 (2.6%) |
| 65 to 69 Years | 4 (2.9%) | 7 (3.1%) |
| 70 to 74 Years | 3 (2.2%) | 2 (0.9%) |
| 75 to 79 Years | 7 (5.0%) | 14 (6.2%) |
| 80 to 84 Years | 0 (0.0%) | 0 (0.0%) |
| 85 Years and over | 0 (0.0%) | 0 (0.0%) |
| Total | 139 (100.0%) | 227 (100.0%) |
Families and Households in Laurelton
Median Family Size in Laurelton
The median family size in Laurelton is 3.55 persons per family, with married-couple families (73 | 76.0%) accounting for the largest median family size of 3.77 persons per family. On the other hand, single female/mother families (20 | 20.8%) represent the smallest median family size with 2.80 persons per family.
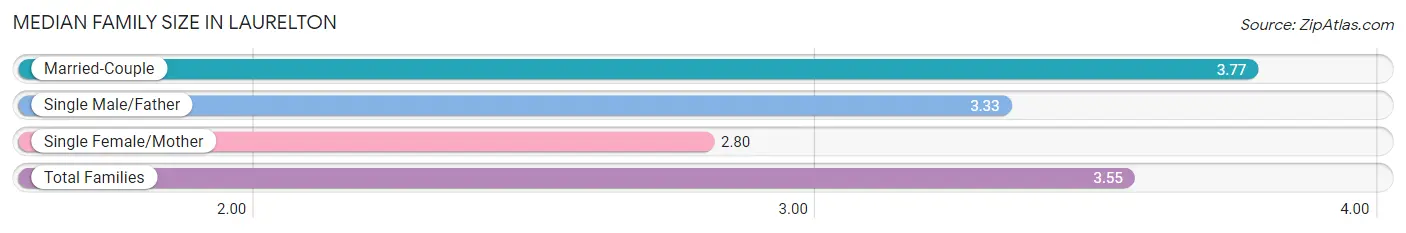
| Family Type | # Families | Family Size |
| Married-Couple | 73 (76.0%) | 3.77 |
| Single Male/Father | 3 (3.1%) | 3.33 |
| Single Female/Mother | 20 (20.8%) | 2.80 |
| Total Families | 96 (100.0%) | 3.55 |
Median Household Size in Laurelton
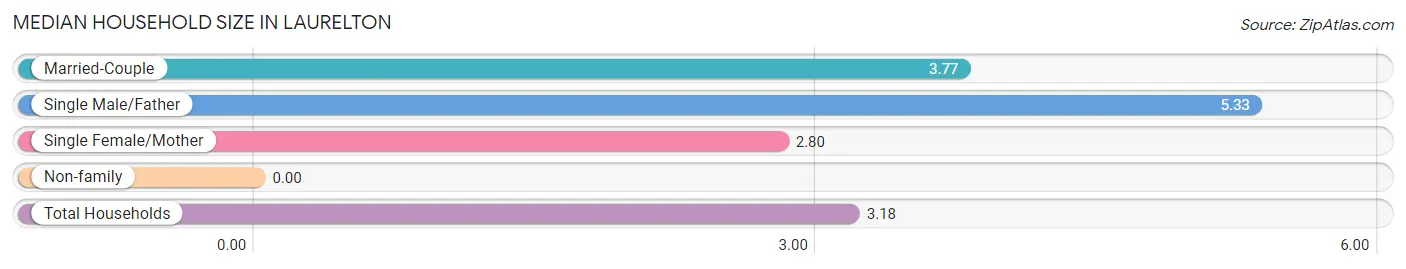
| Household Type | # Households | Household Size |
| Married-Couple | 73 (63.5%) | 3.77 |
| Single Male/Father | 3 (2.6%) | 5.33 |
| Single Female/Mother | 20 (17.4%) | 2.80 |
| Non-family | 19 (16.5%) | - |
| Total Households | 115 (100.0%) | 3.18 |
Household Size by Marriage Status in Laurelton
Out of a total of 115 households in Laurelton, 96 (83.5%) are family households, while 19 (16.5%) are nonfamily households. The most numerous type of family households are 3-person households, comprising 29, and the most common type of nonfamily households are 1-person households, comprising 19.
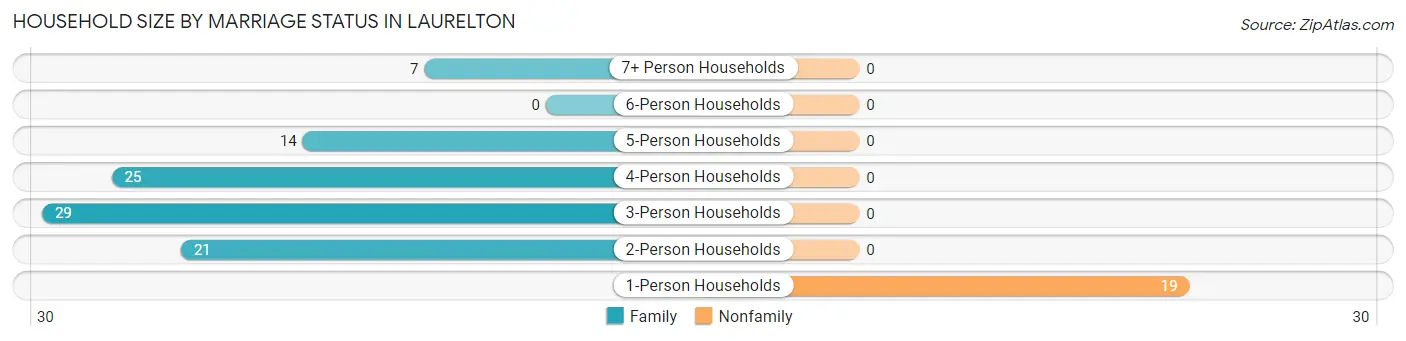
| Household Size | Family Households | Nonfamily Households |
| 1-Person Households | - | 19 (16.5%) |
| 2-Person Households | 21 (18.3%) | 0 (0.0%) |
| 3-Person Households | 29 (25.2%) | 0 (0.0%) |
| 4-Person Households | 25 (21.7%) | 0 (0.0%) |
| 5-Person Households | 14 (12.2%) | 0 (0.0%) |
| 6-Person Households | 0 (0.0%) | 0 (0.0%) |
| 7+ Person Households | 7 (6.1%) | 0 (0.0%) |
| Total | 96 (83.5%) | 19 (16.5%) |
Female Fertility in Laurelton
Fertility by Age in Laurelton
Average fertility rate in Laurelton is 65.0 births per 1,000 women. Women in the age bracket of 20 to 34 years have the highest fertility rate with 583.0 births per 1,000 women. Women in the age bracket of 20 to 34 years acount for 100.0% of all women with births.
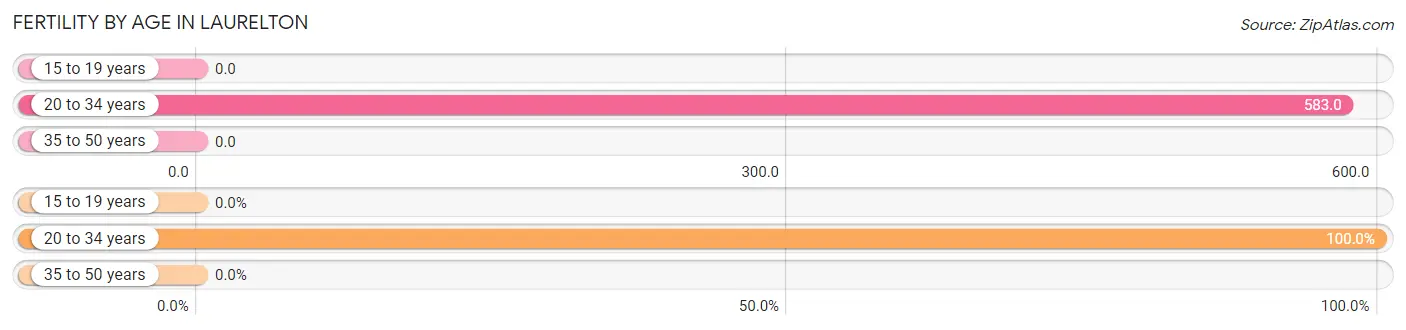
| Age Bracket | Women with Births | Births / 1,000 Women |
| 15 to 19 years | 0 (0.0%) | 0.0 |
| 20 to 34 years | 7 (100.0%) | 583.0 |
| 35 to 50 years | 0 (0.0%) | 0.0 |
| Total | 7 (100.0%) | 65.0 |
Fertility by Age by Marriage Status in Laurelton
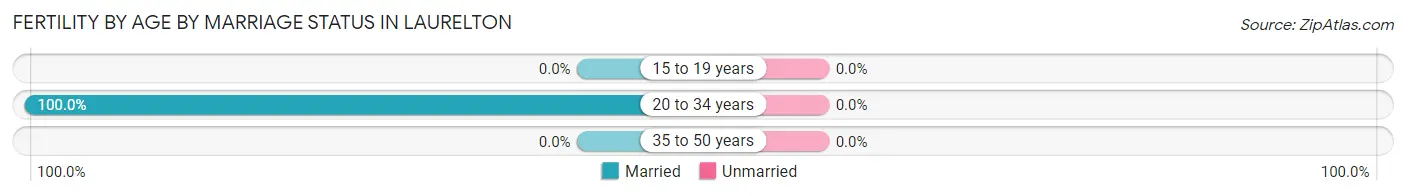
| Age Bracket | Married | Unmarried |
| 15 to 19 years | 0 (0.0%) | 0 (0.0%) |
| 20 to 34 years | 7 (100.0%) | 0 (0.0%) |
| 35 to 50 years | 0 (0.0%) | 0 (0.0%) |
| Total | 7 (100.0%) | 0 (0.0%) |
Fertility by Education in Laurelton
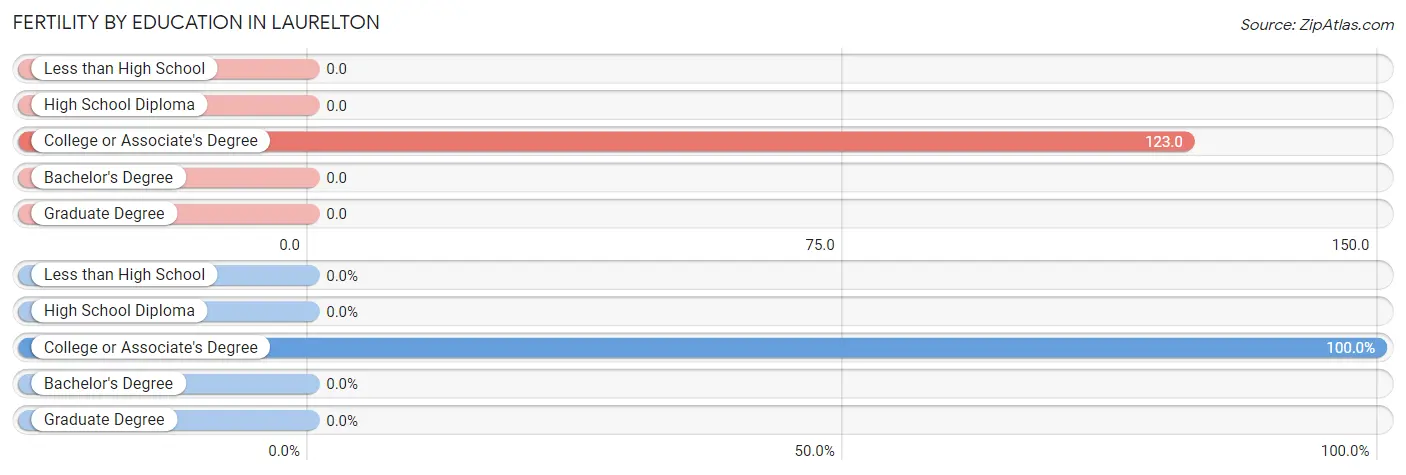
| Educational Attainment | Women with Births | Births / 1,000 Women |
| Less than High School | 0 (0.0%) | 0.0 |
| High School Diploma | 0 (0.0%) | 0.0 |
| College or Associate's Degree | 7 (100.0%) | 123.0 |
| Bachelor's Degree | 0 (0.0%) | 0.0 |
| Graduate Degree | 0 (0.0%) | 0.0 |
| Total | 7 (100.0%) | 65.0 |
Fertility by Education by Marriage Status in Laurelton
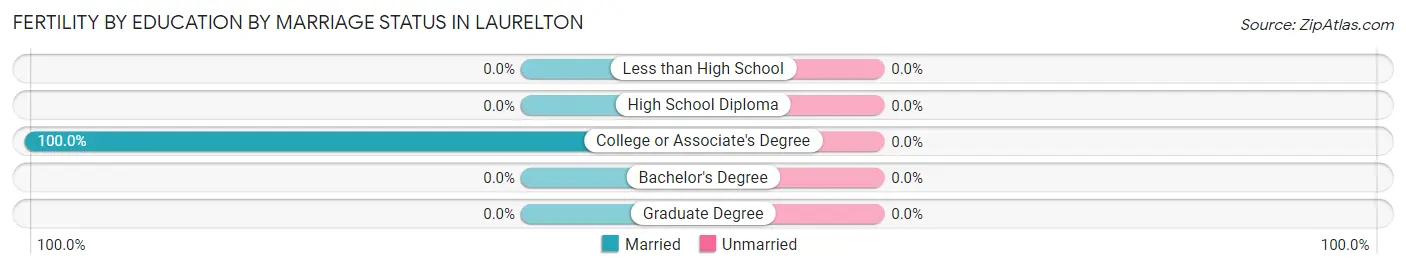
| Educational Attainment | Married | Unmarried |
| Less than High School | 0 (0.0%) | 0 (0.0%) |
| High School Diploma | 0 (0.0%) | 0 (0.0%) |
| College or Associate's Degree | 7 (100.0%) | 0 (0.0%) |
| Bachelor's Degree | 0 (0.0%) | 0 (0.0%) |
| Graduate Degree | 0 (0.0%) | 0 (0.0%) |
| Total | 7 (100.0%) | 0 (0.0%) |
Employment Characteristics in Laurelton
Employment by Class of Employer in Laurelton
Among the 191 employed individuals in Laurelton, private company employees (127 | 66.5%), not-for-profit organizations (48 | 25.1%), and self-employed (not incorporated) (14 | 7.3%) make up the most common classes of employment.
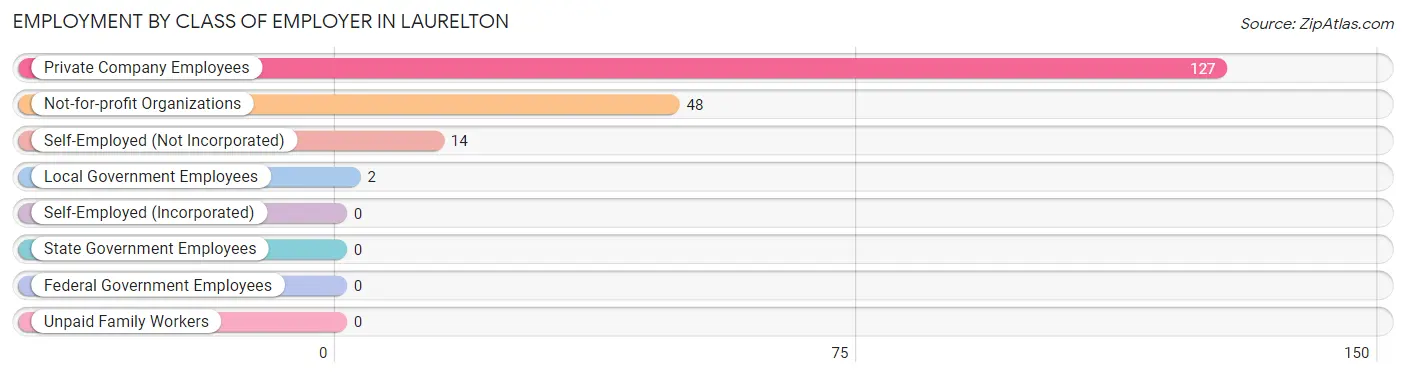
| Employer Class | # Employees | % Employees |
| Private Company Employees | 127 | 66.5% |
| Self-Employed (Incorporated) | 0 | 0.0% |
| Self-Employed (Not Incorporated) | 14 | 7.3% |
| Not-for-profit Organizations | 48 | 25.1% |
| Local Government Employees | 2 | 1.1% |
| State Government Employees | 0 | 0.0% |
| Federal Government Employees | 0 | 0.0% |
| Unpaid Family Workers | 0 | 0.0% |
| Total | 191 | 100.0% |
Employment Status by Age in Laurelton
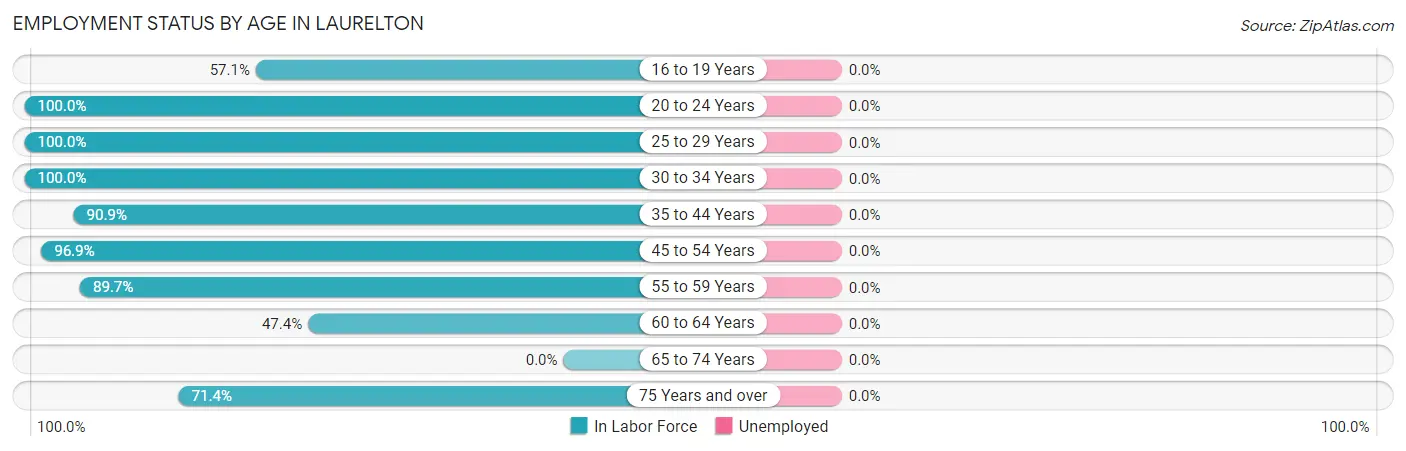
| Age Bracket | In Labor Force | Unemployed |
| 16 to 19 Years | 24 (57.1%) | 0 (0.0%) |
| 20 to 24 Years | 4 (100.0%) | 0 (0.0%) |
| 25 to 29 Years | 10 (100.0%) | 0 (0.0%) |
| 30 to 34 Years | 12 (100.0%) | 0 (0.0%) |
| 35 to 44 Years | 60 (90.9%) | 0 (0.0%) |
| 45 to 54 Years | 31 (96.9%) | 0 (0.0%) |
| 55 to 59 Years | 26 (89.7%) | 0 (0.0%) |
| 60 to 64 Years | 9 (47.4%) | 0 (0.0%) |
| 65 to 74 Years | 0 (0.0%) | 0 (0.0%) |
| 75 Years and over | 15 (71.4%) | 0 (0.0%) |
| Total | 191 (76.1%) | 0 (0.0%) |
Employment Status by Educational Attainment in Laurelton
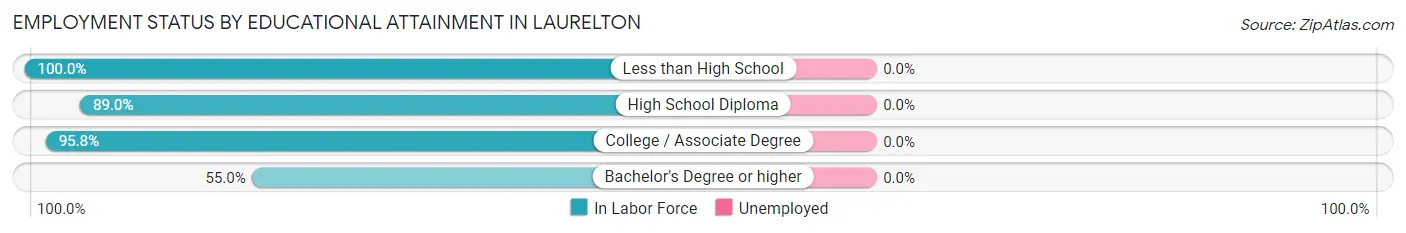
| Educational Attainment | In Labor Force | Unemployed |
| Less than High School | 4 (100.0%) | 0 (0.0%) |
| High School Diploma | 65 (89.0%) | 0 (0.0%) |
| College / Associate Degree | 68 (95.8%) | 0 (0.0%) |
| Bachelor's Degree or higher | 11 (55.0%) | 0 (0.0%) |
| Total | 148 (88.1%) | 0 (0.0%) |
Employment Occupations by Sex in Laurelton
Management, Business, Science and Arts Occupations
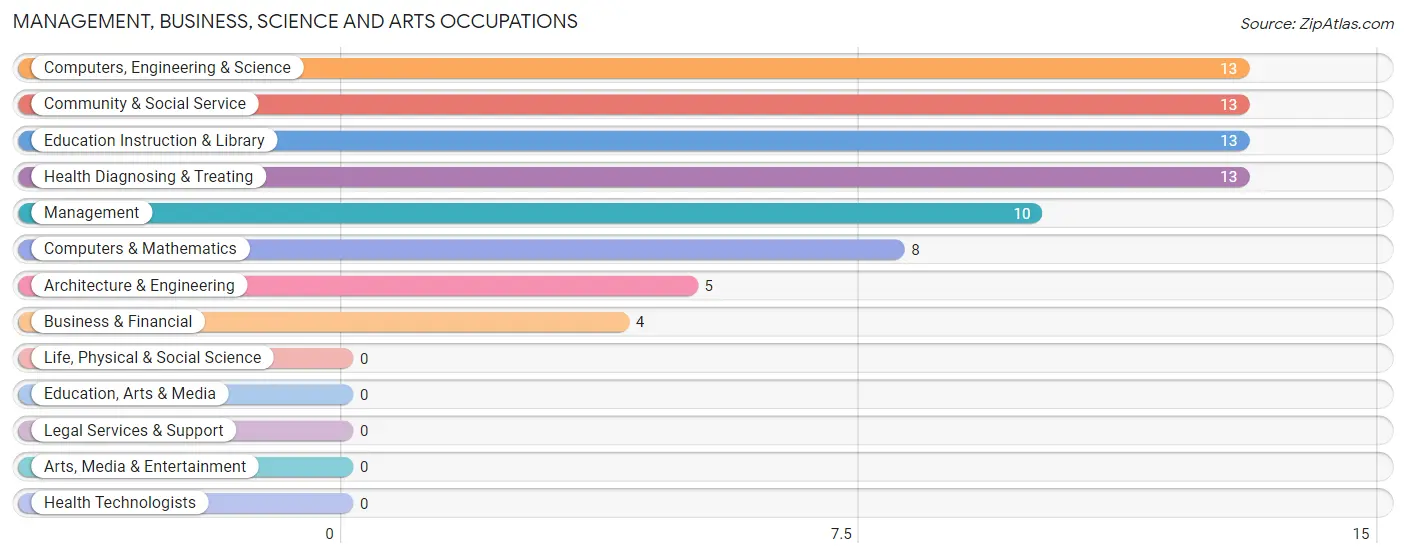
The most common Management, Business, Science and Arts occupations in Laurelton are Computers, Engineering & Science (13 | 6.8%), Community & Social Service (13 | 6.8%), Education Instruction & Library (13 | 6.8%), Health Diagnosing & Treating (13 | 6.8%), and Management (10 | 5.2%).
Management, Business, Science and Arts Occupations by Sex
Within the Management, Business, Science and Arts occupations in Laurelton, the most male-oriented occupations are Management (100.0%), Architecture & Engineering (100.0%), and Computers, Engineering & Science (69.2%), while the most female-oriented occupations are Business & Financial (100.0%), Community & Social Service (100.0%), and Education Instruction & Library (100.0%).
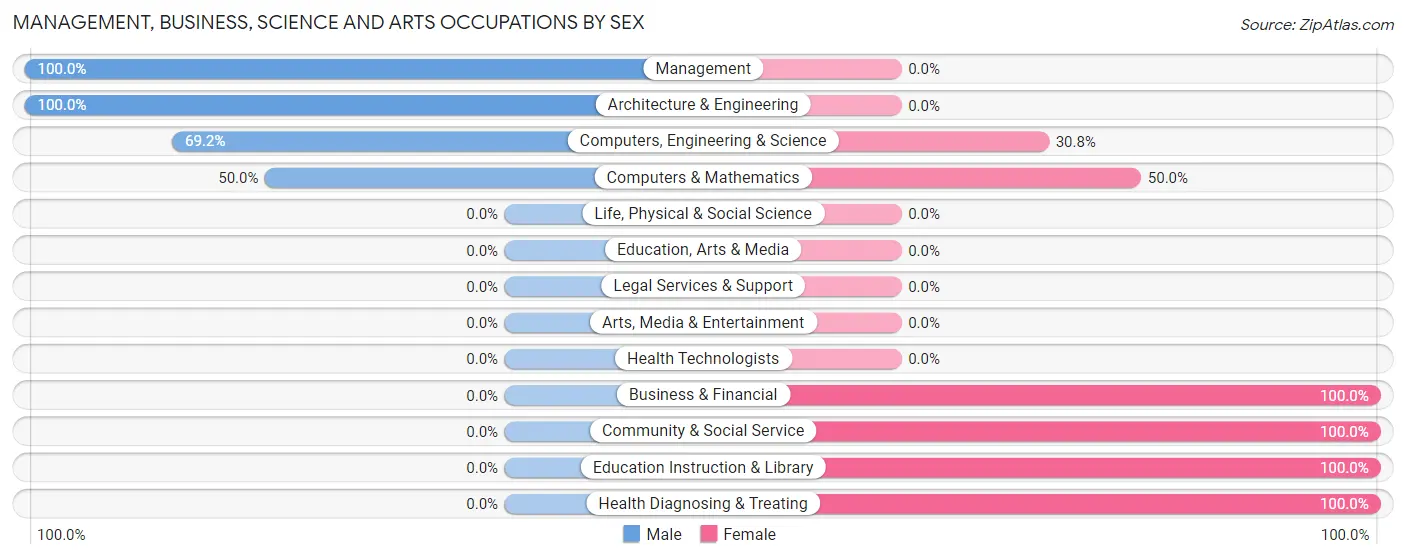
| Occupation | Male | Female |
| Management | 10 (100.0%) | 0 (0.0%) |
| Business & Financial | 0 (0.0%) | 4 (100.0%) |
| Computers, Engineering & Science | 9 (69.2%) | 4 (30.8%) |
| Computers & Mathematics | 4 (50.0%) | 4 (50.0%) |
| Architecture & Engineering | 5 (100.0%) | 0 (0.0%) |
| Life, Physical & Social Science | 0 (0.0%) | 0 (0.0%) |
| Community & Social Service | 0 (0.0%) | 13 (100.0%) |
| Education, Arts & Media | 0 (0.0%) | 0 (0.0%) |
| Legal Services & Support | 0 (0.0%) | 0 (0.0%) |
| Education Instruction & Library | 0 (0.0%) | 13 (100.0%) |
| Arts, Media & Entertainment | 0 (0.0%) | 0 (0.0%) |
| Health Diagnosing & Treating | 0 (0.0%) | 13 (100.0%) |
| Health Technologists | 0 (0.0%) | 0 (0.0%) |
| Total (Category) | 19 (35.8%) | 34 (64.1%) |
| Total (Overall) | 74 (38.7%) | 117 (61.3%) |
Services Occupations
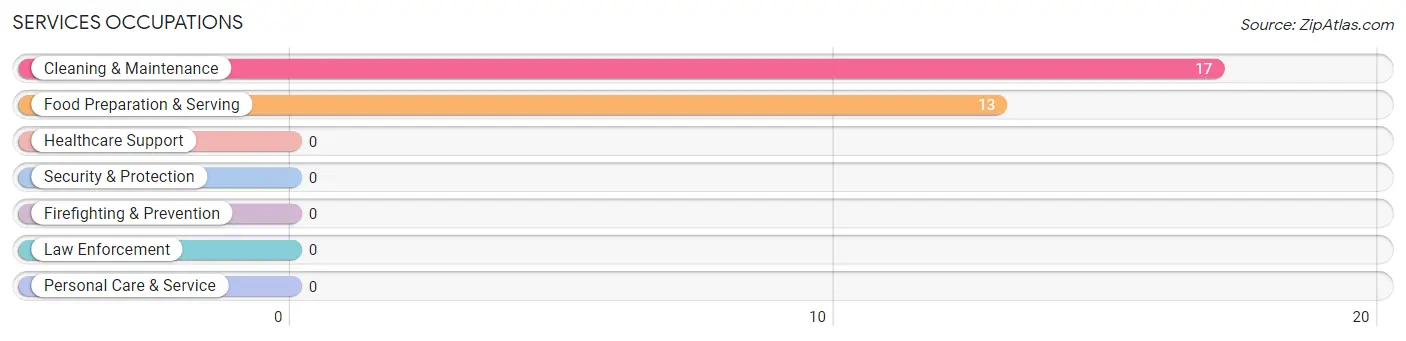
The most common Services occupations in Laurelton are Cleaning & Maintenance (17 | 8.9%), and Food Preparation & Serving (13 | 6.8%).
Services Occupations by Sex
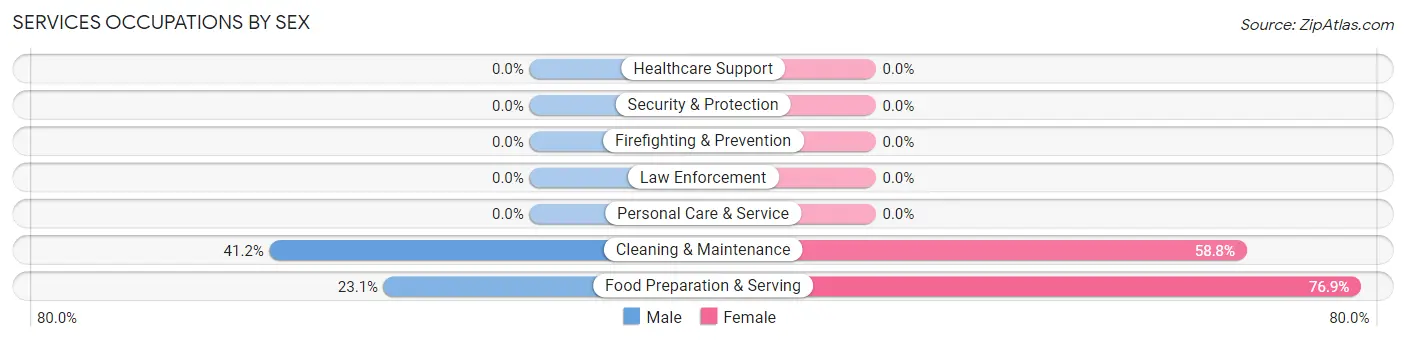
Within the Services occupations in Laurelton, the most male-oriented occupations are Cleaning & Maintenance (41.2%), and Food Preparation & Serving (23.1%), while the most female-oriented occupations are Food Preparation & Serving (76.9%), and Cleaning & Maintenance (58.8%).
| Occupation | Male | Female |
| Healthcare Support | 0 (0.0%) | 0 (0.0%) |
| Security & Protection | 0 (0.0%) | 0 (0.0%) |
| Firefighting & Prevention | 0 (0.0%) | 0 (0.0%) |
| Law Enforcement | 0 (0.0%) | 0 (0.0%) |
| Food Preparation & Serving | 3 (23.1%) | 10 (76.9%) |
| Cleaning & Maintenance | 7 (41.2%) | 10 (58.8%) |
| Personal Care & Service | 0 (0.0%) | 0 (0.0%) |
| Total (Category) | 10 (33.3%) | 20 (66.7%) |
| Total (Overall) | 74 (38.7%) | 117 (61.3%) |
Sales and Office Occupations
The most common Sales and Office occupations in Laurelton are Office & Administration (49 | 25.7%), and Sales & Related (1 | 0.5%).
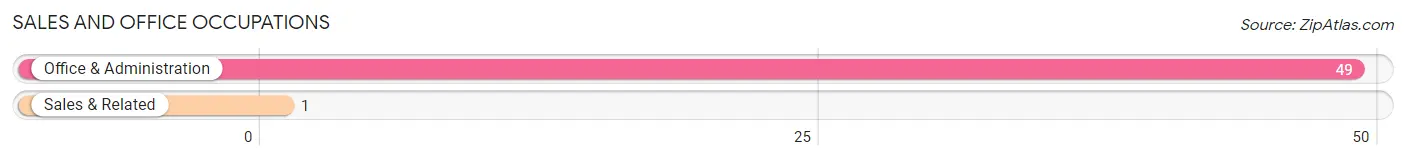
Sales and Office Occupations by Sex
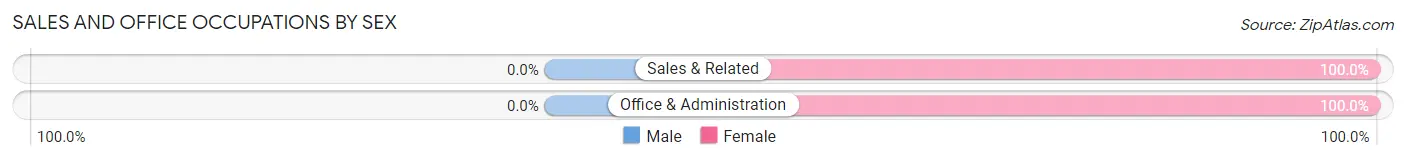
| Occupation | Male | Female |
| Sales & Related | 0 (0.0%) | 1 (100.0%) |
| Office & Administration | 0 (0.0%) | 49 (100.0%) |
| Total (Category) | 0 (0.0%) | 50 (100.0%) |
| Total (Overall) | 74 (38.7%) | 117 (61.3%) |
Natural Resources, Construction and Maintenance Occupations
The most common Natural Resources, Construction and Maintenance occupations in Laurelton are Construction & Extraction (10 | 5.2%), and Installation, Maintenance & Repair (7 | 3.7%).
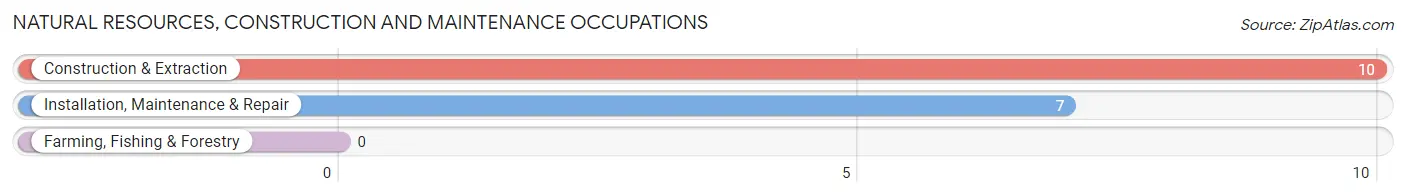
Natural Resources, Construction and Maintenance Occupations by Sex
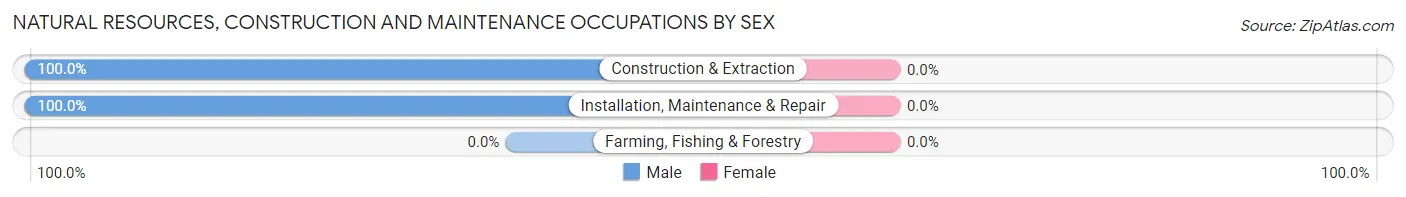
| Occupation | Male | Female |
| Farming, Fishing & Forestry | 0 (0.0%) | 0 (0.0%) |
| Construction & Extraction | 10 (100.0%) | 0 (0.0%) |
| Installation, Maintenance & Repair | 7 (100.0%) | 0 (0.0%) |
| Total (Category) | 17 (100.0%) | 0 (0.0%) |
| Total (Overall) | 74 (38.7%) | 117 (61.3%) |
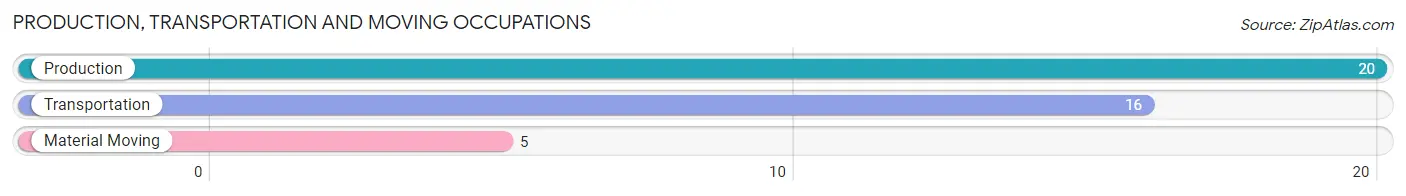
Production, Transportation and Moving Occupations
The most common Production, Transportation and Moving occupations in Laurelton are Production (20 | 10.5%), Transportation (16 | 8.4%), and Material Moving (5 | 2.6%).
Production, Transportation and Moving Occupations by Sex
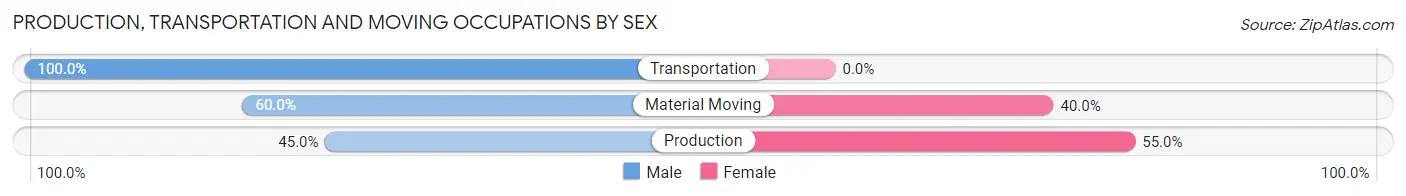
| Occupation | Male | Female |
| Production | 9 (45.0%) | 11 (55.0%) |
| Transportation | 16 (100.0%) | 0 (0.0%) |
| Material Moving | 3 (60.0%) | 2 (40.0%) |
| Total (Category) | 28 (68.3%) | 13 (31.7%) |
| Total (Overall) | 74 (38.7%) | 117 (61.3%) |
Employment Industries by Sex in Laurelton
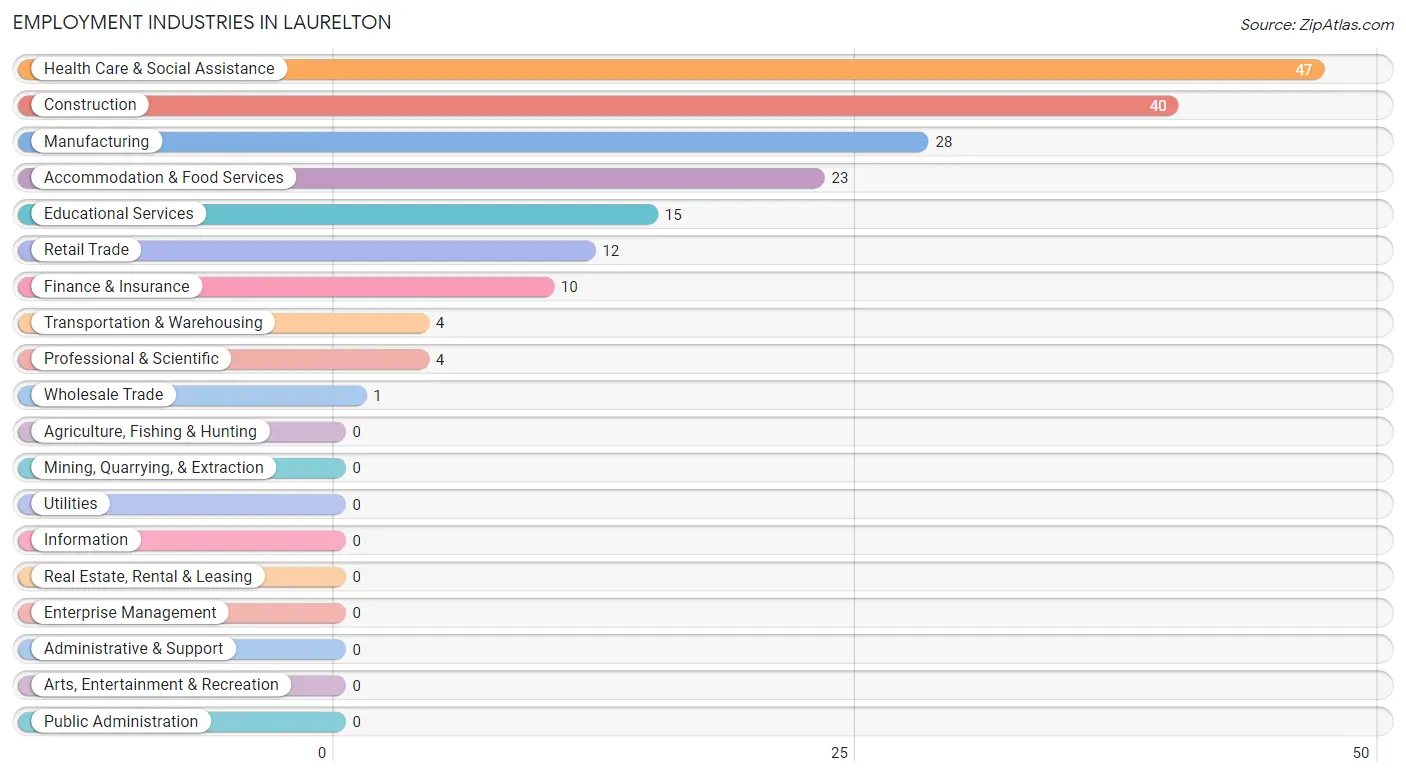
Employment Industries in Laurelton
The major employment industries in Laurelton include Health Care & Social Assistance (47 | 24.6%), Construction (40 | 20.9%), Manufacturing (28 | 14.7%), Accommodation & Food Services (23 | 12.0%), and Educational Services (15 | 7.9%).
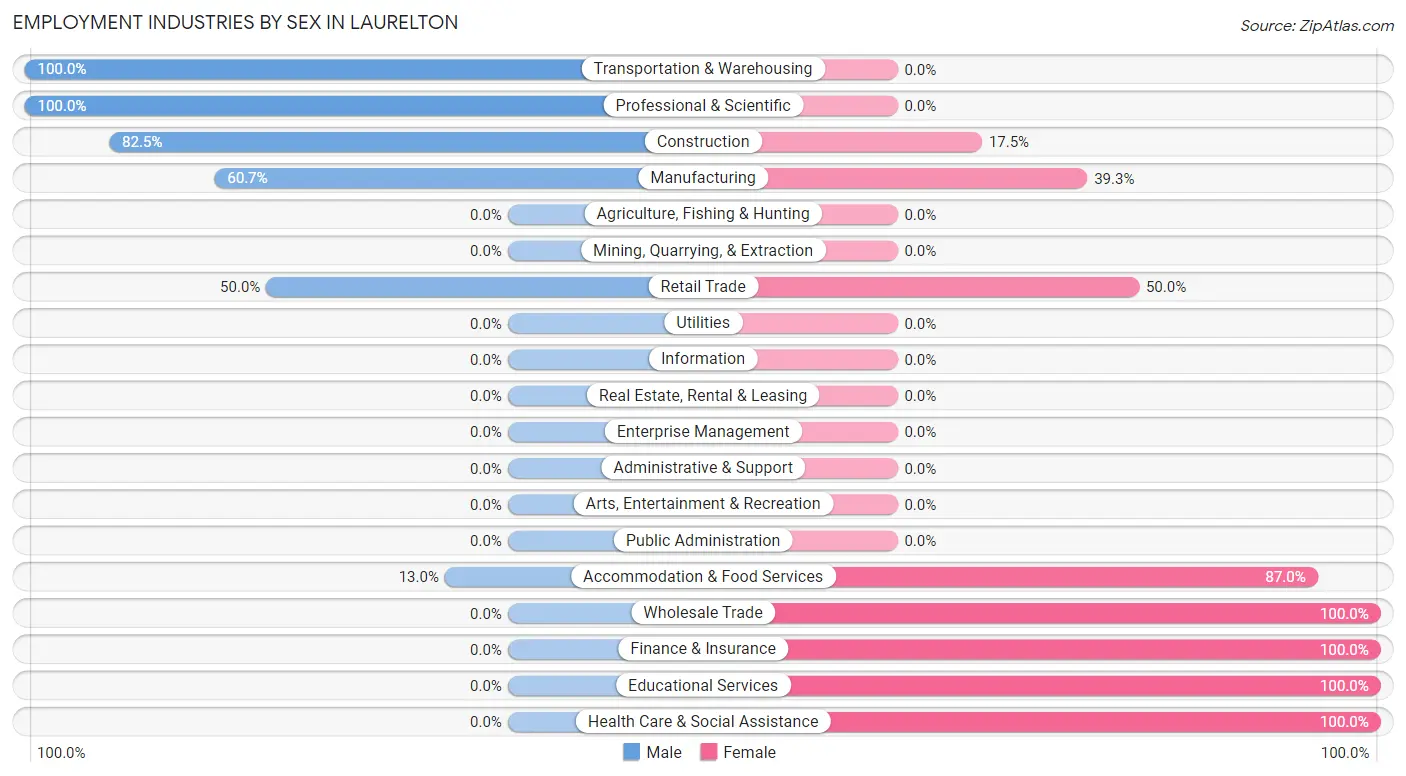
Employment Industries by Sex in Laurelton
The Laurelton industries that see more men than women are Transportation & Warehousing (100.0%), Professional & Scientific (100.0%), and Construction (82.5%), whereas the industries that tend to have a higher number of women are Wholesale Trade (100.0%), Finance & Insurance (100.0%), and Educational Services (100.0%).
| Industry | Male | Female |
| Agriculture, Fishing & Hunting | 0 (0.0%) | 0 (0.0%) |
| Mining, Quarrying, & Extraction | 0 (0.0%) | 0 (0.0%) |
| Construction | 33 (82.5%) | 7 (17.5%) |
| Manufacturing | 17 (60.7%) | 11 (39.3%) |
| Wholesale Trade | 0 (0.0%) | 1 (100.0%) |
| Retail Trade | 6 (50.0%) | 6 (50.0%) |
| Transportation & Warehousing | 4 (100.0%) | 0 (0.0%) |
| Utilities | 0 (0.0%) | 0 (0.0%) |
| Information | 0 (0.0%) | 0 (0.0%) |
| Finance & Insurance | 0 (0.0%) | 10 (100.0%) |
| Real Estate, Rental & Leasing | 0 (0.0%) | 0 (0.0%) |
| Professional & Scientific | 4 (100.0%) | 0 (0.0%) |
| Enterprise Management | 0 (0.0%) | 0 (0.0%) |
| Administrative & Support | 0 (0.0%) | 0 (0.0%) |
| Educational Services | 0 (0.0%) | 15 (100.0%) |
| Health Care & Social Assistance | 0 (0.0%) | 47 (100.0%) |
| Arts, Entertainment & Recreation | 0 (0.0%) | 0 (0.0%) |
| Accommodation & Food Services | 3 (13.0%) | 20 (87.0%) |
| Public Administration | 0 (0.0%) | 0 (0.0%) |
| Total | 74 (38.7%) | 117 (61.3%) |
Education in Laurelton
School Enrollment in Laurelton
The most common levels of schooling among the 159 students in Laurelton are middle school (56 | 35.2%), high school (51 | 32.1%), and elementary school (24 | 15.1%).
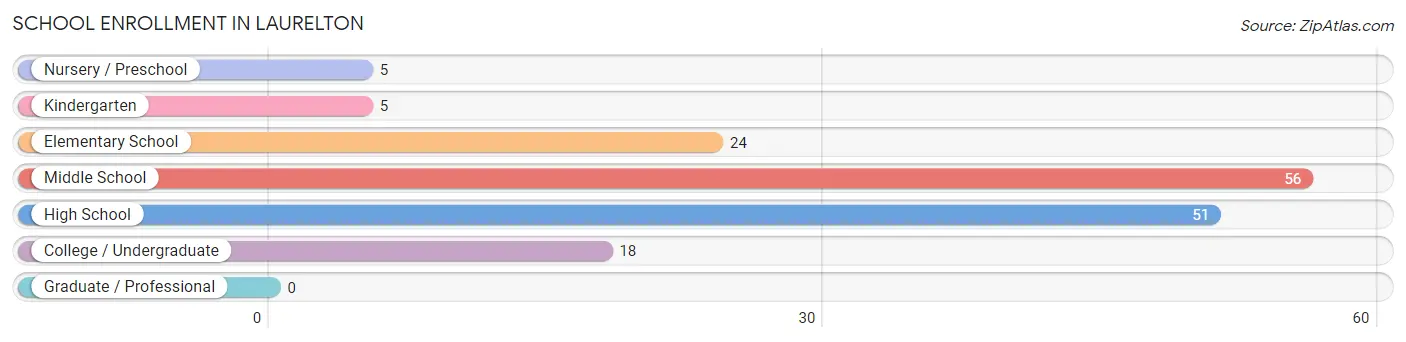
| School Level | # Students | % Students |
| Nursery / Preschool | 5 | 3.1% |
| Kindergarten | 5 | 3.1% |
| Elementary School | 24 | 15.1% |
| Middle School | 56 | 35.2% |
| High School | 51 | 32.1% |
| College / Undergraduate | 18 | 11.3% |
| Graduate / Professional | 0 | 0.0% |
| Total | 159 | 100.0% |
School Enrollment by Age by Funding Source in Laurelton
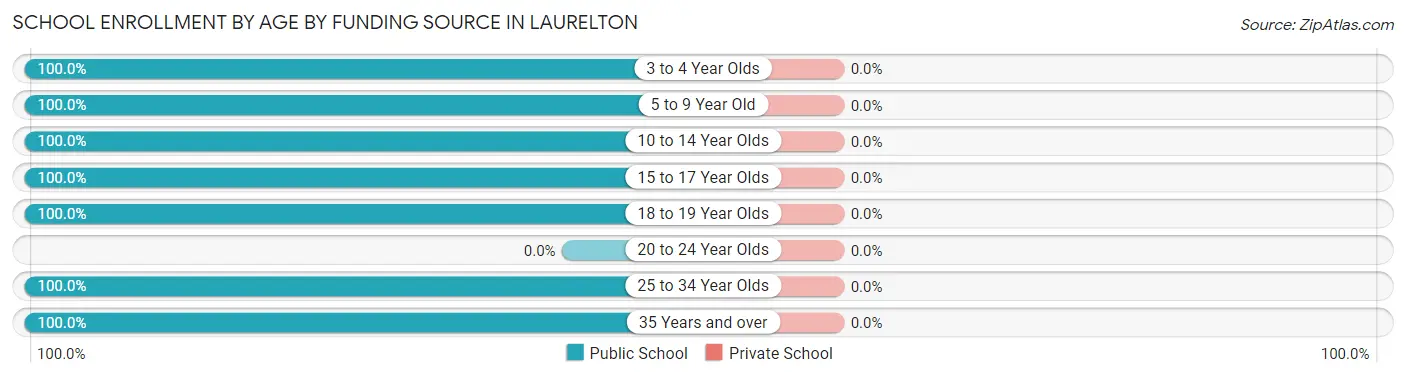
| Age Bracket | Public School | Private School |
| 3 to 4 Year Olds | 5 (100.0%) | 0 (0.0%) |
| 5 to 9 Year Old | 19 (100.0%) | 0 (0.0%) |
| 10 to 14 Year Olds | 66 (100.0%) | 0 (0.0%) |
| 15 to 17 Year Olds | 41 (100.0%) | 0 (0.0%) |
| 18 to 19 Year Olds | 10 (100.0%) | 0 (0.0%) |
| 20 to 24 Year Olds | 0 (0.0%) | 0 (0.0%) |
| 25 to 34 Year Olds | 11 (100.0%) | 0 (0.0%) |
| 35 Years and over | 7 (100.0%) | 0 (0.0%) |
| Total | 159 (100.0%) | 0 (0.0%) |
Educational Attainment by Field of Study in Laurelton
Arts & humanities (13 | 50.0%), science & technology (6 | 23.1%), communications (4 | 15.4%), and education (3 | 11.5%) are the most common fields of study among 26 individuals in Laurelton who have obtained a bachelor's degree or higher.
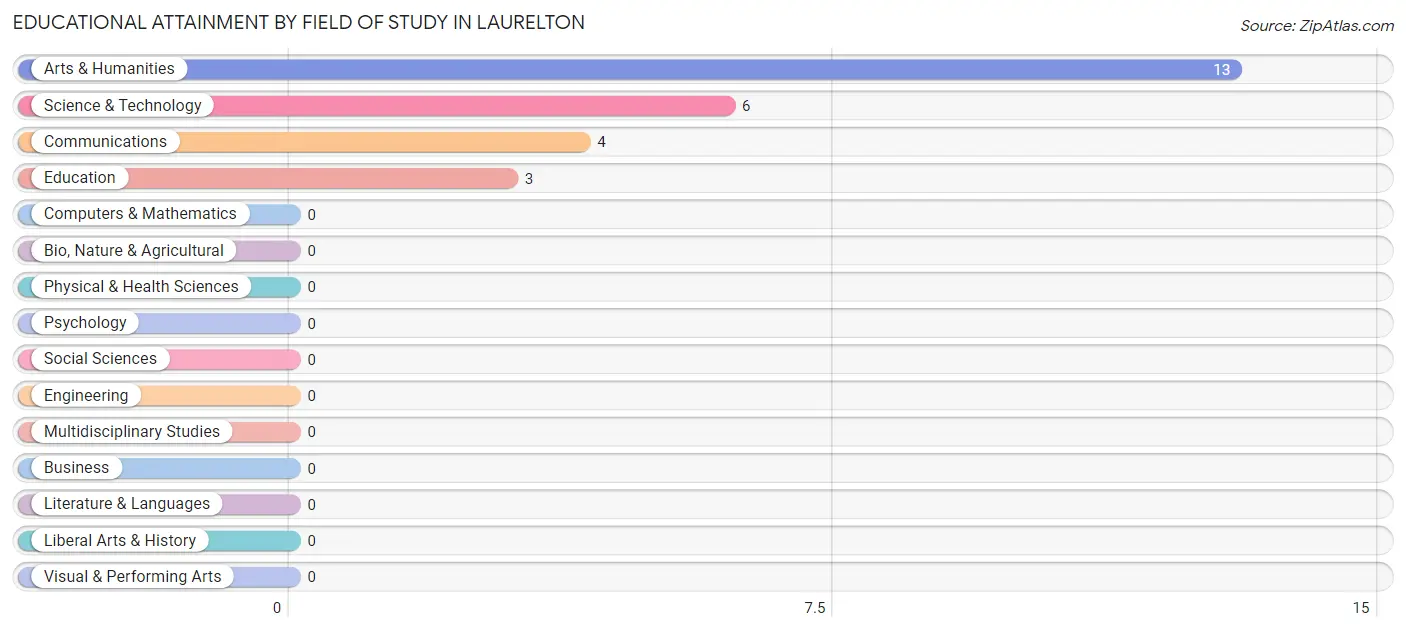
| Field of Study | # Graduates | % Graduates |
| Computers & Mathematics | 0 | 0.0% |
| Bio, Nature & Agricultural | 0 | 0.0% |
| Physical & Health Sciences | 0 | 0.0% |
| Psychology | 0 | 0.0% |
| Social Sciences | 0 | 0.0% |
| Engineering | 0 | 0.0% |
| Multidisciplinary Studies | 0 | 0.0% |
| Science & Technology | 6 | 23.1% |
| Business | 0 | 0.0% |
| Education | 3 | 11.5% |
| Literature & Languages | 0 | 0.0% |
| Liberal Arts & History | 0 | 0.0% |
| Visual & Performing Arts | 0 | 0.0% |
| Communications | 4 | 15.4% |
| Arts & Humanities | 13 | 50.0% |
| Total | 26 | 100.0% |
Transportation & Commute in Laurelton
Vehicle Availability by Sex in Laurelton
The most prevalent vehicle ownership categories in Laurelton are males with 2 vehicles (23, accounting for 31.1%) and females with 2 vehicles (33, making up 19.7%).
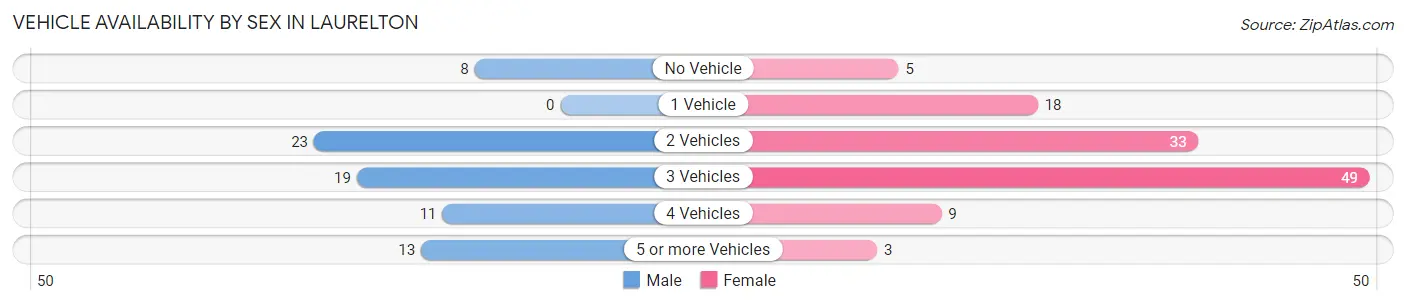
| Vehicles Available | Male | Female |
| No Vehicle | 8 (10.8%) | 5 (4.3%) |
| 1 Vehicle | 0 (0.0%) | 18 (15.4%) |
| 2 Vehicles | 23 (31.1%) | 33 (28.2%) |
| 3 Vehicles | 19 (25.7%) | 49 (41.9%) |
| 4 Vehicles | 11 (14.9%) | 9 (7.7%) |
| 5 or more Vehicles | 13 (17.6%) | 3 (2.6%) |
| Total | 74 (100.0%) | 117 (100.0%) |
Commute Time in Laurelton
The most frequently occuring commute durations in Laurelton are 15 to 19 minutes (34 commuters, 21.9%), 20 to 24 minutes (28 commuters, 18.1%), and 5 to 9 minutes (26 commuters, 16.8%).
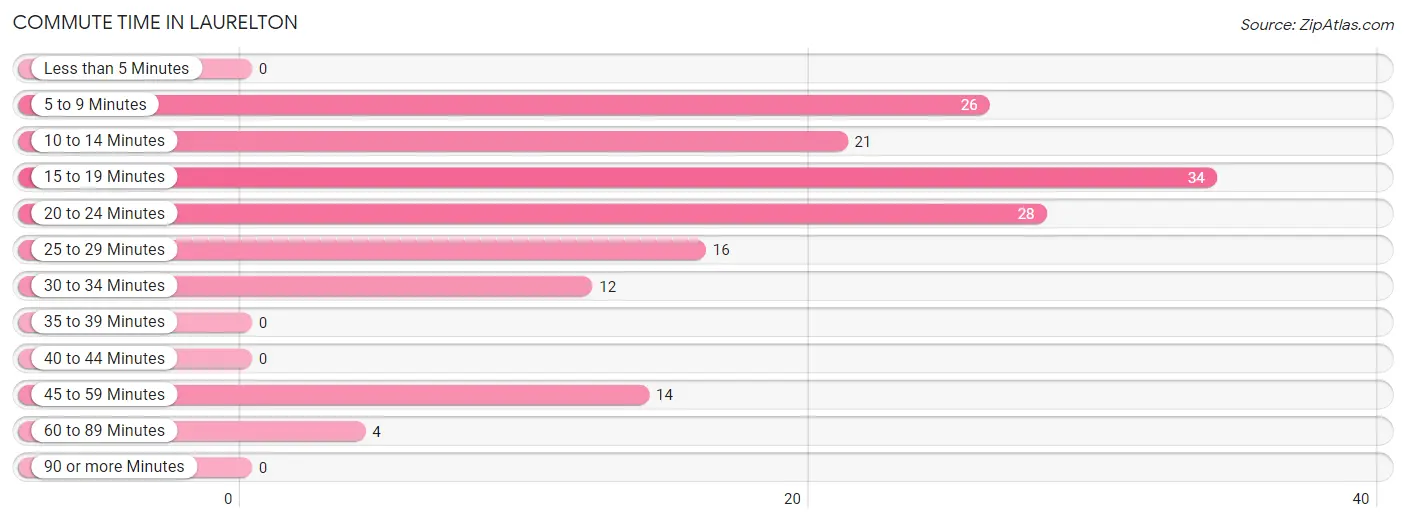
| Commute Time | # Commuters | % Commuters |
| Less than 5 Minutes | 0 | 0.0% |
| 5 to 9 Minutes | 26 | 16.8% |
| 10 to 14 Minutes | 21 | 13.6% |
| 15 to 19 Minutes | 34 | 21.9% |
| 20 to 24 Minutes | 28 | 18.1% |
| 25 to 29 Minutes | 16 | 10.3% |
| 30 to 34 Minutes | 12 | 7.7% |
| 35 to 39 Minutes | 0 | 0.0% |
| 40 to 44 Minutes | 0 | 0.0% |
| 45 to 59 Minutes | 14 | 9.0% |
| 60 to 89 Minutes | 4 | 2.6% |
| 90 or more Minutes | 0 | 0.0% |
Commute Time by Sex in Laurelton
The most common commute times in Laurelton are 5 to 9 minutes (26 commuters, 36.1%) for males and 15 to 19 minutes (26 commuters, 31.3%) for females.
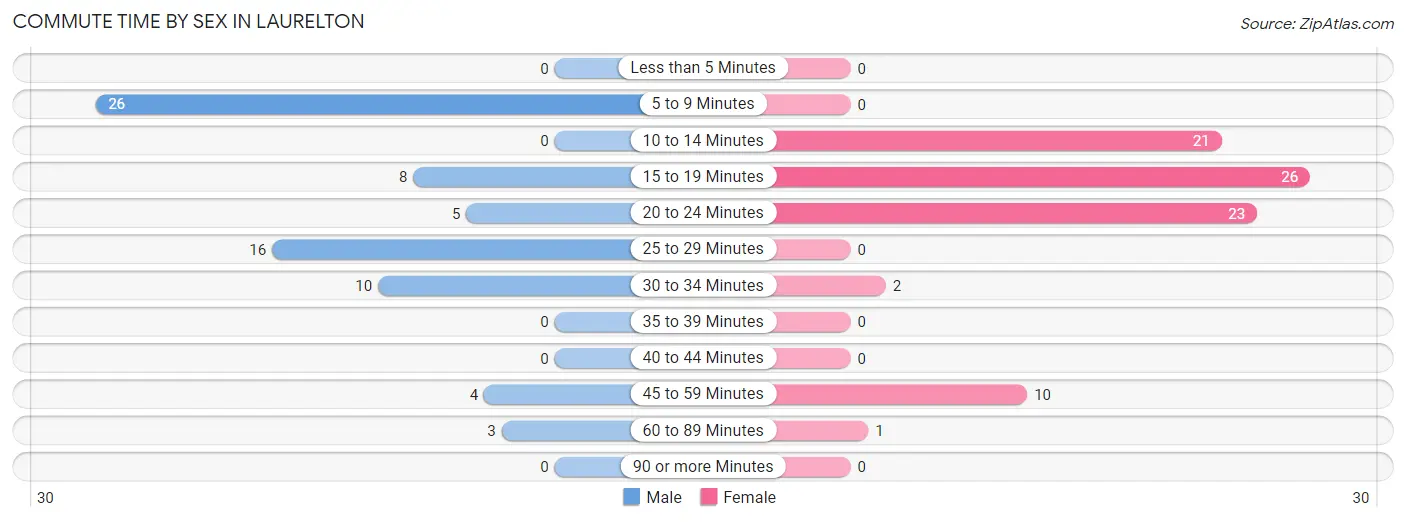
| Commute Time | Male | Female |
| Less than 5 Minutes | 0 (0.0%) | 0 (0.0%) |
| 5 to 9 Minutes | 26 (36.1%) | 0 (0.0%) |
| 10 to 14 Minutes | 0 (0.0%) | 21 (25.3%) |
| 15 to 19 Minutes | 8 (11.1%) | 26 (31.3%) |
| 20 to 24 Minutes | 5 (6.9%) | 23 (27.7%) |
| 25 to 29 Minutes | 16 (22.2%) | 0 (0.0%) |
| 30 to 34 Minutes | 10 (13.9%) | 2 (2.4%) |
| 35 to 39 Minutes | 0 (0.0%) | 0 (0.0%) |
| 40 to 44 Minutes | 0 (0.0%) | 0 (0.0%) |
| 45 to 59 Minutes | 4 (5.6%) | 10 (12.0%) |
| 60 to 89 Minutes | 3 (4.2%) | 1 (1.2%) |
| 90 or more Minutes | 0 (0.0%) | 0 (0.0%) |
Time of Departure to Work by Sex in Laurelton
The most frequent times of departure to work in Laurelton are 12:00 AM to 4:59 AM (26, 36.1%) for males and 7:00 AM to 7:29 AM (44, 53.0%) for females.
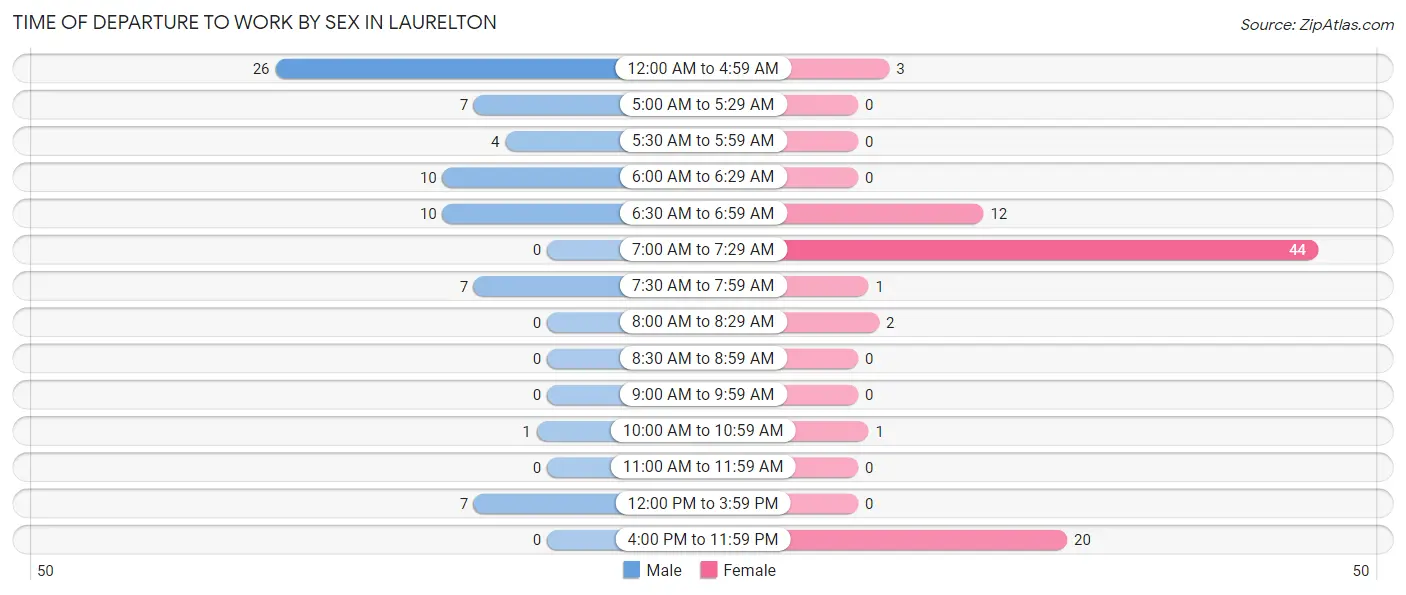
| Time of Departure | Male | Female |
| 12:00 AM to 4:59 AM | 26 (36.1%) | 3 (3.6%) |
| 5:00 AM to 5:29 AM | 7 (9.7%) | 0 (0.0%) |
| 5:30 AM to 5:59 AM | 4 (5.6%) | 0 (0.0%) |
| 6:00 AM to 6:29 AM | 10 (13.9%) | 0 (0.0%) |
| 6:30 AM to 6:59 AM | 10 (13.9%) | 12 (14.5%) |
| 7:00 AM to 7:29 AM | 0 (0.0%) | 44 (53.0%) |
| 7:30 AM to 7:59 AM | 7 (9.7%) | 1 (1.2%) |
| 8:00 AM to 8:29 AM | 0 (0.0%) | 2 (2.4%) |
| 8:30 AM to 8:59 AM | 0 (0.0%) | 0 (0.0%) |
| 9:00 AM to 9:59 AM | 0 (0.0%) | 0 (0.0%) |
| 10:00 AM to 10:59 AM | 1 (1.4%) | 1 (1.2%) |
| 11:00 AM to 11:59 AM | 0 (0.0%) | 0 (0.0%) |
| 12:00 PM to 3:59 PM | 7 (9.7%) | 0 (0.0%) |
| 4:00 PM to 11:59 PM | 0 (0.0%) | 20 (24.1%) |
| Total | 72 (100.0%) | 83 (100.0%) |
Housing Occupancy in Laurelton
Occupancy by Ownership in Laurelton
Of the total 115 dwellings in Laurelton, owner-occupied units account for 86 (74.8%), while renter-occupied units make up 29 (25.2%).
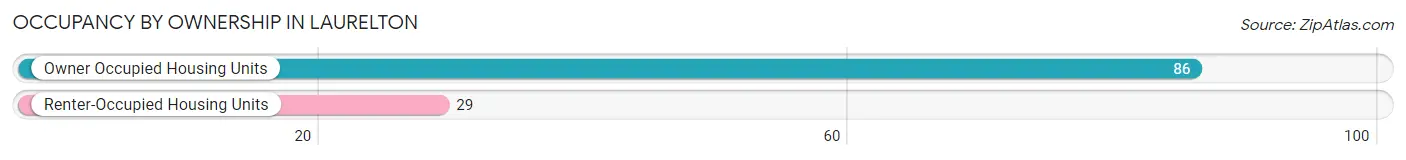
| Occupancy | # Housing Units | % Housing Units |
| Owner Occupied Housing Units | 86 | 74.8% |
| Renter-Occupied Housing Units | 29 | 25.2% |
| Total Occupied Housing Units | 115 | 100.0% |
Occupancy by Household Size in Laurelton
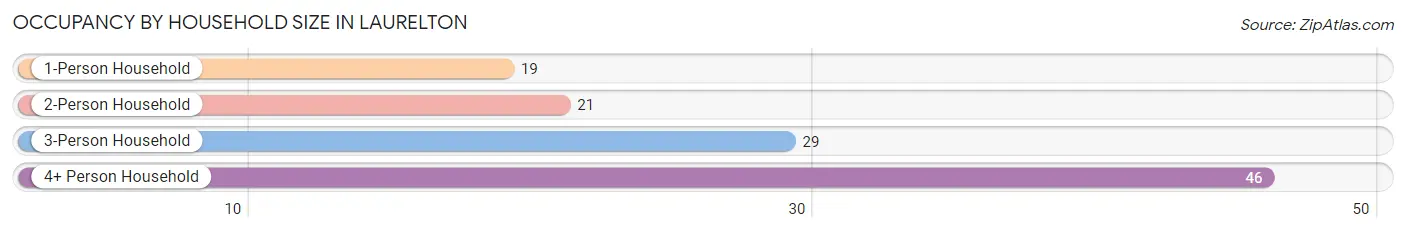
| Household Size | # Housing Units | % Housing Units |
| 1-Person Household | 19 | 16.5% |
| 2-Person Household | 21 | 18.3% |
| 3-Person Household | 29 | 25.2% |
| 4+ Person Household | 46 | 40.0% |
| Total Housing Units | 115 | 100.0% |
Occupancy by Ownership by Household Size in Laurelton
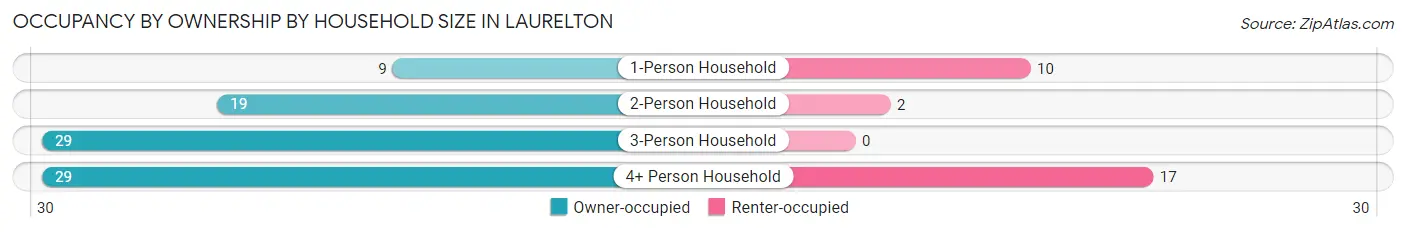
| Household Size | Owner-occupied | Renter-occupied |
| 1-Person Household | 9 (47.4%) | 10 (52.6%) |
| 2-Person Household | 19 (90.5%) | 2 (9.5%) |
| 3-Person Household | 29 (100.0%) | 0 (0.0%) |
| 4+ Person Household | 29 (63.0%) | 17 (37.0%) |
| Total Housing Units | 86 (74.8%) | 29 (25.2%) |
Occupancy by Educational Attainment in Laurelton
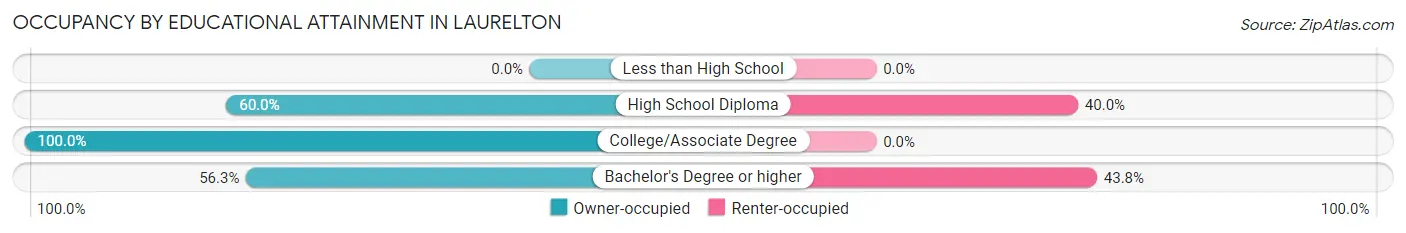
| Household Size | Owner-occupied | Renter-occupied |
| Less than High School | 0 (0.0%) | 0 (0.0%) |
| High School Diploma | 33 (60.0%) | 22 (40.0%) |
| College/Associate Degree | 44 (100.0%) | 0 (0.0%) |
| Bachelor's Degree or higher | 9 (56.2%) | 7 (43.8%) |
Occupancy by Age of Householder in Laurelton
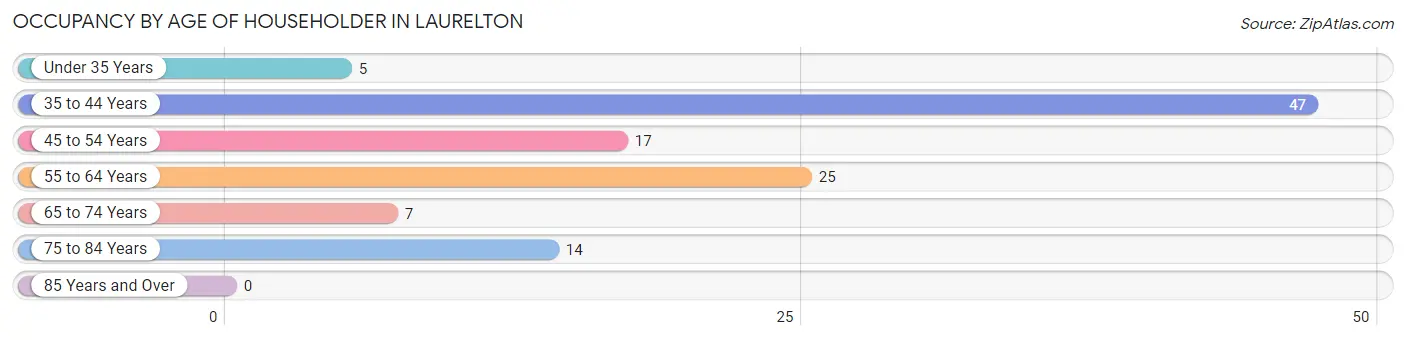
| Age Bracket | # Households | % Households |
| Under 35 Years | 5 | 4.3% |
| 35 to 44 Years | 47 | 40.9% |
| 45 to 54 Years | 17 | 14.8% |
| 55 to 64 Years | 25 | 21.7% |
| 65 to 74 Years | 7 | 6.1% |
| 75 to 84 Years | 14 | 12.2% |
| 85 Years and Over | 0 | 0.0% |
| Total | 115 | 100.0% |
Housing Finances in Laurelton
Median Income by Occupancy in Laurelton
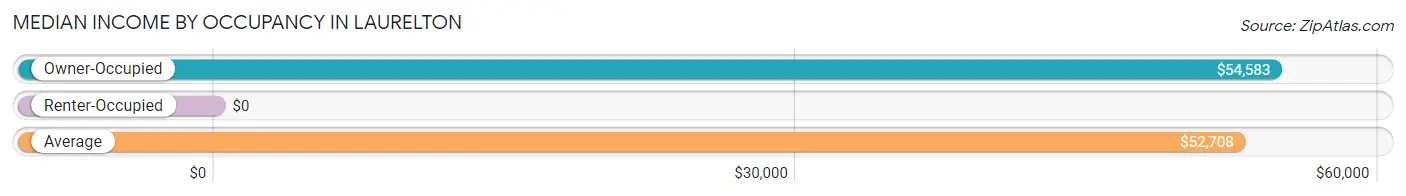
| Occupancy Type | # Households | Median Income |
| Owner-Occupied | 86 (74.8%) | $54,583 |
| Renter-Occupied | 29 (25.2%) | $0 |
| Average | 115 (100.0%) | $52,708 |
Occupancy by Householder Income Bracket in Laurelton
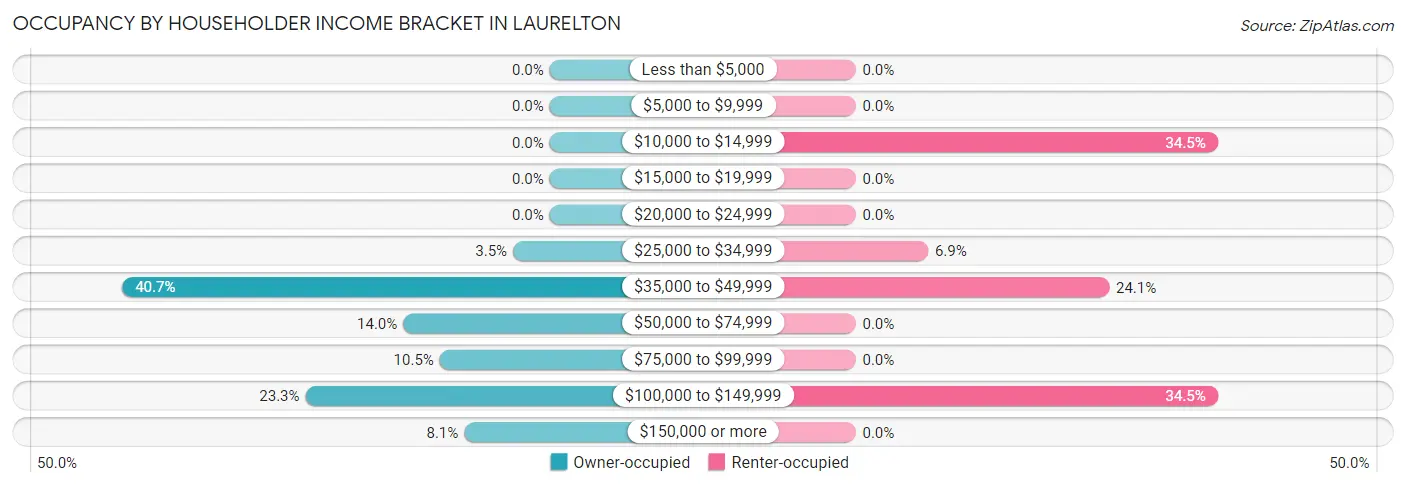
| Income Bracket | Owner-occupied | Renter-occupied |
| Less than $5,000 | 0 (0.0%) | 0 (0.0%) |
| $5,000 to $9,999 | 0 (0.0%) | 0 (0.0%) |
| $10,000 to $14,999 | 0 (0.0%) | 10 (34.5%) |
| $15,000 to $19,999 | 0 (0.0%) | 0 (0.0%) |
| $20,000 to $24,999 | 0 (0.0%) | 0 (0.0%) |
| $25,000 to $34,999 | 3 (3.5%) | 2 (6.9%) |
| $35,000 to $49,999 | 35 (40.7%) | 7 (24.1%) |
| $50,000 to $74,999 | 12 (14.0%) | 0 (0.0%) |
| $75,000 to $99,999 | 9 (10.5%) | 0 (0.0%) |
| $100,000 to $149,999 | 20 (23.3%) | 10 (34.5%) |
| $150,000 or more | 7 (8.1%) | 0 (0.0%) |
| Total | 86 (100.0%) | 29 (100.0%) |
Monthly Housing Cost Tiers in Laurelton
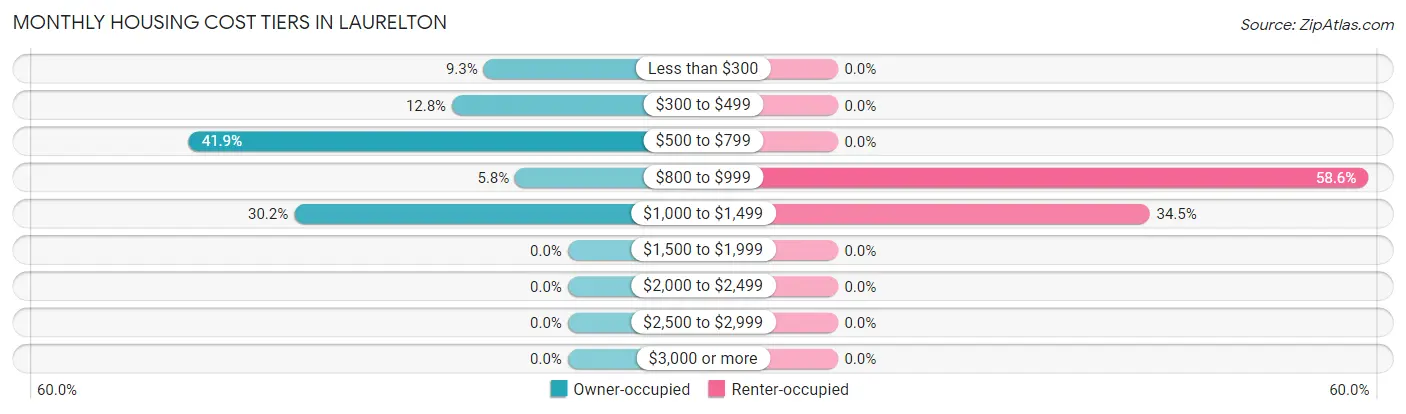
| Monthly Cost | Owner-occupied | Renter-occupied |
| Less than $300 | 8 (9.3%) | 0 (0.0%) |
| $300 to $499 | 11 (12.8%) | 0 (0.0%) |
| $500 to $799 | 36 (41.9%) | 0 (0.0%) |
| $800 to $999 | 5 (5.8%) | 17 (58.6%) |
| $1,000 to $1,499 | 26 (30.2%) | 10 (34.5%) |
| $1,500 to $1,999 | 0 (0.0%) | 0 (0.0%) |
| $2,000 to $2,499 | 0 (0.0%) | 0 (0.0%) |
| $2,500 to $2,999 | 0 (0.0%) | 0 (0.0%) |
| $3,000 or more | 0 (0.0%) | 0 (0.0%) |
| Total | 86 (100.0%) | 29 (100.0%) |
Physical Housing Characteristics in Laurelton
Housing Structures in Laurelton
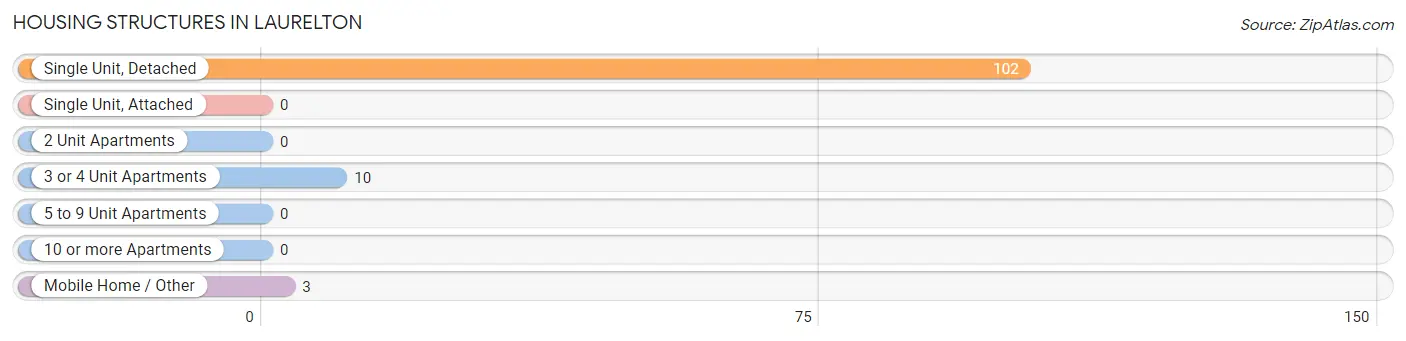
| Structure Type | # Housing Units | % Housing Units |
| Single Unit, Detached | 102 | 88.7% |
| Single Unit, Attached | 0 | 0.0% |
| 2 Unit Apartments | 0 | 0.0% |
| 3 or 4 Unit Apartments | 10 | 8.7% |
| 5 to 9 Unit Apartments | 0 | 0.0% |
| 10 or more Apartments | 0 | 0.0% |
| Mobile Home / Other | 3 | 2.6% |
| Total | 115 | 100.0% |
Housing Structures by Occupancy in Laurelton
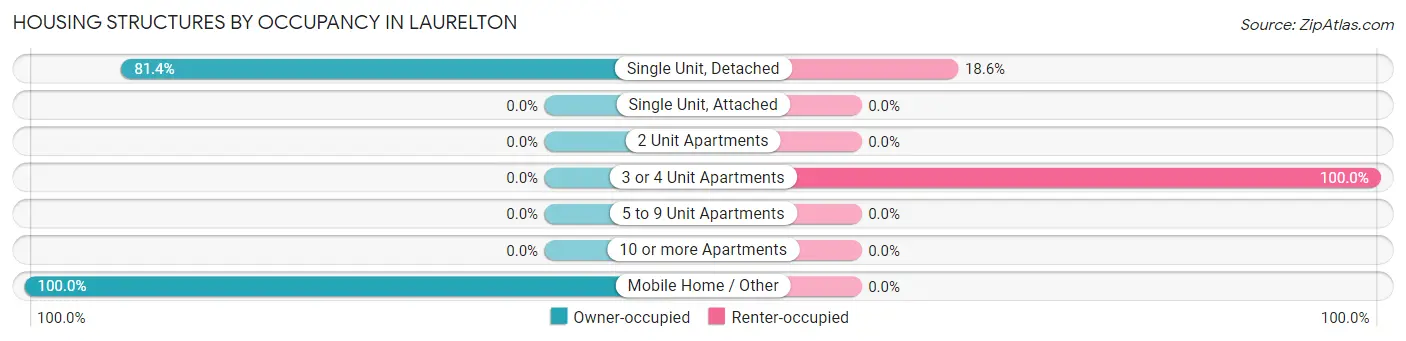
| Structure Type | Owner-occupied | Renter-occupied |
| Single Unit, Detached | 83 (81.4%) | 19 (18.6%) |
| Single Unit, Attached | 0 (0.0%) | 0 (0.0%) |
| 2 Unit Apartments | 0 (0.0%) | 0 (0.0%) |
| 3 or 4 Unit Apartments | 0 (0.0%) | 10 (100.0%) |
| 5 to 9 Unit Apartments | 0 (0.0%) | 0 (0.0%) |
| 10 or more Apartments | 0 (0.0%) | 0 (0.0%) |
| Mobile Home / Other | 3 (100.0%) | 0 (0.0%) |
| Total | 86 (74.8%) | 29 (25.2%) |
Housing Structures by Number of Rooms in Laurelton
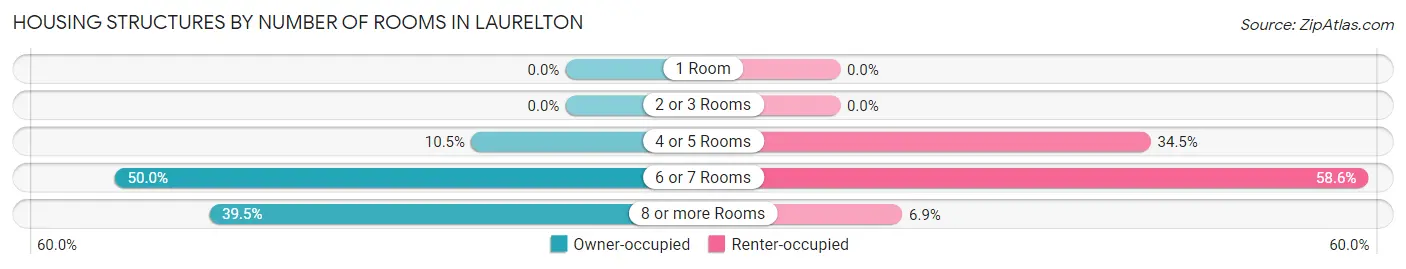
| Number of Rooms | Owner-occupied | Renter-occupied |
| 1 Room | 0 (0.0%) | 0 (0.0%) |
| 2 or 3 Rooms | 0 (0.0%) | 0 (0.0%) |
| 4 or 5 Rooms | 9 (10.5%) | 10 (34.5%) |
| 6 or 7 Rooms | 43 (50.0%) | 17 (58.6%) |
| 8 or more Rooms | 34 (39.5%) | 2 (6.9%) |
| Total | 86 (100.0%) | 29 (100.0%) |
Housing Structure by Heating Type in Laurelton
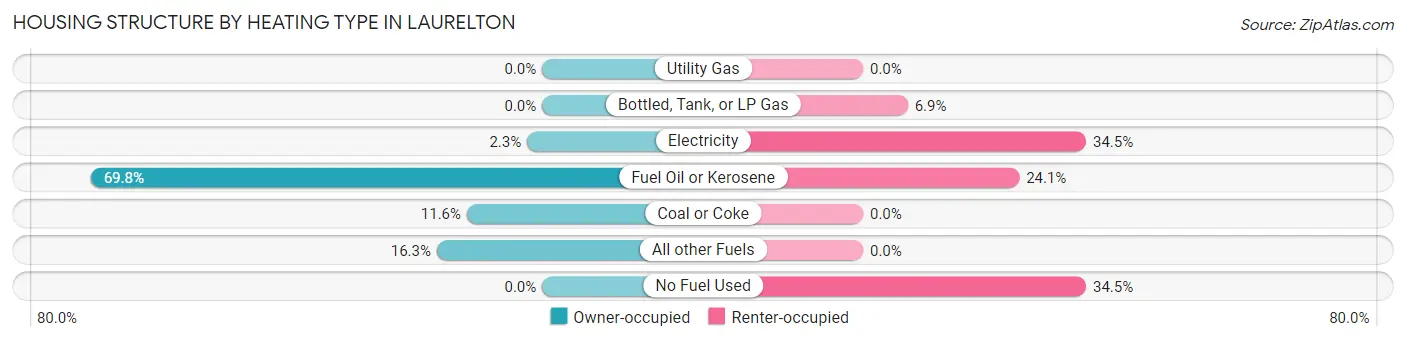
| Heating Type | Owner-occupied | Renter-occupied |
| Utility Gas | 0 (0.0%) | 0 (0.0%) |
| Bottled, Tank, or LP Gas | 0 (0.0%) | 2 (6.9%) |
| Electricity | 2 (2.3%) | 10 (34.5%) |
| Fuel Oil or Kerosene | 60 (69.8%) | 7 (24.1%) |
| Coal or Coke | 10 (11.6%) | 0 (0.0%) |
| All other Fuels | 14 (16.3%) | 0 (0.0%) |
| No Fuel Used | 0 (0.0%) | 10 (34.5%) |
| Total | 86 (100.0%) | 29 (100.0%) |
Household Vehicle Usage in Laurelton
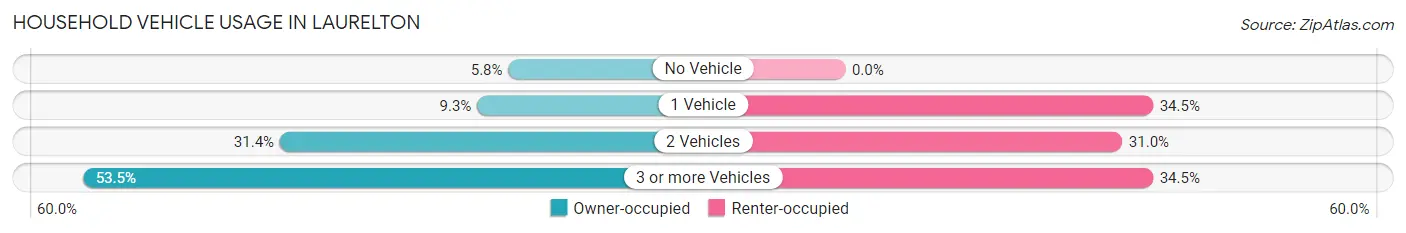
| Vehicles per Household | Owner-occupied | Renter-occupied |
| No Vehicle | 5 (5.8%) | 0 (0.0%) |
| 1 Vehicle | 8 (9.3%) | 10 (34.5%) |
| 2 Vehicles | 27 (31.4%) | 9 (31.0%) |
| 3 or more Vehicles | 46 (53.5%) | 10 (34.5%) |
| Total | 86 (100.0%) | 29 (100.0%) |
Real Estate & Mortgages in Laurelton
Real Estate and Mortgage Overview in Laurelton
| Characteristic | Without Mortgage | With Mortgage |
| Housing Units | 32 | 54 |
| Median Property Value | $225,000 | $177,500 |
| Median Household Income | $54,583 | $3 |
| Monthly Housing Costs | $473 | $0 |
| Real Estate Taxes | $3,000 | $0 |
Property Value by Mortgage Status in Laurelton
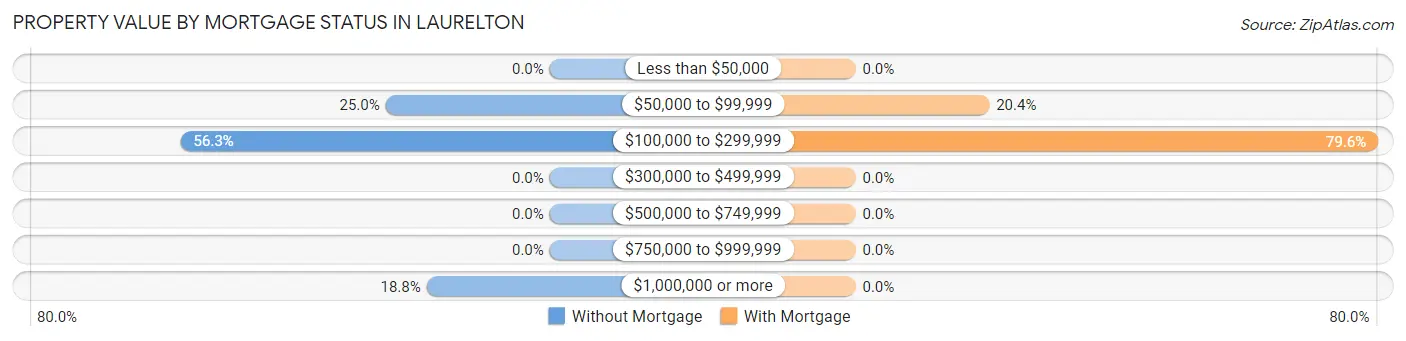
| Property Value | Without Mortgage | With Mortgage |
| Less than $50,000 | 0 (0.0%) | 0 (0.0%) |
| $50,000 to $99,999 | 8 (25.0%) | 11 (20.4%) |
| $100,000 to $299,999 | 18 (56.2%) | 43 (79.6%) |
| $300,000 to $499,999 | 0 (0.0%) | 0 (0.0%) |
| $500,000 to $749,999 | 0 (0.0%) | 0 (0.0%) |
| $750,000 to $999,999 | 0 (0.0%) | 0 (0.0%) |
| $1,000,000 or more | 6 (18.8%) | 0 (0.0%) |
| Total | 32 (100.0%) | 54 (100.0%) |
Household Income by Mortgage Status in Laurelton
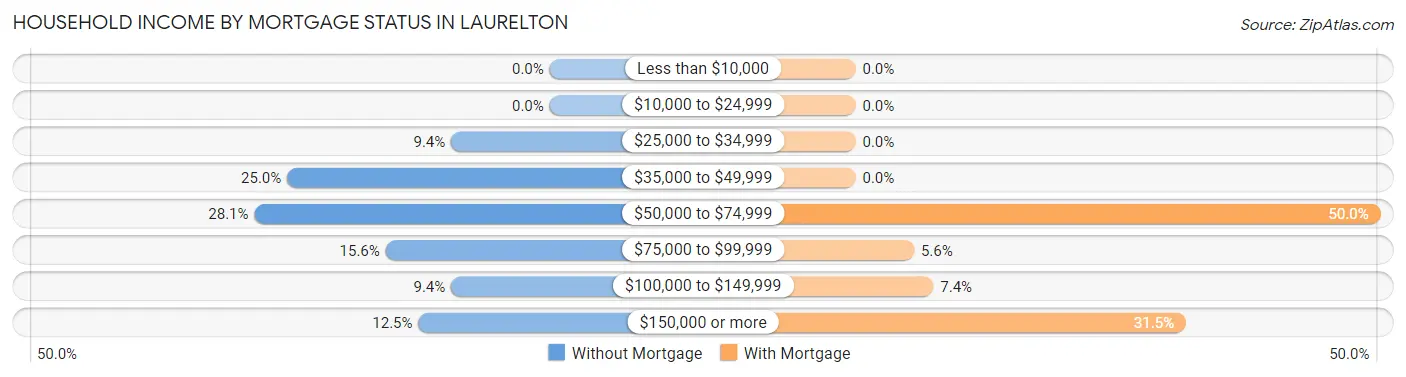
| Household Income | Without Mortgage | With Mortgage |
| Less than $10,000 | 0 (0.0%) | 0 (0.0%) |
| $10,000 to $24,999 | 0 (0.0%) | 0 (0.0%) |
| $25,000 to $34,999 | 3 (9.4%) | 0 (0.0%) |
| $35,000 to $49,999 | 8 (25.0%) | 0 (0.0%) |
| $50,000 to $74,999 | 9 (28.1%) | 27 (50.0%) |
| $75,000 to $99,999 | 5 (15.6%) | 3 (5.6%) |
| $100,000 to $149,999 | 3 (9.4%) | 4 (7.4%) |
| $150,000 or more | 4 (12.5%) | 17 (31.5%) |
| Total | 32 (100.0%) | 54 (100.0%) |
Property Value to Household Income Ratio in Laurelton
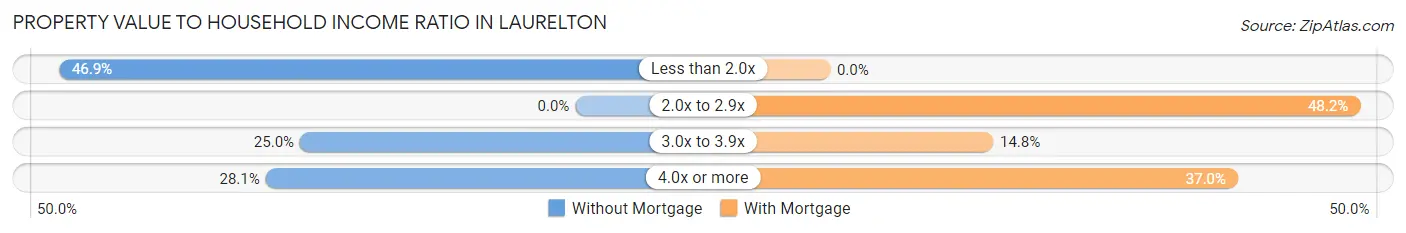
| Value-to-Income Ratio | Without Mortgage | With Mortgage |
| Less than 2.0x | 15 (46.9%) | 0 (0.0%) |
| 2.0x to 2.9x | 0 (0.0%) | 26 (48.1%) |
| 3.0x to 3.9x | 8 (25.0%) | 8 (14.8%) |
| 4.0x or more | 9 (28.1%) | 20 (37.0%) |
| Total | 32 (100.0%) | 54 (100.0%) |
Real Estate Taxes by Mortgage Status in Laurelton
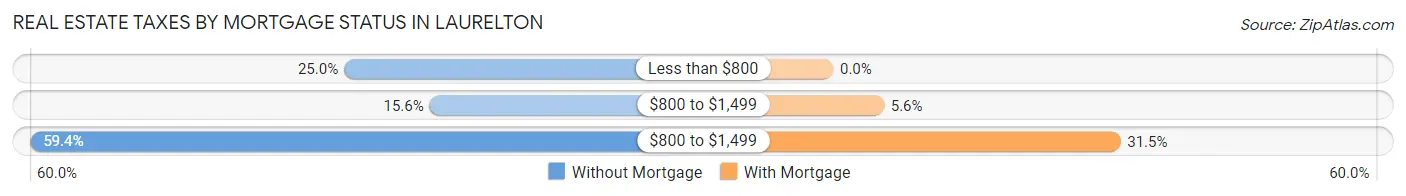
| Property Taxes | Without Mortgage | With Mortgage |
| Less than $800 | 8 (25.0%) | 0 (0.0%) |
| $800 to $1,499 | 5 (15.6%) | 3 (5.6%) |
| $800 to $1,499 | 19 (59.4%) | 17 (31.5%) |
| Total | 32 (100.0%) | 54 (100.0%) |
Health & Disability in Laurelton
Health Insurance Coverage by Age in Laurelton
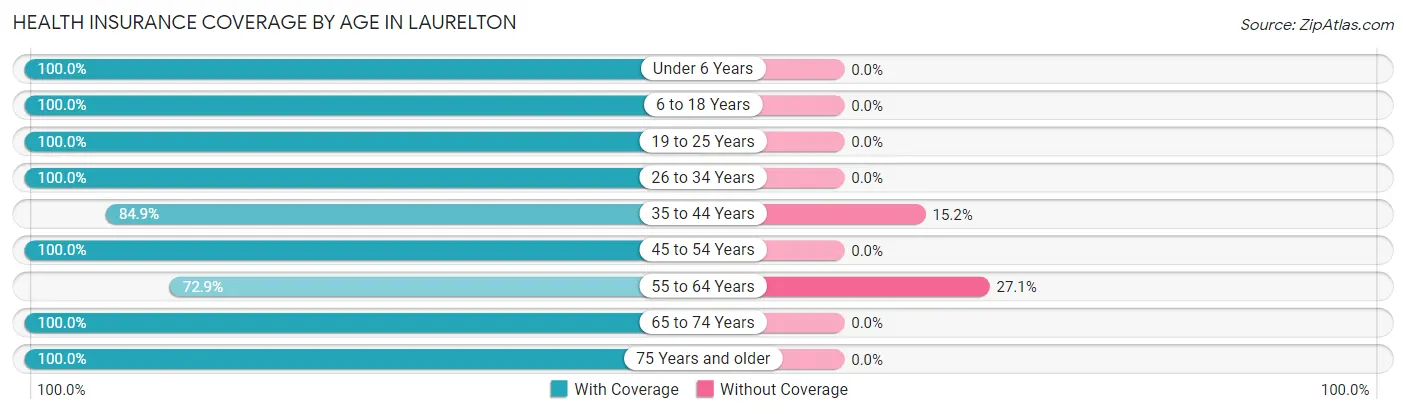
| Age Bracket | With Coverage | Without Coverage |
| Under 6 Years | 10 (100.0%) | 0 (0.0%) |
| 6 to 18 Years | 147 (100.0%) | 0 (0.0%) |
| 19 to 25 Years | 4 (100.0%) | 0 (0.0%) |
| 26 to 34 Years | 22 (100.0%) | 0 (0.0%) |
| 35 to 44 Years | 56 (84.9%) | 10 (15.1%) |
| 45 to 54 Years | 32 (100.0%) | 0 (0.0%) |
| 55 to 64 Years | 35 (72.9%) | 13 (27.1%) |
| 65 to 74 Years | 16 (100.0%) | 0 (0.0%) |
| 75 Years and older | 21 (100.0%) | 0 (0.0%) |
| Total | 343 (93.7%) | 23 (6.3%) |
Health Insurance Coverage by Citizenship Status in Laurelton
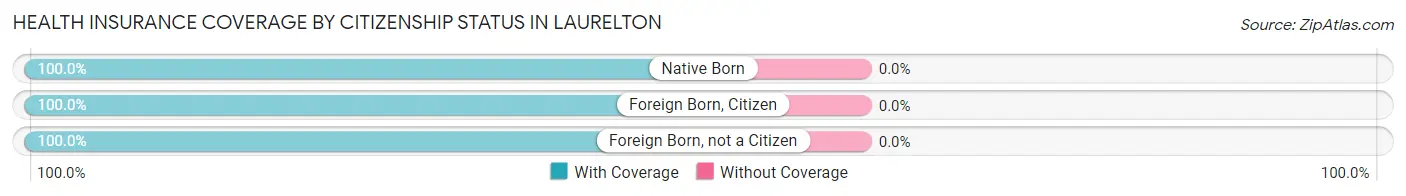
| Citizenship Status | With Coverage | Without Coverage |
| Native Born | 10 (100.0%) | 0 (0.0%) |
| Foreign Born, Citizen | 147 (100.0%) | 0 (0.0%) |
| Foreign Born, not a Citizen | 4 (100.0%) | 0 (0.0%) |
Health Insurance Coverage by Household Income in Laurelton
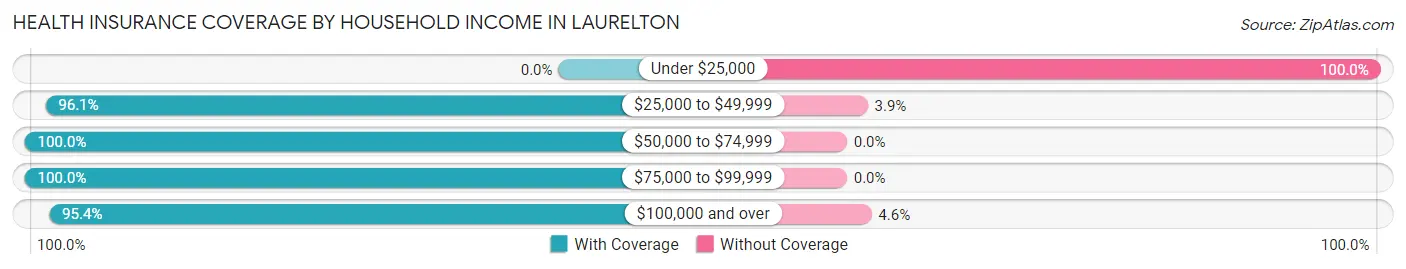
| Household Income | With Coverage | Without Coverage |
| Under $25,000 | 0 (0.0%) | 10 (100.0%) |
| $25,000 to $49,999 | 148 (96.1%) | 6 (3.9%) |
| $50,000 to $74,999 | 24 (100.0%) | 0 (0.0%) |
| $75,000 to $99,999 | 26 (100.0%) | 0 (0.0%) |
| $100,000 and over | 145 (95.4%) | 7 (4.6%) |
Public vs Private Health Insurance Coverage by Age in Laurelton
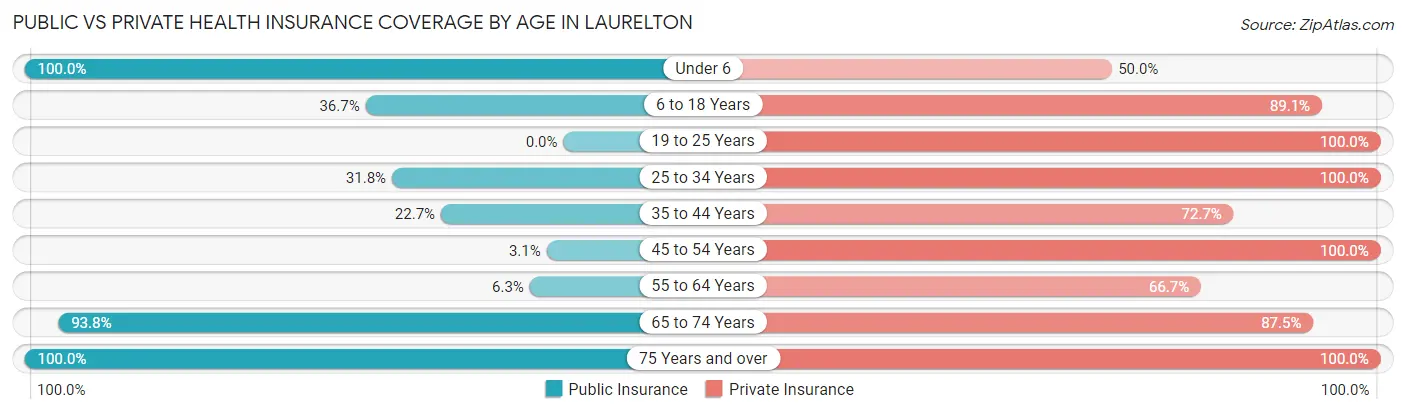
| Age Bracket | Public Insurance | Private Insurance |
| Under 6 | 10 (100.0%) | 5 (50.0%) |
| 6 to 18 Years | 54 (36.7%) | 131 (89.1%) |
| 19 to 25 Years | 0 (0.0%) | 4 (100.0%) |
| 25 to 34 Years | 7 (31.8%) | 22 (100.0%) |
| 35 to 44 Years | 15 (22.7%) | 48 (72.7%) |
| 45 to 54 Years | 1 (3.1%) | 32 (100.0%) |
| 55 to 64 Years | 3 (6.2%) | 32 (66.7%) |
| 65 to 74 Years | 15 (93.8%) | 14 (87.5%) |
| 75 Years and over | 21 (100.0%) | 21 (100.0%) |
| Total | 126 (34.4%) | 309 (84.4%) |
Disability Status by Sex by Age in Laurelton
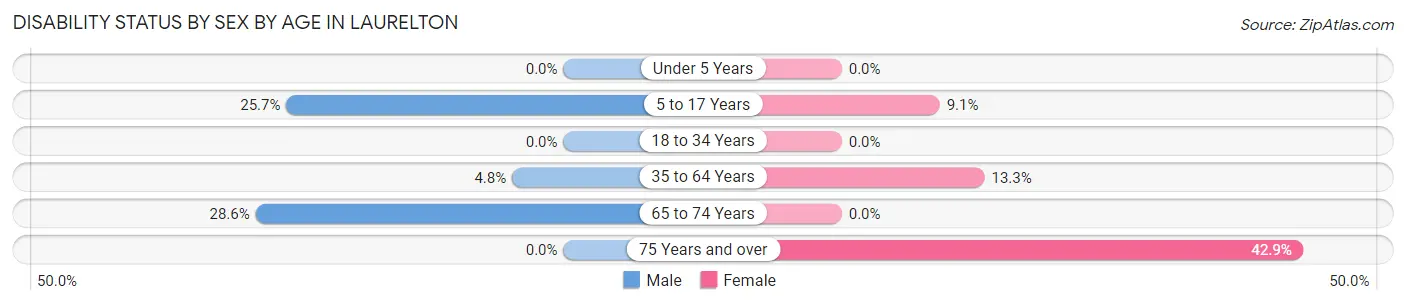
| Age Bracket | Male | Female |
| Under 5 Years | 0 (0.0%) | 0 (0.0%) |
| 5 to 17 Years | 9 (25.7%) | 9 (9.1%) |
| 18 to 34 Years | 0 (0.0%) | 0 (0.0%) |
| 35 to 64 Years | 3 (4.8%) | 11 (13.3%) |
| 65 to 74 Years | 2 (28.6%) | 0 (0.0%) |
| 75 Years and over | 0 (0.0%) | 6 (42.9%) |
Disability Class by Sex by Age in Laurelton
Disability Class: Hearing Difficulty
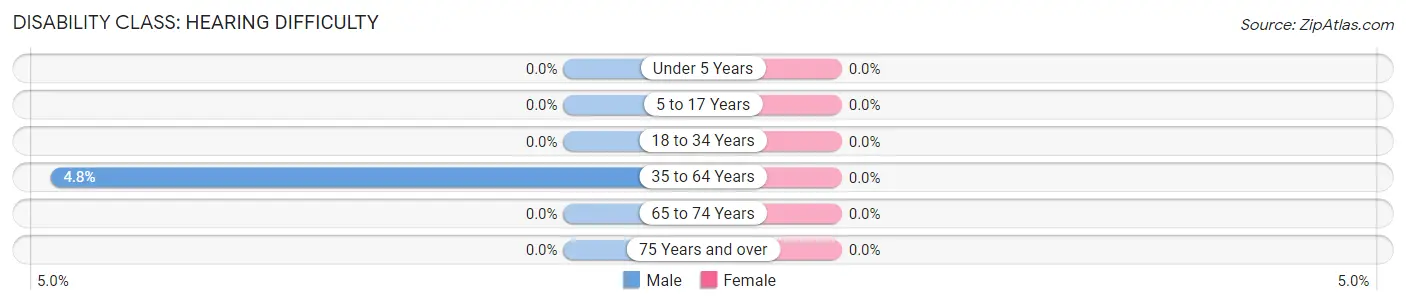
| Age Bracket | Male | Female |
| Under 5 Years | 0 (0.0%) | 0 (0.0%) |
| 5 to 17 Years | 0 (0.0%) | 0 (0.0%) |
| 18 to 34 Years | 0 (0.0%) | 0 (0.0%) |
| 35 to 64 Years | 3 (4.8%) | 0 (0.0%) |
| 65 to 74 Years | 0 (0.0%) | 0 (0.0%) |
| 75 Years and over | 0 (0.0%) | 0 (0.0%) |
Disability Class: Vision Difficulty
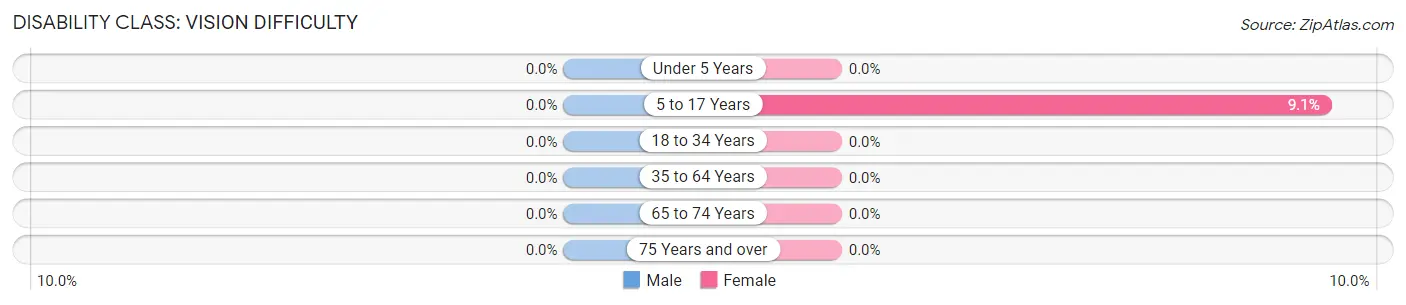
| Age Bracket | Male | Female |
| Under 5 Years | 0 (0.0%) | 0 (0.0%) |
| 5 to 17 Years | 0 (0.0%) | 9 (9.1%) |
| 18 to 34 Years | 0 (0.0%) | 0 (0.0%) |
| 35 to 64 Years | 0 (0.0%) | 0 (0.0%) |
| 65 to 74 Years | 0 (0.0%) | 0 (0.0%) |
| 75 Years and over | 0 (0.0%) | 0 (0.0%) |
Disability Class: Cognitive Difficulty
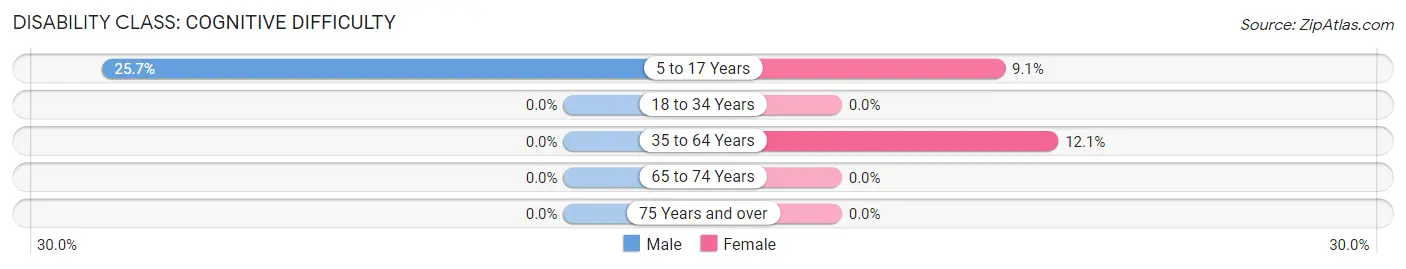
| Age Bracket | Male | Female |
| 5 to 17 Years | 9 (25.7%) | 9 (9.1%) |
| 18 to 34 Years | 0 (0.0%) | 0 (0.0%) |
| 35 to 64 Years | 0 (0.0%) | 10 (12.0%) |
| 65 to 74 Years | 0 (0.0%) | 0 (0.0%) |
| 75 Years and over | 0 (0.0%) | 0 (0.0%) |
Disability Class: Ambulatory Difficulty
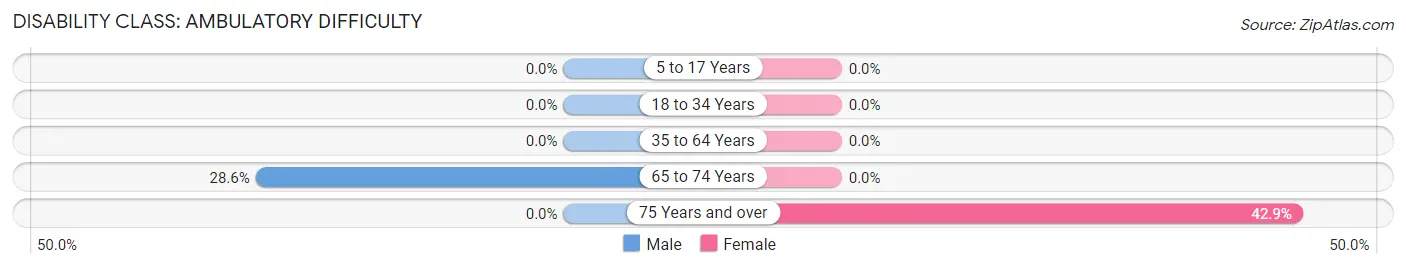
| Age Bracket | Male | Female |
| 5 to 17 Years | 0 (0.0%) | 0 (0.0%) |
| 18 to 34 Years | 0 (0.0%) | 0 (0.0%) |
| 35 to 64 Years | 0 (0.0%) | 0 (0.0%) |
| 65 to 74 Years | 2 (28.6%) | 0 (0.0%) |
| 75 Years and over | 0 (0.0%) | 6 (42.9%) |
Disability Class: Self-Care Difficulty
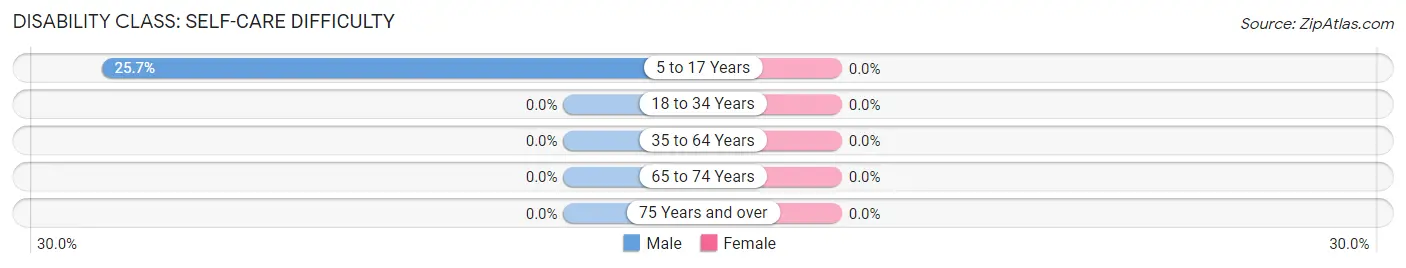
| Age Bracket | Male | Female |
| 5 to 17 Years | 9 (25.7%) | 0 (0.0%) |
| 18 to 34 Years | 0 (0.0%) | 0 (0.0%) |
| 35 to 64 Years | 0 (0.0%) | 0 (0.0%) |
| 65 to 74 Years | 0 (0.0%) | 0 (0.0%) |
| 75 Years and over | 0 (0.0%) | 0 (0.0%) |
Technology Access in Laurelton
Computing Device Access in Laurelton
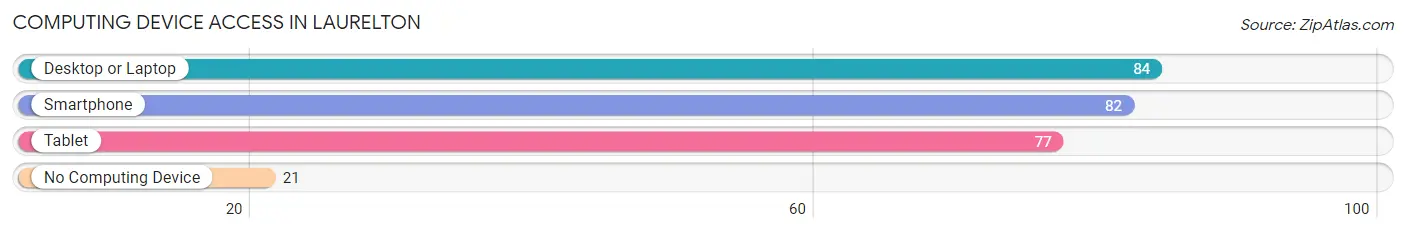
| Device Type | # Households | % Households |
| Desktop or Laptop | 84 | 73.0% |
| Smartphone | 82 | 71.3% |
| Tablet | 77 | 67.0% |
| No Computing Device | 21 | 18.3% |
| Total | 115 | 100.0% |
Internet Access in Laurelton
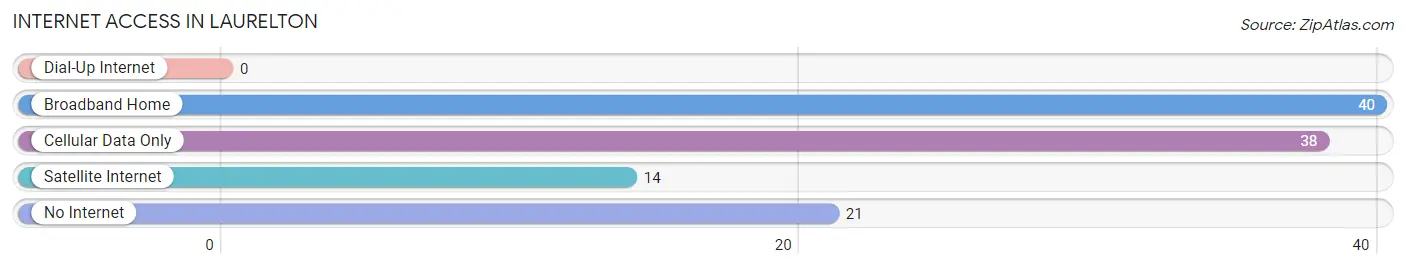
| Internet Type | # Households | % Households |
| Dial-Up Internet | 0 | 0.0% |
| Broadband Home | 40 | 34.8% |
| Cellular Data Only | 38 | 33.0% |
| Satellite Internet | 14 | 12.2% |
| No Internet | 21 | 18.3% |
| Total | 115 | 100.0% |
Laurelton Summary
Laurelton is a small borough located in the southeastern corner of Pennsylvania, in the United States. It is situated in the heart of the Susquehanna Valley, and is part of the greater Harrisburg metropolitan area. The borough is located in the county of Lancaster, and is bordered by the townships of East Hempfield, West Hempfield, and East Lampeter. The population of Laurelton was 2,845 at the 2010 census.
History
The area that is now Laurelton was first settled in the late 1700s by German immigrants. The town was originally known as “Lorelton”, and was officially incorporated in 1864. The name was changed to Laurelton in 1868. The town was originally a farming community, and the main crops grown were wheat, corn, and oats.
In the late 1800s, the town began to grow and develop. The railroad was extended to Laurelton in 1887, and the town became a popular stop for travelers. The railroad also brought new industry to the area, and several factories were built in the town. These included a cigar factory, a furniture factory, and a canning factory.
Geography
Laurelton is located in the southeastern corner of Pennsylvania, in the United States. It is situated in the heart of the Susquehanna Valley, and is part of the greater Harrisburg metropolitan area. The borough is located in the county of Lancaster, and is bordered by the townships of East Hempfield, West Hempfield, and East Lampeter.
The borough has a total area of 0.7 square miles, all of which is land. The borough is located in a rural area, and is surrounded by rolling hills and farmland. The borough is located near the Susquehanna River, and is about 25 miles from the state capital of Harrisburg.
Economy
The economy of Laurelton is largely based on agriculture and manufacturing. The town is home to several small businesses, including a furniture factory, a cigar factory, and a canning factory. The town is also home to several farms, which produce a variety of crops, including wheat, corn, and oats.
The town is also home to several retail stores, including a grocery store, a hardware store, and a pharmacy. The town is also home to several restaurants, including a diner, a pizza shop, and a Chinese restaurant.
Demographics
As of the 2010 census, the population of Laurelton was 2,845. The racial makeup of the borough was 95.3% White, 1.2% African American, 0.3% Native American, 0.7% Asian, 0.1% Pacific Islander, 0.7% from other races, and 1.7% from two or more races. Hispanic or Latino of any race were 2.2% of the population.
The median household income in Laurelton was $45,938, and the median family income was $51,938. The per capita income for the borough was $20,938. About 8.3% of families and 10.2% of the population were below the poverty line, including 14.2% of those under age 18 and 6.2% of those age 65 or over.
Common Questions
What is Per Capita Income in Laurelton?
Per Capita income in Laurelton is $22,630.
What is the Median Family Income in Laurelton?
Median Family Income in Laurelton is $65,000.
What is the Median Household income in Laurelton?
Median Household Income in Laurelton is $52,708.
What is Income or Wage Gap in Laurelton?
Income or Wage Gap in Laurelton is 21.0%.
Women in Laurelton earn 79.0 cents for every dollar earned by a man.
What is Inequality or Gini Index in Laurelton?
Inequality or Gini Index in Laurelton is 0.33.
What is the Total Population of Laurelton?
Total Population of Laurelton is 366.
What is the Total Male Population of Laurelton?
Total Male Population of Laurelton is 139.
What is the Total Female Population of Laurelton?
Total Female Population of Laurelton is 227.
What is the Ratio of Males per 100 Females in Laurelton?
There are 61.23 Males per 100 Females in Laurelton.
What is the Ratio of Females per 100 Males in Laurelton?
There are 163.31 Females per 100 Males in Laurelton.
What is the Median Population Age in Laurelton?
Median Population Age in Laurelton is 35.0 Years.
What is the Average Family Size in Laurelton
Average Family Size in Laurelton is 3.5 People.
What is the Average Household Size in Laurelton
Average Household Size in Laurelton is 3.2 People.
How Large is the Labor Force in Laurelton?
There are 191 People in the Labor Forcein in Laurelton.
What is the Percentage of People in the Labor Force in Laurelton?
76.1% of People are in the Labor Force in Laurelton.