Zip Codes with the Highest Percentage of Population Employed in Arts, Entertainment & Recreation in Lancaster, PA
RELATED REPORTS & OPTIONS
Arts, Entertainment & Recreation
Lancaster
Compare Zip Codes
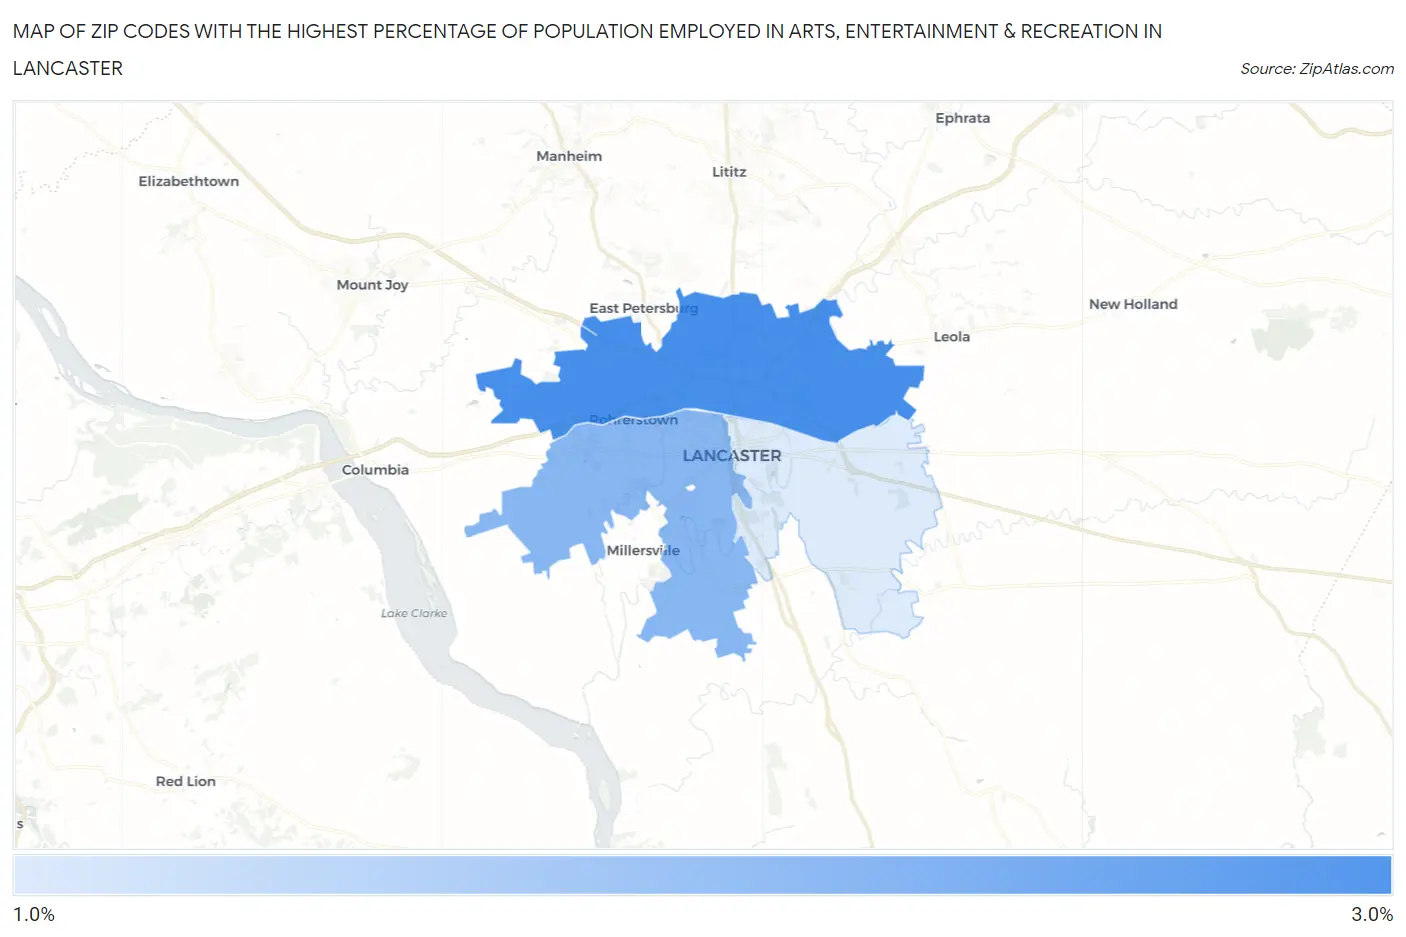
Map of Zip Codes with the Highest Percentage of Population Employed in Arts, Entertainment & Recreation in Lancaster
0.0%
3.0%
Zip Codes with the Highest Percentage of Population Employed in Arts, Entertainment & Recreation in Lancaster, PA
| Zip Code | % Employed | vs State | vs National | |
| 1. | 17601 | 2.8% | 1.8%(+1.02)#221 | 2.1%(+0.737)#5,916 |
| 2. | 17603 | 2.3% | 1.8%(+0.540)#333 | 2.1%(+0.256)#7,939 |
| 3. | 17602 | 1.7% | 1.8%(-0.082)#531 | 2.1%(-0.366)#11,618 |
1
Common Questions
What are the Top Zip Codes with the Highest Percentage of Population Employed in Arts, Entertainment & Recreation in Lancaster, PA?
Top Zip Codes with the Highest Percentage of Population Employed in Arts, Entertainment & Recreation in Lancaster, PA are:
What zip code has the Highest Percentage of Population Employed in Arts, Entertainment & Recreation in Lancaster, PA?
17601 has the Highest Percentage of Population Employed in Arts, Entertainment & Recreation in Lancaster, PA with 2.8%.
What is the Percentage of Population Employed in Arts, Entertainment & Recreation in Lancaster, PA?
Percentage of Population Employed in Arts, Entertainment & Recreation in Lancaster is 3.0%.
What is the Percentage of Population Employed in Arts, Entertainment & Recreation in Pennsylvania?
Percentage of Population Employed in Arts, Entertainment & Recreation in Pennsylvania is 1.8%.
What is the Percentage of Population Employed in Arts, Entertainment & Recreation in the United States?
Percentage of Population Employed in Arts, Entertainment & Recreation in the United States is 2.1%.