Lake Winola, PA Map & Demographics
Lake Winola Map
Lake Winola Overview
$33,711
PER CAPITA INCOME
$74,444
AVG FAMILY INCOME
$46,835
AVG HOUSEHOLD INCOME
20.0%
WAGE / INCOME GAP [ % ]
80.0¢/ $1
WAGE / INCOME GAP [ $ ]
0.38
INEQUALITY / GINI INDEX
602
TOTAL POPULATION
375
MALE POPULATION
227
FEMALE POPULATION
165.20
MALES / 100 FEMALES
60.53
FEMALES / 100 MALES
50.7
MEDIAN AGE
2.1
AVG FAMILY SIZE
1.9
AVG HOUSEHOLD SIZE
311
LABOR FORCE [ PEOPLE ]
56.5%
PERCENT IN LABOR FORCE
6.1%
UNEMPLOYMENT RATE
Lake Winola Zip Codes
Lake Winola Area Codes
Income in Lake Winola
Income Overview in Lake Winola
Per Capita Income in Lake Winola is $33,711, while median incomes of families and households are $74,444 and $46,835 respectively.
| Characteristic | Number | Measure |
| Per Capita Income | 602 | $33,711 |
| Median Family Income | 168 | $74,444 |
| Mean Family Income | 168 | $84,757 |
| Median Household Income | 313 | $46,835 |
| Mean Household Income | 313 | $63,909 |
| Income Deficit | 168 | $0 |
| Wage / Income Gap (%) | 602 | 19.95% |
| Wage / Income Gap ($) | 602 | 80.05¢ per $1 |
| Gini / Inequality Index | 602 | 0.38 |
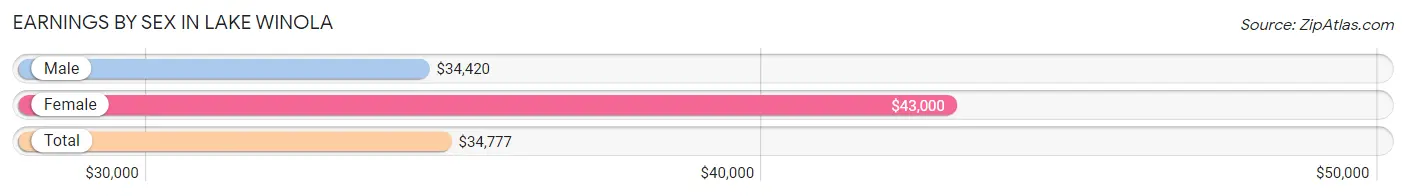
Earnings by Sex in Lake Winola
Average Earnings in Lake Winola are $34,777, $34,420 for men and $43,000 for women, a difference of 20.0%.
| Sex | Number | Average Earnings |
| Male | 243 (69.2%) | $34,420 |
| Female | 108 (30.8%) | $43,000 |
| Total | 351 (100.0%) | $34,777 |
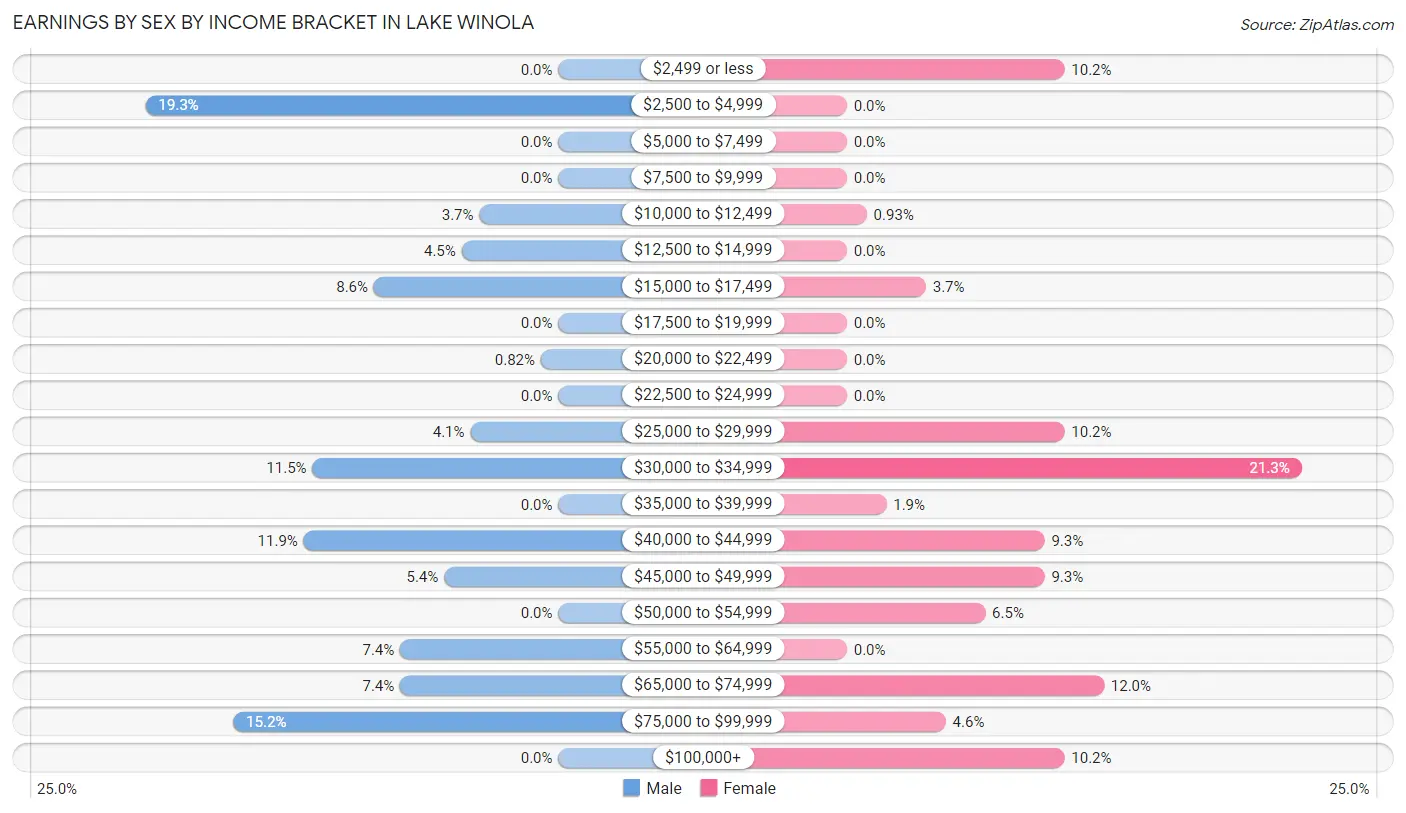
Earnings by Sex by Income Bracket in Lake Winola
The most common earnings brackets in Lake Winola are $2,500 to $4,999 for men (47 | 19.3%) and $30,000 to $34,999 for women (23 | 21.3%).
| Income | Male | Female |
| $2,499 or less | 0 (0.0%) | 11 (10.2%) |
| $2,500 to $4,999 | 47 (19.3%) | 0 (0.0%) |
| $5,000 to $7,499 | 0 (0.0%) | 0 (0.0%) |
| $7,500 to $9,999 | 0 (0.0%) | 0 (0.0%) |
| $10,000 to $12,499 | 9 (3.7%) | 1 (0.9%) |
| $12,500 to $14,999 | 11 (4.5%) | 0 (0.0%) |
| $15,000 to $17,499 | 21 (8.6%) | 4 (3.7%) |
| $17,500 to $19,999 | 0 (0.0%) | 0 (0.0%) |
| $20,000 to $22,499 | 2 (0.8%) | 0 (0.0%) |
| $22,500 to $24,999 | 0 (0.0%) | 0 (0.0%) |
| $25,000 to $29,999 | 10 (4.1%) | 11 (10.2%) |
| $30,000 to $34,999 | 28 (11.5%) | 23 (21.3%) |
| $35,000 to $39,999 | 0 (0.0%) | 2 (1.8%) |
| $40,000 to $44,999 | 29 (11.9%) | 10 (9.3%) |
| $45,000 to $49,999 | 13 (5.3%) | 10 (9.3%) |
| $50,000 to $54,999 | 0 (0.0%) | 7 (6.5%) |
| $55,000 to $64,999 | 18 (7.4%) | 0 (0.0%) |
| $65,000 to $74,999 | 18 (7.4%) | 13 (12.0%) |
| $75,000 to $99,999 | 37 (15.2%) | 5 (4.6%) |
| $100,000+ | 0 (0.0%) | 11 (10.2%) |
| Total | 243 (100.0%) | 108 (100.0%) |
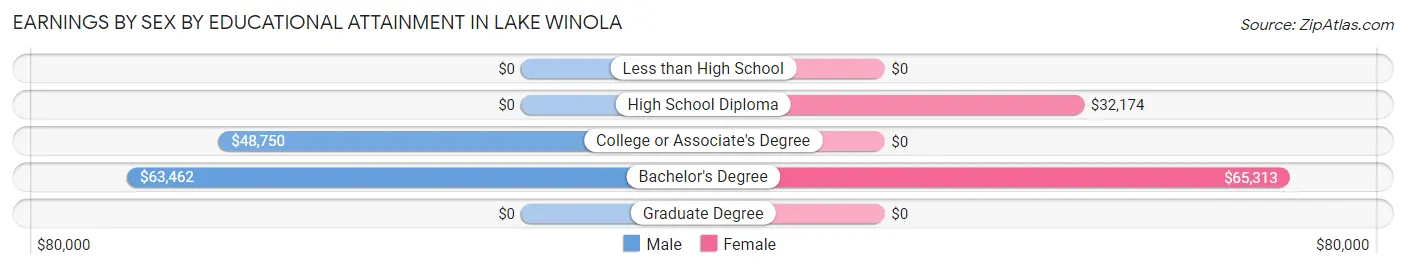
Earnings by Sex by Educational Attainment in Lake Winola
Average earnings in Lake Winola are $34,330 for men and $43,000 for women, a difference of 20.2%. Men with an educational attainment of bachelor's degree enjoy the highest average annual earnings of $63,462, while those with college or associate's degree education earn the least with $48,750. Women with an educational attainment of bachelor's degree earn the most with the average annual earnings of $65,313, while those with high school diploma education have the smallest earnings of $32,174.
| Educational Attainment | Male Income | Female Income |
| Less than High School | - | - |
| High School Diploma | - | - |
| College or Associate's Degree | $48,750 | $0 |
| Bachelor's Degree | $63,462 | $65,313 |
| Graduate Degree | - | - |
| Total | $34,330 | $43,000 |
Family Income in Lake Winola
Family Income Brackets in Lake Winola
According to the Lake Winola family income data, there are 59 families falling into the $50,000 to $74,999 income range, which is the most common income bracket and makes up 35.1% of all families.
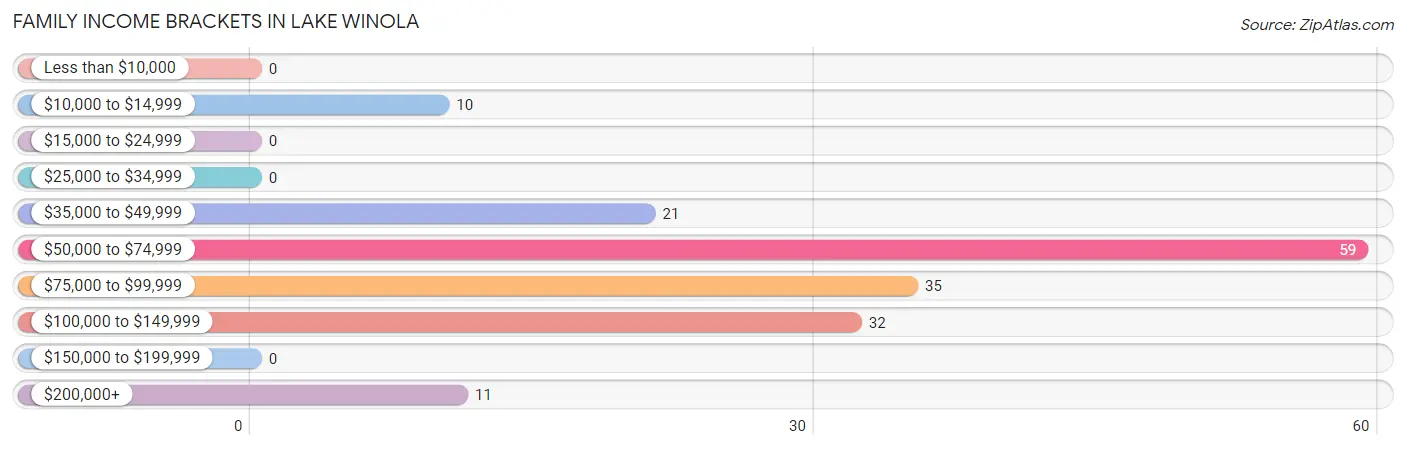
| Income Bracket | # Families | % Families |
| Less than $10,000 | 0 | 0.0% |
| $10,000 to $14,999 | 10 | 6.0% |
| $15,000 to $24,999 | 0 | 0.0% |
| $25,000 to $34,999 | 0 | 0.0% |
| $35,000 to $49,999 | 21 | 12.5% |
| $50,000 to $74,999 | 59 | 35.1% |
| $75,000 to $99,999 | 35 | 20.8% |
| $100,000 to $149,999 | 32 | 19.0% |
| $150,000 to $199,999 | 0 | 0.0% |
| $200,000+ | 11 | 6.5% |
Family Income by Famaliy Size in Lake Winola
2-person families (152 | 90.5%) account for the highest median family income in Lake Winola with $73,704 per family, while 2-person families (152 | 90.5%) have the highest median income of $36,852 per family member.
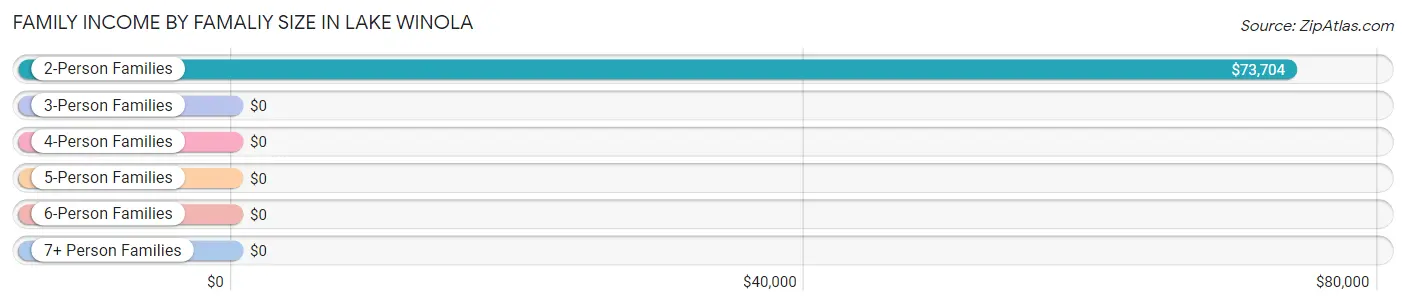
| Income Bracket | # Families | Median Income |
| 2-Person Families | 152 (90.5%) | $73,704 |
| 3-Person Families | 11 (6.6%) | $0 |
| 4-Person Families | 5 (3.0%) | $0 |
| 5-Person Families | 0 (0.0%) | $0 |
| 6-Person Families | 0 (0.0%) | $0 |
| 7+ Person Families | 0 (0.0%) | $0 |
| Total | 168 (100.0%) | $74,444 |
Family Income by Number of Earners in Lake Winola
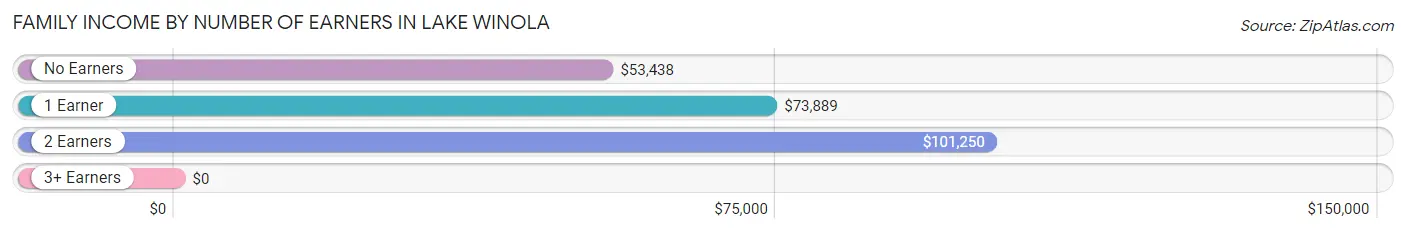
| Number of Earners | # Families | Median Income |
| No Earners | 35 (20.8%) | $53,438 |
| 1 Earner | 74 (44.1%) | $73,889 |
| 2 Earners | 59 (35.1%) | $101,250 |
| 3+ Earners | 0 (0.0%) | $0 |
| Total | 168 (100.0%) | $74,444 |
Household Income in Lake Winola
Household Income Brackets in Lake Winola
With 74 households falling in the category, the $35,000 to $49,999 income range is the most frequent in Lake Winola, accounting for 23.6% of all households.
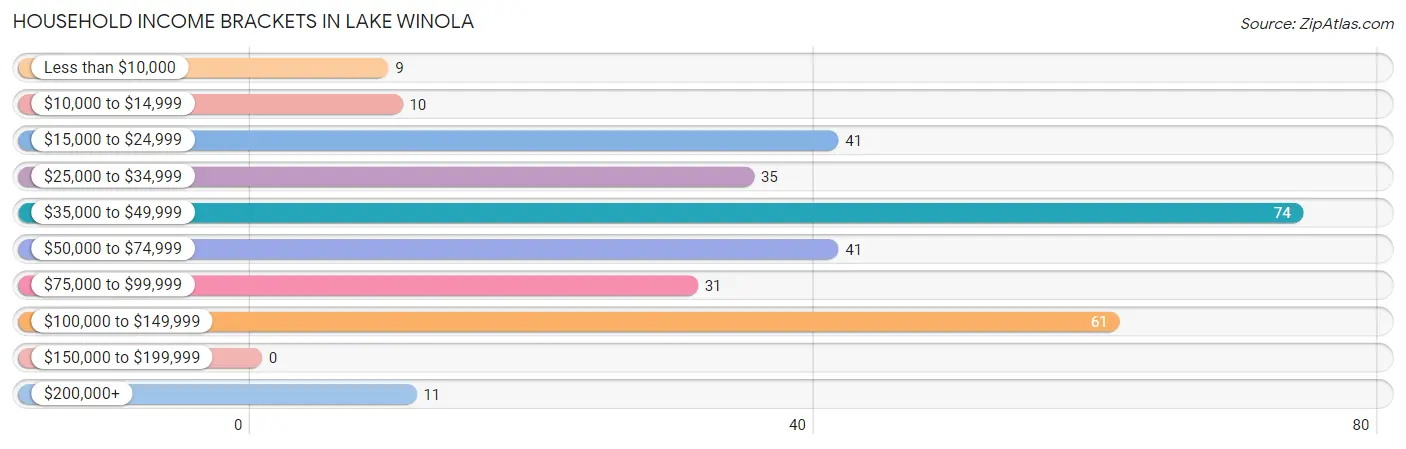
| Income Bracket | # Households | % Households |
| Less than $10,000 | 9 | 2.9% |
| $10,000 to $14,999 | 10 | 3.2% |
| $15,000 to $24,999 | 41 | 13.1% |
| $25,000 to $34,999 | 35 | 11.2% |
| $35,000 to $49,999 | 74 | 23.6% |
| $50,000 to $74,999 | 41 | 13.1% |
| $75,000 to $99,999 | 31 | 9.9% |
| $100,000 to $149,999 | 61 | 19.5% |
| $150,000 to $199,999 | 0 | 0.0% |
| $200,000+ | 11 | 3.5% |
Household Income by Householder Age in Lake Winola
The median household income in Lake Winola is $46,835, with the highest median household income of $76,000 found in the 45 to 64 years age bracket for the primary householder. A total of 118 households (37.7%) fall into this category. Meanwhile, the 15 to 24 years age bracket for the primary householder has the lowest median household income of $0, with 13 households (4.2%) in this group.
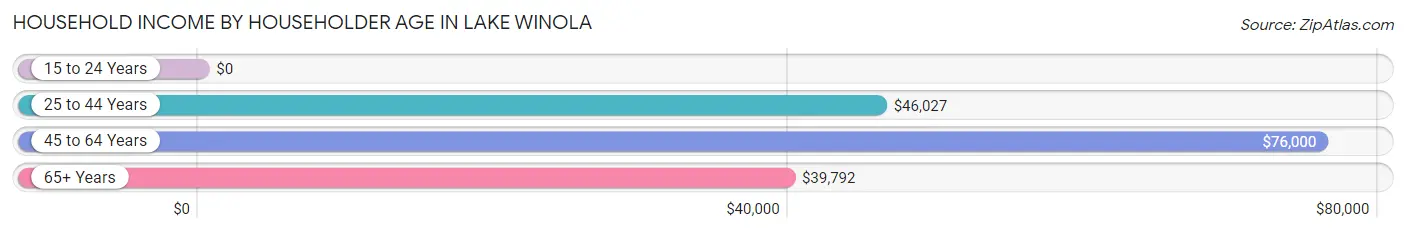
| Income Bracket | # Households | Median Income |
| 15 to 24 Years | 13 (4.2%) | $0 |
| 25 to 44 Years | 55 (17.6%) | $46,027 |
| 45 to 64 Years | 118 (37.7%) | $76,000 |
| 65+ Years | 127 (40.6%) | $39,792 |
| Total | 313 (100.0%) | $46,835 |
Poverty in Lake Winola
Income Below Poverty by Sex and Age in Lake Winola
With 18.4% poverty level for males and 9.2% for females among the residents of Lake Winola, 35 to 44 year old males and 35 to 44 year old females are the most vulnerable to poverty, with 47 males (85.5%) and 11 females (42.3%) in their respective age groups living below the poverty level.
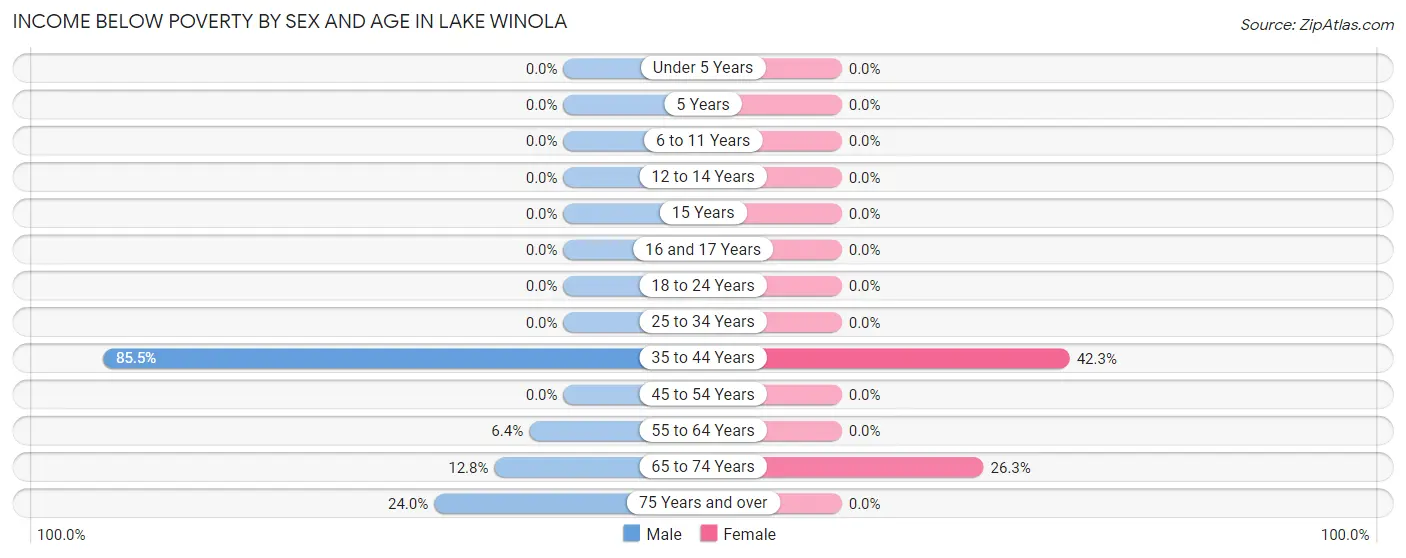
| Age Bracket | Male | Female |
| Under 5 Years | 0 (0.0%) | 0 (0.0%) |
| 5 Years | 0 (0.0%) | 0 (0.0%) |
| 6 to 11 Years | 0 (0.0%) | 0 (0.0%) |
| 12 to 14 Years | 0 (0.0%) | 0 (0.0%) |
| 15 Years | 0 (0.0%) | 0 (0.0%) |
| 16 and 17 Years | 0 (0.0%) | 0 (0.0%) |
| 18 to 24 Years | 0 (0.0%) | 0 (0.0%) |
| 25 to 34 Years | 0 (0.0%) | 0 (0.0%) |
| 35 to 44 Years | 47 (85.5%) | 11 (42.3%) |
| 45 to 54 Years | 0 (0.0%) | 0 (0.0%) |
| 55 to 64 Years | 3 (6.4%) | 0 (0.0%) |
| 65 to 74 Years | 10 (12.8%) | 10 (26.3%) |
| 75 Years and over | 6 (24.0%) | 0 (0.0%) |
| Total | 66 (18.4%) | 21 (9.2%) |
Income Above Poverty by Sex and Age in Lake Winola
According to the poverty statistics in Lake Winola, males aged 6 to 11 years and females aged 6 to 11 years are the age groups that are most secure financially, with 100.0% of males and 100.0% of females in these age groups living above the poverty line.
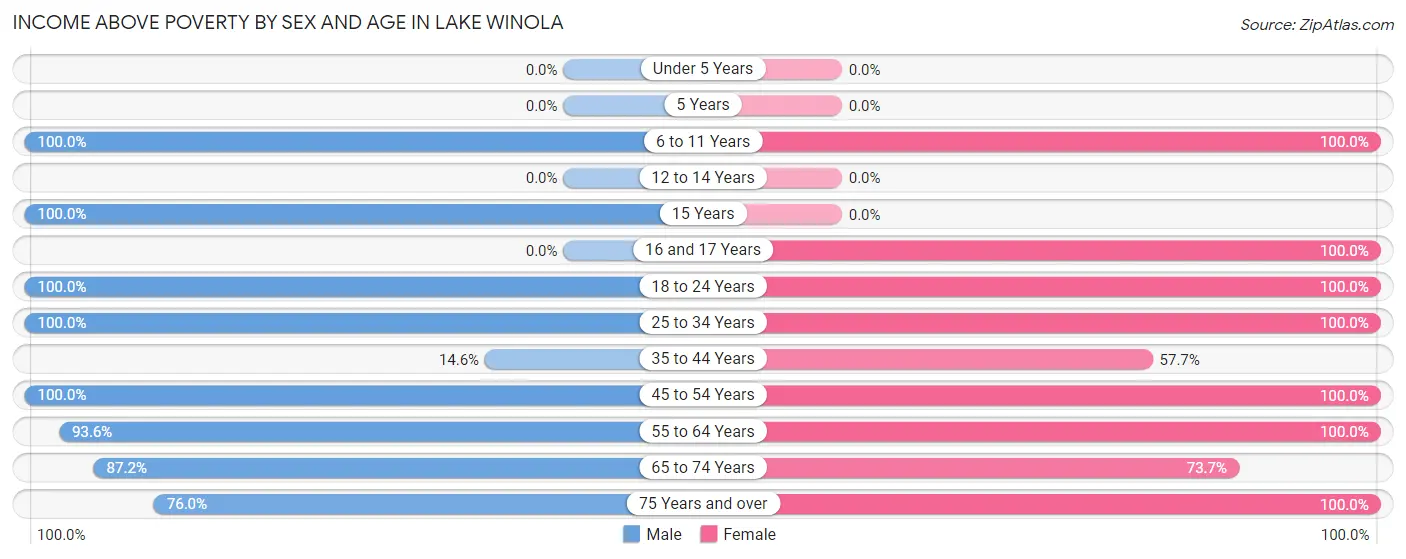
| Age Bracket | Male | Female |
| Under 5 Years | 0 (0.0%) | 0 (0.0%) |
| 5 Years | 0 (0.0%) | 0 (0.0%) |
| 6 to 11 Years | 4 (100.0%) | 9 (100.0%) |
| 12 to 14 Years | 0 (0.0%) | 0 (0.0%) |
| 15 Years | 23 (100.0%) | 0 (0.0%) |
| 16 and 17 Years | 0 (0.0%) | 4 (100.0%) |
| 18 to 24 Years | 35 (100.0%) | 4 (100.0%) |
| 25 to 34 Years | 42 (100.0%) | 24 (100.0%) |
| 35 to 44 Years | 8 (14.5%) | 15 (57.7%) |
| 45 to 54 Years | 50 (100.0%) | 38 (100.0%) |
| 55 to 64 Years | 44 (93.6%) | 58 (100.0%) |
| 65 to 74 Years | 68 (87.2%) | 28 (73.7%) |
| 75 Years and over | 19 (76.0%) | 26 (100.0%) |
| Total | 293 (81.6%) | 206 (90.7%) |
Income Below Poverty Among Married-Couple Families in Lake Winola
The poverty statistics for married-couple families in Lake Winola show that 9.4% or 10 of the total 106 families live below the poverty line. Families with no children have the highest poverty rate of 9.9%, comprising of 10 families. On the other hand, families with 1 or 2 children have the lowest poverty rate of 0.0%, which includes 0 families.
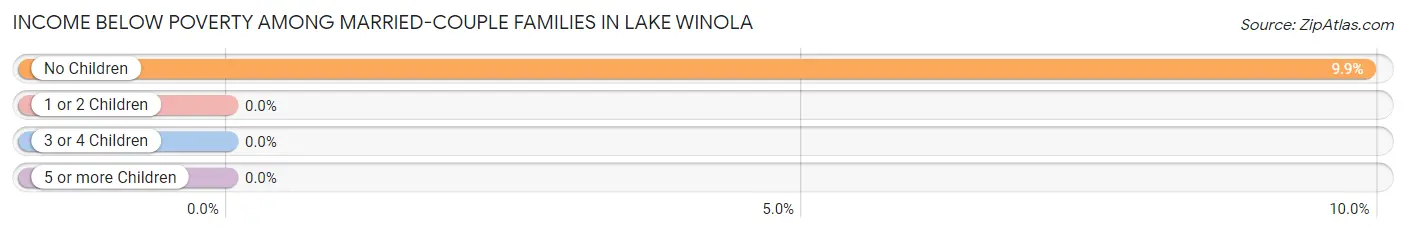
| Children | Above Poverty | Below Poverty |
| No Children | 91 (90.1%) | 10 (9.9%) |
| 1 or 2 Children | 5 (100.0%) | 0 (0.0%) |
| 3 or 4 Children | 0 (0.0%) | 0 (0.0%) |
| 5 or more Children | 0 (0.0%) | 0 (0.0%) |
| Total | 96 (90.6%) | 10 (9.4%) |
Income Below Poverty Among Single-Parent Households in Lake Winola
| Children | Single Father | Single Mother |
| No Children | 0 (0.0%) | 0 (0.0%) |
| 1 or 2 Children | 0 (0.0%) | 0 (0.0%) |
| 3 or 4 Children | 0 (0.0%) | 0 (0.0%) |
| 5 or more Children | 0 (0.0%) | 0 (0.0%) |
| Total | 0 (0.0%) | 0 (0.0%) |
Income Below Poverty Among Married-Couple vs Single-Parent Households in Lake Winola
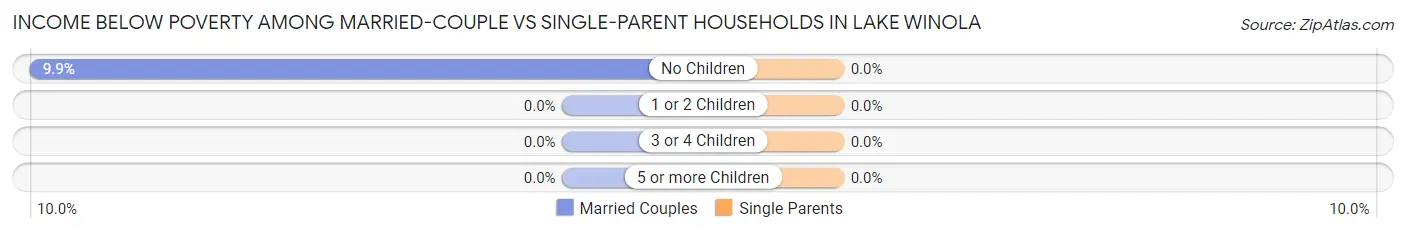
| Children | Married-Couple Families | Single-Parent Households |
| No Children | 10 (9.9%) | 0 (0.0%) |
| 1 or 2 Children | 0 (0.0%) | 0 (0.0%) |
| 3 or 4 Children | 0 (0.0%) | 0 (0.0%) |
| 5 or more Children | 0 (0.0%) | 0 (0.0%) |
| Total | 10 (9.4%) | 0 (0.0%) |
Race in Lake Winola
The most populous races in Lake Winola are White / Caucasian (595 | 98.8%), Hispanic or Latino (33 | 5.5%), and Some other Race (4 | 0.7%).
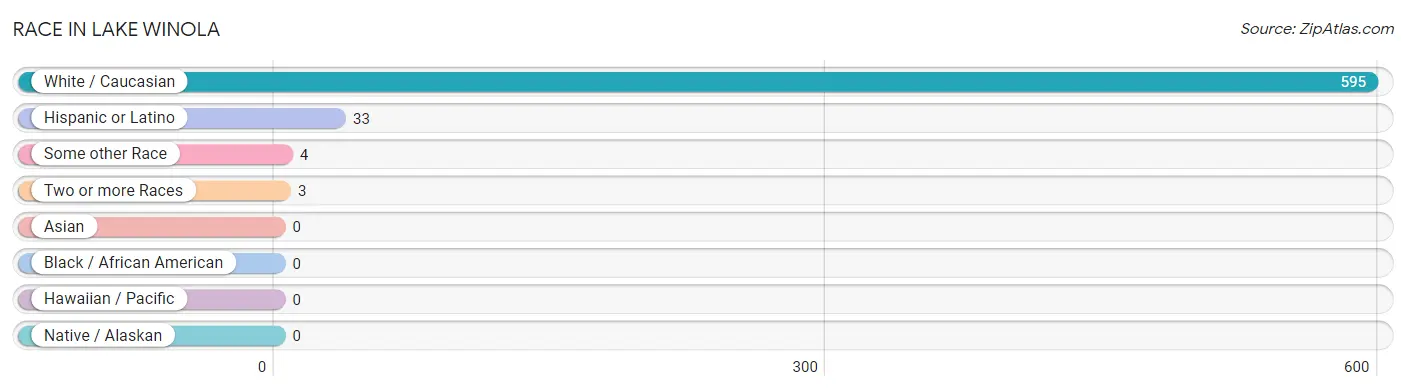
| Race | # Population | % Population |
| Asian | 0 | 0.0% |
| Black / African American | 0 | 0.0% |
| Hawaiian / Pacific | 0 | 0.0% |
| Hispanic or Latino | 33 | 5.5% |
| Native / Alaskan | 0 | 0.0% |
| White / Caucasian | 595 | 98.8% |
| Two or more Races | 3 | 0.5% |
| Some other Race | 4 | 0.7% |
| Total | 602 | 100.0% |
Ancestry in Lake Winola
The most populous ancestries reported in Lake Winola are German (232 | 38.5%), English (151 | 25.1%), Irish (126 | 20.9%), Polish (50 | 8.3%), and Italian (35 | 5.8%), together accounting for 98.7% of all Lake Winola residents.
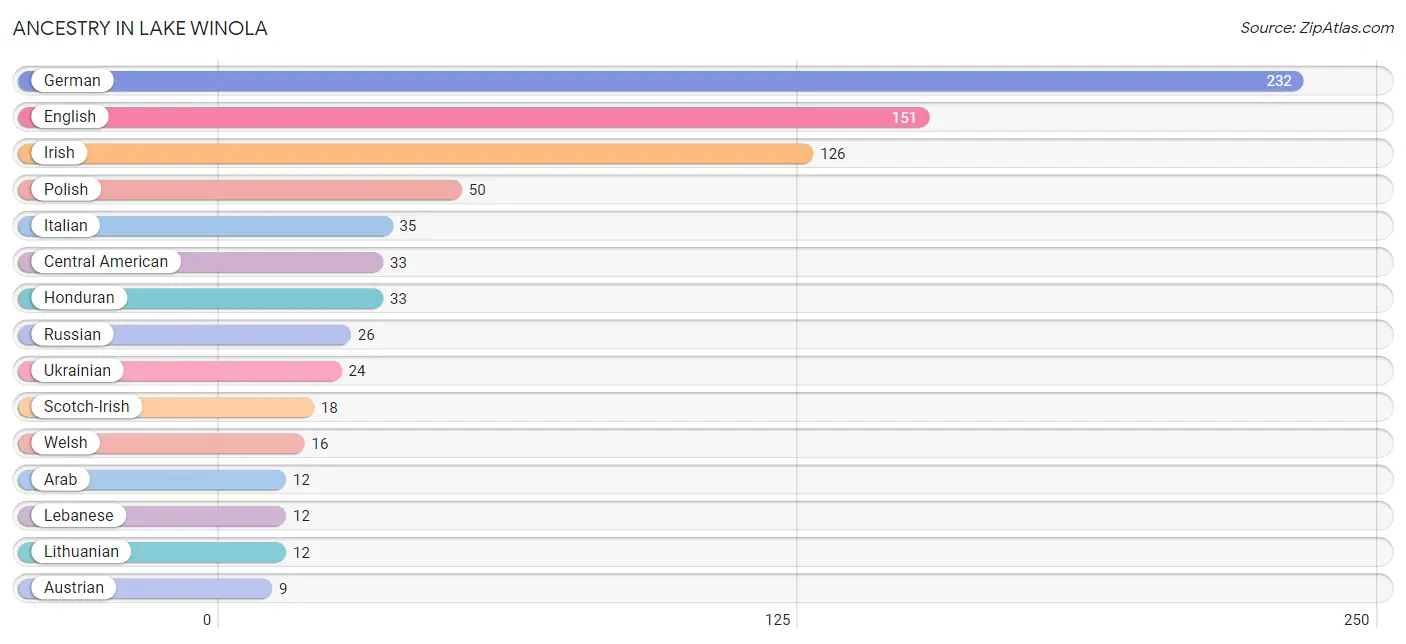
| Ancestry | # Population | % Population |
| Arab | 12 | 2.0% |
| Austrian | 9 | 1.5% |
| British | 9 | 1.5% |
| Central American | 33 | 5.5% |
| Czech | 3 | 0.5% |
| Delaware | 1 | 0.2% |
| Dutch | 3 | 0.5% |
| English | 151 | 25.1% |
| German | 232 | 38.5% |
| Honduran | 33 | 5.5% |
| Irish | 126 | 20.9% |
| Iroquois | 1 | 0.2% |
| Italian | 35 | 5.8% |
| Lebanese | 12 | 2.0% |
| Lithuanian | 12 | 2.0% |
| Pennsylvania German | 9 | 1.5% |
| Polish | 50 | 8.3% |
| Russian | 26 | 4.3% |
| Scotch-Irish | 18 | 3.0% |
| Scottish | 3 | 0.5% |
| Serbian | 9 | 1.5% |
| Slovak | 5 | 0.8% |
| South African | 4 | 0.7% |
| Subsaharan African | 4 | 0.7% |
| Ukrainian | 24 | 4.0% |
| Welsh | 16 | 2.7% | View All 26 Rows |
Immigrants in Lake Winola
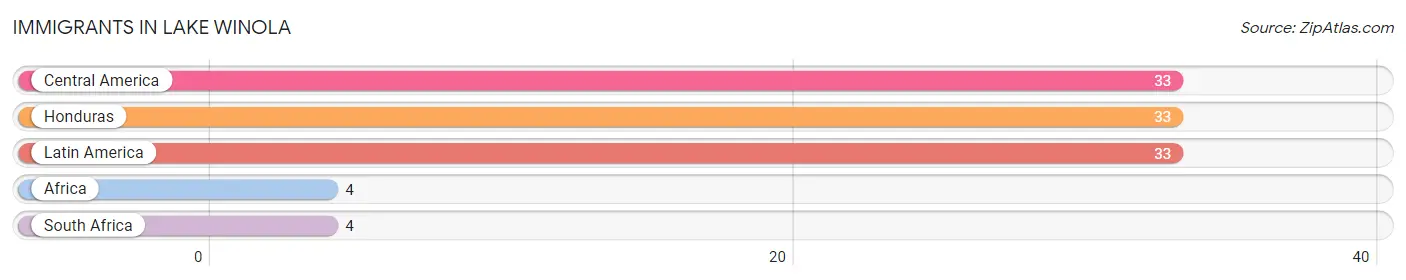
The most numerous immigrant groups reported in Lake Winola came from Central America (33 | 5.5%), Honduras (33 | 5.5%), Latin America (33 | 5.5%), Africa (4 | 0.7%), and South Africa (4 | 0.7%), together accounting for 17.8% of all Lake Winola residents.
| Immigration Origin | # Population | % Population |
| Africa | 4 | 0.7% |
| Central America | 33 | 5.5% |
| Honduras | 33 | 5.5% |
| Latin America | 33 | 5.5% |
| South Africa | 4 | 0.7% | View All 5 Rows |
Sex and Age in Lake Winola
Sex and Age in Lake Winola
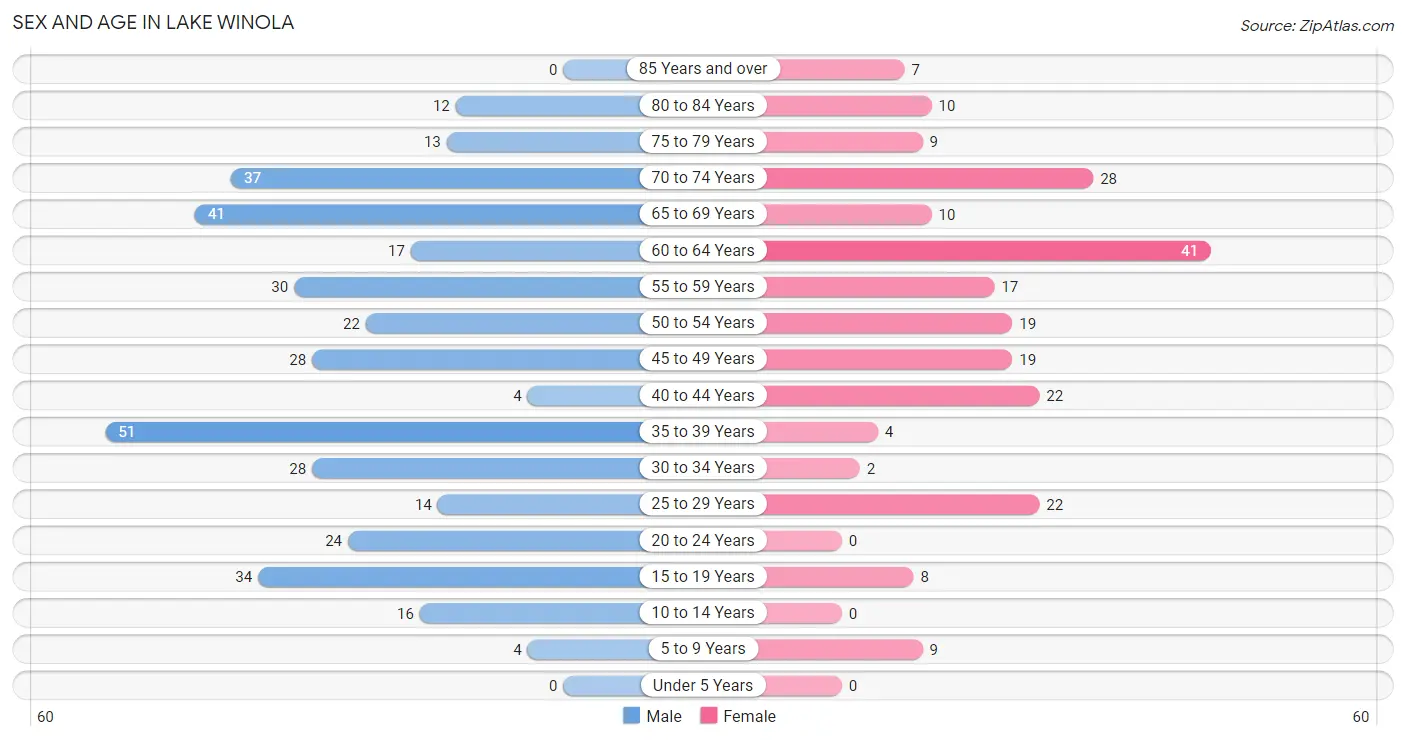
The most populous age groups in Lake Winola are 35 to 39 Years (51 | 13.6%) for men and 60 to 64 Years (41 | 18.1%) for women.
| Age Bracket | Male | Female |
| Under 5 Years | 0 (0.0%) | 0 (0.0%) |
| 5 to 9 Years | 4 (1.1%) | 9 (4.0%) |
| 10 to 14 Years | 16 (4.3%) | 0 (0.0%) |
| 15 to 19 Years | 34 (9.1%) | 8 (3.5%) |
| 20 to 24 Years | 24 (6.4%) | 0 (0.0%) |
| 25 to 29 Years | 14 (3.7%) | 22 (9.7%) |
| 30 to 34 Years | 28 (7.5%) | 2 (0.9%) |
| 35 to 39 Years | 51 (13.6%) | 4 (1.8%) |
| 40 to 44 Years | 4 (1.1%) | 22 (9.7%) |
| 45 to 49 Years | 28 (7.5%) | 19 (8.4%) |
| 50 to 54 Years | 22 (5.9%) | 19 (8.4%) |
| 55 to 59 Years | 30 (8.0%) | 17 (7.5%) |
| 60 to 64 Years | 17 (4.5%) | 41 (18.1%) |
| 65 to 69 Years | 41 (10.9%) | 10 (4.4%) |
| 70 to 74 Years | 37 (9.9%) | 28 (12.3%) |
| 75 to 79 Years | 13 (3.5%) | 9 (4.0%) |
| 80 to 84 Years | 12 (3.2%) | 10 (4.4%) |
| 85 Years and over | 0 (0.0%) | 7 (3.1%) |
| Total | 375 (100.0%) | 227 (100.0%) |
Families and Households in Lake Winola
Median Family Size in Lake Winola
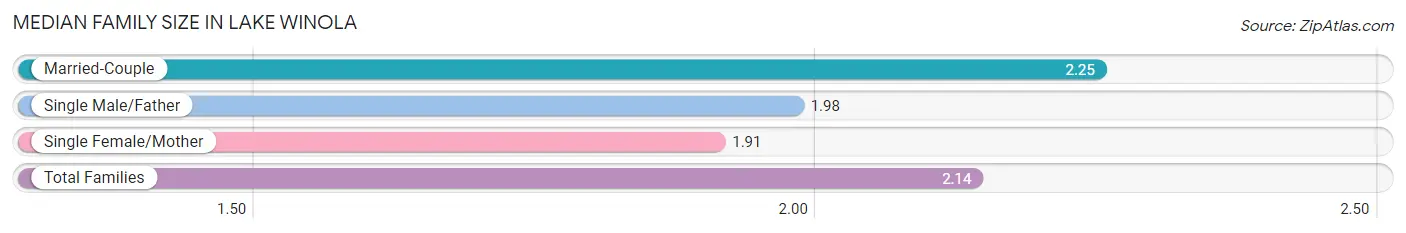
The median family size in Lake Winola is 2.14 persons per family, with married-couple families (106 | 63.1%) accounting for the largest median family size of 2.25 persons per family. On the other hand, single female/mother families (22 | 13.1%) represent the smallest median family size with 1.91 persons per family.
| Family Type | # Families | Family Size |
| Married-Couple | 106 (63.1%) | 2.25 |
| Single Male/Father | 40 (23.8%) | 1.98 |
| Single Female/Mother | 22 (13.1%) | 1.91 |
| Total Families | 168 (100.0%) | 2.14 |
Median Household Size in Lake Winola
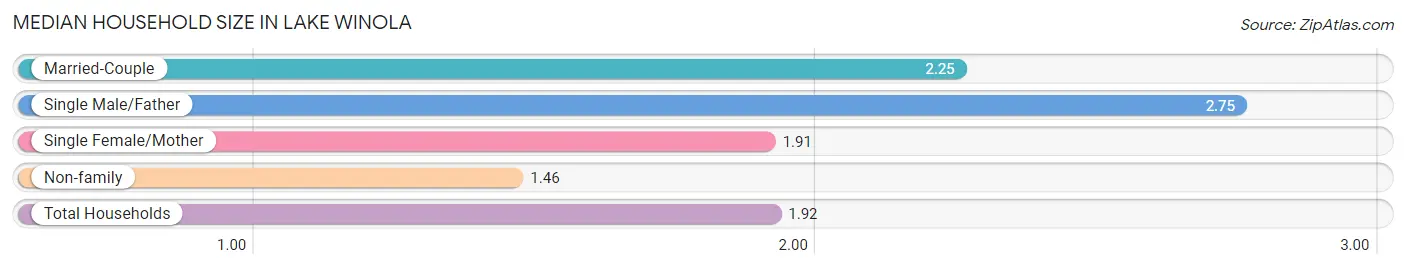
The median household size in Lake Winola is 1.92 persons per household, with single male/father households (40 | 12.8%) accounting for the largest median household size of 2.75 persons per household. non-family households (145 | 46.3%) represent the smallest median household size with 1.46 persons per household.
| Household Type | # Households | Household Size |
| Married-Couple | 106 (33.9%) | 2.25 |
| Single Male/Father | 40 (12.8%) | 2.75 |
| Single Female/Mother | 22 (7.0%) | 1.91 |
| Non-family | 145 (46.3%) | 1.46 |
| Total Households | 313 (100.0%) | 1.92 |
Household Size by Marriage Status in Lake Winola
Out of a total of 313 households in Lake Winola, 168 (53.7%) are family households, while 145 (46.3%) are nonfamily households. The most numerous type of family households are 2-person households, comprising 130, and the most common type of nonfamily households are 1-person households, comprising 99.
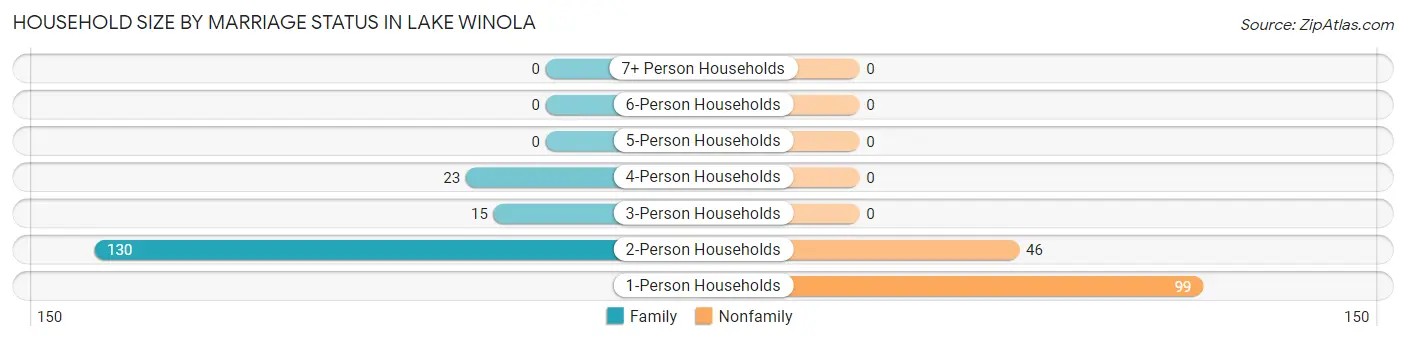
| Household Size | Family Households | Nonfamily Households |
| 1-Person Households | - | 99 (31.6%) |
| 2-Person Households | 130 (41.5%) | 46 (14.7%) |
| 3-Person Households | 15 (4.8%) | 0 (0.0%) |
| 4-Person Households | 23 (7.3%) | 0 (0.0%) |
| 5-Person Households | 0 (0.0%) | 0 (0.0%) |
| 6-Person Households | 0 (0.0%) | 0 (0.0%) |
| 7+ Person Households | 0 (0.0%) | 0 (0.0%) |
| Total | 168 (53.7%) | 145 (46.3%) |
Female Fertility in Lake Winola
Fertility by Age in Lake Winola
| Age Bracket | Women with Births | Births / 1,000 Women |
| 15 to 19 years | 0 (0.0%) | 0.0 |
| 20 to 34 years | 0 (0.0%) | 0.0 |
| 35 to 50 years | 0 (0.0%) | 0.0 |
| Total | 0 (0.0%) | 0.0 |
Fertility by Age by Marriage Status in Lake Winola
| Age Bracket | Married | Unmarried |
| 15 to 19 years | 0 (0.0%) | 0 (0.0%) |
| 20 to 34 years | 0 (0.0%) | 0 (0.0%) |
| 35 to 50 years | 0 (0.0%) | 0 (0.0%) |
| Total | 0 (0.0%) | 0 (0.0%) |
Fertility by Education in Lake Winola
| Educational Attainment | Women with Births | Births / 1,000 Women |
| Less than High School | 0 (0.0%) | 0.0 |
| High School Diploma | 0 (0.0%) | 0.0 |
| College or Associate's Degree | 0 (0.0%) | 0.0 |
| Bachelor's Degree | 0 (0.0%) | 0.0 |
| Graduate Degree | 0 (0.0%) | 0.0 |
| Total | 0 (0.0%) | 0.0 |
Fertility by Education by Marriage Status in Lake Winola
| Educational Attainment | Married | Unmarried |
| Less than High School | 0 (0.0%) | 0 (0.0%) |
| High School Diploma | 0 (0.0%) | 0 (0.0%) |
| College or Associate's Degree | 0 (0.0%) | 0 (0.0%) |
| Bachelor's Degree | 0 (0.0%) | 0 (0.0%) |
| Graduate Degree | 0 (0.0%) | 0 (0.0%) |
| Total | 0 (0.0%) | 0 (0.0%) |
Employment Characteristics in Lake Winola
Employment by Class of Employer in Lake Winola
Among the 292 employed individuals in Lake Winola, private company employees (238 | 81.5%), not-for-profit organizations (34 | 11.6%), and self-employed (not incorporated) (20 | 6.9%) make up the most common classes of employment.
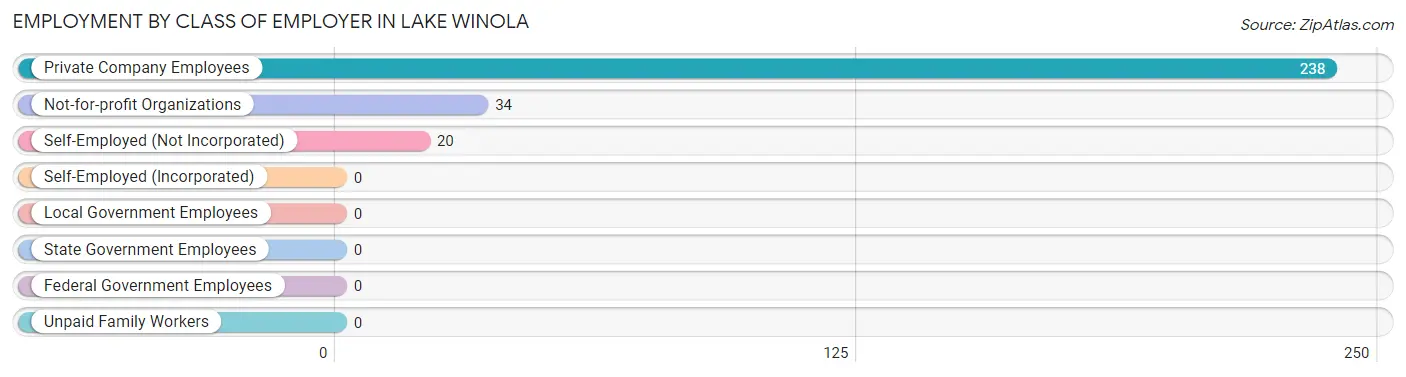
| Employer Class | # Employees | % Employees |
| Private Company Employees | 238 | 81.5% |
| Self-Employed (Incorporated) | 0 | 0.0% |
| Self-Employed (Not Incorporated) | 20 | 6.9% |
| Not-for-profit Organizations | 34 | 11.6% |
| Local Government Employees | 0 | 0.0% |
| State Government Employees | 0 | 0.0% |
| Federal Government Employees | 0 | 0.0% |
| Unpaid Family Workers | 0 | 0.0% |
| Total | 292 | 100.0% |
Employment Status by Age in Lake Winola
According to the labor force statistics for Lake Winola, out of the total population over 16 years of age (550), 56.5% or 311 individuals are in the labor force, with 6.1% or 19 of them unemployed. The age group with the highest labor force participation rate is 20 to 24 years, with 100.0% or 24 individuals in the labor force. Within the labor force, the 45 to 54 years age range has the highest percentage of unemployed individuals, with 18.8% or 16 of them being unemployed.
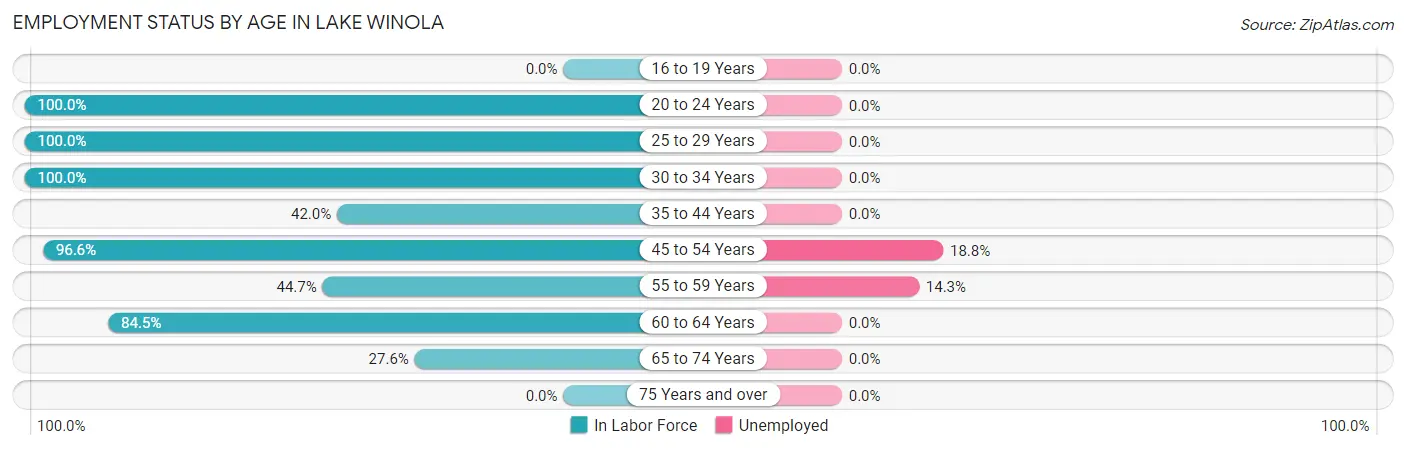
| Age Bracket | In Labor Force | Unemployed |
| 16 to 19 Years | 0 (0.0%) | 0 (0.0%) |
| 20 to 24 Years | 24 (100.0%) | 0 (0.0%) |
| 25 to 29 Years | 36 (100.0%) | 0 (0.0%) |
| 30 to 34 Years | 30 (100.0%) | 0 (0.0%) |
| 35 to 44 Years | 34 (42.0%) | 0 (0.0%) |
| 45 to 54 Years | 85 (96.6%) | 16 (18.8%) |
| 55 to 59 Years | 21 (44.7%) | 3 (14.3%) |
| 60 to 64 Years | 49 (84.5%) | 0 (0.0%) |
| 65 to 74 Years | 32 (27.6%) | 0 (0.0%) |
| 75 Years and over | 0 (0.0%) | 0 (0.0%) |
| Total | 311 (56.5%) | 19 (6.1%) |
Employment Status by Educational Attainment in Lake Winola
According to labor force statistics for Lake Winola, 75.0% of individuals (255) out of the total population between 25 and 64 years of age (340) are in the labor force, with 7.5% or 19 of them being unemployed. The group with the highest labor force participation rate are those with the educational attainment of bachelor's degree or higher, with 84.0% or 110 individuals in the labor force. Within the labor force, individuals with bachelor's degree or higher education have the highest percentage of unemployment, with 14.5% or 16 of them being unemployed.
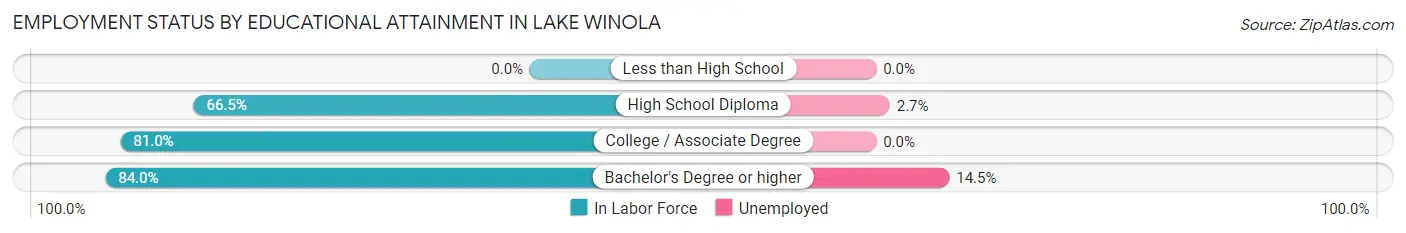
| Educational Attainment | In Labor Force | Unemployed |
| Less than High School | 0 (0.0%) | 0 (0.0%) |
| High School Diploma | 111 (66.5%) | 5 (2.7%) |
| College / Associate Degree | 34 (81.0%) | 0 (0.0%) |
| Bachelor's Degree or higher | 110 (84.0%) | 19 (14.5%) |
| Total | 255 (75.0%) | 26 (7.5%) |
Employment Occupations by Sex in Lake Winola
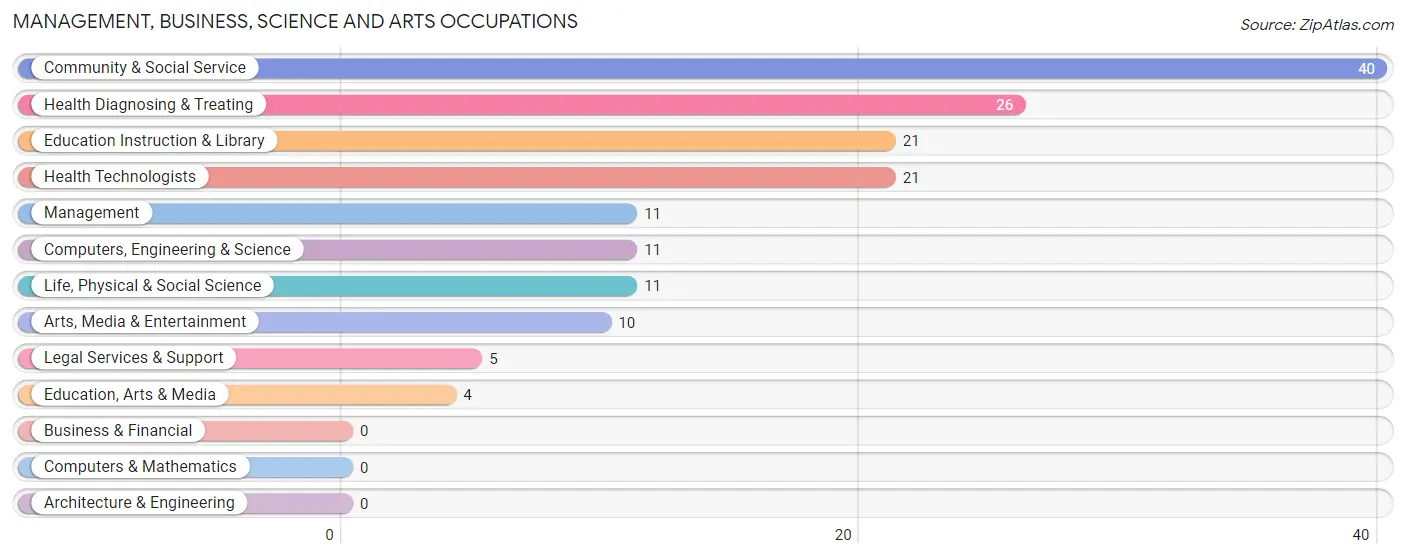
Management, Business, Science and Arts Occupations
The most common Management, Business, Science and Arts occupations in Lake Winola are Community & Social Service (40 | 13.7%), Health Diagnosing & Treating (26 | 8.9%), Education Instruction & Library (21 | 7.2%), Health Technologists (21 | 7.2%), and Management (11 | 3.8%).
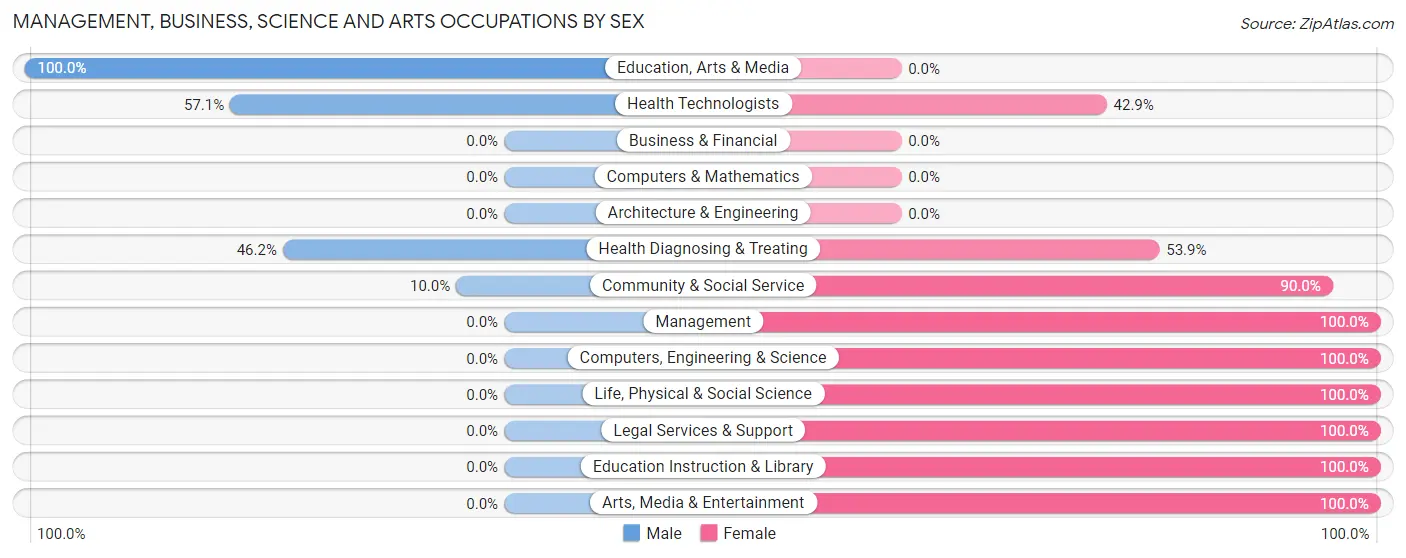
Management, Business, Science and Arts Occupations by Sex
Within the Management, Business, Science and Arts occupations in Lake Winola, the most male-oriented occupations are Education, Arts & Media (100.0%), Health Technologists (57.1%), and Health Diagnosing & Treating (46.2%), while the most female-oriented occupations are Management (100.0%), Computers, Engineering & Science (100.0%), and Life, Physical & Social Science (100.0%).
| Occupation | Male | Female |
| Management | 0 (0.0%) | 11 (100.0%) |
| Business & Financial | 0 (0.0%) | 0 (0.0%) |
| Computers, Engineering & Science | 0 (0.0%) | 11 (100.0%) |
| Computers & Mathematics | 0 (0.0%) | 0 (0.0%) |
| Architecture & Engineering | 0 (0.0%) | 0 (0.0%) |
| Life, Physical & Social Science | 0 (0.0%) | 11 (100.0%) |
| Community & Social Service | 4 (10.0%) | 36 (90.0%) |
| Education, Arts & Media | 4 (100.0%) | 0 (0.0%) |
| Legal Services & Support | 0 (0.0%) | 5 (100.0%) |
| Education Instruction & Library | 0 (0.0%) | 21 (100.0%) |
| Arts, Media & Entertainment | 0 (0.0%) | 10 (100.0%) |
| Health Diagnosing & Treating | 12 (46.2%) | 14 (53.8%) |
| Health Technologists | 12 (57.1%) | 9 (42.9%) |
| Total (Category) | 16 (18.2%) | 72 (81.8%) |
| Total (Overall) | 184 (63.0%) | 108 (37.0%) |
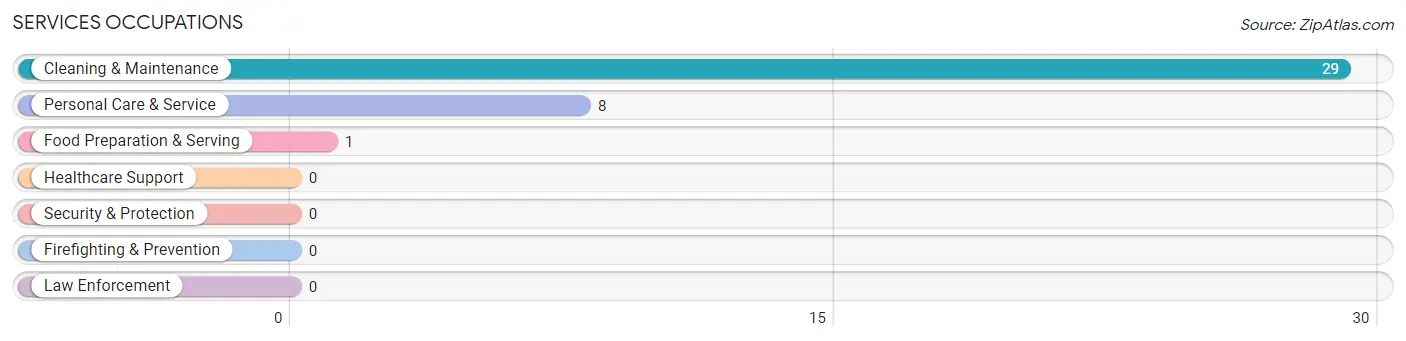
Services Occupations
The most common Services occupations in Lake Winola are Cleaning & Maintenance (29 | 9.9%), Personal Care & Service (8 | 2.7%), and Food Preparation & Serving (1 | 0.3%).
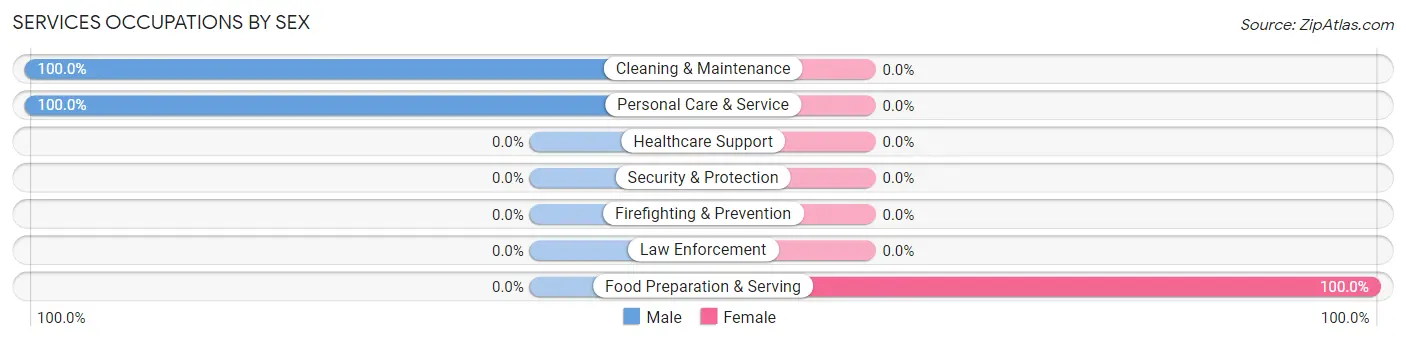
Services Occupations by Sex
| Occupation | Male | Female |
| Healthcare Support | 0 (0.0%) | 0 (0.0%) |
| Security & Protection | 0 (0.0%) | 0 (0.0%) |
| Firefighting & Prevention | 0 (0.0%) | 0 (0.0%) |
| Law Enforcement | 0 (0.0%) | 0 (0.0%) |
| Food Preparation & Serving | 0 (0.0%) | 1 (100.0%) |
| Cleaning & Maintenance | 29 (100.0%) | 0 (0.0%) |
| Personal Care & Service | 8 (100.0%) | 0 (0.0%) |
| Total (Category) | 37 (97.4%) | 1 (2.6%) |
| Total (Overall) | 184 (63.0%) | 108 (37.0%) |
Sales and Office Occupations
The most common Sales and Office occupations in Lake Winola are Office & Administration (19 | 6.5%), and Sales & Related (4 | 1.4%).
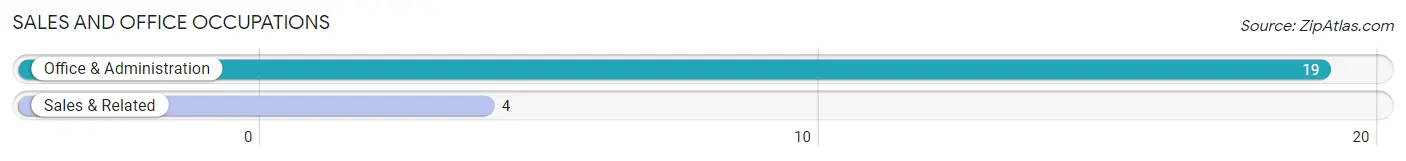
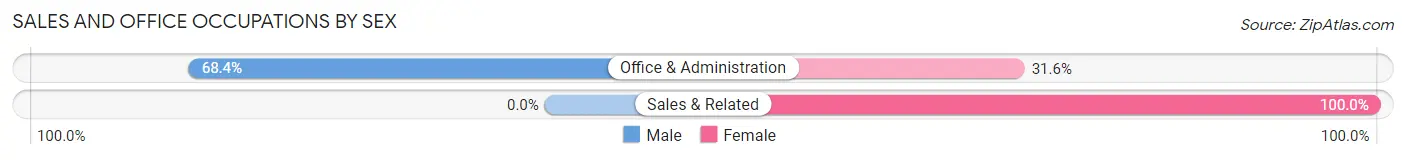
Sales and Office Occupations by Sex
| Occupation | Male | Female |
| Sales & Related | 0 (0.0%) | 4 (100.0%) |
| Office & Administration | 13 (68.4%) | 6 (31.6%) |
| Total (Category) | 13 (56.5%) | 10 (43.5%) |
| Total (Overall) | 184 (63.0%) | 108 (37.0%) |
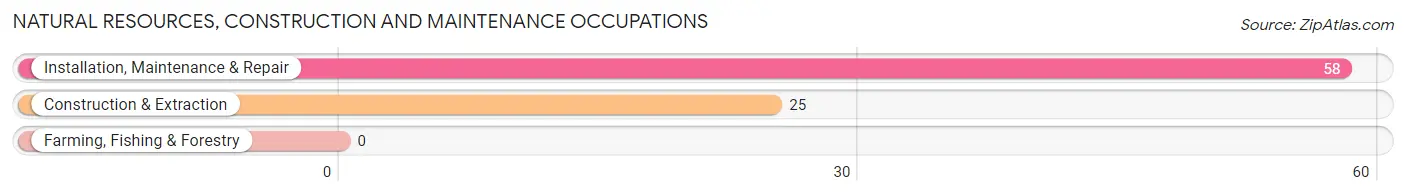
Natural Resources, Construction and Maintenance Occupations
The most common Natural Resources, Construction and Maintenance occupations in Lake Winola are Installation, Maintenance & Repair (58 | 19.9%), and Construction & Extraction (25 | 8.6%).
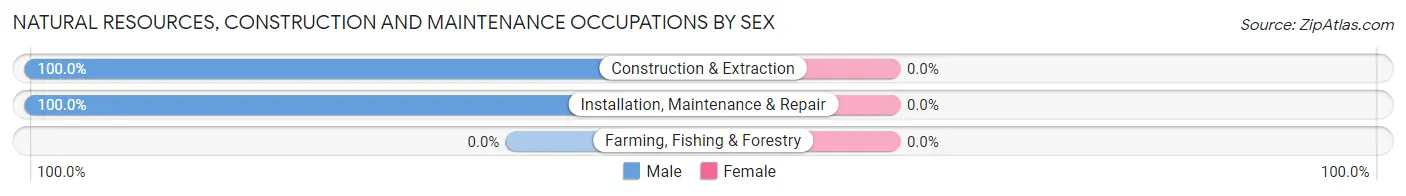
Natural Resources, Construction and Maintenance Occupations by Sex
| Occupation | Male | Female |
| Farming, Fishing & Forestry | 0 (0.0%) | 0 (0.0%) |
| Construction & Extraction | 25 (100.0%) | 0 (0.0%) |
| Installation, Maintenance & Repair | 58 (100.0%) | 0 (0.0%) |
| Total (Category) | 83 (100.0%) | 0 (0.0%) |
| Total (Overall) | 184 (63.0%) | 108 (37.0%) |
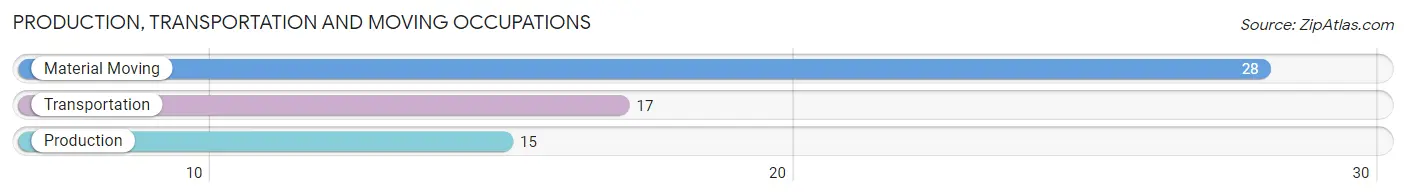
Production, Transportation and Moving Occupations
The most common Production, Transportation and Moving occupations in Lake Winola are Material Moving (28 | 9.6%), Transportation (17 | 5.8%), and Production (15 | 5.1%).
Production, Transportation and Moving Occupations by Sex
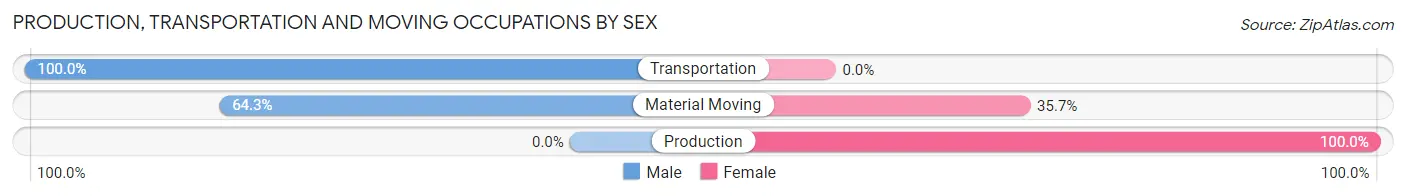
| Occupation | Male | Female |
| Production | 0 (0.0%) | 15 (100.0%) |
| Transportation | 17 (100.0%) | 0 (0.0%) |
| Material Moving | 18 (64.3%) | 10 (35.7%) |
| Total (Category) | 35 (58.3%) | 25 (41.7%) |
| Total (Overall) | 184 (63.0%) | 108 (37.0%) |
Employment Industries by Sex in Lake Winola
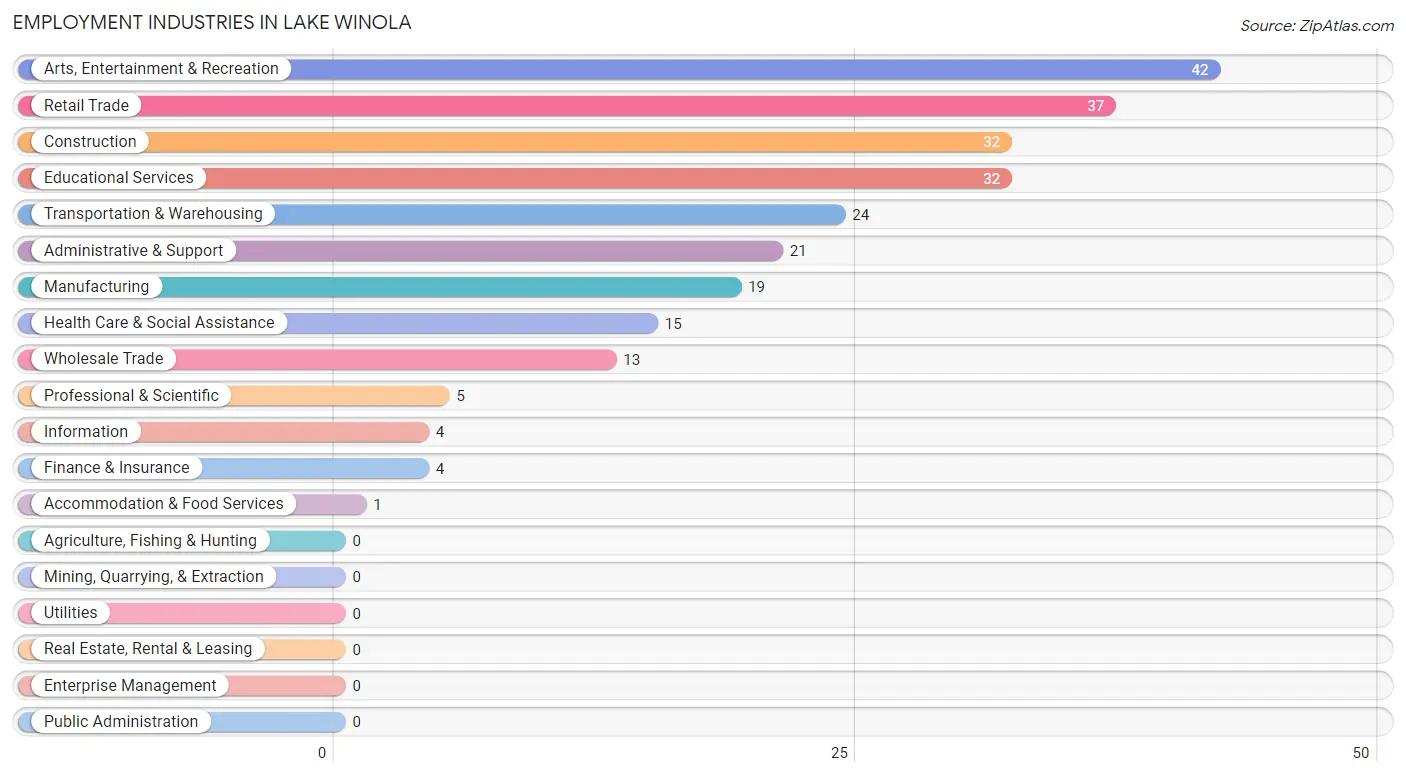
Employment Industries in Lake Winola
The major employment industries in Lake Winola include Arts, Entertainment & Recreation (42 | 14.4%), Retail Trade (37 | 12.7%), Construction (32 | 11.0%), Educational Services (32 | 11.0%), and Transportation & Warehousing (24 | 8.2%).
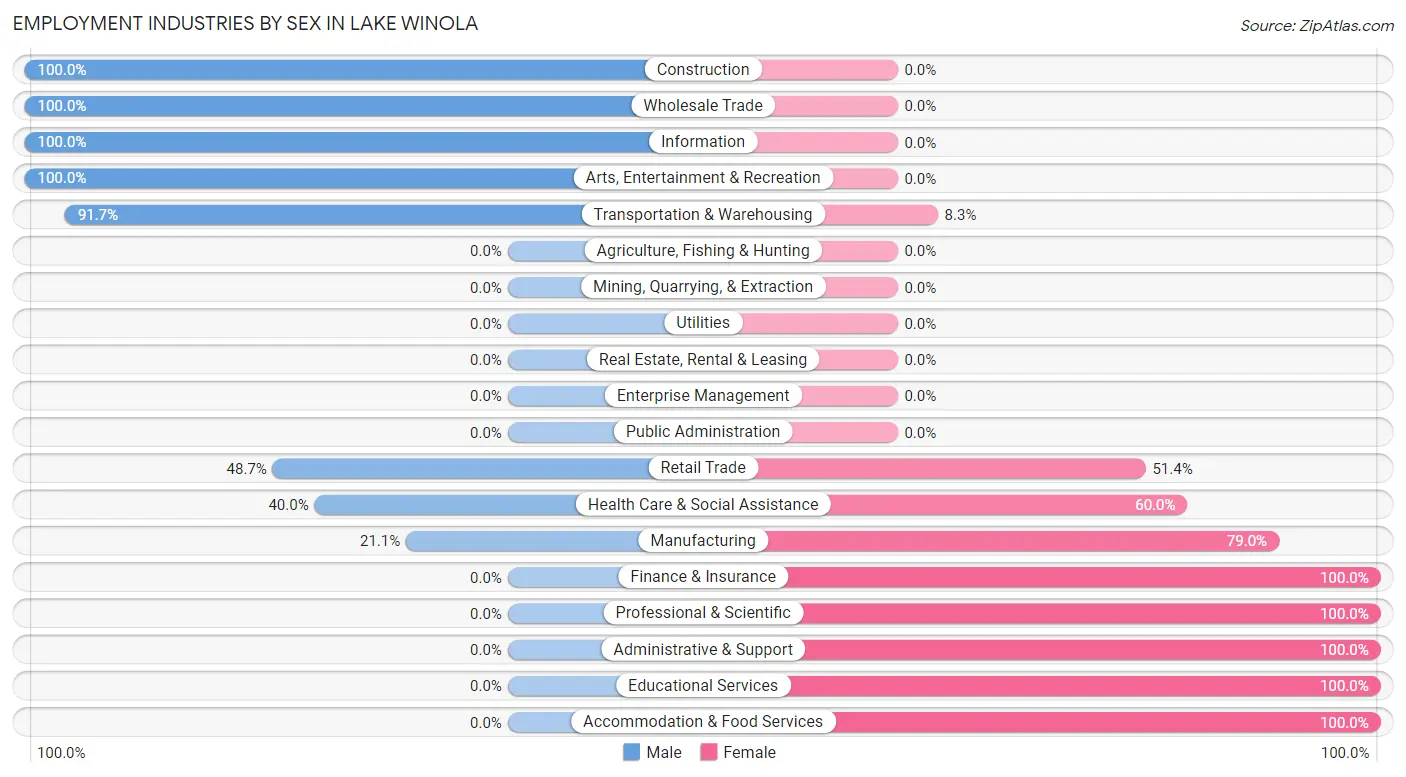
Employment Industries by Sex in Lake Winola
The Lake Winola industries that see more men than women are Construction (100.0%), Wholesale Trade (100.0%), and Information (100.0%), whereas the industries that tend to have a higher number of women are Finance & Insurance (100.0%), Professional & Scientific (100.0%), and Administrative & Support (100.0%).
| Industry | Male | Female |
| Agriculture, Fishing & Hunting | 0 (0.0%) | 0 (0.0%) |
| Mining, Quarrying, & Extraction | 0 (0.0%) | 0 (0.0%) |
| Construction | 32 (100.0%) | 0 (0.0%) |
| Manufacturing | 4 (21.0%) | 15 (78.9%) |
| Wholesale Trade | 13 (100.0%) | 0 (0.0%) |
| Retail Trade | 18 (48.6%) | 19 (51.3%) |
| Transportation & Warehousing | 22 (91.7%) | 2 (8.3%) |
| Utilities | 0 (0.0%) | 0 (0.0%) |
| Information | 4 (100.0%) | 0 (0.0%) |
| Finance & Insurance | 0 (0.0%) | 4 (100.0%) |
| Real Estate, Rental & Leasing | 0 (0.0%) | 0 (0.0%) |
| Professional & Scientific | 0 (0.0%) | 5 (100.0%) |
| Enterprise Management | 0 (0.0%) | 0 (0.0%) |
| Administrative & Support | 0 (0.0%) | 21 (100.0%) |
| Educational Services | 0 (0.0%) | 32 (100.0%) |
| Health Care & Social Assistance | 6 (40.0%) | 9 (60.0%) |
| Arts, Entertainment & Recreation | 42 (100.0%) | 0 (0.0%) |
| Accommodation & Food Services | 0 (0.0%) | 1 (100.0%) |
| Public Administration | 0 (0.0%) | 0 (0.0%) |
| Total | 184 (63.0%) | 108 (37.0%) |
Education in Lake Winola
School Enrollment in Lake Winola
The most common levels of schooling among the 102 students in Lake Winola are high school (42 | 41.2%), graduate / professional (20 | 19.6%), and middle school (16 | 15.7%).
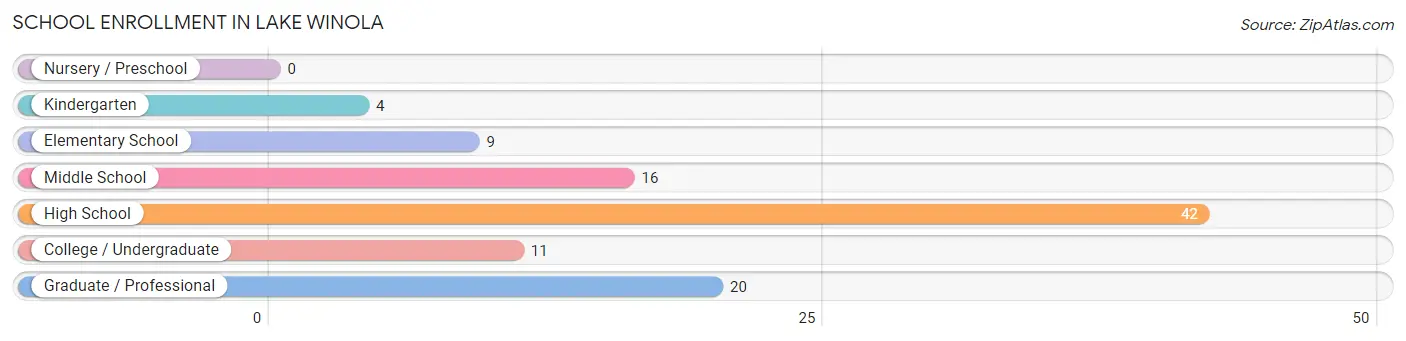
| School Level | # Students | % Students |
| Nursery / Preschool | 0 | 0.0% |
| Kindergarten | 4 | 3.9% |
| Elementary School | 9 | 8.8% |
| Middle School | 16 | 15.7% |
| High School | 42 | 41.2% |
| College / Undergraduate | 11 | 10.8% |
| Graduate / Professional | 20 | 19.6% |
| Total | 102 | 100.0% |
School Enrollment by Age by Funding Source in Lake Winola
Out of a total of 102 students who are enrolled in schools in Lake Winola, 28 (27.5%) attend a private institution, while the remaining 74 (72.5%) are enrolled in public schools. The age group of 20 to 24 year olds has the highest likelihood of being enrolled in private schools, with 11 (100.0% in the age bracket) enrolled. Conversely, the age group of 5 to 9 year old has the lowest likelihood of being enrolled in a private school, with 13 (100.0% in the age bracket) attending a public institution.
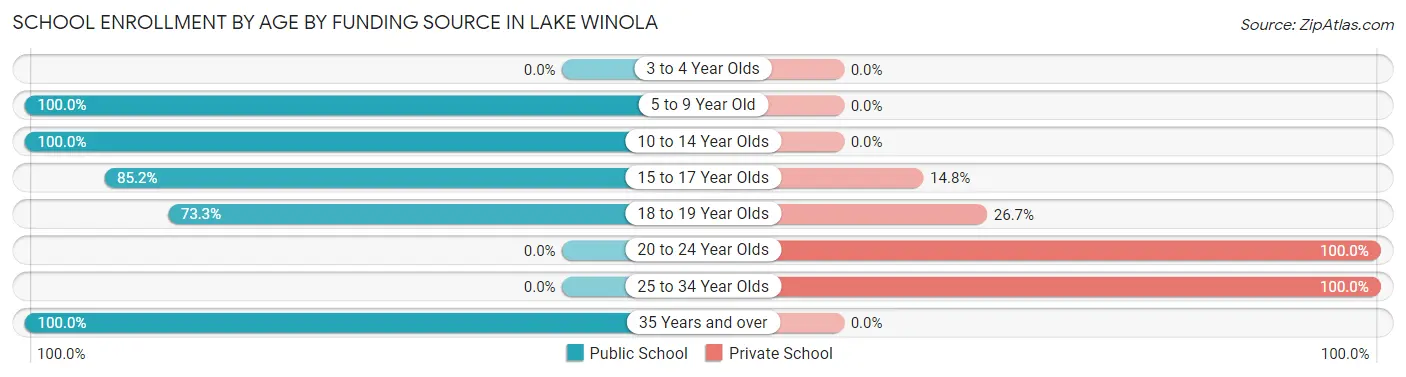
| Age Bracket | Public School | Private School |
| 3 to 4 Year Olds | 0 (0.0%) | 0 (0.0%) |
| 5 to 9 Year Old | 13 (100.0%) | 0 (0.0%) |
| 10 to 14 Year Olds | 16 (100.0%) | 0 (0.0%) |
| 15 to 17 Year Olds | 23 (85.2%) | 4 (14.8%) |
| 18 to 19 Year Olds | 11 (73.3%) | 4 (26.7%) |
| 20 to 24 Year Olds | 0 (0.0%) | 11 (100.0%) |
| 25 to 34 Year Olds | 0 (0.0%) | 9 (100.0%) |
| 35 Years and over | 11 (100.0%) | 0 (0.0%) |
| Total | 74 (72.5%) | 28 (27.5%) |
Educational Attainment by Field of Study in Lake Winola
Science & technology (32 | 20.1%), business (31 | 19.5%), education (28 | 17.6%), visual & performing arts (18 | 11.3%), and literature & languages (14 | 8.8%) are the most common fields of study among 159 individuals in Lake Winola who have obtained a bachelor's degree or higher.
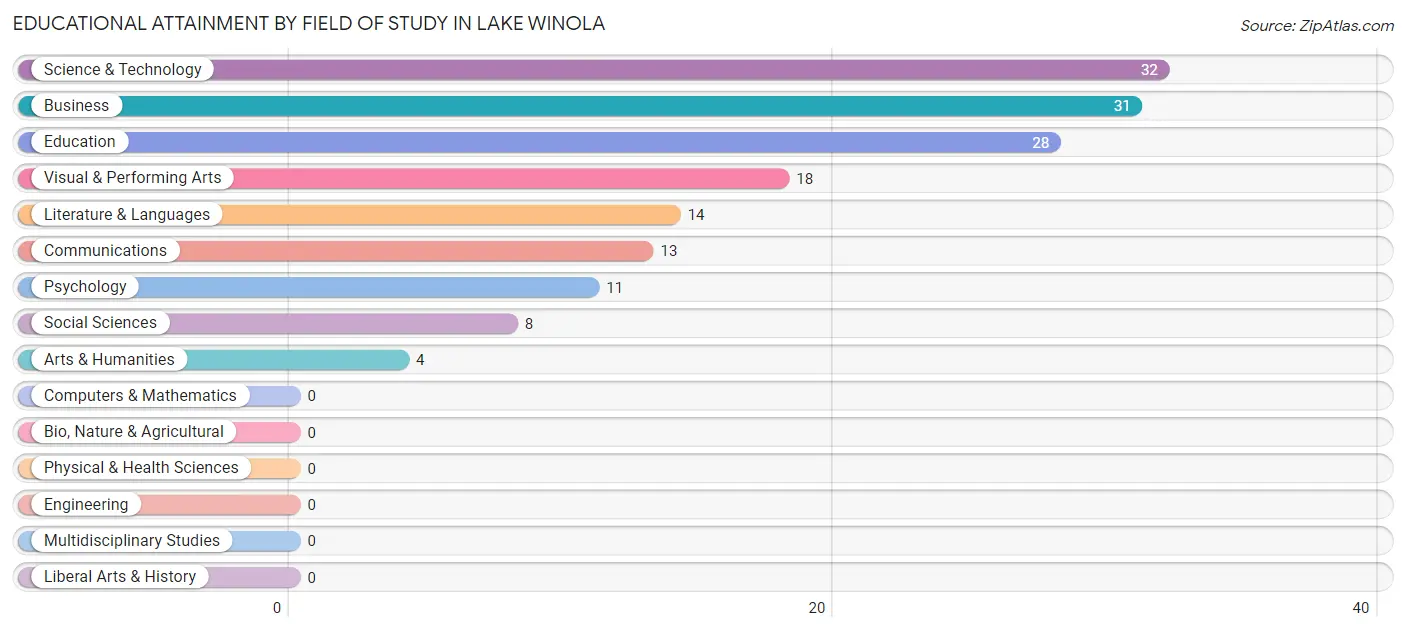
| Field of Study | # Graduates | % Graduates |
| Computers & Mathematics | 0 | 0.0% |
| Bio, Nature & Agricultural | 0 | 0.0% |
| Physical & Health Sciences | 0 | 0.0% |
| Psychology | 11 | 6.9% |
| Social Sciences | 8 | 5.0% |
| Engineering | 0 | 0.0% |
| Multidisciplinary Studies | 0 | 0.0% |
| Science & Technology | 32 | 20.1% |
| Business | 31 | 19.5% |
| Education | 28 | 17.6% |
| Literature & Languages | 14 | 8.8% |
| Liberal Arts & History | 0 | 0.0% |
| Visual & Performing Arts | 18 | 11.3% |
| Communications | 13 | 8.2% |
| Arts & Humanities | 4 | 2.5% |
| Total | 159 | 100.0% |
Transportation & Commute in Lake Winola
Vehicle Availability by Sex in Lake Winola
The most prevalent vehicle ownership categories in Lake Winola are males with 2 vehicles (124, accounting for 67.4%) and females with 2 vehicles (61, making up 114.8%).
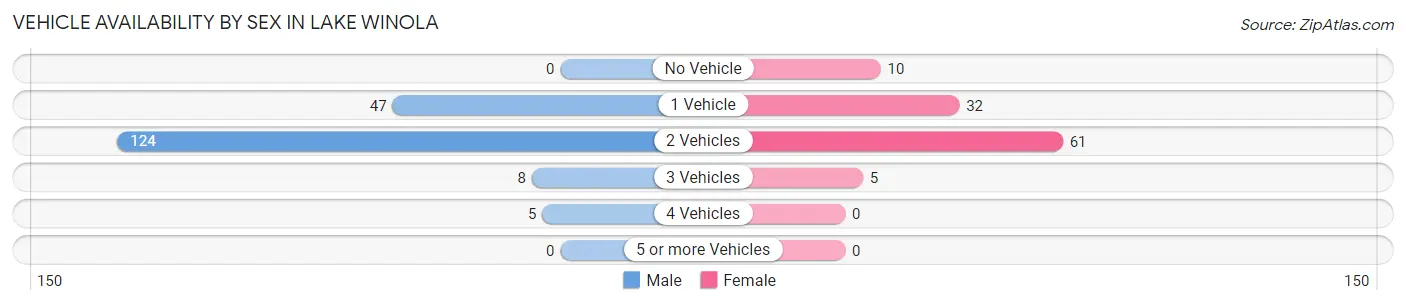
| Vehicles Available | Male | Female |
| No Vehicle | 0 (0.0%) | 10 (9.3%) |
| 1 Vehicle | 47 (25.5%) | 32 (29.6%) |
| 2 Vehicles | 124 (67.4%) | 61 (56.5%) |
| 3 Vehicles | 8 (4.3%) | 5 (4.6%) |
| 4 Vehicles | 5 (2.7%) | 0 (0.0%) |
| 5 or more Vehicles | 0 (0.0%) | 0 (0.0%) |
| Total | 184 (100.0%) | 108 (100.0%) |
Commute Time in Lake Winola
The most frequently occuring commute durations in Lake Winola are 25 to 29 minutes (80 commuters, 27.9%), 15 to 19 minutes (63 commuters, 22.0%), and 40 to 44 minutes (34 commuters, 11.8%).
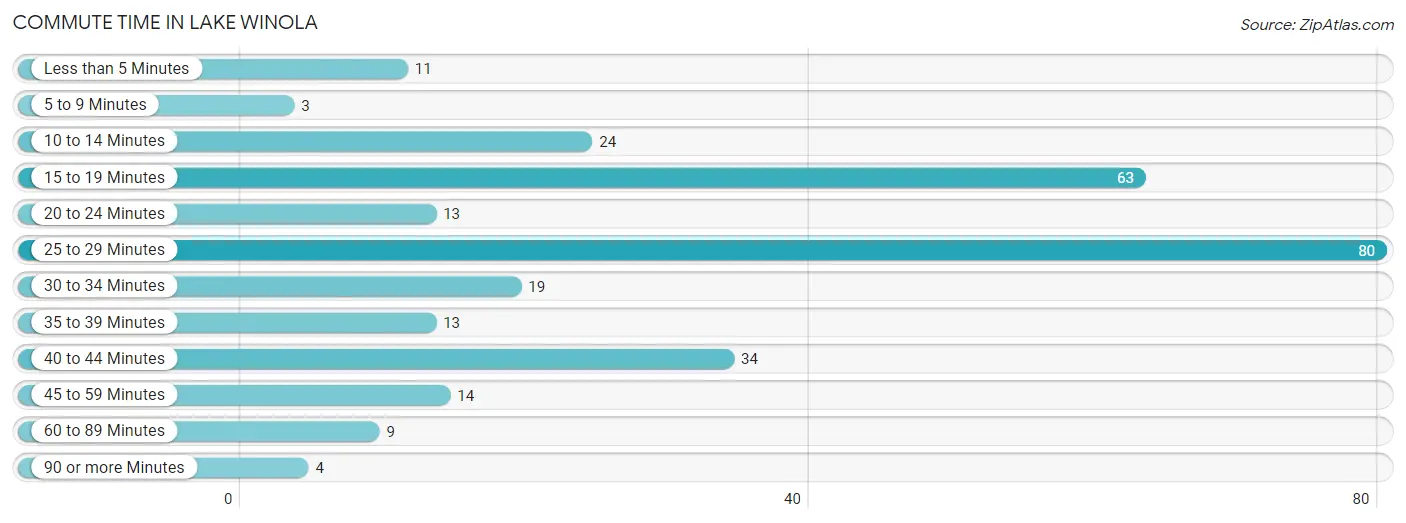
| Commute Time | # Commuters | % Commuters |
| Less than 5 Minutes | 11 | 3.8% |
| 5 to 9 Minutes | 3 | 1.1% |
| 10 to 14 Minutes | 24 | 8.4% |
| 15 to 19 Minutes | 63 | 22.0% |
| 20 to 24 Minutes | 13 | 4.5% |
| 25 to 29 Minutes | 80 | 27.9% |
| 30 to 34 Minutes | 19 | 6.6% |
| 35 to 39 Minutes | 13 | 4.5% |
| 40 to 44 Minutes | 34 | 11.8% |
| 45 to 59 Minutes | 14 | 4.9% |
| 60 to 89 Minutes | 9 | 3.1% |
| 90 or more Minutes | 4 | 1.4% |
Commute Time by Sex in Lake Winola
The most common commute times in Lake Winola are 25 to 29 minutes (60 commuters, 32.6%) for males and 15 to 19 minutes (37 commuters, 35.9%) for females.
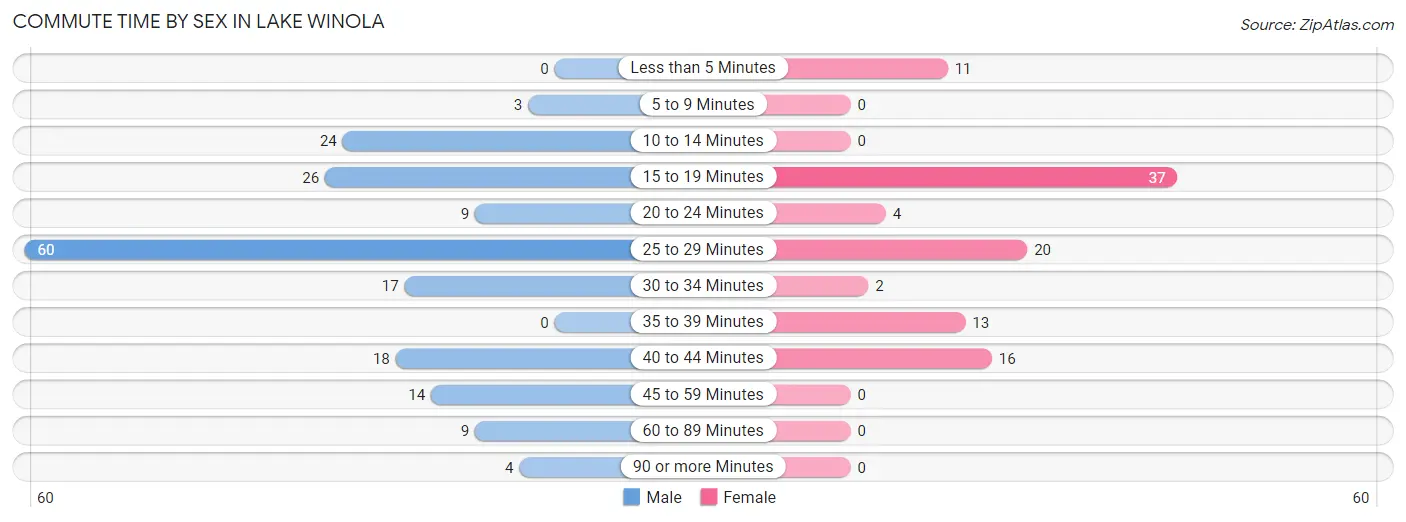
| Commute Time | Male | Female |
| Less than 5 Minutes | 0 (0.0%) | 11 (10.7%) |
| 5 to 9 Minutes | 3 (1.6%) | 0 (0.0%) |
| 10 to 14 Minutes | 24 (13.0%) | 0 (0.0%) |
| 15 to 19 Minutes | 26 (14.1%) | 37 (35.9%) |
| 20 to 24 Minutes | 9 (4.9%) | 4 (3.9%) |
| 25 to 29 Minutes | 60 (32.6%) | 20 (19.4%) |
| 30 to 34 Minutes | 17 (9.2%) | 2 (1.9%) |
| 35 to 39 Minutes | 0 (0.0%) | 13 (12.6%) |
| 40 to 44 Minutes | 18 (9.8%) | 16 (15.5%) |
| 45 to 59 Minutes | 14 (7.6%) | 0 (0.0%) |
| 60 to 89 Minutes | 9 (4.9%) | 0 (0.0%) |
| 90 or more Minutes | 4 (2.2%) | 0 (0.0%) |
Time of Departure to Work by Sex in Lake Winola
The most frequent times of departure to work in Lake Winola are 6:00 AM to 6:29 AM (56, 30.4%) for males and 6:00 AM to 6:29 AM (30, 29.1%) for females.
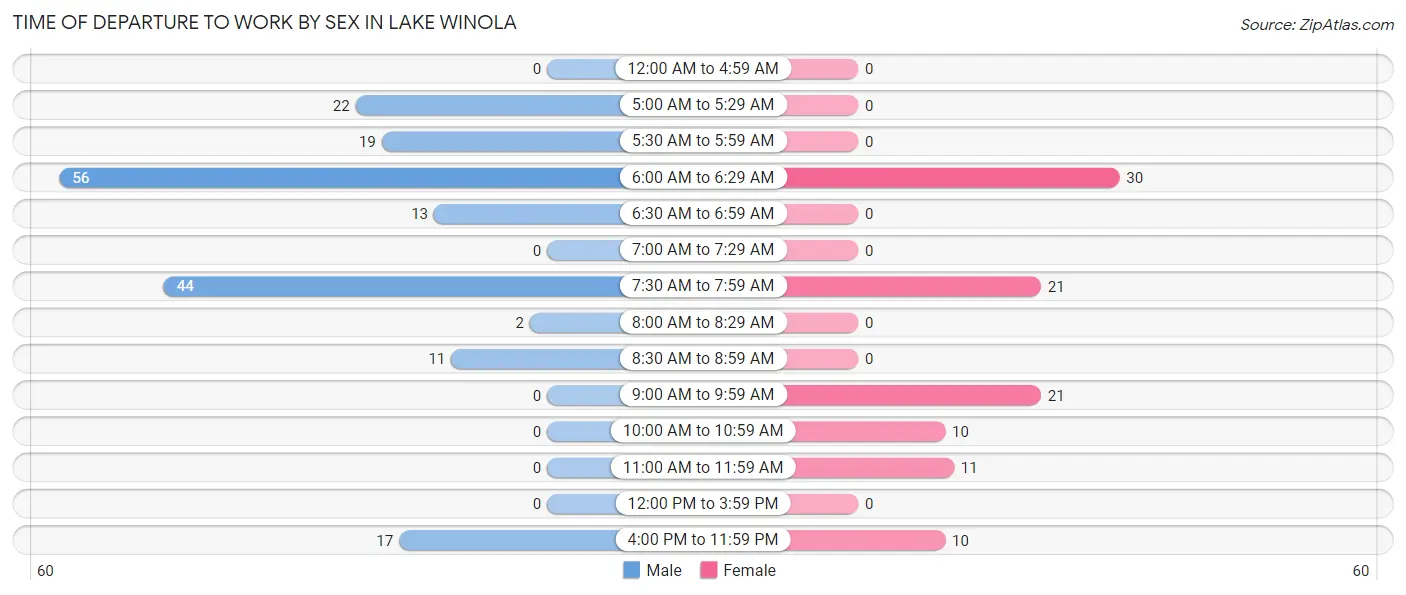
| Time of Departure | Male | Female |
| 12:00 AM to 4:59 AM | 0 (0.0%) | 0 (0.0%) |
| 5:00 AM to 5:29 AM | 22 (12.0%) | 0 (0.0%) |
| 5:30 AM to 5:59 AM | 19 (10.3%) | 0 (0.0%) |
| 6:00 AM to 6:29 AM | 56 (30.4%) | 30 (29.1%) |
| 6:30 AM to 6:59 AM | 13 (7.1%) | 0 (0.0%) |
| 7:00 AM to 7:29 AM | 0 (0.0%) | 0 (0.0%) |
| 7:30 AM to 7:59 AM | 44 (23.9%) | 21 (20.4%) |
| 8:00 AM to 8:29 AM | 2 (1.1%) | 0 (0.0%) |
| 8:30 AM to 8:59 AM | 11 (6.0%) | 0 (0.0%) |
| 9:00 AM to 9:59 AM | 0 (0.0%) | 21 (20.4%) |
| 10:00 AM to 10:59 AM | 0 (0.0%) | 10 (9.7%) |
| 11:00 AM to 11:59 AM | 0 (0.0%) | 11 (10.7%) |
| 12:00 PM to 3:59 PM | 0 (0.0%) | 0 (0.0%) |
| 4:00 PM to 11:59 PM | 17 (9.2%) | 10 (9.7%) |
| Total | 184 (100.0%) | 103 (100.0%) |
Housing Occupancy in Lake Winola
Occupancy by Ownership in Lake Winola
Of the total 313 dwellings in Lake Winola, owner-occupied units account for 214 (68.4%), while renter-occupied units make up 99 (31.6%).
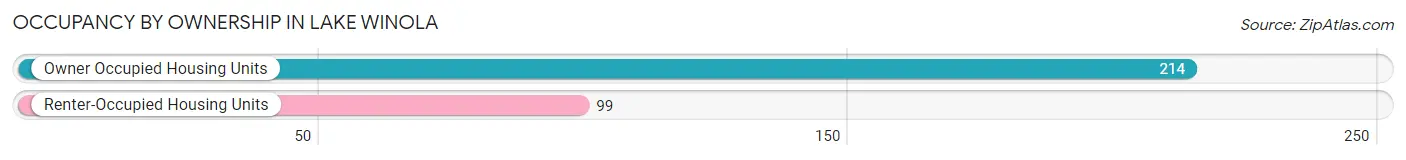
| Occupancy | # Housing Units | % Housing Units |
| Owner Occupied Housing Units | 214 | 68.4% |
| Renter-Occupied Housing Units | 99 | 31.6% |
| Total Occupied Housing Units | 313 | 100.0% |
Occupancy by Household Size in Lake Winola
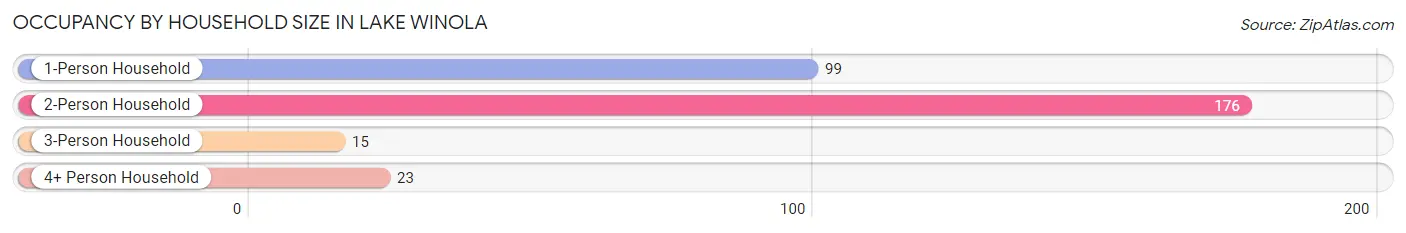
| Household Size | # Housing Units | % Housing Units |
| 1-Person Household | 99 | 31.6% |
| 2-Person Household | 176 | 56.2% |
| 3-Person Household | 15 | 4.8% |
| 4+ Person Household | 23 | 7.3% |
| Total Housing Units | 313 | 100.0% |
Occupancy by Ownership by Household Size in Lake Winola
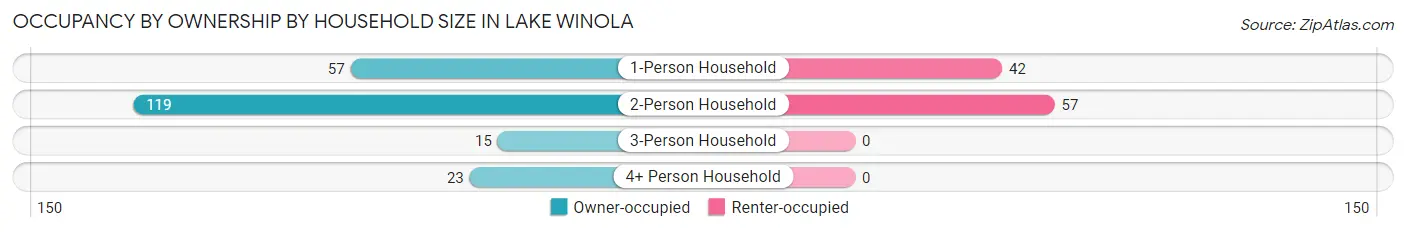
| Household Size | Owner-occupied | Renter-occupied |
| 1-Person Household | 57 (57.6%) | 42 (42.4%) |
| 2-Person Household | 119 (67.6%) | 57 (32.4%) |
| 3-Person Household | 15 (100.0%) | 0 (0.0%) |
| 4+ Person Household | 23 (100.0%) | 0 (0.0%) |
| Total Housing Units | 214 (68.4%) | 99 (31.6%) |
Occupancy by Educational Attainment in Lake Winola
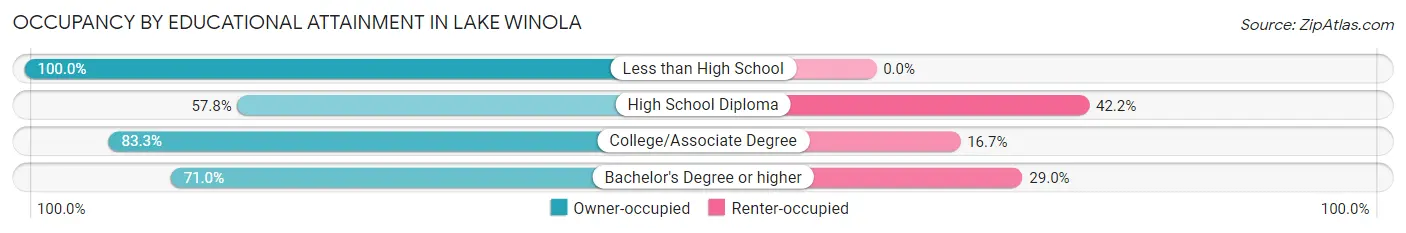
| Household Size | Owner-occupied | Renter-occupied |
| Less than High School | 6 (100.0%) | 0 (0.0%) |
| High School Diploma | 89 (57.8%) | 65 (42.2%) |
| College/Associate Degree | 70 (83.3%) | 14 (16.7%) |
| Bachelor's Degree or higher | 49 (71.0%) | 20 (29.0%) |
Occupancy by Age of Householder in Lake Winola
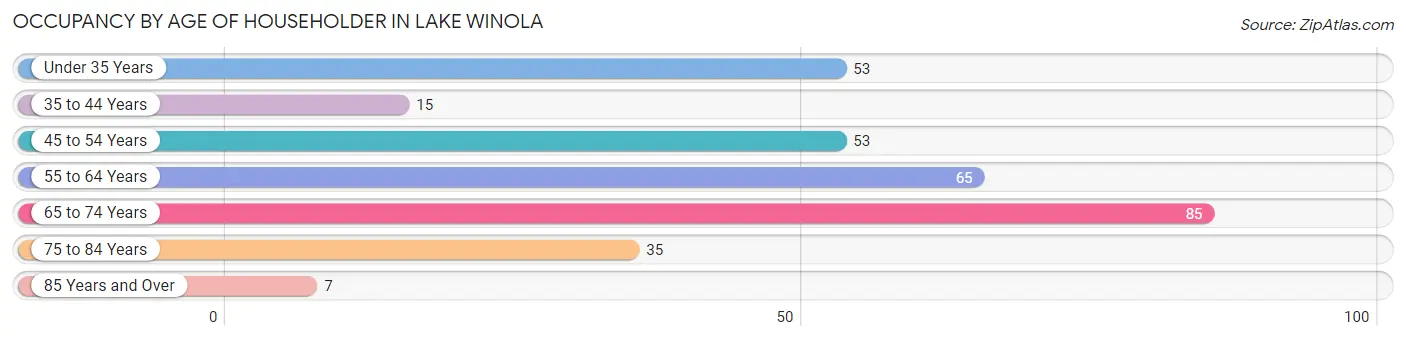
| Age Bracket | # Households | % Households |
| Under 35 Years | 53 | 16.9% |
| 35 to 44 Years | 15 | 4.8% |
| 45 to 54 Years | 53 | 16.9% |
| 55 to 64 Years | 65 | 20.8% |
| 65 to 74 Years | 85 | 27.2% |
| 75 to 84 Years | 35 | 11.2% |
| 85 Years and Over | 7 | 2.2% |
| Total | 313 | 100.0% |
Housing Finances in Lake Winola
Median Income by Occupancy in Lake Winola
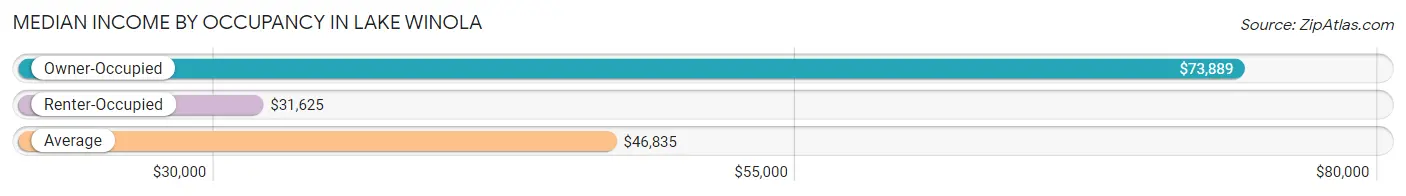
| Occupancy Type | # Households | Median Income |
| Owner-Occupied | 214 (68.4%) | $73,889 |
| Renter-Occupied | 99 (31.6%) | $31,625 |
| Average | 313 (100.0%) | $46,835 |
Occupancy by Householder Income Bracket in Lake Winola
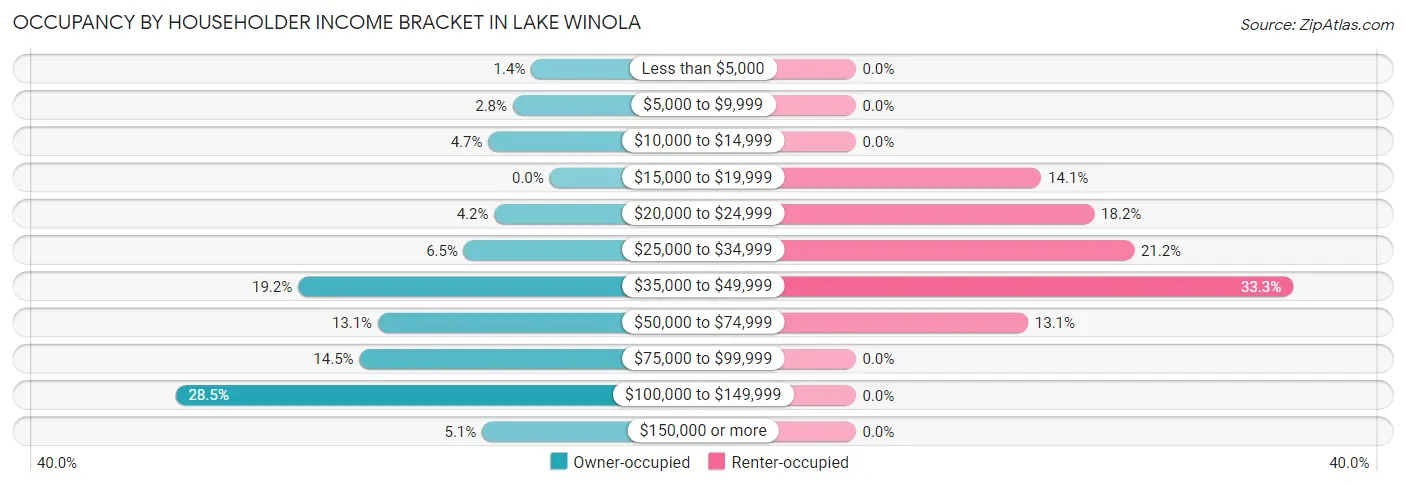
| Income Bracket | Owner-occupied | Renter-occupied |
| Less than $5,000 | 3 (1.4%) | 0 (0.0%) |
| $5,000 to $9,999 | 6 (2.8%) | 0 (0.0%) |
| $10,000 to $14,999 | 10 (4.7%) | 0 (0.0%) |
| $15,000 to $19,999 | 0 (0.0%) | 14 (14.1%) |
| $20,000 to $24,999 | 9 (4.2%) | 18 (18.2%) |
| $25,000 to $34,999 | 14 (6.5%) | 21 (21.2%) |
| $35,000 to $49,999 | 41 (19.2%) | 33 (33.3%) |
| $50,000 to $74,999 | 28 (13.1%) | 13 (13.1%) |
| $75,000 to $99,999 | 31 (14.5%) | 0 (0.0%) |
| $100,000 to $149,999 | 61 (28.5%) | 0 (0.0%) |
| $150,000 or more | 11 (5.1%) | 0 (0.0%) |
| Total | 214 (100.0%) | 99 (100.0%) |
Monthly Housing Cost Tiers in Lake Winola
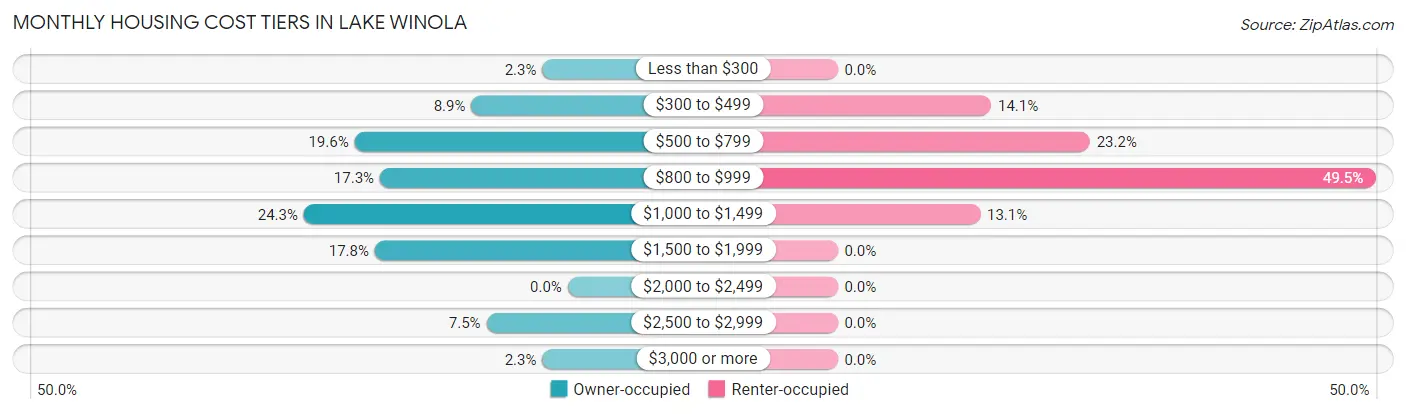
| Monthly Cost | Owner-occupied | Renter-occupied |
| Less than $300 | 5 (2.3%) | 0 (0.0%) |
| $300 to $499 | 19 (8.9%) | 14 (14.1%) |
| $500 to $799 | 42 (19.6%) | 23 (23.2%) |
| $800 to $999 | 37 (17.3%) | 49 (49.5%) |
| $1,000 to $1,499 | 52 (24.3%) | 13 (13.1%) |
| $1,500 to $1,999 | 38 (17.8%) | 0 (0.0%) |
| $2,000 to $2,499 | 0 (0.0%) | 0 (0.0%) |
| $2,500 to $2,999 | 16 (7.5%) | 0 (0.0%) |
| $3,000 or more | 5 (2.3%) | 0 (0.0%) |
| Total | 214 (100.0%) | 99 (100.0%) |
Physical Housing Characteristics in Lake Winola
Housing Structures in Lake Winola
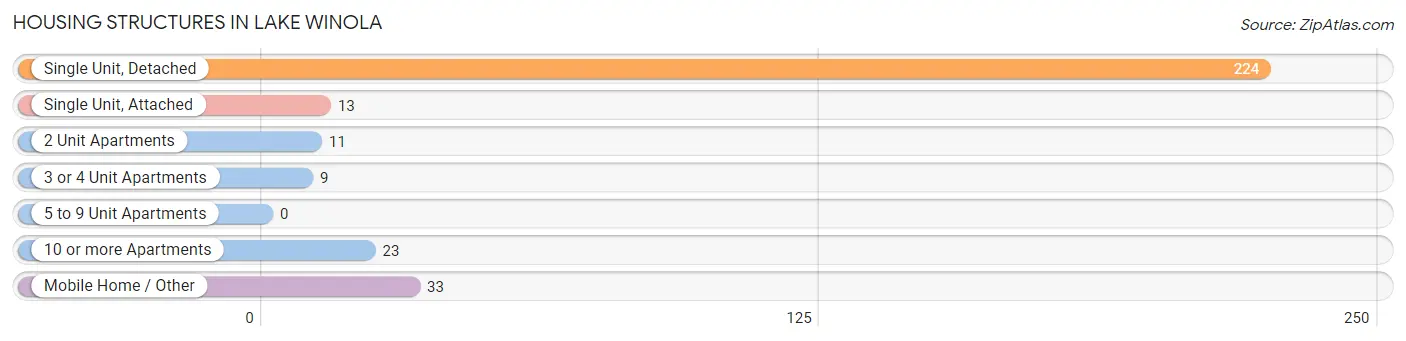
| Structure Type | # Housing Units | % Housing Units |
| Single Unit, Detached | 224 | 71.6% |
| Single Unit, Attached | 13 | 4.2% |
| 2 Unit Apartments | 11 | 3.5% |
| 3 or 4 Unit Apartments | 9 | 2.9% |
| 5 to 9 Unit Apartments | 0 | 0.0% |
| 10 or more Apartments | 23 | 7.3% |
| Mobile Home / Other | 33 | 10.5% |
| Total | 313 | 100.0% |
Housing Structures by Occupancy in Lake Winola
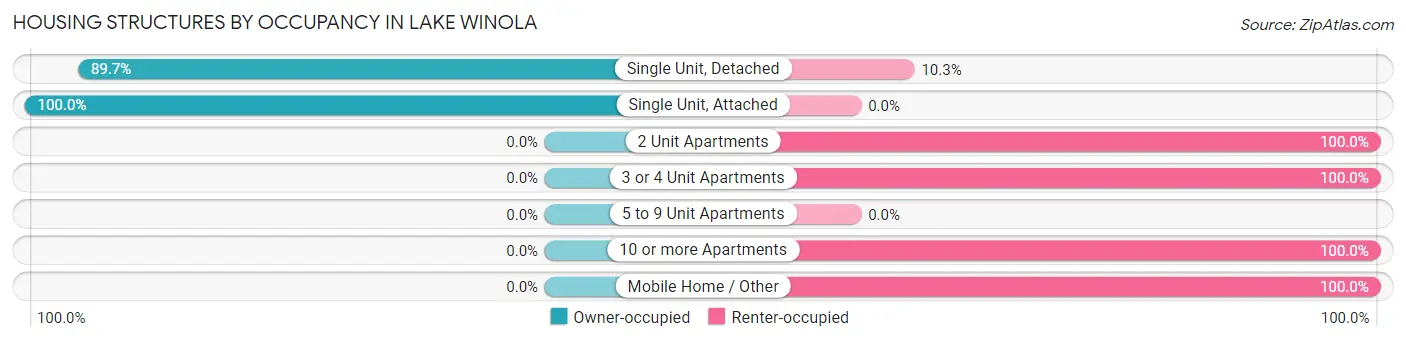
| Structure Type | Owner-occupied | Renter-occupied |
| Single Unit, Detached | 201 (89.7%) | 23 (10.3%) |
| Single Unit, Attached | 13 (100.0%) | 0 (0.0%) |
| 2 Unit Apartments | 0 (0.0%) | 11 (100.0%) |
| 3 or 4 Unit Apartments | 0 (0.0%) | 9 (100.0%) |
| 5 to 9 Unit Apartments | 0 (0.0%) | 0 (0.0%) |
| 10 or more Apartments | 0 (0.0%) | 23 (100.0%) |
| Mobile Home / Other | 0 (0.0%) | 33 (100.0%) |
| Total | 214 (68.4%) | 99 (31.6%) |
Housing Structures by Number of Rooms in Lake Winola
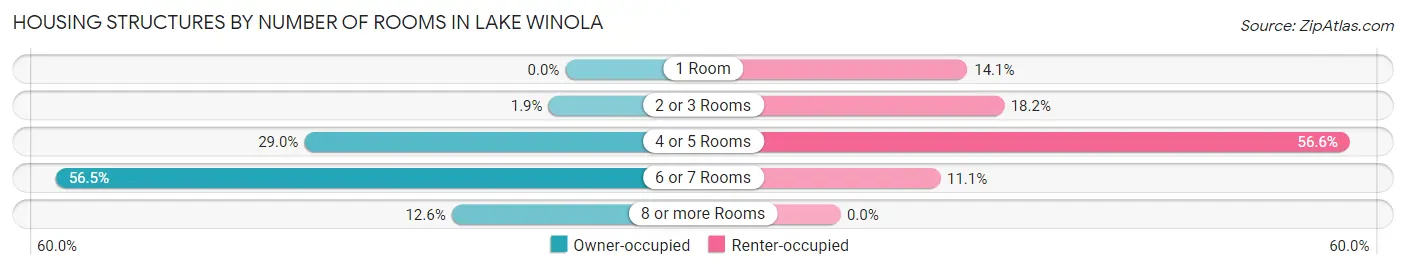
| Number of Rooms | Owner-occupied | Renter-occupied |
| 1 Room | 0 (0.0%) | 14 (14.1%) |
| 2 or 3 Rooms | 4 (1.9%) | 18 (18.2%) |
| 4 or 5 Rooms | 62 (29.0%) | 56 (56.6%) |
| 6 or 7 Rooms | 121 (56.5%) | 11 (11.1%) |
| 8 or more Rooms | 27 (12.6%) | 0 (0.0%) |
| Total | 214 (100.0%) | 99 (100.0%) |
Housing Structure by Heating Type in Lake Winola
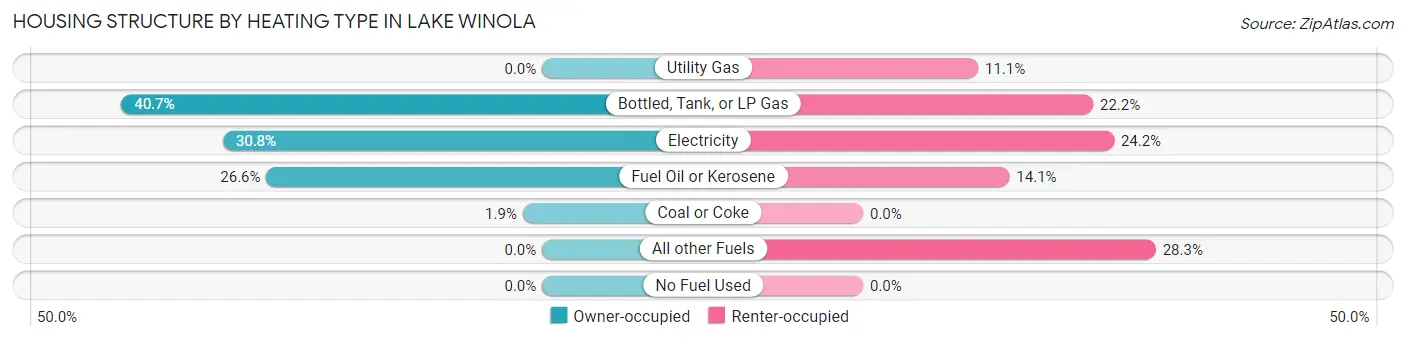
| Heating Type | Owner-occupied | Renter-occupied |
| Utility Gas | 0 (0.0%) | 11 (11.1%) |
| Bottled, Tank, or LP Gas | 87 (40.6%) | 22 (22.2%) |
| Electricity | 66 (30.8%) | 24 (24.2%) |
| Fuel Oil or Kerosene | 57 (26.6%) | 14 (14.1%) |
| Coal or Coke | 4 (1.9%) | 0 (0.0%) |
| All other Fuels | 0 (0.0%) | 28 (28.3%) |
| No Fuel Used | 0 (0.0%) | 0 (0.0%) |
| Total | 214 (100.0%) | 99 (100.0%) |
Household Vehicle Usage in Lake Winola
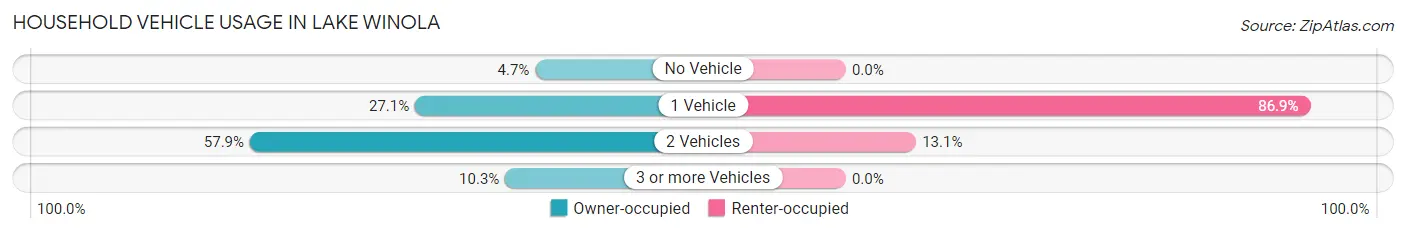
| Vehicles per Household | Owner-occupied | Renter-occupied |
| No Vehicle | 10 (4.7%) | 0 (0.0%) |
| 1 Vehicle | 58 (27.1%) | 86 (86.9%) |
| 2 Vehicles | 124 (57.9%) | 13 (13.1%) |
| 3 or more Vehicles | 22 (10.3%) | 0 (0.0%) |
| Total | 214 (100.0%) | 99 (100.0%) |
Real Estate & Mortgages in Lake Winola
Real Estate and Mortgage Overview in Lake Winola
| Characteristic | Without Mortgage | With Mortgage |
| Housing Units | 99 | 115 |
| Median Property Value | $126,800 | $195,800 |
| Median Household Income | $46,908 | $11 |
| Monthly Housing Costs | $653 | $5 |
| Real Estate Taxes | $2,354 | $0 |
Property Value by Mortgage Status in Lake Winola
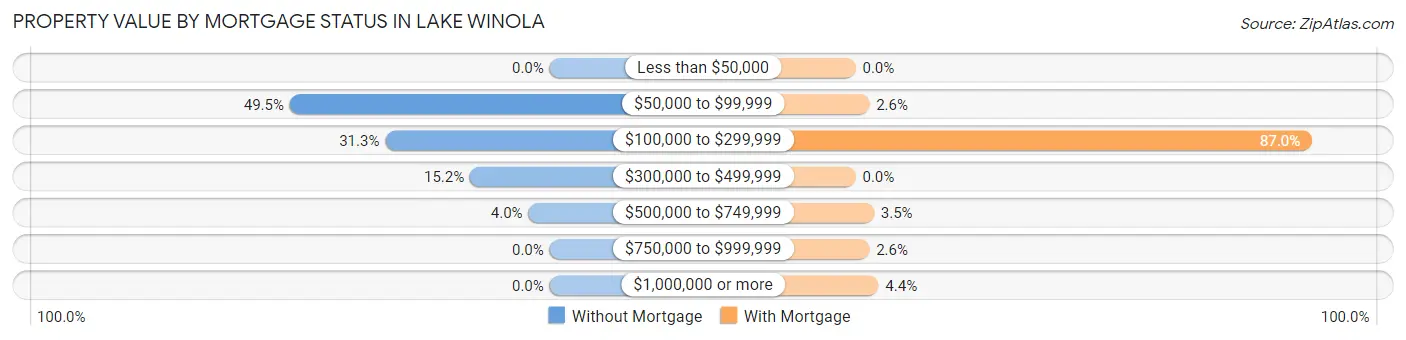
| Property Value | Without Mortgage | With Mortgage |
| Less than $50,000 | 0 (0.0%) | 0 (0.0%) |
| $50,000 to $99,999 | 49 (49.5%) | 3 (2.6%) |
| $100,000 to $299,999 | 31 (31.3%) | 100 (87.0%) |
| $300,000 to $499,999 | 15 (15.1%) | 0 (0.0%) |
| $500,000 to $749,999 | 4 (4.0%) | 4 (3.5%) |
| $750,000 to $999,999 | 0 (0.0%) | 3 (2.6%) |
| $1,000,000 or more | 0 (0.0%) | 5 (4.3%) |
| Total | 99 (100.0%) | 115 (100.0%) |
Household Income by Mortgage Status in Lake Winola
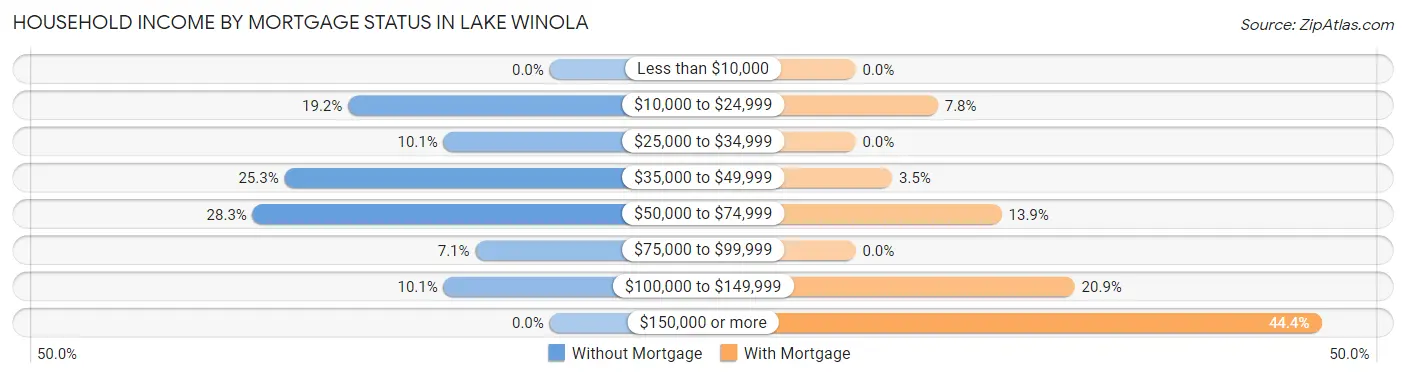
| Household Income | Without Mortgage | With Mortgage |
| Less than $10,000 | 0 (0.0%) | 0 (0.0%) |
| $10,000 to $24,999 | 19 (19.2%) | 9 (7.8%) |
| $25,000 to $34,999 | 10 (10.1%) | 0 (0.0%) |
| $35,000 to $49,999 | 25 (25.3%) | 4 (3.5%) |
| $50,000 to $74,999 | 28 (28.3%) | 16 (13.9%) |
| $75,000 to $99,999 | 7 (7.1%) | 0 (0.0%) |
| $100,000 to $149,999 | 10 (10.1%) | 24 (20.9%) |
| $150,000 or more | 0 (0.0%) | 51 (44.4%) |
| Total | 99 (100.0%) | 115 (100.0%) |
Property Value to Household Income Ratio in Lake Winola
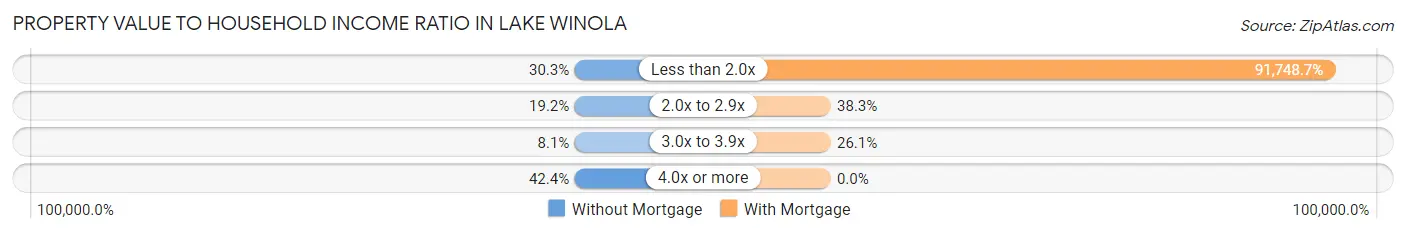
| Value-to-Income Ratio | Without Mortgage | With Mortgage |
| Less than 2.0x | 30 (30.3%) | 105,511 (91,748.7%) |
| 2.0x to 2.9x | 19 (19.2%) | 44 (38.3%) |
| 3.0x to 3.9x | 8 (8.1%) | 30 (26.1%) |
| 4.0x or more | 42 (42.4%) | 0 (0.0%) |
| Total | 99 (100.0%) | 115 (100.0%) |
Real Estate Taxes by Mortgage Status in Lake Winola
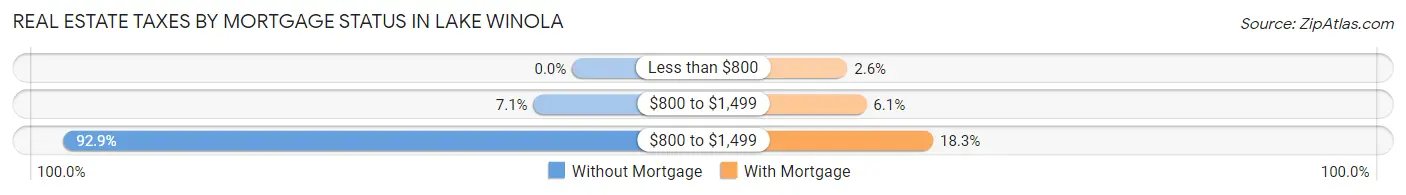
| Property Taxes | Without Mortgage | With Mortgage |
| Less than $800 | 0 (0.0%) | 3 (2.6%) |
| $800 to $1,499 | 7 (7.1%) | 7 (6.1%) |
| $800 to $1,499 | 92 (92.9%) | 21 (18.3%) |
| Total | 99 (100.0%) | 115 (100.0%) |
Health & Disability in Lake Winola
Health Insurance Coverage by Age in Lake Winola
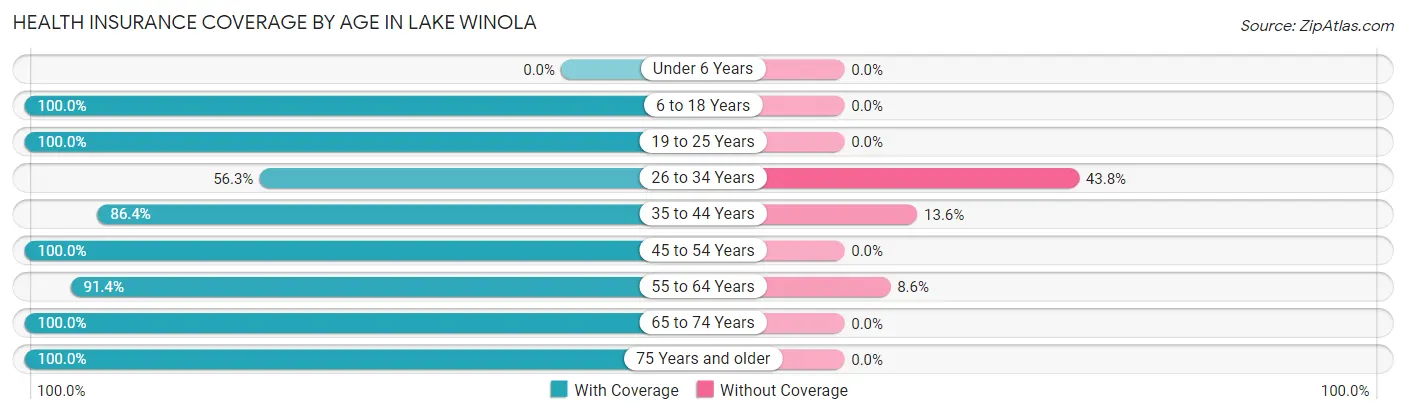
| Age Bracket | With Coverage | Without Coverage |
| Under 6 Years | 0 (0.0%) | 0 (0.0%) |
| 6 to 18 Years | 71 (100.0%) | 0 (0.0%) |
| 19 to 25 Years | 26 (100.0%) | 0 (0.0%) |
| 26 to 34 Years | 36 (56.2%) | 28 (43.8%) |
| 35 to 44 Years | 70 (86.4%) | 11 (13.6%) |
| 45 to 54 Years | 88 (100.0%) | 0 (0.0%) |
| 55 to 64 Years | 96 (91.4%) | 9 (8.6%) |
| 65 to 74 Years | 116 (100.0%) | 0 (0.0%) |
| 75 Years and older | 51 (100.0%) | 0 (0.0%) |
| Total | 554 (92.0%) | 48 (8.0%) |
Health Insurance Coverage by Citizenship Status in Lake Winola
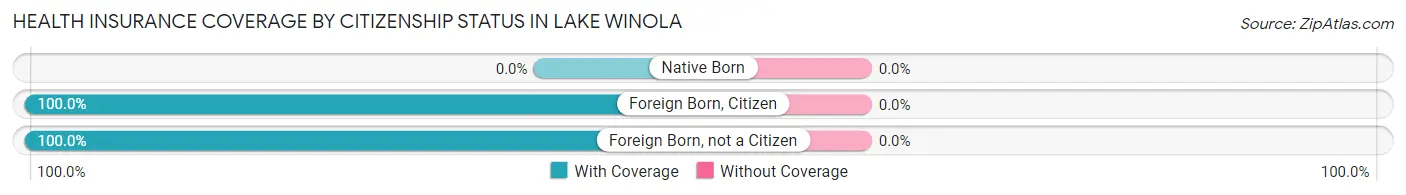
| Citizenship Status | With Coverage | Without Coverage |
| Native Born | 0 (0.0%) | 0 (0.0%) |
| Foreign Born, Citizen | 71 (100.0%) | 0 (0.0%) |
| Foreign Born, not a Citizen | 26 (100.0%) | 0 (0.0%) |
Health Insurance Coverage by Household Income in Lake Winola
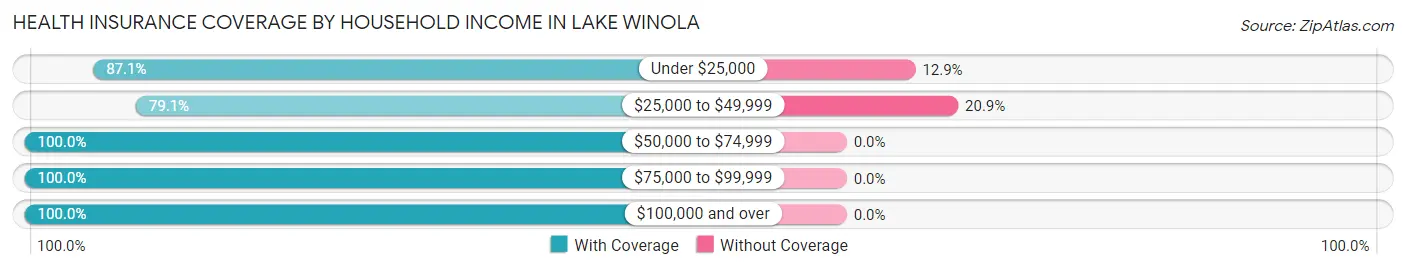
| Household Income | With Coverage | Without Coverage |
| Under $25,000 | 61 (87.1%) | 9 (12.9%) |
| $25,000 to $49,999 | 148 (79.1%) | 39 (20.9%) |
| $50,000 to $74,999 | 81 (100.0%) | 0 (0.0%) |
| $75,000 to $99,999 | 70 (100.0%) | 0 (0.0%) |
| $100,000 and over | 194 (100.0%) | 0 (0.0%) |
Public vs Private Health Insurance Coverage by Age in Lake Winola
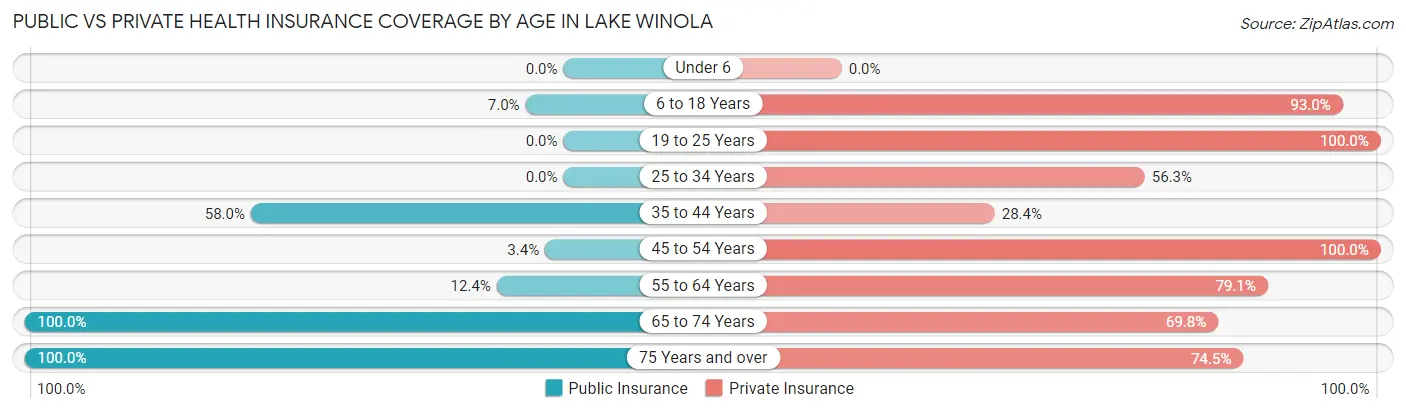
| Age Bracket | Public Insurance | Private Insurance |
| Under 6 | 0 (0.0%) | 0 (0.0%) |
| 6 to 18 Years | 5 (7.0%) | 66 (93.0%) |
| 19 to 25 Years | 0 (0.0%) | 26 (100.0%) |
| 25 to 34 Years | 0 (0.0%) | 36 (56.2%) |
| 35 to 44 Years | 47 (58.0%) | 23 (28.4%) |
| 45 to 54 Years | 3 (3.4%) | 88 (100.0%) |
| 55 to 64 Years | 13 (12.4%) | 83 (79.0%) |
| 65 to 74 Years | 116 (100.0%) | 81 (69.8%) |
| 75 Years and over | 51 (100.0%) | 38 (74.5%) |
| Total | 235 (39.0%) | 441 (73.3%) |
Disability Status by Sex by Age in Lake Winola
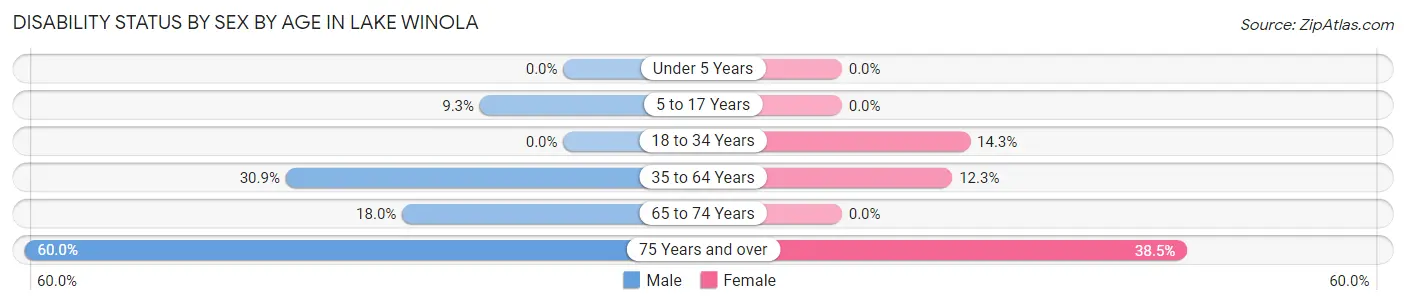
| Age Bracket | Male | Female |
| Under 5 Years | 0 (0.0%) | 0 (0.0%) |
| 5 to 17 Years | 4 (9.3%) | 0 (0.0%) |
| 18 to 34 Years | 0 (0.0%) | 4 (14.3%) |
| 35 to 64 Years | 47 (30.9%) | 15 (12.3%) |
| 65 to 74 Years | 14 (17.9%) | 0 (0.0%) |
| 75 Years and over | 15 (60.0%) | 10 (38.5%) |
Disability Class by Sex by Age in Lake Winola
Disability Class: Hearing Difficulty
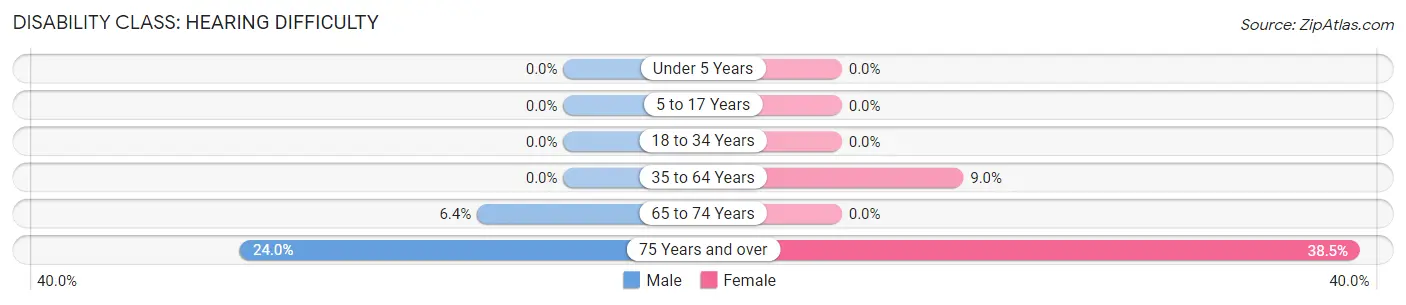
| Age Bracket | Male | Female |
| Under 5 Years | 0 (0.0%) | 0 (0.0%) |
| 5 to 17 Years | 0 (0.0%) | 0 (0.0%) |
| 18 to 34 Years | 0 (0.0%) | 0 (0.0%) |
| 35 to 64 Years | 0 (0.0%) | 11 (9.0%) |
| 65 to 74 Years | 5 (6.4%) | 0 (0.0%) |
| 75 Years and over | 6 (24.0%) | 10 (38.5%) |
Disability Class: Vision Difficulty
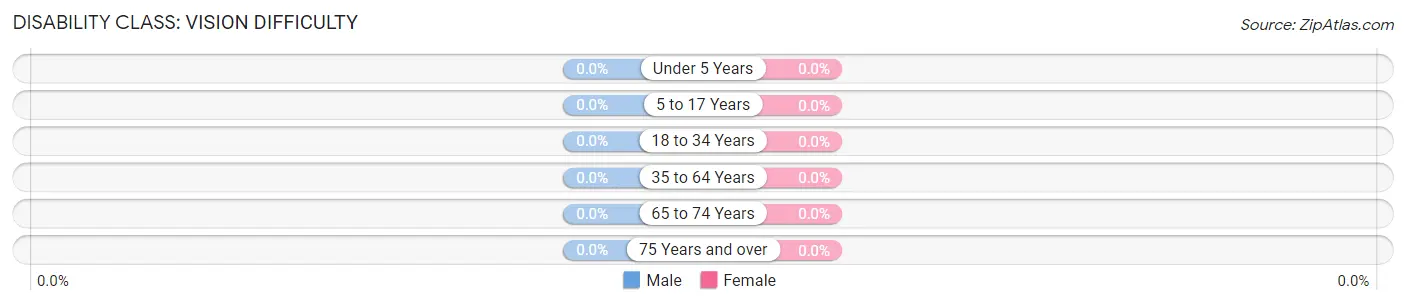
| Age Bracket | Male | Female |
| Under 5 Years | 0 (0.0%) | 0 (0.0%) |
| 5 to 17 Years | 0 (0.0%) | 0 (0.0%) |
| 18 to 34 Years | 0 (0.0%) | 0 (0.0%) |
| 35 to 64 Years | 0 (0.0%) | 0 (0.0%) |
| 65 to 74 Years | 0 (0.0%) | 0 (0.0%) |
| 75 Years and over | 0 (0.0%) | 0 (0.0%) |
Disability Class: Cognitive Difficulty
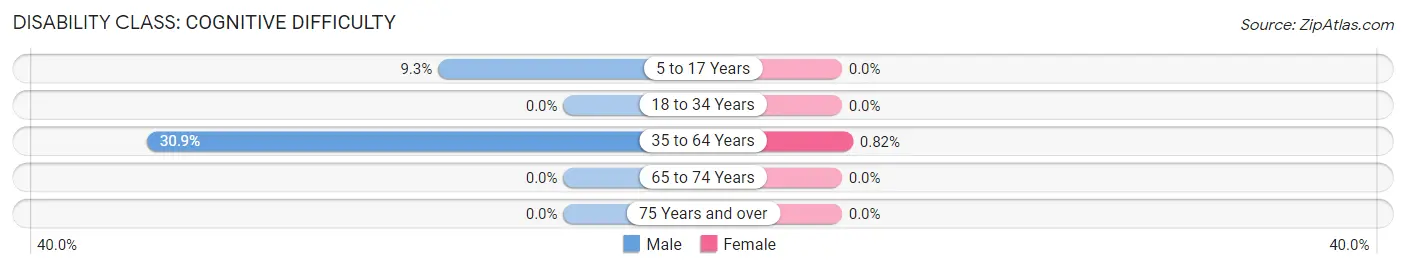
| Age Bracket | Male | Female |
| 5 to 17 Years | 4 (9.3%) | 0 (0.0%) |
| 18 to 34 Years | 0 (0.0%) | 0 (0.0%) |
| 35 to 64 Years | 47 (30.9%) | 1 (0.8%) |
| 65 to 74 Years | 0 (0.0%) | 0 (0.0%) |
| 75 Years and over | 0 (0.0%) | 0 (0.0%) |
Disability Class: Ambulatory Difficulty
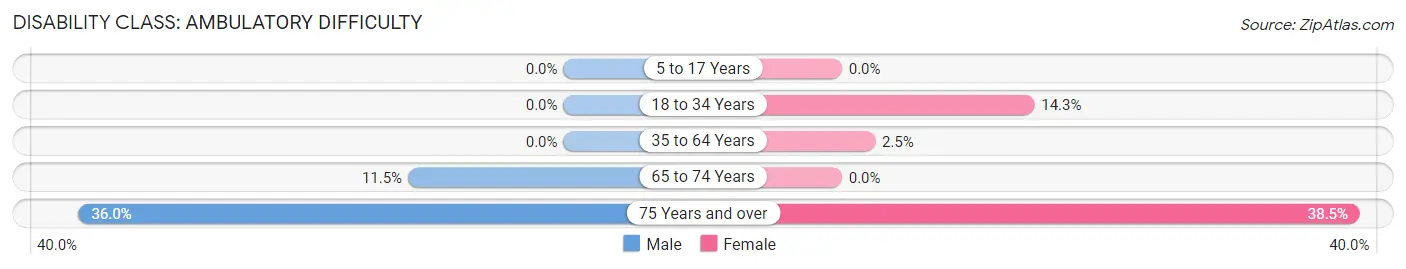
| Age Bracket | Male | Female |
| 5 to 17 Years | 0 (0.0%) | 0 (0.0%) |
| 18 to 34 Years | 0 (0.0%) | 4 (14.3%) |
| 35 to 64 Years | 0 (0.0%) | 3 (2.5%) |
| 65 to 74 Years | 9 (11.5%) | 0 (0.0%) |
| 75 Years and over | 9 (36.0%) | 10 (38.5%) |
Disability Class: Self-Care Difficulty
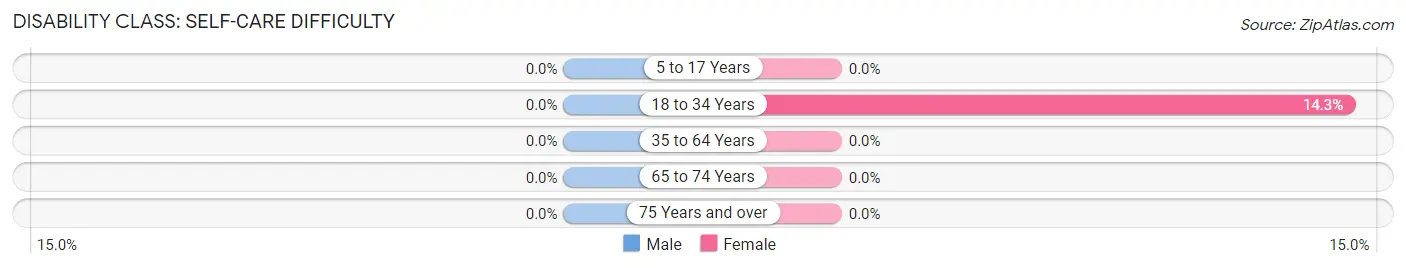
| Age Bracket | Male | Female |
| 5 to 17 Years | 0 (0.0%) | 0 (0.0%) |
| 18 to 34 Years | 0 (0.0%) | 4 (14.3%) |
| 35 to 64 Years | 0 (0.0%) | 0 (0.0%) |
| 65 to 74 Years | 0 (0.0%) | 0 (0.0%) |
| 75 Years and over | 0 (0.0%) | 0 (0.0%) |
Technology Access in Lake Winola
Computing Device Access in Lake Winola
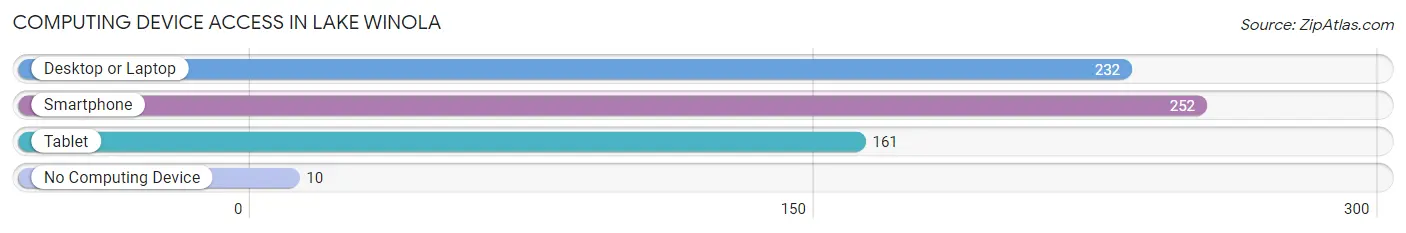
| Device Type | # Households | % Households |
| Desktop or Laptop | 232 | 74.1% |
| Smartphone | 252 | 80.5% |
| Tablet | 161 | 51.4% |
| No Computing Device | 10 | 3.2% |
| Total | 313 | 100.0% |
Internet Access in Lake Winola
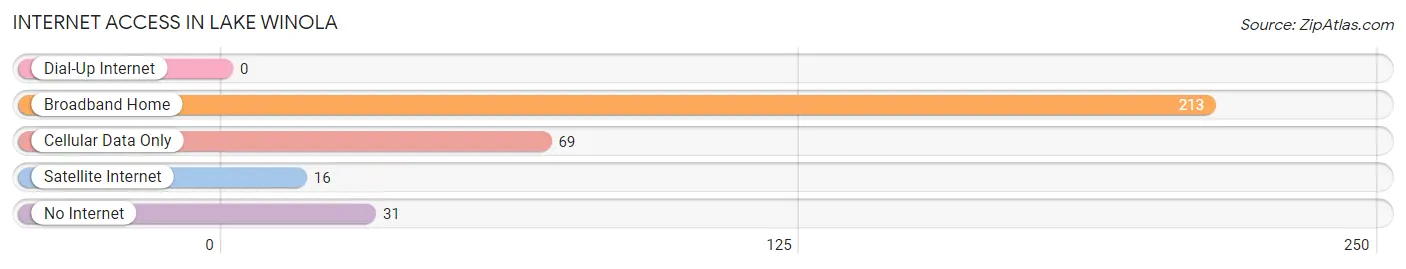
| Internet Type | # Households | % Households |
| Dial-Up Internet | 0 | 0.0% |
| Broadband Home | 213 | 68.0% |
| Cellular Data Only | 69 | 22.0% |
| Satellite Internet | 16 | 5.1% |
| No Internet | 31 | 9.9% |
| Total | 313 | 100.0% |
Lake Winola Summary
History
Lake Winola is a small unincorporated community located in Wyoming County, Pennsylvania. It is situated in the Endless Mountains region of the state, and is located along the shores of Lake Winola, a man-made lake created in the early 1900s. The lake was created by damming the Tunkhannock Creek, and is the largest lake in Wyoming County.
The area around Lake Winola has a long history of human habitation. Native American tribes, including the Susquehannock, Iroquois, and Delaware, were known to have lived in the area prior to the arrival of European settlers. The first European settlers arrived in the area in the late 1700s, and the community of Lake Winola was officially established in 1820.
The area around Lake Winola was largely agricultural in the 19th and early 20th centuries, with dairy farming being the primary industry. In the early 1900s, the lake was created to provide a source of water for the local farms. The lake also became a popular recreational destination, and in the 1920s, the first resort was built on its shores.
Geography
Lake Winola is located in the Endless Mountains region of Pennsylvania, in the northern part of Wyoming County. The lake is situated at an elevation of 1,400 feet, and is surrounded by rolling hills and forests. The lake is approximately two miles long and one mile wide, and has a maximum depth of 40 feet.
The lake is fed by the Tunkhannock Creek, which flows into the lake from the north. The lake is also fed by several smaller streams, including the East Branch of the Tunkhannock Creek, the West Branch of the Tunkhannock Creek, and the South Branch of the Tunkhannock Creek.
The lake is surrounded by the communities of Lake Winola, Factoryville, and Meshoppen. The nearest major city is Scranton, which is located approximately 25 miles to the east.
Economy
The economy of Lake Winola is largely based on tourism and recreation. The lake is a popular destination for fishing, boating, and swimming, and there are several resorts and campgrounds located on its shores. The lake is also home to several marinas, which offer boat rentals and other services.
In addition to tourism and recreation, the area around Lake Winola is home to several small businesses, including restaurants, convenience stores, and gas stations. The area is also home to several farms, which produce dairy products, fruits, and vegetables.
Demographics
As of the 2010 census, the population of Lake Winola was 1,845. The population is largely white (97.3%), with a small percentage of African Americans (1.2%) and Hispanics (1.5%). The median household income in the area is $45,000, and the median home value is $150,000.
The majority of the population (90.3%) is employed in the service industry, with the remainder employed in retail, manufacturing, and other industries. The unemployment rate in the area is 5.2%.
Conclusion
Lake Winola is a small unincorporated community located in Wyoming County, Pennsylvania. It is situated in the Endless Mountains region of the state, and is located along the shores of Lake Winola, a man-made lake created in the early 1900s. The area around Lake Winola has a long history of human habitation, and the economy of the area is largely based on tourism and recreation. The population of Lake Winola is largely white, with a median household income of $45,000 and a median home value of $150,000.
Common Questions
What is Per Capita Income in Lake Winola?
Per Capita income in Lake Winola is $33,711.
What is the Median Family Income in Lake Winola?
Median Family Income in Lake Winola is $74,444.
What is the Median Household income in Lake Winola?
Median Household Income in Lake Winola is $46,835.
What is Income or Wage Gap in Lake Winola?
Income or Wage Gap in Lake Winola is 20.0%.
Women in Lake Winola earn 80.0 cents for every dollar earned by a man.
What is Inequality or Gini Index in Lake Winola?
Inequality or Gini Index in Lake Winola is 0.38.
What is the Total Population of Lake Winola?
Total Population of Lake Winola is 602.
What is the Total Male Population of Lake Winola?
Total Male Population of Lake Winola is 375.
What is the Total Female Population of Lake Winola?
Total Female Population of Lake Winola is 227.
What is the Ratio of Males per 100 Females in Lake Winola?
There are 165.20 Males per 100 Females in Lake Winola.
What is the Ratio of Females per 100 Males in Lake Winola?
There are 60.53 Females per 100 Males in Lake Winola.
What is the Median Population Age in Lake Winola?
Median Population Age in Lake Winola is 50.7 Years.
What is the Average Family Size in Lake Winola
Average Family Size in Lake Winola is 2.1 People.
What is the Average Household Size in Lake Winola
Average Household Size in Lake Winola is 1.9 People.
How Large is the Labor Force in Lake Winola?
There are 311 People in the Labor Forcein in Lake Winola.
What is the Percentage of People in the Labor Force in Lake Winola?
56.5% of People are in the Labor Force in Lake Winola.
What is the Unemployment Rate in Lake Winola?
Unemployment Rate in Lake Winola is 6.1%.