Klingerstown, PA Map & Demographics
Klingerstown Map
Klingerstown Overview
$28,236
PER CAPITA INCOME
$34,318
AVG HOUSEHOLD INCOME
64.9%
WAGE / INCOME GAP [ % ]
35.1¢/ $1
WAGE / INCOME GAP [ $ ]
0.45
INEQUALITY / GINI INDEX
102
TOTAL POPULATION
57
MALE POPULATION
45
FEMALE POPULATION
126.67
MALES / 100 FEMALES
78.95
FEMALES / 100 MALES
43.5
MEDIAN AGE
2.5
AVG FAMILY SIZE
1.9
AVG HOUSEHOLD SIZE
51
LABOR FORCE [ PEOPLE ]
60.0%
PERCENT IN LABOR FORCE
Klingerstown Zip Codes
Klingerstown Area Codes
Income in Klingerstown
Income Overview in Klingerstown
| Characteristic | Number | Measure |
| Per Capita Income | 102 | $28,236 |
| Median Family Income | 31 | $0 |
| Mean Family Income | 31 | $74,503 |
| Median Household Income | 54 | $34,318 |
| Mean Household Income | 54 | $54,750 |
| Income Deficit | 31 | $0 |
| Wage / Income Gap (%) | 102 | 64.94% |
| Wage / Income Gap ($) | 102 | 35.06¢ per $1 |
| Gini / Inequality Index | 102 | 0.45 |
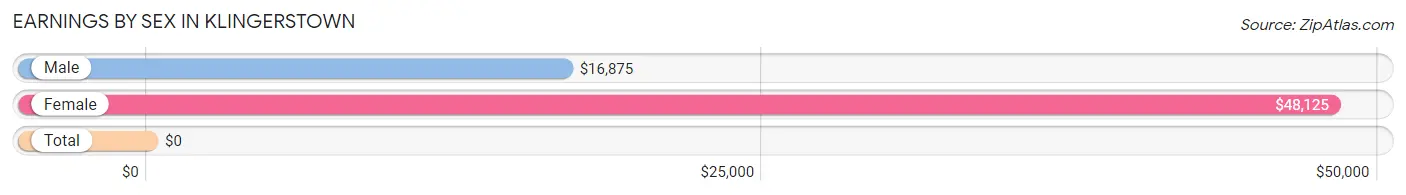
Earnings by Sex in Klingerstown
| Sex | Number | Average Earnings |
| Male | 32 (60.4%) | $16,875 |
| Female | 21 (39.6%) | $48,125 |
| Total | 53 (100.0%) | $0 |
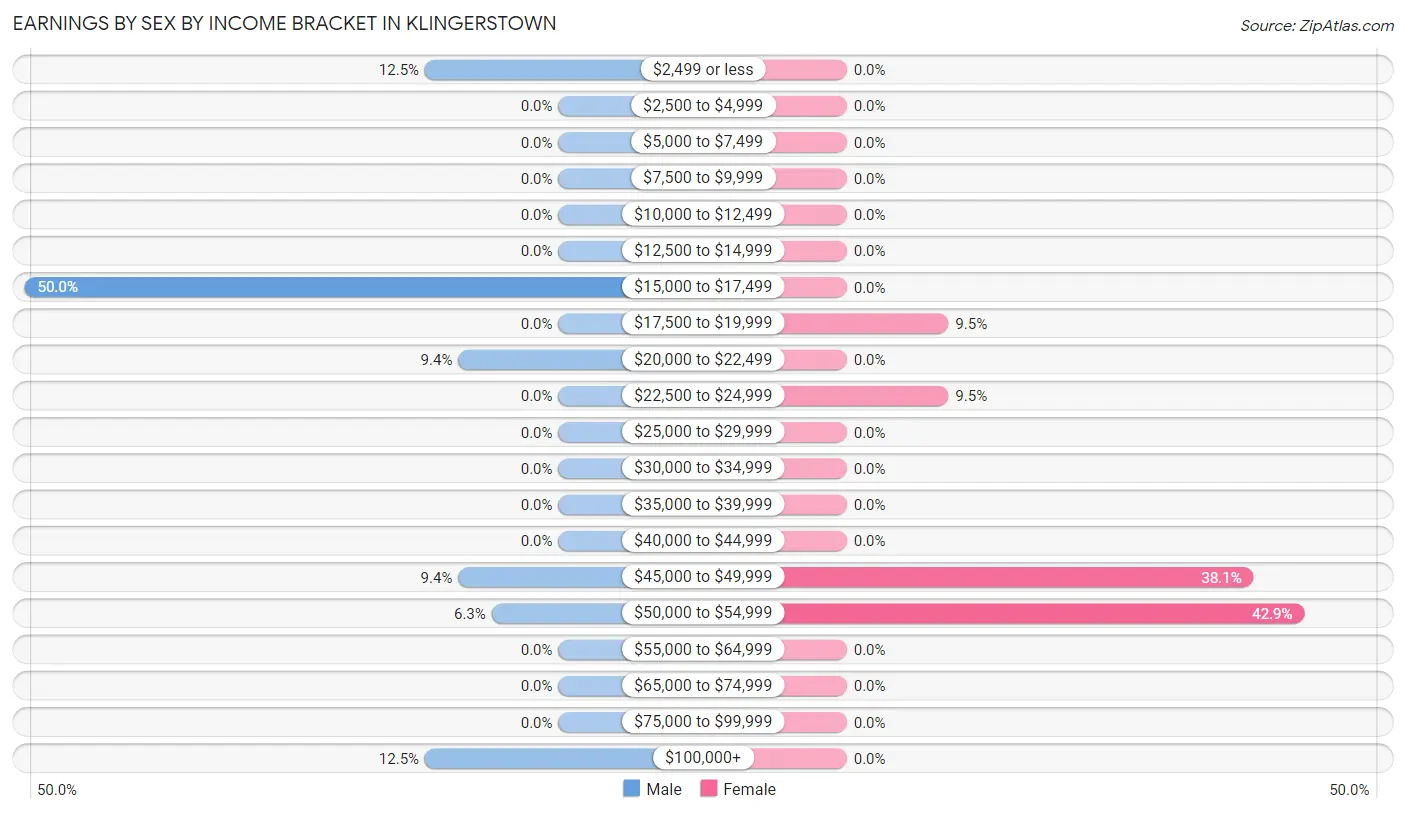
Earnings by Sex by Income Bracket in Klingerstown
The most common earnings brackets in Klingerstown are $15,000 to $17,499 for men (16 | 50.0%) and $50,000 to $54,999 for women (9 | 42.9%).
| Income | Male | Female |
| $2,499 or less | 4 (12.5%) | 0 (0.0%) |
| $2,500 to $4,999 | 0 (0.0%) | 0 (0.0%) |
| $5,000 to $7,499 | 0 (0.0%) | 0 (0.0%) |
| $7,500 to $9,999 | 0 (0.0%) | 0 (0.0%) |
| $10,000 to $12,499 | 0 (0.0%) | 0 (0.0%) |
| $12,500 to $14,999 | 0 (0.0%) | 0 (0.0%) |
| $15,000 to $17,499 | 16 (50.0%) | 0 (0.0%) |
| $17,500 to $19,999 | 0 (0.0%) | 2 (9.5%) |
| $20,000 to $22,499 | 3 (9.4%) | 0 (0.0%) |
| $22,500 to $24,999 | 0 (0.0%) | 2 (9.5%) |
| $25,000 to $29,999 | 0 (0.0%) | 0 (0.0%) |
| $30,000 to $34,999 | 0 (0.0%) | 0 (0.0%) |
| $35,000 to $39,999 | 0 (0.0%) | 0 (0.0%) |
| $40,000 to $44,999 | 0 (0.0%) | 0 (0.0%) |
| $45,000 to $49,999 | 3 (9.4%) | 8 (38.1%) |
| $50,000 to $54,999 | 2 (6.2%) | 9 (42.9%) |
| $55,000 to $64,999 | 0 (0.0%) | 0 (0.0%) |
| $65,000 to $74,999 | 0 (0.0%) | 0 (0.0%) |
| $75,000 to $99,999 | 0 (0.0%) | 0 (0.0%) |
| $100,000+ | 4 (12.5%) | 0 (0.0%) |
| Total | 32 (100.0%) | 21 (100.0%) |
Earnings by Sex by Educational Attainment in Klingerstown
| Educational Attainment | Male Income | Female Income |
| Less than High School | - | - |
| High School Diploma | - | - |
| College or Associate's Degree | - | - |
| Bachelor's Degree | - | - |
| Graduate Degree | - | - |
| Total | - | - |
Family Income in Klingerstown
Family Income Brackets in Klingerstown
According to the Klingerstown family income data, there are 11 families falling into the $25,000 to $34,999 income range, which is the most common income bracket and makes up 35.5% of all families.
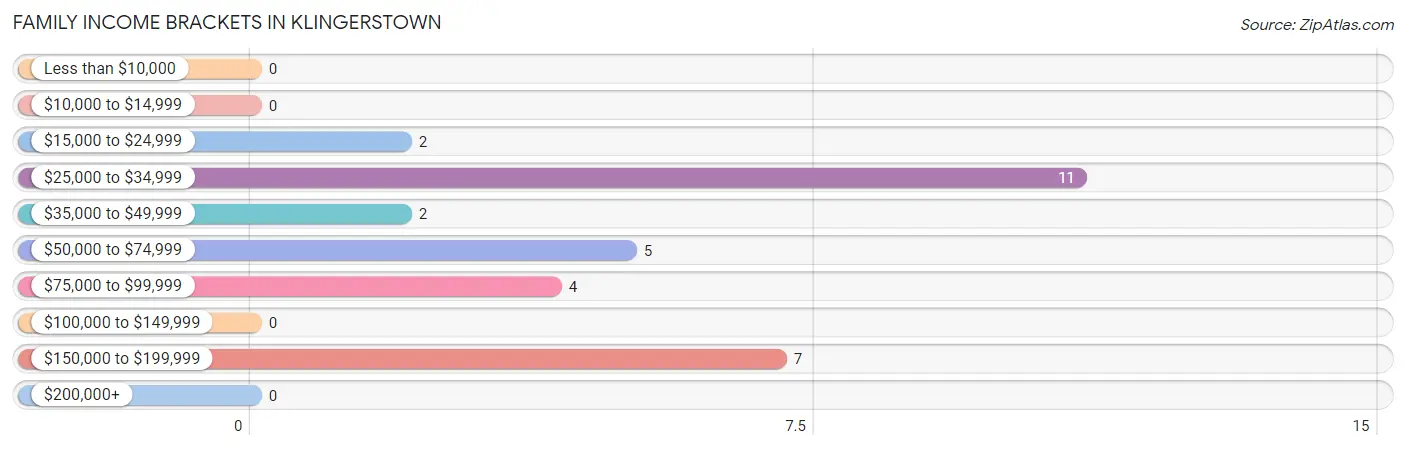
| Income Bracket | # Families | % Families |
| Less than $10,000 | 0 | 0.0% |
| $10,000 to $14,999 | 0 | 0.0% |
| $15,000 to $24,999 | 2 | 6.5% |
| $25,000 to $34,999 | 11 | 35.5% |
| $35,000 to $49,999 | 2 | 6.5% |
| $50,000 to $74,999 | 5 | 16.1% |
| $75,000 to $99,999 | 4 | 12.9% |
| $100,000 to $149,999 | 0 | 0.0% |
| $150,000 to $199,999 | 7 | 22.6% |
| $200,000+ | 0 | 0.0% |
Family Income by Famaliy Size in Klingerstown
2-person families (17 | 54.8%) account for the highest median family income in Klingerstown with $33,977 per family, while 2-person families (17 | 54.8%) have the highest median income of $16,988 per family member.
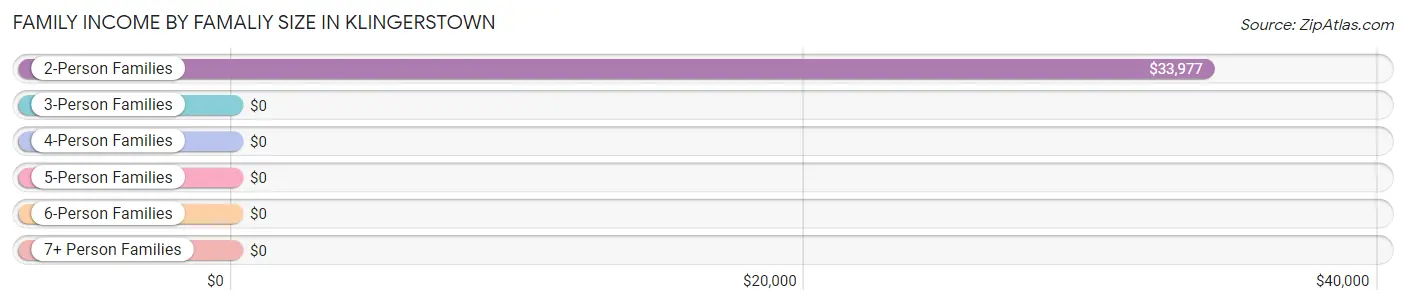
| Income Bracket | # Families | Median Income |
| 2-Person Families | 17 (54.8%) | $33,977 |
| 3-Person Families | 6 (19.4%) | $0 |
| 4-Person Families | 8 (25.8%) | $0 |
| 5-Person Families | 0 (0.0%) | $0 |
| 6-Person Families | 0 (0.0%) | $0 |
| 7+ Person Families | 0 (0.0%) | $0 |
| Total | 31 (100.0%) | $0 |
Family Income by Number of Earners in Klingerstown
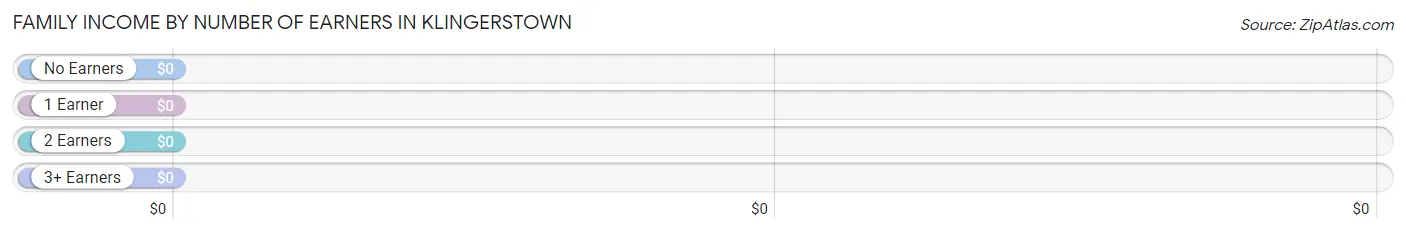
| Number of Earners | # Families | Median Income |
| No Earners | 9 (29.0%) | $0 |
| 1 Earner | 7 (22.6%) | $0 |
| 2 Earners | 8 (25.8%) | $0 |
| 3+ Earners | 7 (22.6%) | $0 |
| Total | 31 (100.0%) | $0 |
Household Income in Klingerstown
Household Income Brackets in Klingerstown
With 14 households falling in the category, the $15,000 to $24,999 income range is the most frequent in Klingerstown, accounting for 25.9% of all households.
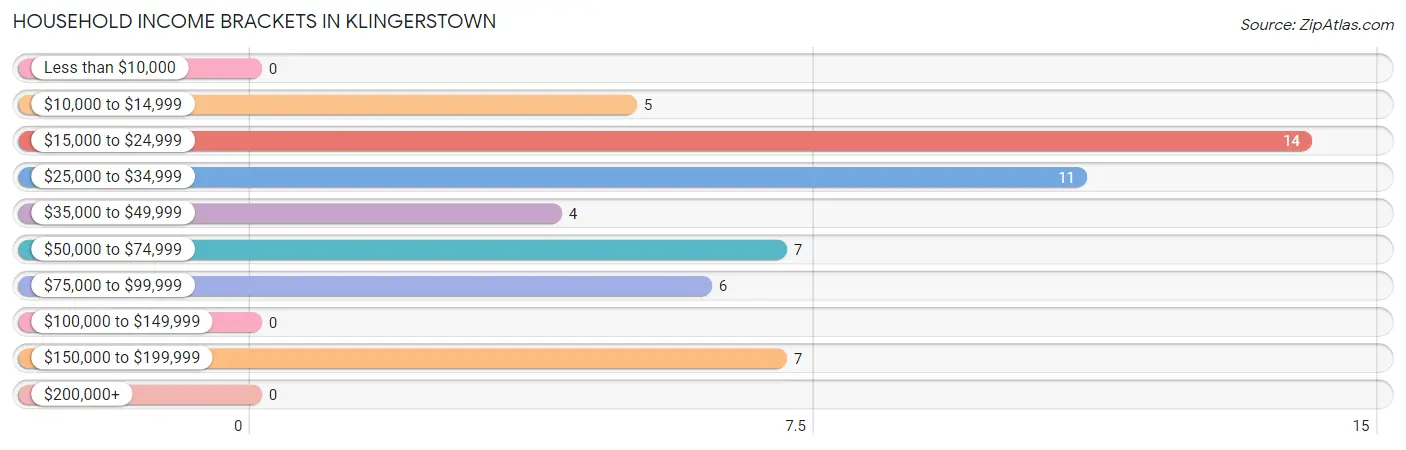
| Income Bracket | # Households | % Households |
| Less than $10,000 | 0 | 0.0% |
| $10,000 to $14,999 | 5 | 9.3% |
| $15,000 to $24,999 | 14 | 25.9% |
| $25,000 to $34,999 | 11 | 20.4% |
| $35,000 to $49,999 | 4 | 7.4% |
| $50,000 to $74,999 | 7 | 13.0% |
| $75,000 to $99,999 | 6 | 11.1% |
| $100,000 to $149,999 | 0 | 0.0% |
| $150,000 to $199,999 | 7 | 13.0% |
| $200,000+ | 0 | 0.0% |
Household Income by Householder Age in Klingerstown
The median household income in Klingerstown is $34,318, with the highest median household income of $33,333 found in the 65+ years age bracket for the primary householder. A total of 22 households (40.7%) fall into this category.
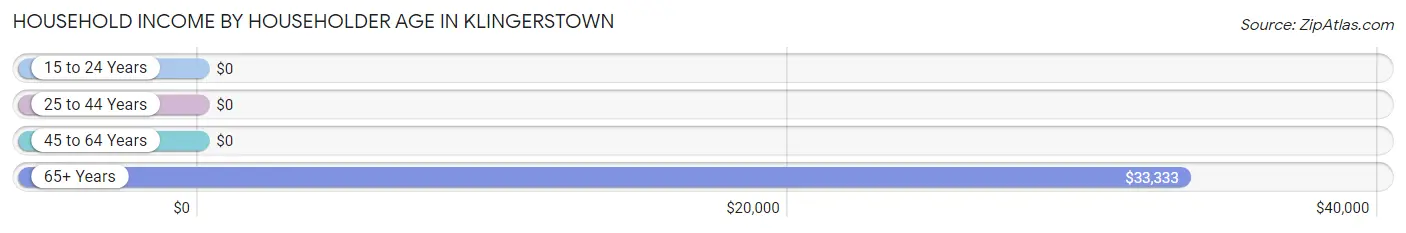
| Income Bracket | # Households | Median Income |
| 15 to 24 Years | 0 (0.0%) | $0 |
| 25 to 44 Years | 15 (27.8%) | $0 |
| 45 to 64 Years | 17 (31.5%) | $0 |
| 65+ Years | 22 (40.7%) | $33,333 |
| Total | 54 (100.0%) | $34,318 |
Poverty in Klingerstown
Income Below Poverty by Sex and Age in Klingerstown
With 10.5% poverty level for males and 4.4% for females among the residents of Klingerstown, 65 to 74 year old males and 75 year old and over females are the most vulnerable to poverty, with 4 males (57.1%) and 1 females (25.0%) in their respective age groups living below the poverty level.
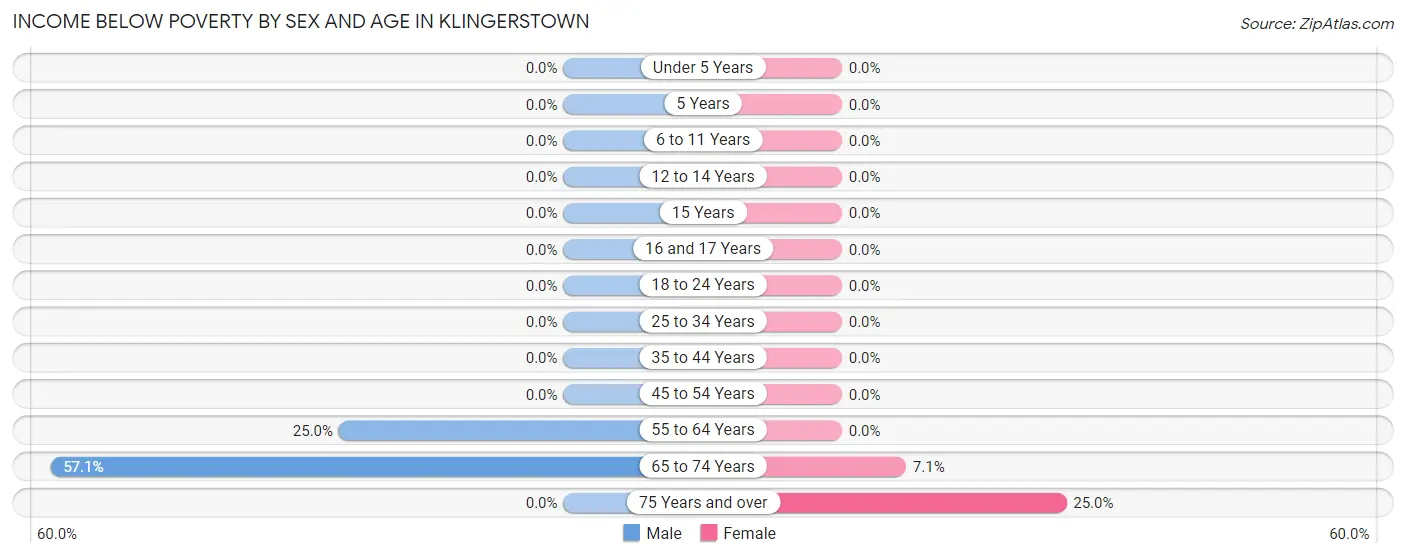
| Age Bracket | Male | Female |
| Under 5 Years | 0 (0.0%) | 0 (0.0%) |
| 5 Years | 0 (0.0%) | 0 (0.0%) |
| 6 to 11 Years | 0 (0.0%) | 0 (0.0%) |
| 12 to 14 Years | 0 (0.0%) | 0 (0.0%) |
| 15 Years | 0 (0.0%) | 0 (0.0%) |
| 16 and 17 Years | 0 (0.0%) | 0 (0.0%) |
| 18 to 24 Years | 0 (0.0%) | 0 (0.0%) |
| 25 to 34 Years | 0 (0.0%) | 0 (0.0%) |
| 35 to 44 Years | 0 (0.0%) | 0 (0.0%) |
| 45 to 54 Years | 0 (0.0%) | 0 (0.0%) |
| 55 to 64 Years | 2 (25.0%) | 0 (0.0%) |
| 65 to 74 Years | 4 (57.1%) | 1 (7.1%) |
| 75 Years and over | 0 (0.0%) | 1 (25.0%) |
| Total | 6 (10.5%) | 2 (4.4%) |
Income Above Poverty by Sex and Age in Klingerstown
According to the poverty statistics in Klingerstown, males aged 5 years and females aged under 5 years are the age groups that are most secure financially, with 100.0% of males and 100.0% of females in these age groups living above the poverty line.
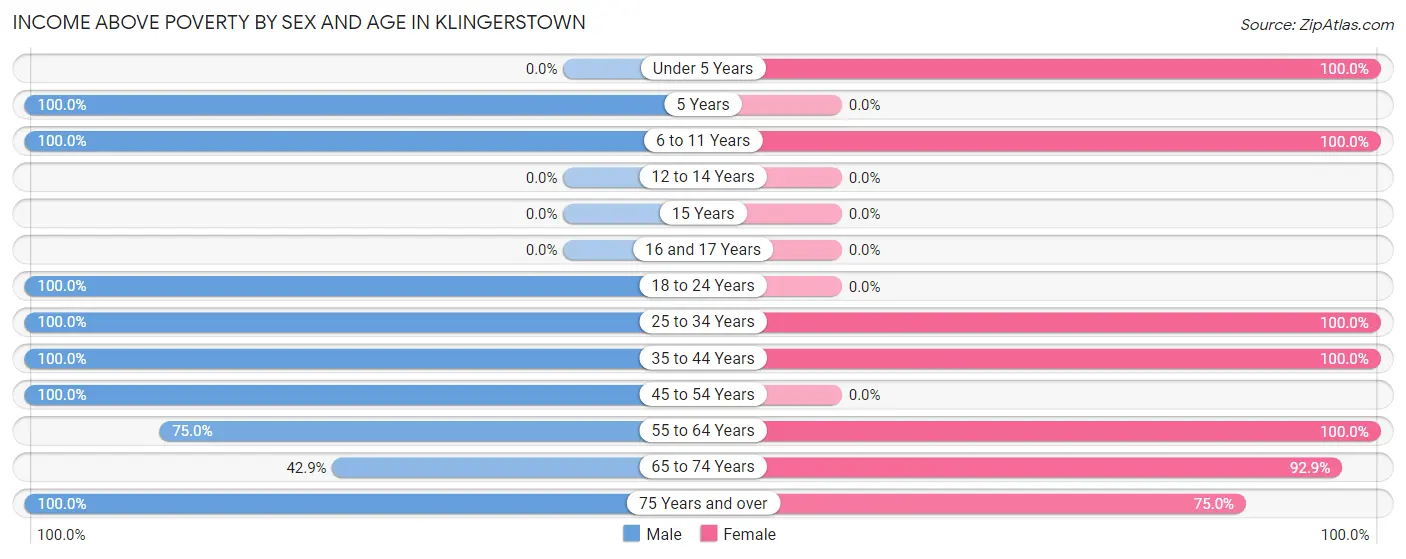
| Age Bracket | Male | Female |
| Under 5 Years | 0 (0.0%) | 4 (100.0%) |
| 5 Years | 5 (100.0%) | 0 (0.0%) |
| 6 to 11 Years | 6 (100.0%) | 2 (100.0%) |
| 12 to 14 Years | 0 (0.0%) | 0 (0.0%) |
| 15 Years | 0 (0.0%) | 0 (0.0%) |
| 16 and 17 Years | 0 (0.0%) | 0 (0.0%) |
| 18 to 24 Years | 4 (100.0%) | 0 (0.0%) |
| 25 to 34 Years | 14 (100.0%) | 5 (100.0%) |
| 35 to 44 Years | 2 (100.0%) | 14 (100.0%) |
| 45 to 54 Years | 7 (100.0%) | 0 (0.0%) |
| 55 to 64 Years | 6 (75.0%) | 2 (100.0%) |
| 65 to 74 Years | 3 (42.9%) | 13 (92.9%) |
| 75 Years and over | 4 (100.0%) | 3 (75.0%) |
| Total | 51 (89.5%) | 43 (95.6%) |
Income Below Poverty Among Married-Couple Families in Klingerstown
The poverty statistics for married-couple families in Klingerstown show that 14.3% or 2 of the total 14 families live below the poverty line. Families with no children have the highest poverty rate of 14.3%, comprising of 2 families. On the other hand, families with no children have the lowest poverty rate of 14.3%, which includes 2 families.
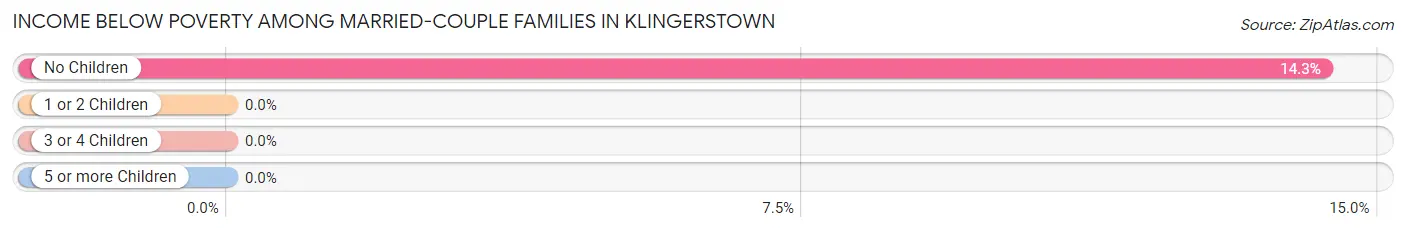
| Children | Above Poverty | Below Poverty |
| No Children | 12 (85.7%) | 2 (14.3%) |
| 1 or 2 Children | 0 (0.0%) | 0 (0.0%) |
| 3 or 4 Children | 0 (0.0%) | 0 (0.0%) |
| 5 or more Children | 0 (0.0%) | 0 (0.0%) |
| Total | 12 (85.7%) | 2 (14.3%) |
Income Below Poverty Among Single-Parent Households in Klingerstown
| Children | Single Father | Single Mother |
| No Children | 0 (0.0%) | 0 (0.0%) |
| 1 or 2 Children | 0 (0.0%) | 0 (0.0%) |
| 3 or 4 Children | 0 (0.0%) | 0 (0.0%) |
| 5 or more Children | 0 (0.0%) | 0 (0.0%) |
| Total | 0 (0.0%) | 0 (0.0%) |
Income Below Poverty Among Married-Couple vs Single-Parent Households in Klingerstown
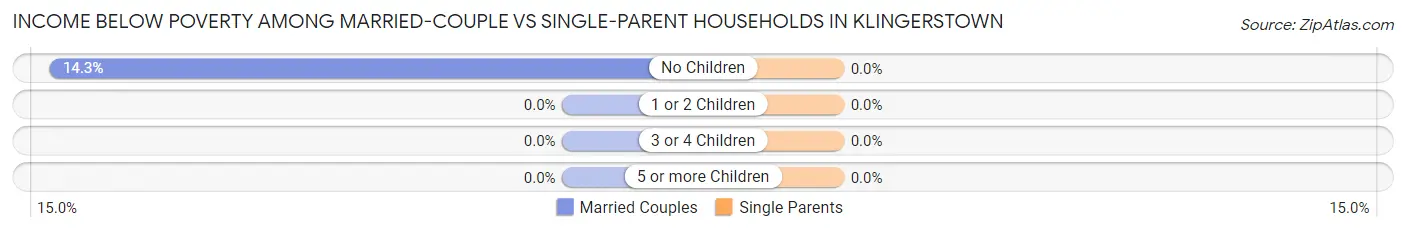
| Children | Married-Couple Families | Single-Parent Households |
| No Children | 2 (14.3%) | 0 (0.0%) |
| 1 or 2 Children | 0 (0.0%) | 0 (0.0%) |
| 3 or 4 Children | 0 (0.0%) | 0 (0.0%) |
| 5 or more Children | 0 (0.0%) | 0 (0.0%) |
| Total | 2 (14.3%) | 0 (0.0%) |
Race in Klingerstown
The most populous races in Klingerstown are , and White / Caucasian (102 | 100.0%).
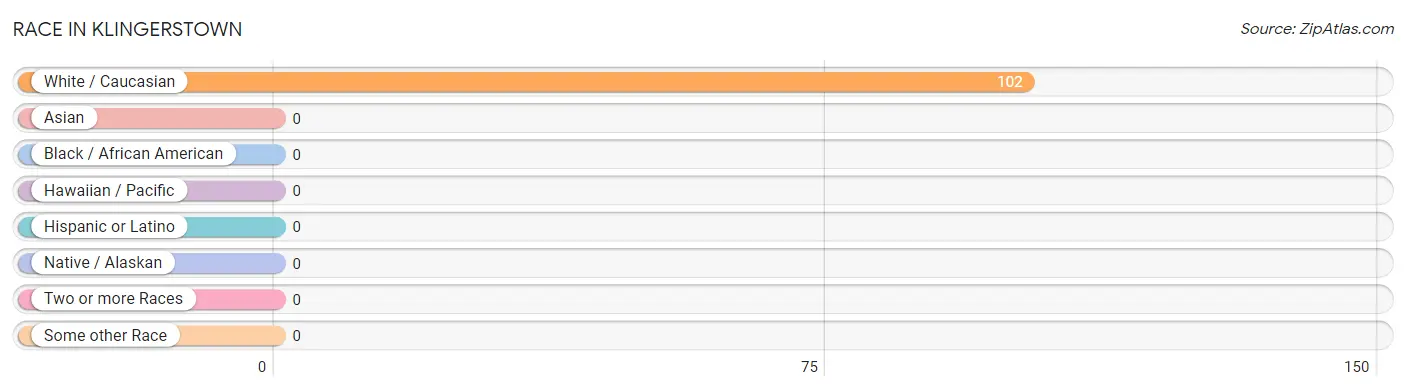
| Race | # Population | % Population |
| Asian | 0 | 0.0% |
| Black / African American | 0 | 0.0% |
| Hawaiian / Pacific | 0 | 0.0% |
| Hispanic or Latino | 0 | 0.0% |
| Native / Alaskan | 0 | 0.0% |
| White / Caucasian | 102 | 100.0% |
| Two or more Races | 0 | 0.0% |
| Some other Race | 0 | 0.0% |
| Total | 102 | 100.0% |
Ancestry in Klingerstown
The most populous ancestries reported in Klingerstown are German (69 | 67.6%), English (32 | 31.4%), Italian (14 | 13.7%), Dutch (6 | 5.9%), and Irish (4 | 3.9%), together accounting for 122.5% of all Klingerstown residents.
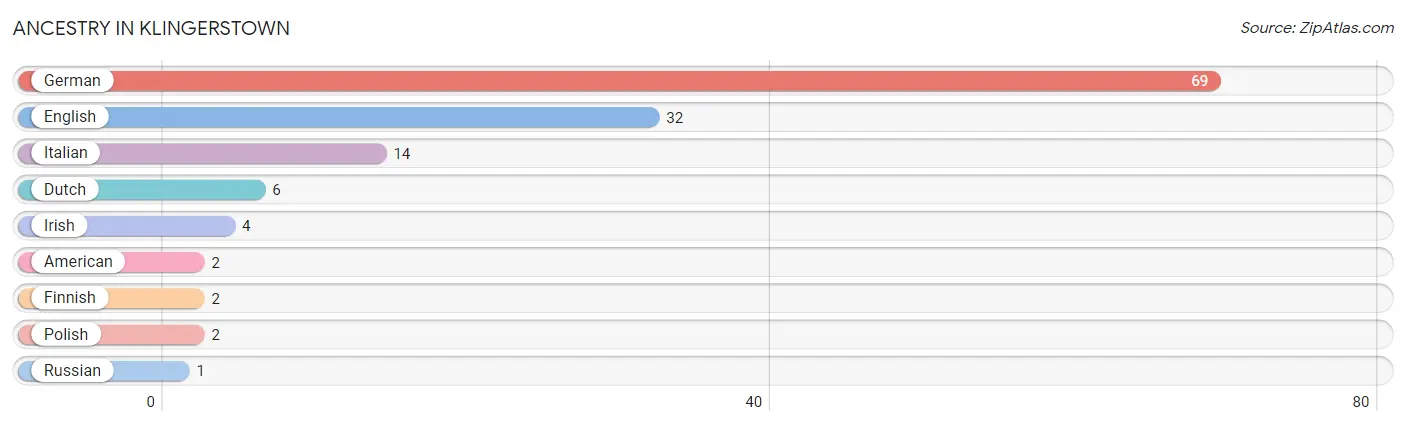
| Ancestry | # Population | % Population |
| American | 2 | 2.0% |
| Dutch | 6 | 5.9% |
| English | 32 | 31.4% |
| Finnish | 2 | 2.0% |
| German | 69 | 67.6% |
| Irish | 4 | 3.9% |
| Italian | 14 | 13.7% |
| Polish | 2 | 2.0% |
| Russian | 1 | 1.0% | View All 9 Rows |
Immigrants in Klingerstown

| Immigration Origin | # Population | % Population | View All 0 Rows |
Sex and Age in Klingerstown
Sex and Age in Klingerstown
The most populous age groups in Klingerstown are 5 to 9 Years (10 | 17.5%) for men and 70 to 74 Years (9 | 20.0%) for women.
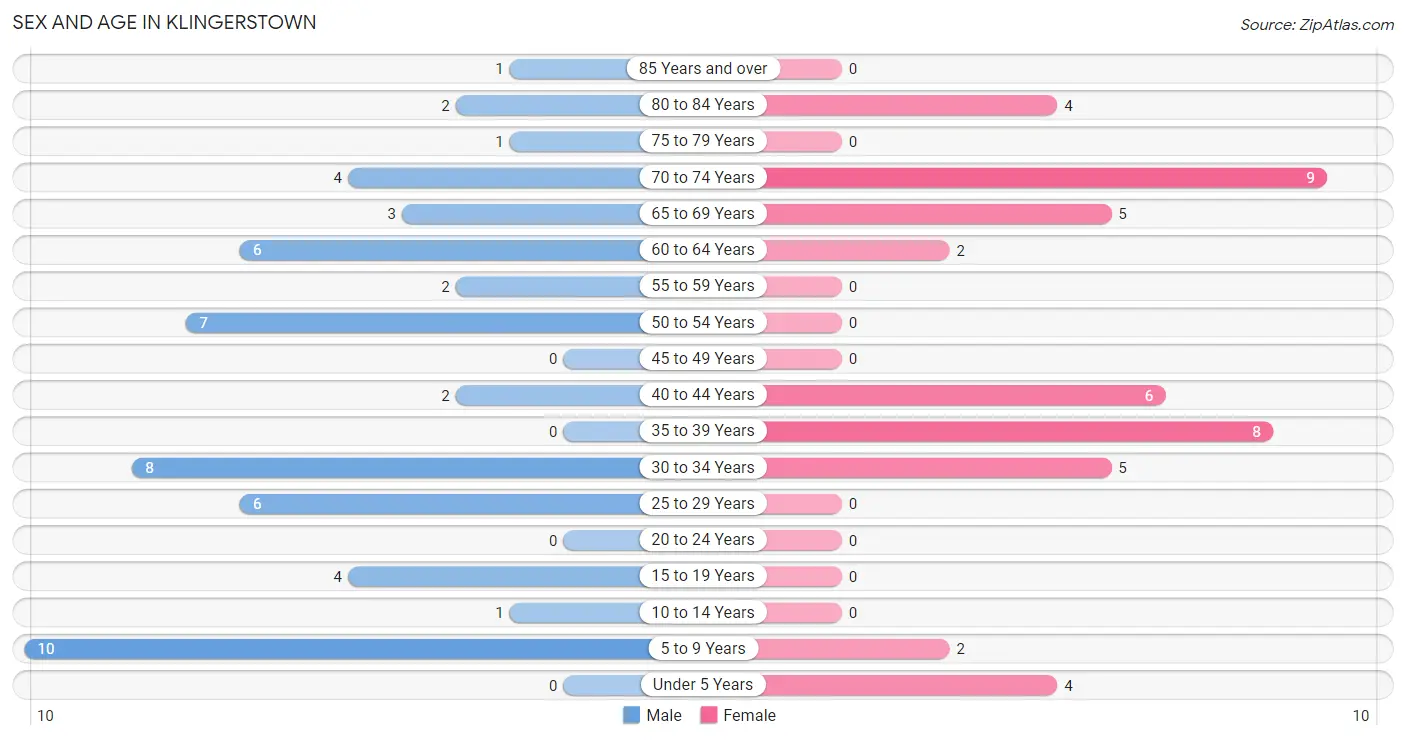
| Age Bracket | Male | Female |
| Under 5 Years | 0 (0.0%) | 4 (8.9%) |
| 5 to 9 Years | 10 (17.5%) | 2 (4.4%) |
| 10 to 14 Years | 1 (1.8%) | 0 (0.0%) |
| 15 to 19 Years | 4 (7.0%) | 0 (0.0%) |
| 20 to 24 Years | 0 (0.0%) | 0 (0.0%) |
| 25 to 29 Years | 6 (10.5%) | 0 (0.0%) |
| 30 to 34 Years | 8 (14.0%) | 5 (11.1%) |
| 35 to 39 Years | 0 (0.0%) | 8 (17.8%) |
| 40 to 44 Years | 2 (3.5%) | 6 (13.3%) |
| 45 to 49 Years | 0 (0.0%) | 0 (0.0%) |
| 50 to 54 Years | 7 (12.3%) | 0 (0.0%) |
| 55 to 59 Years | 2 (3.5%) | 0 (0.0%) |
| 60 to 64 Years | 6 (10.5%) | 2 (4.4%) |
| 65 to 69 Years | 3 (5.3%) | 5 (11.1%) |
| 70 to 74 Years | 4 (7.0%) | 9 (20.0%) |
| 75 to 79 Years | 1 (1.8%) | 0 (0.0%) |
| 80 to 84 Years | 2 (3.5%) | 4 (8.9%) |
| 85 Years and over | 1 (1.8%) | 0 (0.0%) |
| Total | 57 (100.0%) | 45 (100.0%) |
Families and Households in Klingerstown
Median Family Size in Klingerstown
The median family size in Klingerstown is 2.55 persons per family, with single female/mother families (9 | 29.0%) accounting for the largest median family size of 3.11 persons per family. On the other hand, single male/father families (8 | 25.8%) represent the smallest median family size with 1.75 persons per family.
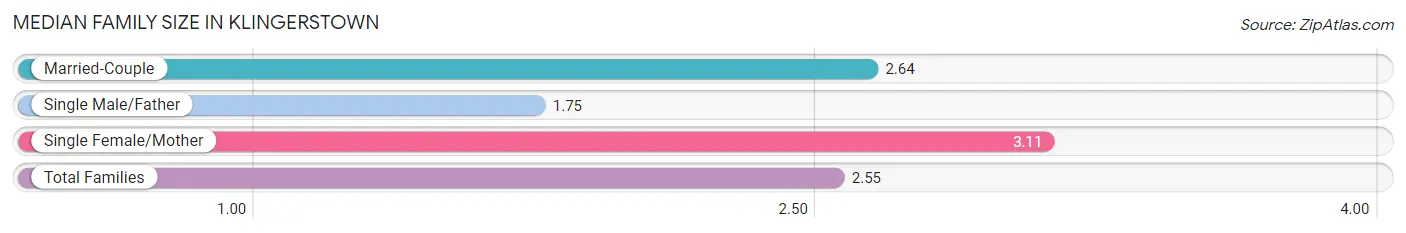
| Family Type | # Families | Family Size |
| Married-Couple | 14 (45.2%) | 2.64 |
| Single Male/Father | 8 (25.8%) | 1.75 |
| Single Female/Mother | 9 (29.0%) | 3.11 |
| Total Families | 31 (100.0%) | 2.55 |
Median Household Size in Klingerstown
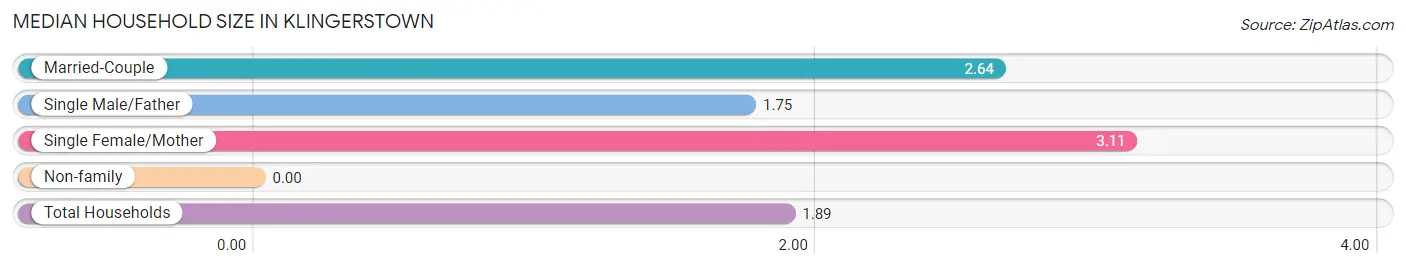
| Household Type | # Households | Household Size |
| Married-Couple | 14 (25.9%) | 2.64 |
| Single Male/Father | 8 (14.8%) | 1.75 |
| Single Female/Mother | 9 (16.7%) | 3.11 |
| Non-family | 23 (42.6%) | - |
| Total Households | 54 (100.0%) | 1.89 |
Household Size by Marriage Status in Klingerstown
Out of a total of 54 households in Klingerstown, 31 (57.4%) are family households, while 23 (42.6%) are nonfamily households. The most numerous type of family households are 2-person households, comprising 17, and the most common type of nonfamily households are 1-person households, comprising 23.
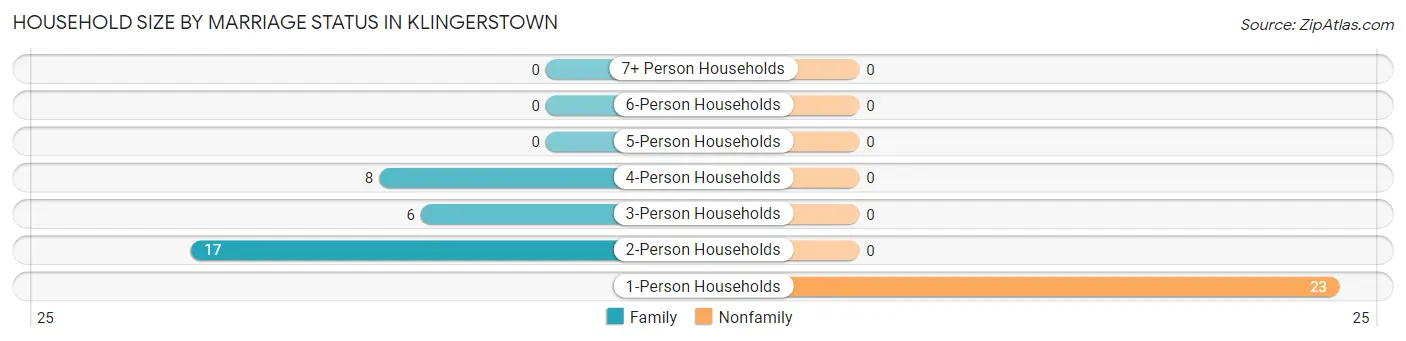
| Household Size | Family Households | Nonfamily Households |
| 1-Person Households | - | 23 (42.6%) |
| 2-Person Households | 17 (31.5%) | 0 (0.0%) |
| 3-Person Households | 6 (11.1%) | 0 (0.0%) |
| 4-Person Households | 8 (14.8%) | 0 (0.0%) |
| 5-Person Households | 0 (0.0%) | 0 (0.0%) |
| 6-Person Households | 0 (0.0%) | 0 (0.0%) |
| 7+ Person Households | 0 (0.0%) | 0 (0.0%) |
| Total | 31 (57.4%) | 23 (42.6%) |
Female Fertility in Klingerstown
Fertility by Age in Klingerstown
| Age Bracket | Women with Births | Births / 1,000 Women |
| 15 to 19 years | 0 (0.0%) | 0.0 |
| 20 to 34 years | 0 (0.0%) | 0.0 |
| 35 to 50 years | 0 (0.0%) | 0.0 |
| Total | 0 (0.0%) | 0.0 |
Fertility by Age by Marriage Status in Klingerstown
| Age Bracket | Married | Unmarried |
| 15 to 19 years | 0 (0.0%) | 0 (0.0%) |
| 20 to 34 years | 0 (0.0%) | 0 (0.0%) |
| 35 to 50 years | 0 (0.0%) | 0 (0.0%) |
| Total | 0 (0.0%) | 0 (0.0%) |
Fertility by Education in Klingerstown
| Educational Attainment | Women with Births | Births / 1,000 Women |
| Less than High School | 0 (0.0%) | 0.0 |
| High School Diploma | 0 (0.0%) | 0.0 |
| College or Associate's Degree | 0 (0.0%) | 0.0 |
| Bachelor's Degree | 0 (0.0%) | 0.0 |
| Graduate Degree | 0 (0.0%) | 0.0 |
| Total | 0 (0.0%) | 0.0 |
Fertility by Education by Marriage Status in Klingerstown
| Educational Attainment | Married | Unmarried |
| Less than High School | 0 (0.0%) | 0 (0.0%) |
| High School Diploma | 0 (0.0%) | 0 (0.0%) |
| College or Associate's Degree | 0 (0.0%) | 0 (0.0%) |
| Bachelor's Degree | 0 (0.0%) | 0 (0.0%) |
| Graduate Degree | 0 (0.0%) | 0 (0.0%) |
| Total | 0 (0.0%) | 0 (0.0%) |
Employment Characteristics in Klingerstown
Employment by Class of Employer in Klingerstown
Among the 51 employed individuals in Klingerstown, private company employees (38 | 74.5%), state government employees (6 | 11.8%), and not-for-profit organizations (3 | 5.9%) make up the most common classes of employment.
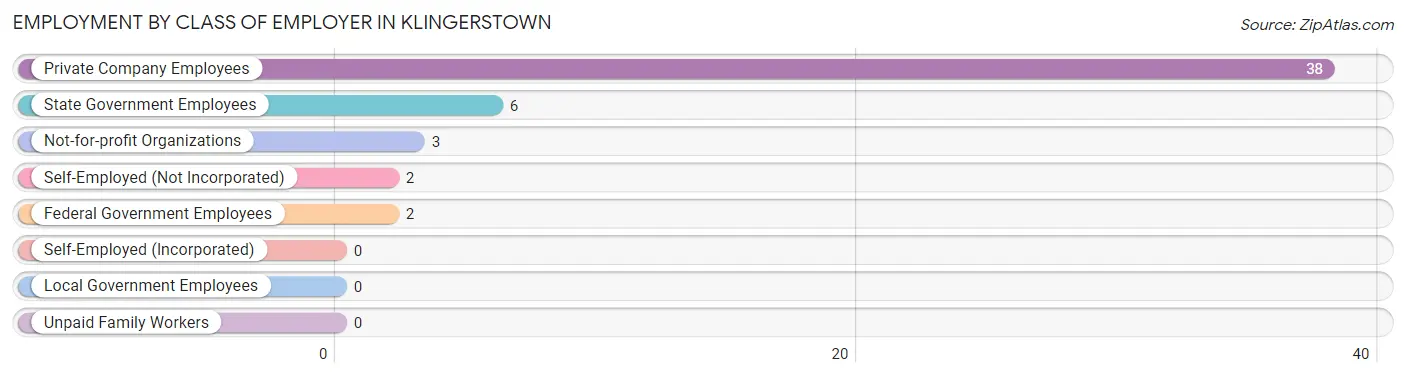
| Employer Class | # Employees | % Employees |
| Private Company Employees | 38 | 74.5% |
| Self-Employed (Incorporated) | 0 | 0.0% |
| Self-Employed (Not Incorporated) | 2 | 3.9% |
| Not-for-profit Organizations | 3 | 5.9% |
| Local Government Employees | 0 | 0.0% |
| State Government Employees | 6 | 11.8% |
| Federal Government Employees | 2 | 3.9% |
| Unpaid Family Workers | 0 | 0.0% |
| Total | 51 | 100.0% |
Employment Status by Age in Klingerstown
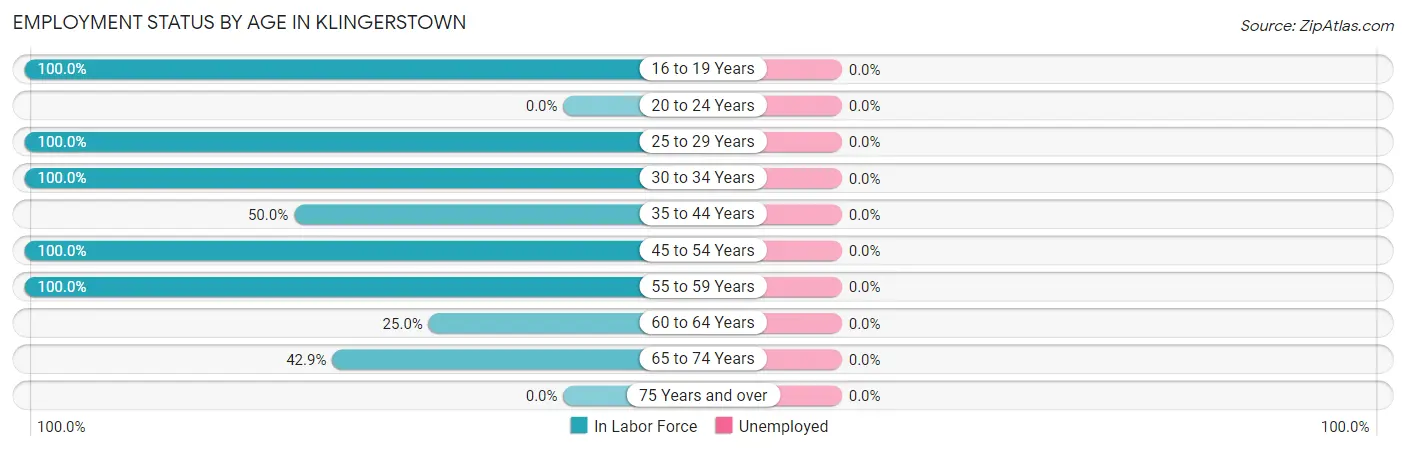
| Age Bracket | In Labor Force | Unemployed |
| 16 to 19 Years | 4 (100.0%) | 0 (0.0%) |
| 20 to 24 Years | 0 (0.0%) | 0 (0.0%) |
| 25 to 29 Years | 6 (100.0%) | 0 (0.0%) |
| 30 to 34 Years | 13 (100.0%) | 0 (0.0%) |
| 35 to 44 Years | 8 (50.0%) | 0 (0.0%) |
| 45 to 54 Years | 7 (100.0%) | 0 (0.0%) |
| 55 to 59 Years | 2 (100.0%) | 0 (0.0%) |
| 60 to 64 Years | 2 (25.0%) | 0 (0.0%) |
| 65 to 74 Years | 9 (42.9%) | 0 (0.0%) |
| 75 Years and over | 0 (0.0%) | 0 (0.0%) |
| Total | 51 (60.0%) | 0 (0.0%) |
Employment Status by Educational Attainment in Klingerstown
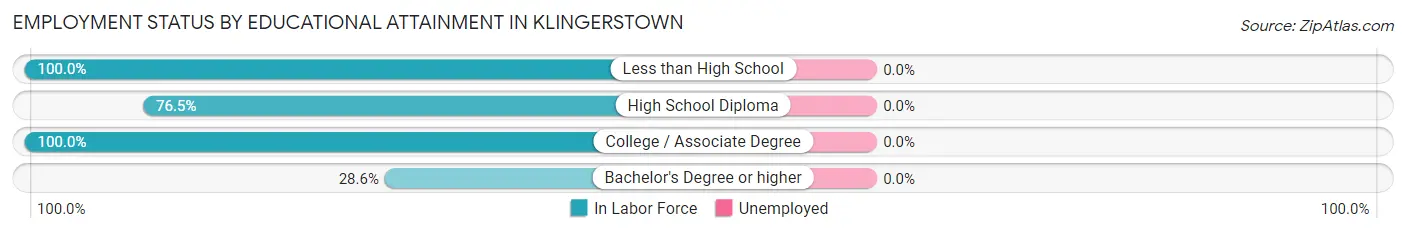
| Educational Attainment | In Labor Force | Unemployed |
| Less than High School | 8 (100.0%) | 0 (0.0%) |
| High School Diploma | 13 (76.5%) | 0 (0.0%) |
| College / Associate Degree | 13 (100.0%) | 0 (0.0%) |
| Bachelor's Degree or higher | 4 (28.6%) | 0 (0.0%) |
| Total | 38 (73.1%) | 0 (0.0%) |
Employment Occupations by Sex in Klingerstown
Management, Business, Science and Arts Occupations
The most common Management, Business, Science and Arts occupations in Klingerstown are Management (4 | 7.8%), Community & Social Service (3 | 5.9%), and Education, Arts & Media (3 | 5.9%).
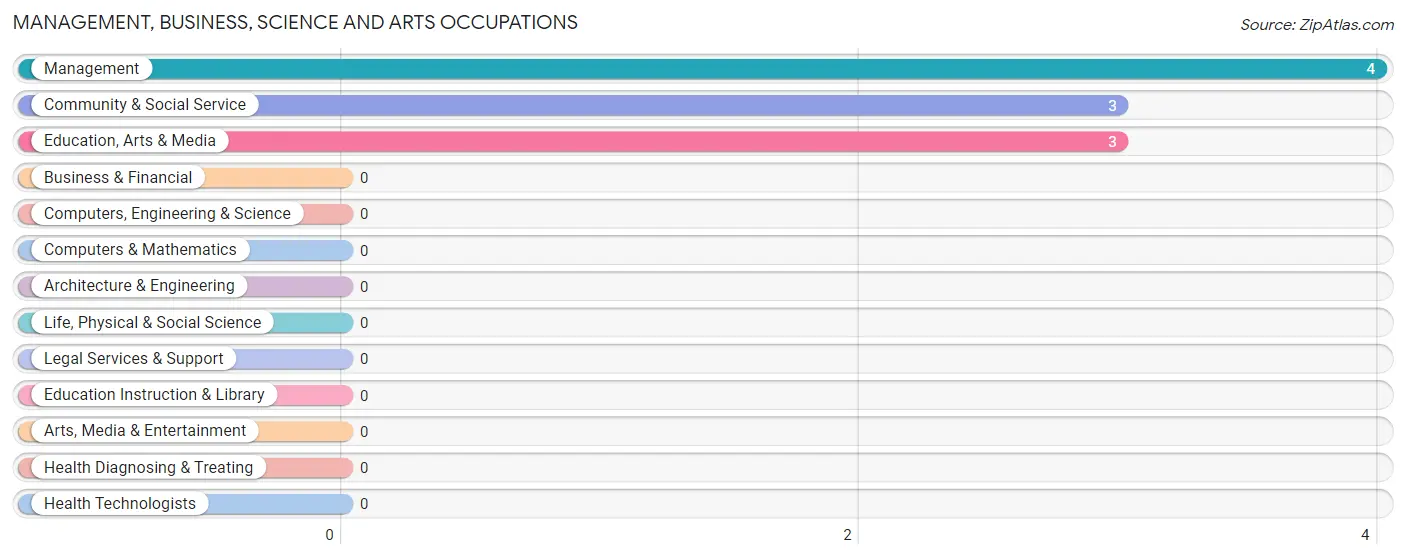
Management, Business, Science and Arts Occupations by Sex
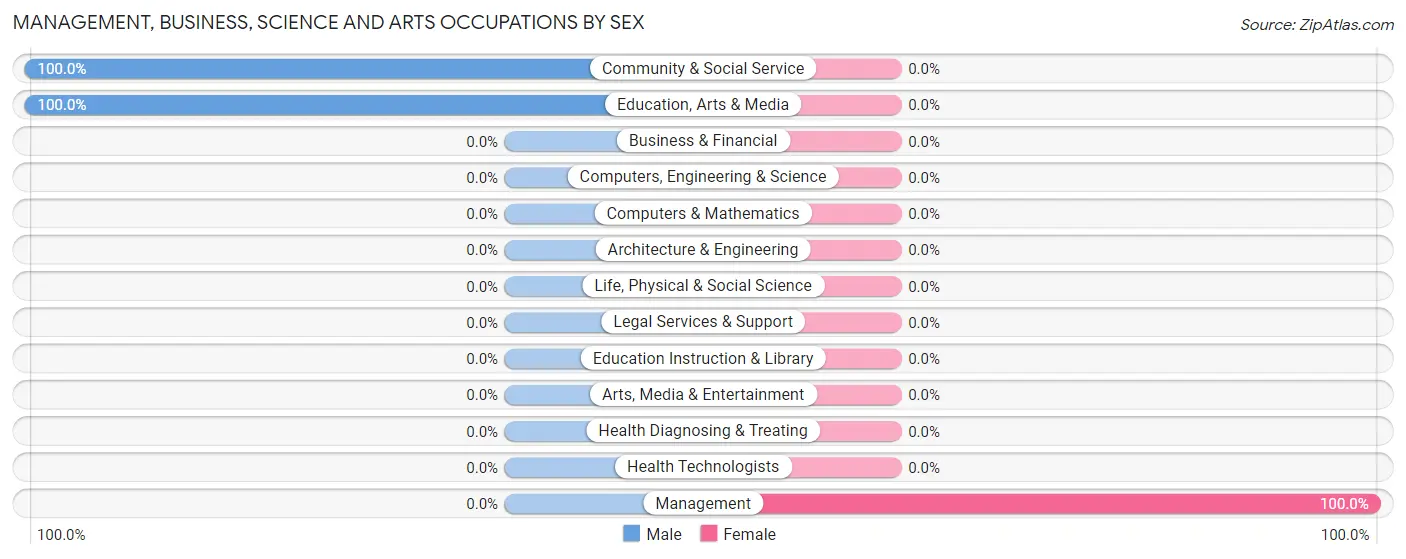
| Occupation | Male | Female |
| Management | 0 (0.0%) | 4 (100.0%) |
| Business & Financial | 0 (0.0%) | 0 (0.0%) |
| Computers, Engineering & Science | 0 (0.0%) | 0 (0.0%) |
| Computers & Mathematics | 0 (0.0%) | 0 (0.0%) |
| Architecture & Engineering | 0 (0.0%) | 0 (0.0%) |
| Life, Physical & Social Science | 0 (0.0%) | 0 (0.0%) |
| Community & Social Service | 3 (100.0%) | 0 (0.0%) |
| Education, Arts & Media | 3 (100.0%) | 0 (0.0%) |
| Legal Services & Support | 0 (0.0%) | 0 (0.0%) |
| Education Instruction & Library | 0 (0.0%) | 0 (0.0%) |
| Arts, Media & Entertainment | 0 (0.0%) | 0 (0.0%) |
| Health Diagnosing & Treating | 0 (0.0%) | 0 (0.0%) |
| Health Technologists | 0 (0.0%) | 0 (0.0%) |
| Total (Category) | 3 (42.9%) | 4 (57.1%) |
| Total (Overall) | 30 (58.8%) | 21 (41.2%) |
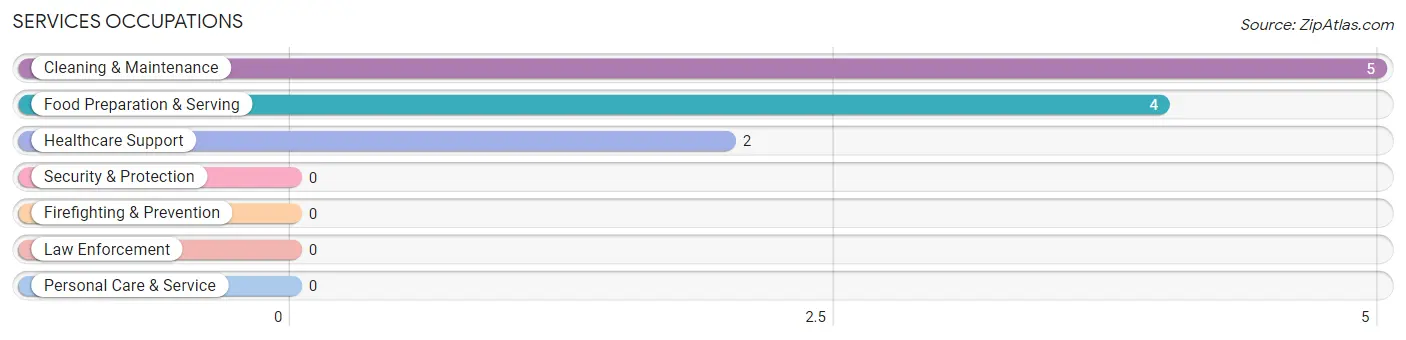
Services Occupations
The most common Services occupations in Klingerstown are Cleaning & Maintenance (5 | 9.8%), Food Preparation & Serving (4 | 7.8%), and Healthcare Support (2 | 3.9%).
Services Occupations by Sex
Within the Services occupations in Klingerstown, the most male-oriented occupations are Food Preparation & Serving (100.0%), and Cleaning & Maintenance (60.0%), while the most female-oriented occupations are Healthcare Support (100.0%), and Cleaning & Maintenance (40.0%).
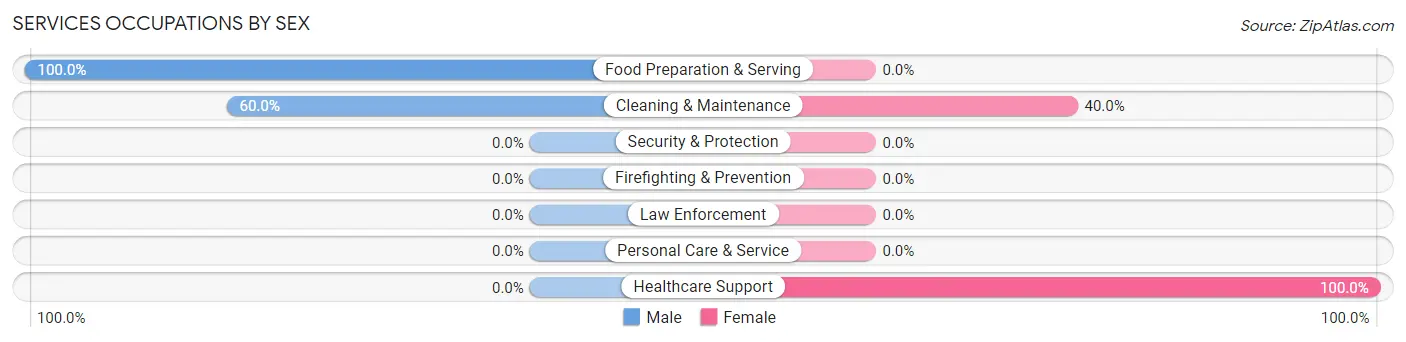
| Occupation | Male | Female |
| Healthcare Support | 0 (0.0%) | 2 (100.0%) |
| Security & Protection | 0 (0.0%) | 0 (0.0%) |
| Firefighting & Prevention | 0 (0.0%) | 0 (0.0%) |
| Law Enforcement | 0 (0.0%) | 0 (0.0%) |
| Food Preparation & Serving | 4 (100.0%) | 0 (0.0%) |
| Cleaning & Maintenance | 3 (60.0%) | 2 (40.0%) |
| Personal Care & Service | 0 (0.0%) | 0 (0.0%) |
| Total (Category) | 7 (63.6%) | 4 (36.4%) |
| Total (Overall) | 30 (58.8%) | 21 (41.2%) |
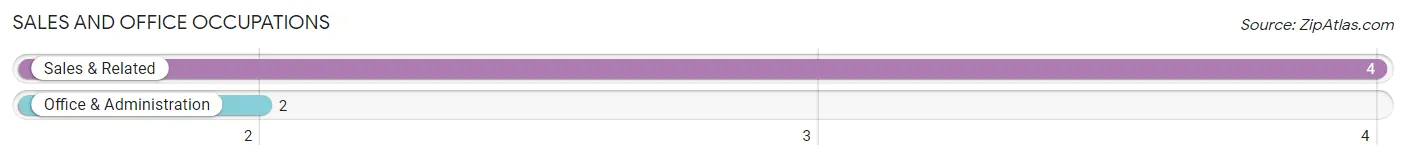
Sales and Office Occupations
The most common Sales and Office occupations in Klingerstown are Sales & Related (4 | 7.8%), and Office & Administration (2 | 3.9%).
Sales and Office Occupations by Sex
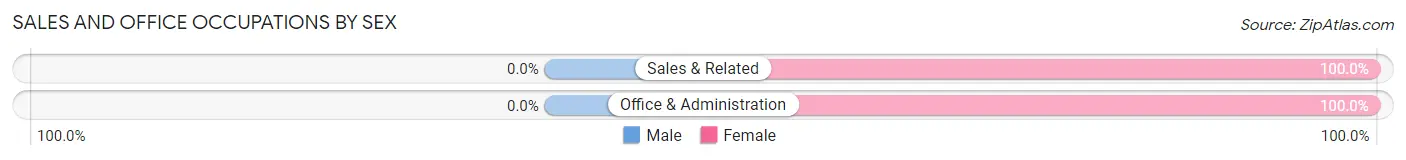
| Occupation | Male | Female |
| Sales & Related | 0 (0.0%) | 4 (100.0%) |
| Office & Administration | 0 (0.0%) | 2 (100.0%) |
| Total (Category) | 0 (0.0%) | 6 (100.0%) |
| Total (Overall) | 30 (58.8%) | 21 (41.2%) |
Natural Resources, Construction and Maintenance Occupations
The most common Natural Resources, Construction and Maintenance occupations in Klingerstown are Installation, Maintenance & Repair (4 | 7.8%), and Farming, Fishing & Forestry (2 | 3.9%).
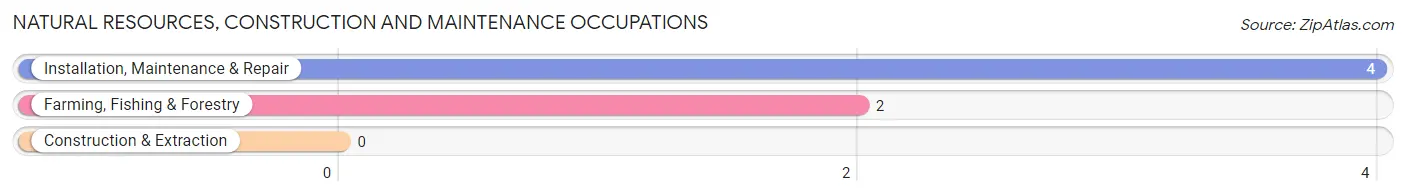
Natural Resources, Construction and Maintenance Occupations by Sex
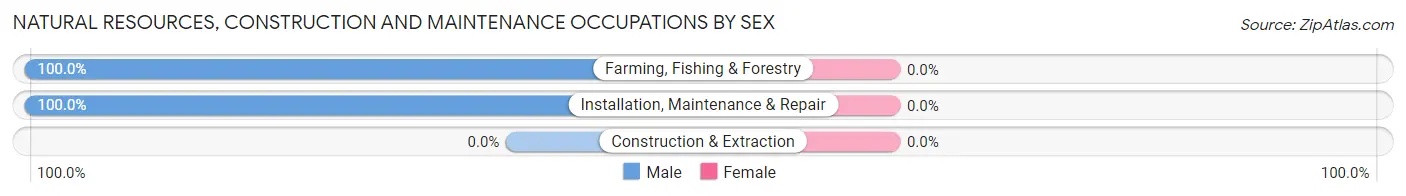
| Occupation | Male | Female |
| Farming, Fishing & Forestry | 2 (100.0%) | 0 (0.0%) |
| Construction & Extraction | 0 (0.0%) | 0 (0.0%) |
| Installation, Maintenance & Repair | 4 (100.0%) | 0 (0.0%) |
| Total (Category) | 6 (100.0%) | 0 (0.0%) |
| Total (Overall) | 30 (58.8%) | 21 (41.2%) |
Production, Transportation and Moving Occupations
The most common Production, Transportation and Moving occupations in Klingerstown are Production (8 | 15.7%), Transportation (8 | 15.7%), and Material Moving (5 | 9.8%).
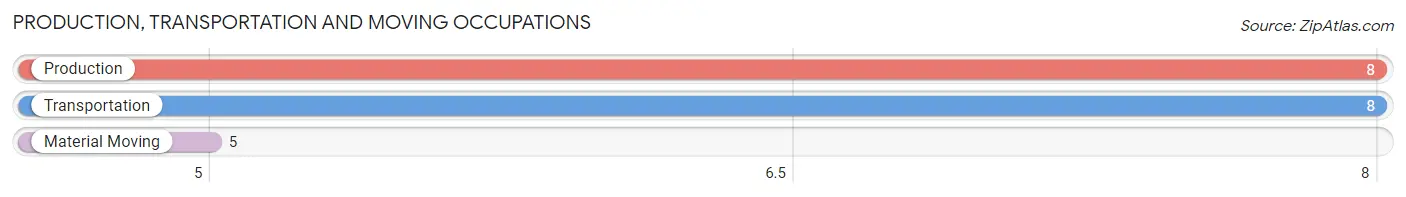
Production, Transportation and Moving Occupations by Sex
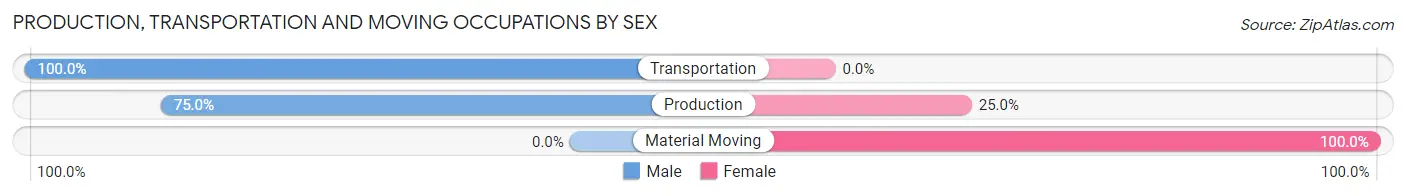
| Occupation | Male | Female |
| Production | 6 (75.0%) | 2 (25.0%) |
| Transportation | 8 (100.0%) | 0 (0.0%) |
| Material Moving | 0 (0.0%) | 5 (100.0%) |
| Total (Category) | 14 (66.7%) | 7 (33.3%) |
| Total (Overall) | 30 (58.8%) | 21 (41.2%) |
Employment Industries by Sex in Klingerstown
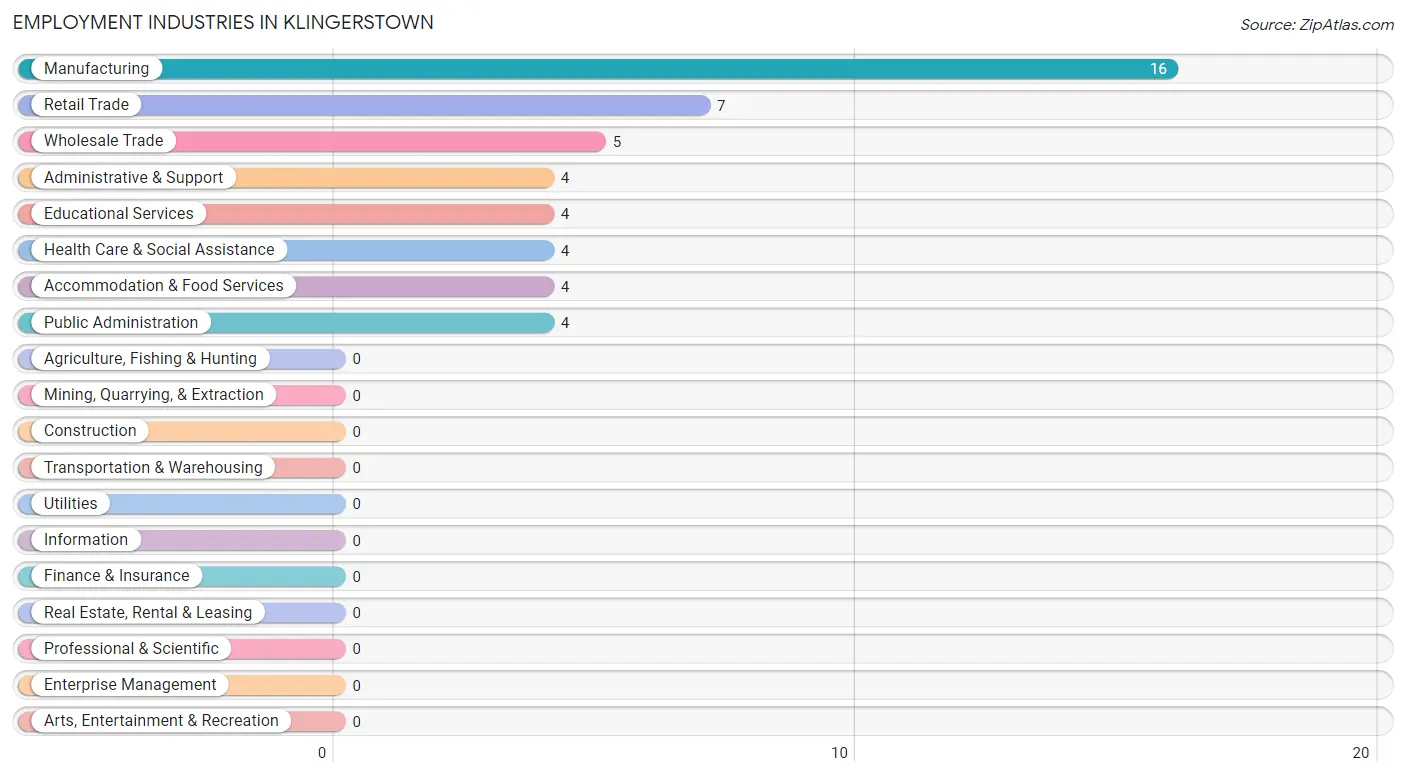
Employment Industries in Klingerstown
The major employment industries in Klingerstown include Manufacturing (16 | 31.4%), Retail Trade (7 | 13.7%), Wholesale Trade (5 | 9.8%), Administrative & Support (4 | 7.8%), and Educational Services (4 | 7.8%).
Employment Industries by Sex in Klingerstown
The Klingerstown industries that see more men than women are Administrative & Support (100.0%), Accommodation & Food Services (100.0%), and Manufacturing (87.5%), whereas the industries that tend to have a higher number of women are Wholesale Trade (100.0%), Educational Services (100.0%), and Health Care & Social Assistance (100.0%).
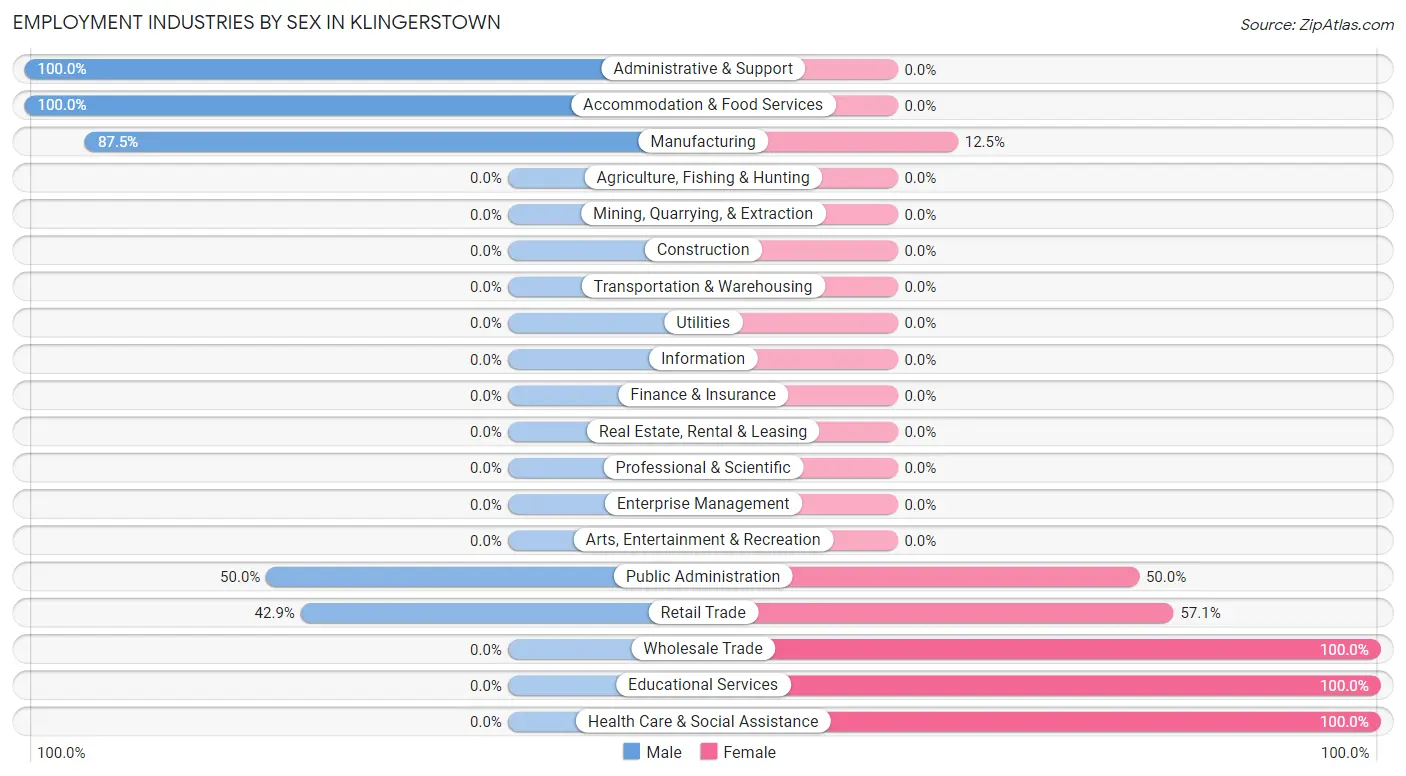
| Industry | Male | Female |
| Agriculture, Fishing & Hunting | 0 (0.0%) | 0 (0.0%) |
| Mining, Quarrying, & Extraction | 0 (0.0%) | 0 (0.0%) |
| Construction | 0 (0.0%) | 0 (0.0%) |
| Manufacturing | 14 (87.5%) | 2 (12.5%) |
| Wholesale Trade | 0 (0.0%) | 5 (100.0%) |
| Retail Trade | 3 (42.9%) | 4 (57.1%) |
| Transportation & Warehousing | 0 (0.0%) | 0 (0.0%) |
| Utilities | 0 (0.0%) | 0 (0.0%) |
| Information | 0 (0.0%) | 0 (0.0%) |
| Finance & Insurance | 0 (0.0%) | 0 (0.0%) |
| Real Estate, Rental & Leasing | 0 (0.0%) | 0 (0.0%) |
| Professional & Scientific | 0 (0.0%) | 0 (0.0%) |
| Enterprise Management | 0 (0.0%) | 0 (0.0%) |
| Administrative & Support | 4 (100.0%) | 0 (0.0%) |
| Educational Services | 0 (0.0%) | 4 (100.0%) |
| Health Care & Social Assistance | 0 (0.0%) | 4 (100.0%) |
| Arts, Entertainment & Recreation | 0 (0.0%) | 0 (0.0%) |
| Accommodation & Food Services | 4 (100.0%) | 0 (0.0%) |
| Public Administration | 2 (50.0%) | 2 (50.0%) |
| Total | 30 (58.8%) | 21 (41.2%) |
Education in Klingerstown
School Enrollment in Klingerstown
The most common levels of schooling among the 19 students in Klingerstown are elementary school (7 | 36.8%), kindergarten (5 | 26.3%), and college / undergraduate (4 | 21.0%).
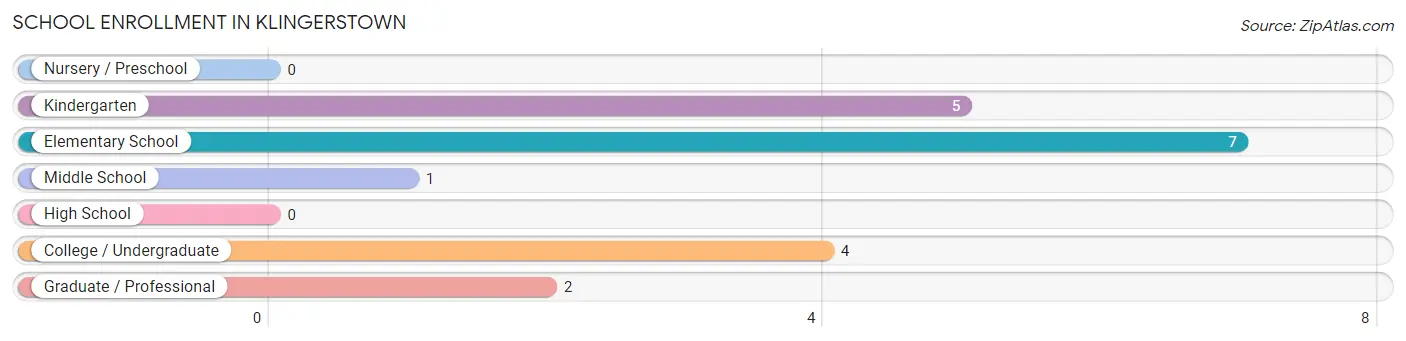
| School Level | # Students | % Students |
| Nursery / Preschool | 0 | 0.0% |
| Kindergarten | 5 | 26.3% |
| Elementary School | 7 | 36.8% |
| Middle School | 1 | 5.3% |
| High School | 0 | 0.0% |
| College / Undergraduate | 4 | 21.0% |
| Graduate / Professional | 2 | 10.5% |
| Total | 19 | 100.0% |
School Enrollment by Age by Funding Source in Klingerstown
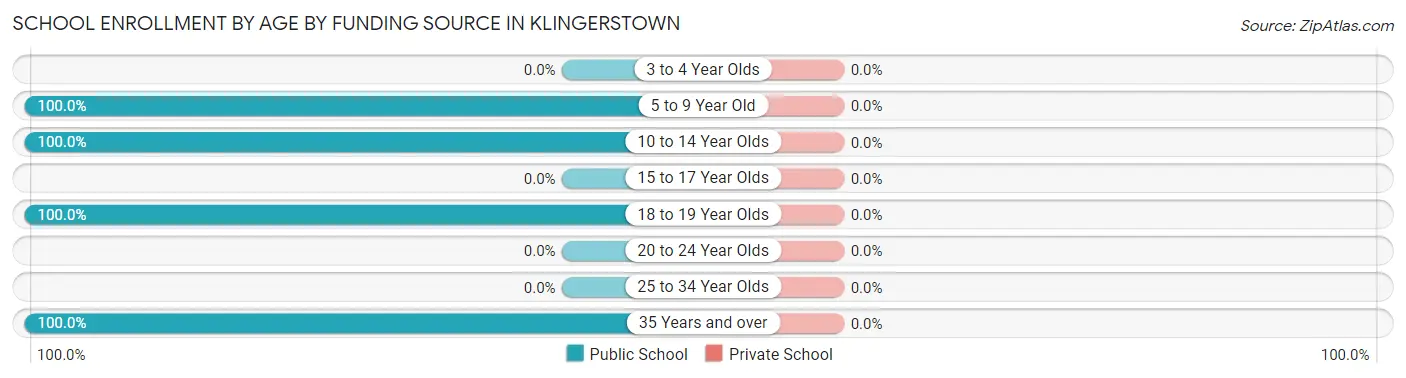
| Age Bracket | Public School | Private School |
| 3 to 4 Year Olds | 0 (0.0%) | 0 (0.0%) |
| 5 to 9 Year Old | 12 (100.0%) | 0 (0.0%) |
| 10 to 14 Year Olds | 1 (100.0%) | 0 (0.0%) |
| 15 to 17 Year Olds | 0 (0.0%) | 0 (0.0%) |
| 18 to 19 Year Olds | 4 (100.0%) | 0 (0.0%) |
| 20 to 24 Year Olds | 0 (0.0%) | 0 (0.0%) |
| 25 to 34 Year Olds | 0 (0.0%) | 0 (0.0%) |
| 35 Years and over | 2 (100.0%) | 0 (0.0%) |
| Total | 19 (100.0%) | 0 (0.0%) |
Educational Attainment by Field of Study in Klingerstown
Social sciences (7 | 28.0%), psychology (4 | 16.0%), multidisciplinary studies (4 | 16.0%), liberal arts & history (4 | 16.0%), and education (2 | 8.0%) are the most common fields of study among 25 individuals in Klingerstown who have obtained a bachelor's degree or higher.
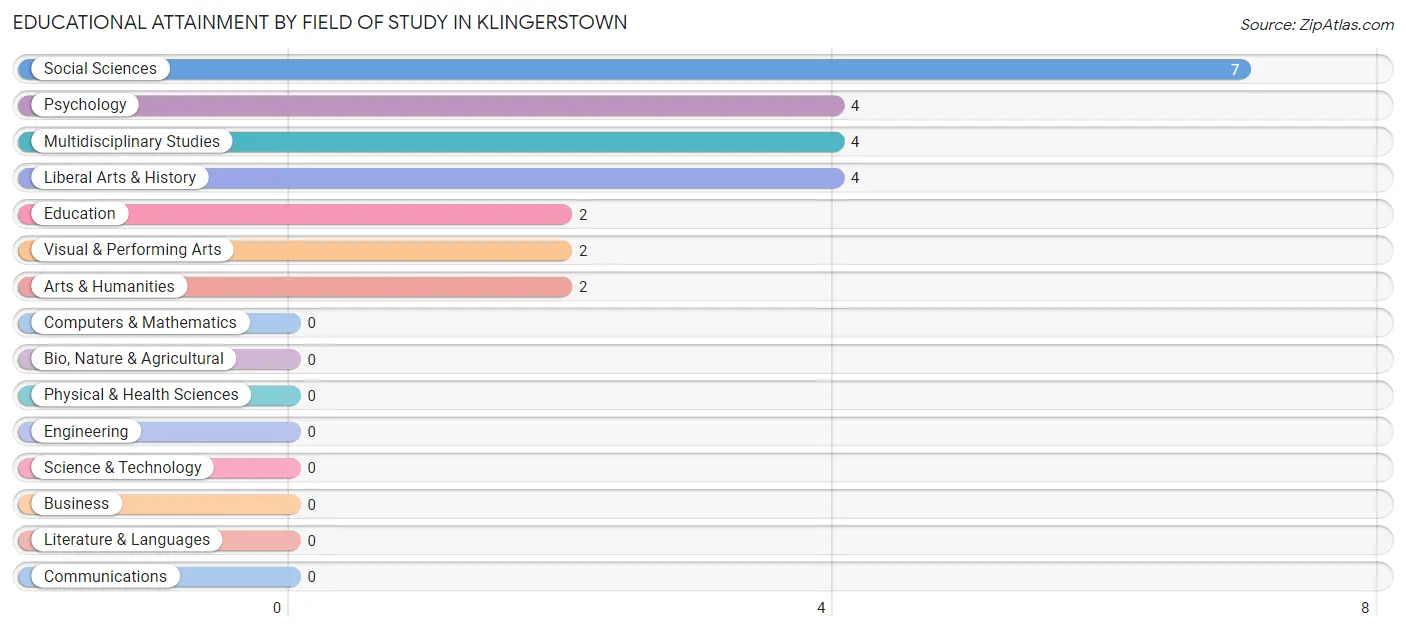
| Field of Study | # Graduates | % Graduates |
| Computers & Mathematics | 0 | 0.0% |
| Bio, Nature & Agricultural | 0 | 0.0% |
| Physical & Health Sciences | 0 | 0.0% |
| Psychology | 4 | 16.0% |
| Social Sciences | 7 | 28.0% |
| Engineering | 0 | 0.0% |
| Multidisciplinary Studies | 4 | 16.0% |
| Science & Technology | 0 | 0.0% |
| Business | 0 | 0.0% |
| Education | 2 | 8.0% |
| Literature & Languages | 0 | 0.0% |
| Liberal Arts & History | 4 | 16.0% |
| Visual & Performing Arts | 2 | 8.0% |
| Communications | 0 | 0.0% |
| Arts & Humanities | 2 | 8.0% |
| Total | 25 | 100.0% |
Transportation & Commute in Klingerstown
Vehicle Availability by Sex in Klingerstown
The most prevalent vehicle ownership categories in Klingerstown are males with 2 vehicles (24, accounting for 80.0%) and females with 2 vehicles (6, making up 114.3%).
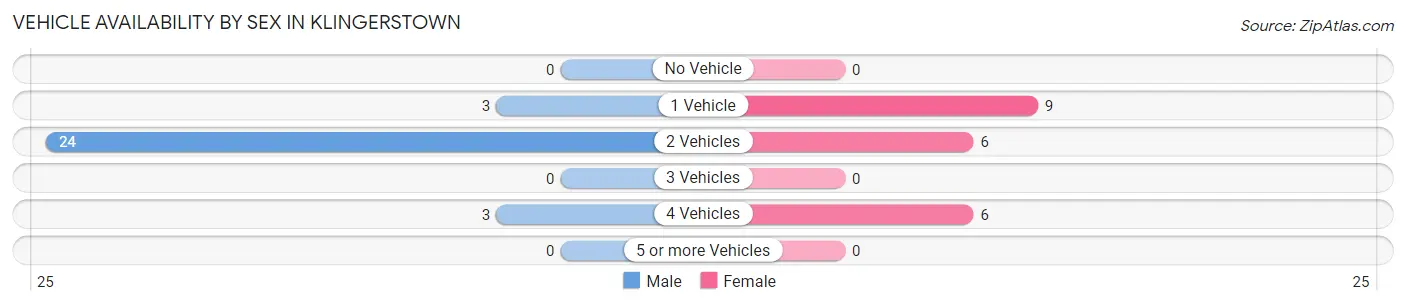
| Vehicles Available | Male | Female |
| No Vehicle | 0 (0.0%) | 0 (0.0%) |
| 1 Vehicle | 3 (10.0%) | 9 (42.9%) |
| 2 Vehicles | 24 (80.0%) | 6 (28.6%) |
| 3 Vehicles | 0 (0.0%) | 0 (0.0%) |
| 4 Vehicles | 3 (10.0%) | 6 (28.6%) |
| 5 or more Vehicles | 0 (0.0%) | 0 (0.0%) |
| Total | 30 (100.0%) | 21 (100.0%) |
Commute Time in Klingerstown
The most frequently occuring commute durations in Klingerstown are 15 to 19 minutes (16 commuters, 38.1%), 25 to 29 minutes (11 commuters, 26.2%), and 45 to 59 minutes (5 commuters, 11.9%).
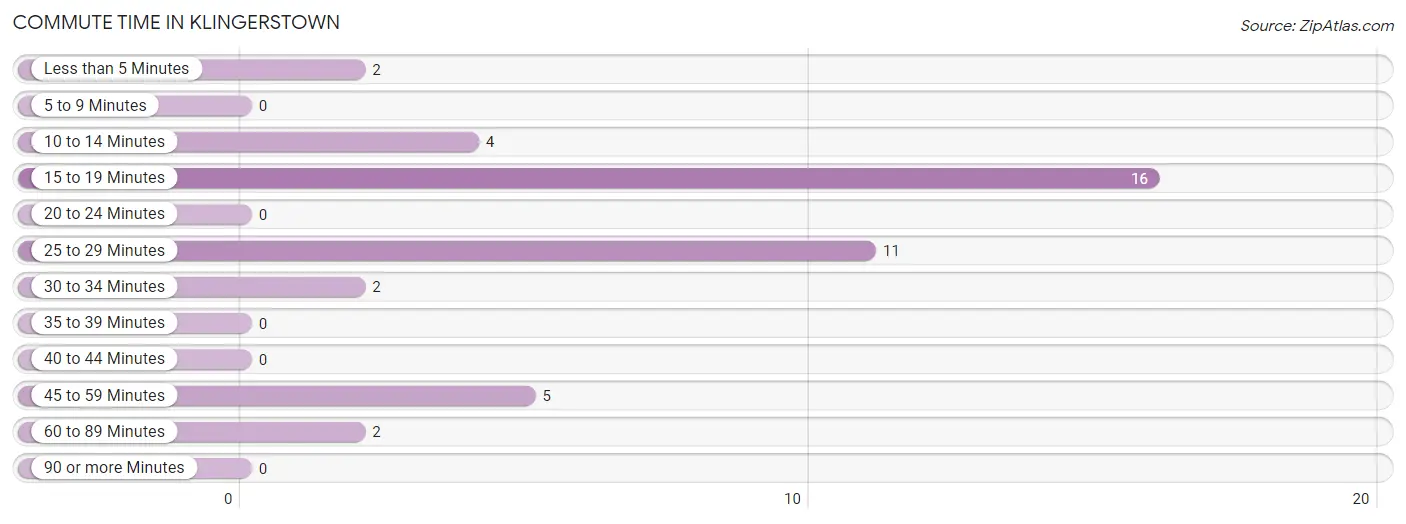
| Commute Time | # Commuters | % Commuters |
| Less than 5 Minutes | 2 | 4.8% |
| 5 to 9 Minutes | 0 | 0.0% |
| 10 to 14 Minutes | 4 | 9.5% |
| 15 to 19 Minutes | 16 | 38.1% |
| 20 to 24 Minutes | 0 | 0.0% |
| 25 to 29 Minutes | 11 | 26.2% |
| 30 to 34 Minutes | 2 | 4.8% |
| 35 to 39 Minutes | 0 | 0.0% |
| 40 to 44 Minutes | 0 | 0.0% |
| 45 to 59 Minutes | 5 | 11.9% |
| 60 to 89 Minutes | 2 | 4.8% |
| 90 or more Minutes | 0 | 0.0% |
Commute Time by Sex in Klingerstown
The most common commute times in Klingerstown are 15 to 19 minutes (16 commuters, 59.3%) for males and 45 to 59 minutes (5 commuters, 33.3%) for females.
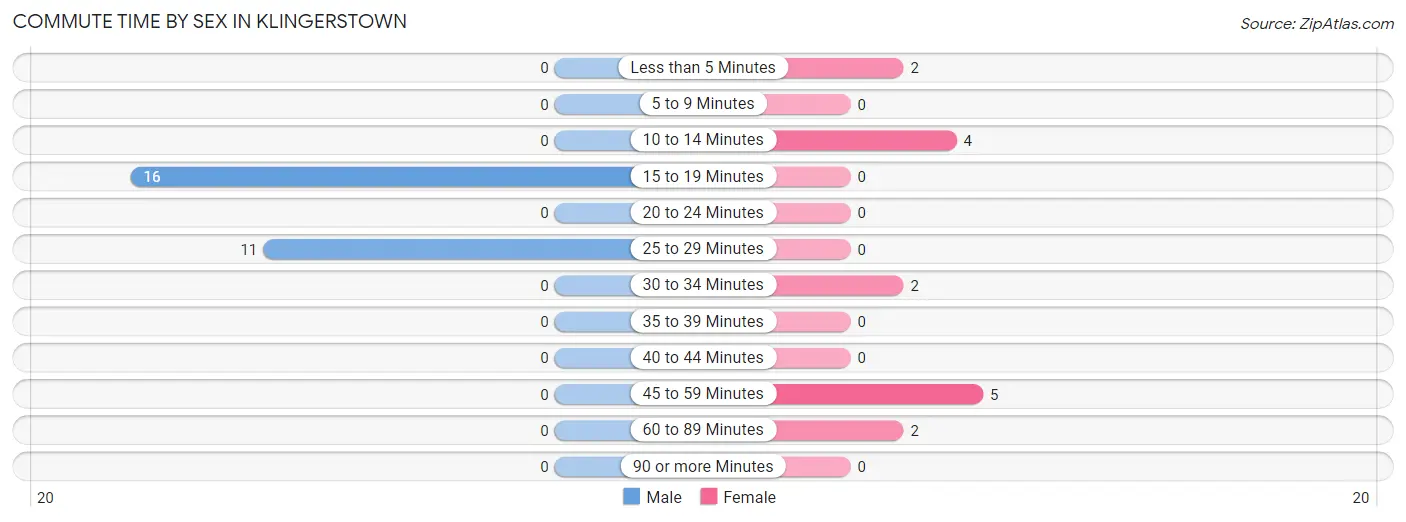
| Commute Time | Male | Female |
| Less than 5 Minutes | 0 (0.0%) | 2 (13.3%) |
| 5 to 9 Minutes | 0 (0.0%) | 0 (0.0%) |
| 10 to 14 Minutes | 0 (0.0%) | 4 (26.7%) |
| 15 to 19 Minutes | 16 (59.3%) | 0 (0.0%) |
| 20 to 24 Minutes | 0 (0.0%) | 0 (0.0%) |
| 25 to 29 Minutes | 11 (40.7%) | 0 (0.0%) |
| 30 to 34 Minutes | 0 (0.0%) | 2 (13.3%) |
| 35 to 39 Minutes | 0 (0.0%) | 0 (0.0%) |
| 40 to 44 Minutes | 0 (0.0%) | 0 (0.0%) |
| 45 to 59 Minutes | 0 (0.0%) | 5 (33.3%) |
| 60 to 89 Minutes | 0 (0.0%) | 2 (13.3%) |
| 90 or more Minutes | 0 (0.0%) | 0 (0.0%) |
Time of Departure to Work by Sex in Klingerstown
The most frequent times of departure to work in Klingerstown are 6:30 AM to 6:59 AM (14, 51.8%) for males and 4:00 PM to 11:59 PM (7, 46.7%) for females.
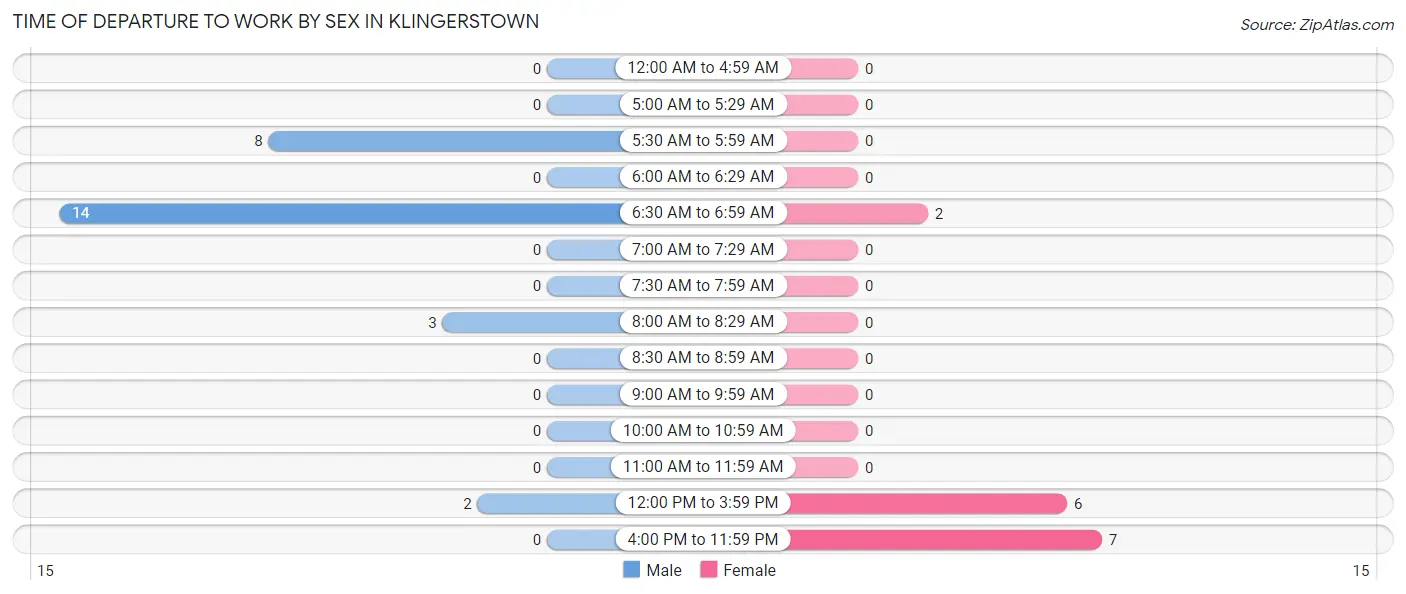
| Time of Departure | Male | Female |
| 12:00 AM to 4:59 AM | 0 (0.0%) | 0 (0.0%) |
| 5:00 AM to 5:29 AM | 0 (0.0%) | 0 (0.0%) |
| 5:30 AM to 5:59 AM | 8 (29.6%) | 0 (0.0%) |
| 6:00 AM to 6:29 AM | 0 (0.0%) | 0 (0.0%) |
| 6:30 AM to 6:59 AM | 14 (51.8%) | 2 (13.3%) |
| 7:00 AM to 7:29 AM | 0 (0.0%) | 0 (0.0%) |
| 7:30 AM to 7:59 AM | 0 (0.0%) | 0 (0.0%) |
| 8:00 AM to 8:29 AM | 3 (11.1%) | 0 (0.0%) |
| 8:30 AM to 8:59 AM | 0 (0.0%) | 0 (0.0%) |
| 9:00 AM to 9:59 AM | 0 (0.0%) | 0 (0.0%) |
| 10:00 AM to 10:59 AM | 0 (0.0%) | 0 (0.0%) |
| 11:00 AM to 11:59 AM | 0 (0.0%) | 0 (0.0%) |
| 12:00 PM to 3:59 PM | 2 (7.4%) | 6 (40.0%) |
| 4:00 PM to 11:59 PM | 0 (0.0%) | 7 (46.7%) |
| Total | 27 (100.0%) | 15 (100.0%) |
Housing Occupancy in Klingerstown
Occupancy by Ownership in Klingerstown
Of the total 54 dwellings in Klingerstown, owner-occupied units account for 23 (42.6%), while renter-occupied units make up 31 (57.4%).
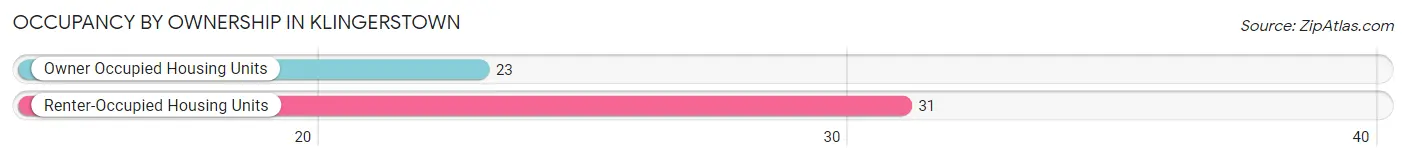
| Occupancy | # Housing Units | % Housing Units |
| Owner Occupied Housing Units | 23 | 42.6% |
| Renter-Occupied Housing Units | 31 | 57.4% |
| Total Occupied Housing Units | 54 | 100.0% |
Occupancy by Household Size in Klingerstown
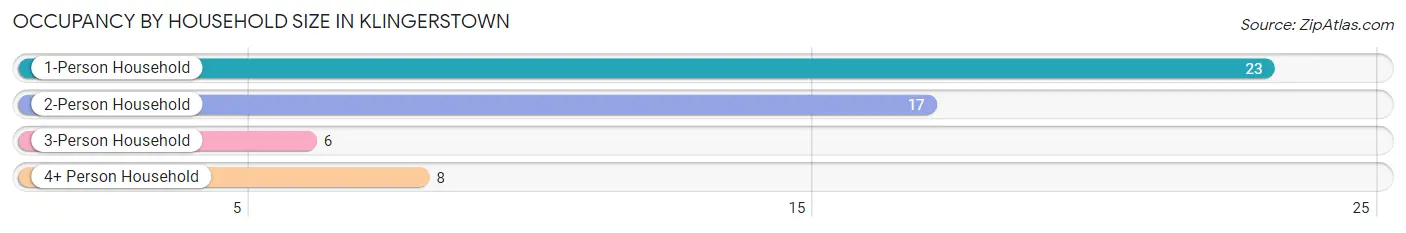
| Household Size | # Housing Units | % Housing Units |
| 1-Person Household | 23 | 42.6% |
| 2-Person Household | 17 | 31.5% |
| 3-Person Household | 6 | 11.1% |
| 4+ Person Household | 8 | 14.8% |
| Total Housing Units | 54 | 100.0% |
Occupancy by Ownership by Household Size in Klingerstown
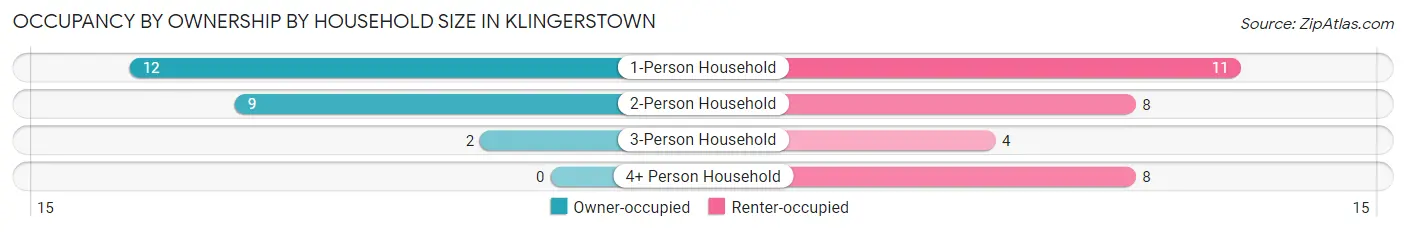
| Household Size | Owner-occupied | Renter-occupied |
| 1-Person Household | 12 (52.2%) | 11 (47.8%) |
| 2-Person Household | 9 (52.9%) | 8 (47.1%) |
| 3-Person Household | 2 (33.3%) | 4 (66.7%) |
| 4+ Person Household | 0 (0.0%) | 8 (100.0%) |
| Total Housing Units | 23 (42.6%) | 31 (57.4%) |
Occupancy by Educational Attainment in Klingerstown
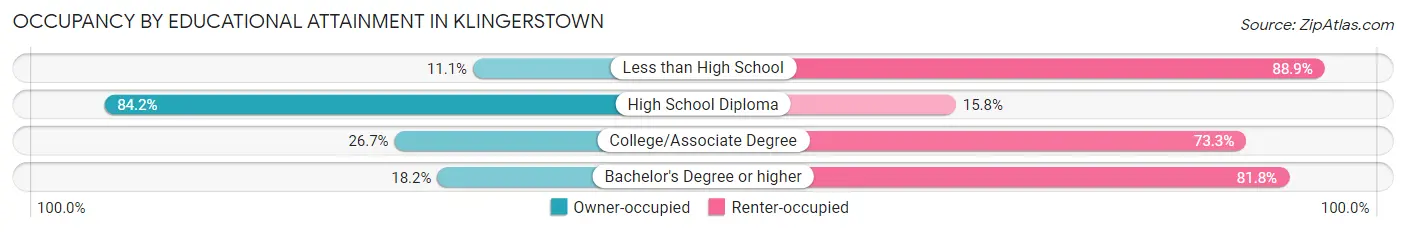
| Household Size | Owner-occupied | Renter-occupied |
| Less than High School | 1 (11.1%) | 8 (88.9%) |
| High School Diploma | 16 (84.2%) | 3 (15.8%) |
| College/Associate Degree | 4 (26.7%) | 11 (73.3%) |
| Bachelor's Degree or higher | 2 (18.2%) | 9 (81.8%) |
Occupancy by Age of Householder in Klingerstown
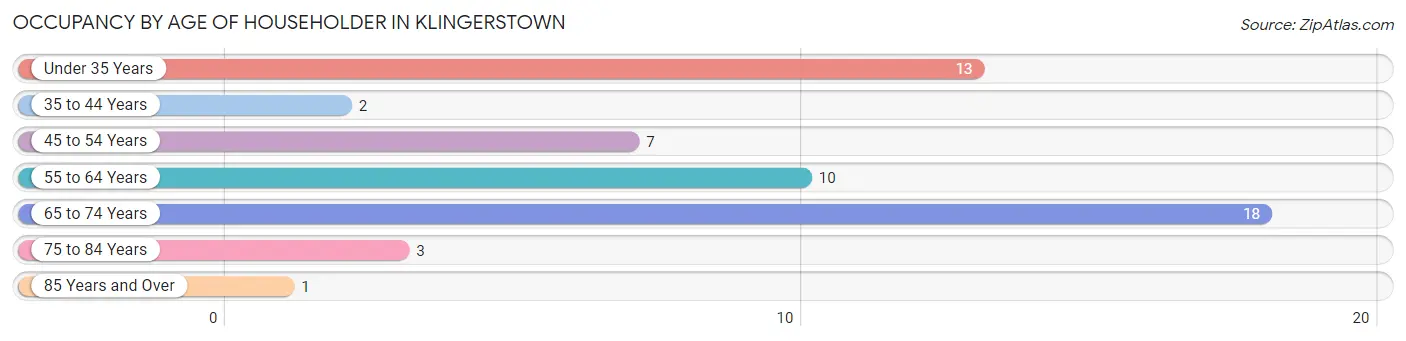
| Age Bracket | # Households | % Households |
| Under 35 Years | 13 | 24.1% |
| 35 to 44 Years | 2 | 3.7% |
| 45 to 54 Years | 7 | 13.0% |
| 55 to 64 Years | 10 | 18.5% |
| 65 to 74 Years | 18 | 33.3% |
| 75 to 84 Years | 3 | 5.6% |
| 85 Years and Over | 1 | 1.8% |
| Total | 54 | 100.0% |
Housing Finances in Klingerstown
Median Income by Occupancy in Klingerstown
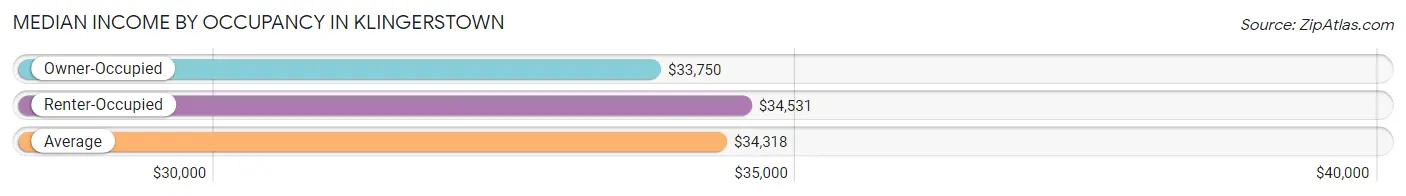
| Occupancy Type | # Households | Median Income |
| Owner-Occupied | 23 (42.6%) | $33,750 |
| Renter-Occupied | 31 (57.4%) | $34,531 |
| Average | 54 (100.0%) | $34,318 |
Occupancy by Householder Income Bracket in Klingerstown
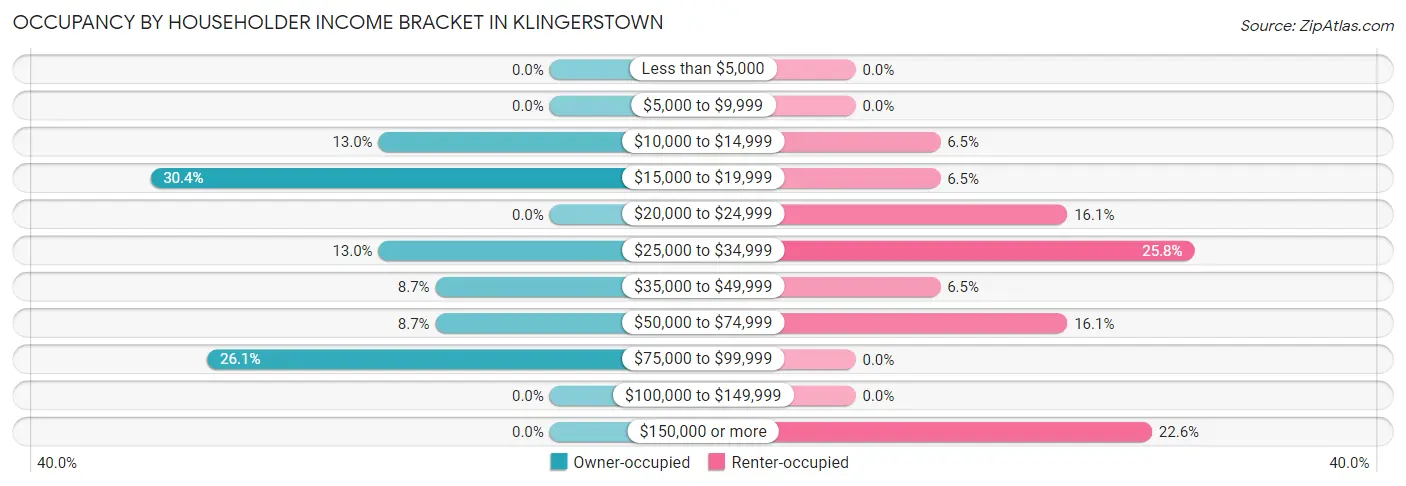
| Income Bracket | Owner-occupied | Renter-occupied |
| Less than $5,000 | 0 (0.0%) | 0 (0.0%) |
| $5,000 to $9,999 | 0 (0.0%) | 0 (0.0%) |
| $10,000 to $14,999 | 3 (13.0%) | 2 (6.5%) |
| $15,000 to $19,999 | 7 (30.4%) | 2 (6.5%) |
| $20,000 to $24,999 | 0 (0.0%) | 5 (16.1%) |
| $25,000 to $34,999 | 3 (13.0%) | 8 (25.8%) |
| $35,000 to $49,999 | 2 (8.7%) | 2 (6.5%) |
| $50,000 to $74,999 | 2 (8.7%) | 5 (16.1%) |
| $75,000 to $99,999 | 6 (26.1%) | 0 (0.0%) |
| $100,000 to $149,999 | 0 (0.0%) | 0 (0.0%) |
| $150,000 or more | 0 (0.0%) | 7 (22.6%) |
| Total | 23 (100.0%) | 31 (100.0%) |
Monthly Housing Cost Tiers in Klingerstown
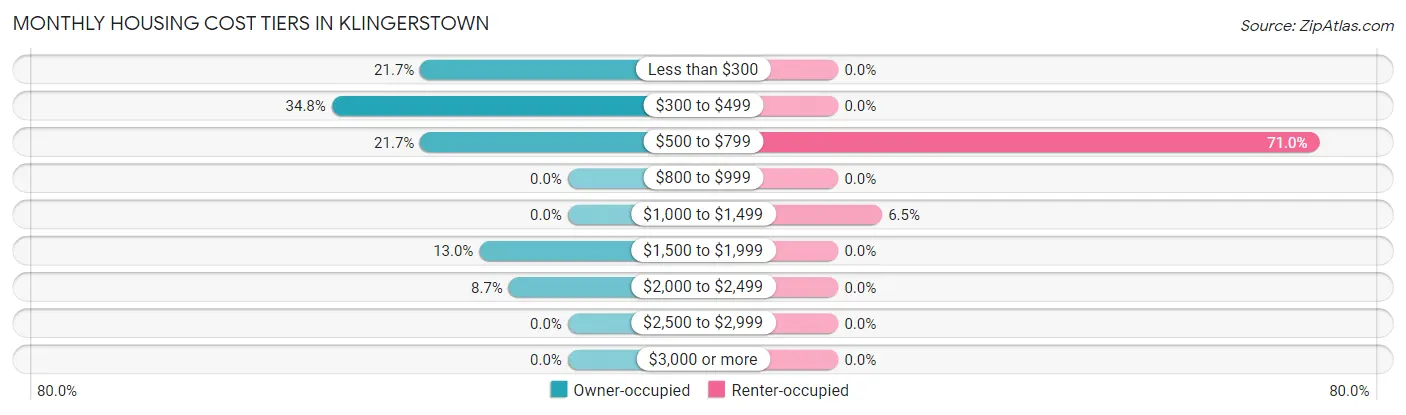
| Monthly Cost | Owner-occupied | Renter-occupied |
| Less than $300 | 5 (21.7%) | 0 (0.0%) |
| $300 to $499 | 8 (34.8%) | 0 (0.0%) |
| $500 to $799 | 5 (21.7%) | 22 (71.0%) |
| $800 to $999 | 0 (0.0%) | 0 (0.0%) |
| $1,000 to $1,499 | 0 (0.0%) | 2 (6.5%) |
| $1,500 to $1,999 | 3 (13.0%) | 0 (0.0%) |
| $2,000 to $2,499 | 2 (8.7%) | 0 (0.0%) |
| $2,500 to $2,999 | 0 (0.0%) | 0 (0.0%) |
| $3,000 or more | 0 (0.0%) | 0 (0.0%) |
| Total | 23 (100.0%) | 31 (100.0%) |
Physical Housing Characteristics in Klingerstown
Housing Structures in Klingerstown
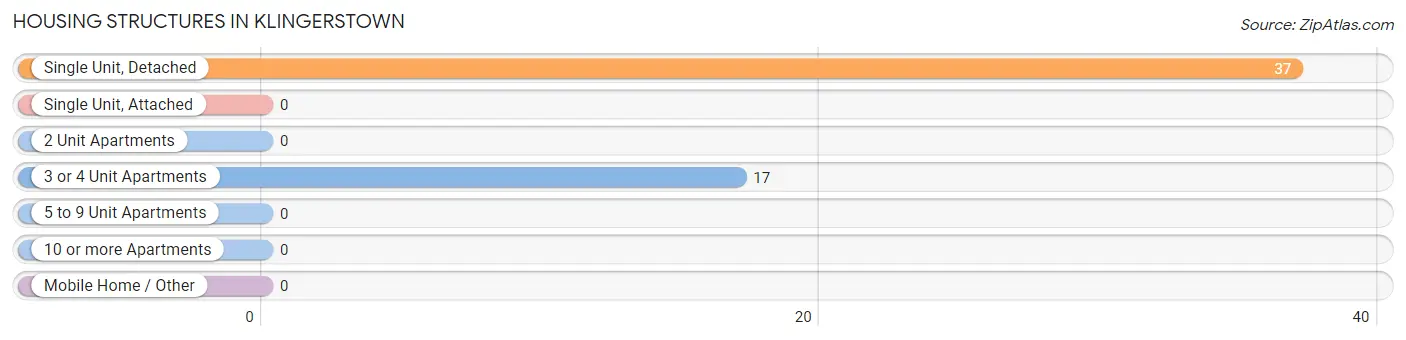
| Structure Type | # Housing Units | % Housing Units |
| Single Unit, Detached | 37 | 68.5% |
| Single Unit, Attached | 0 | 0.0% |
| 2 Unit Apartments | 0 | 0.0% |
| 3 or 4 Unit Apartments | 17 | 31.5% |
| 5 to 9 Unit Apartments | 0 | 0.0% |
| 10 or more Apartments | 0 | 0.0% |
| Mobile Home / Other | 0 | 0.0% |
| Total | 54 | 100.0% |
Housing Structures by Occupancy in Klingerstown
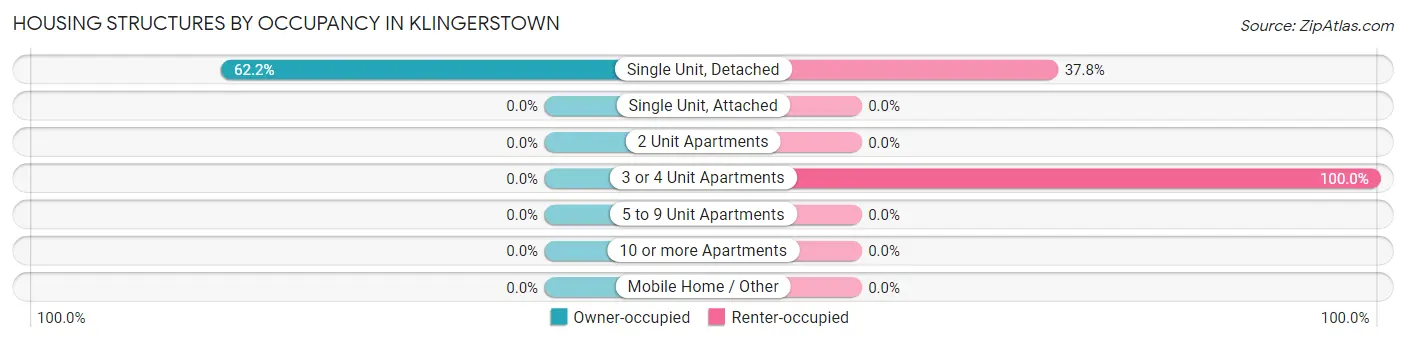
| Structure Type | Owner-occupied | Renter-occupied |
| Single Unit, Detached | 23 (62.2%) | 14 (37.8%) |
| Single Unit, Attached | 0 (0.0%) | 0 (0.0%) |
| 2 Unit Apartments | 0 (0.0%) | 0 (0.0%) |
| 3 or 4 Unit Apartments | 0 (0.0%) | 17 (100.0%) |
| 5 to 9 Unit Apartments | 0 (0.0%) | 0 (0.0%) |
| 10 or more Apartments | 0 (0.0%) | 0 (0.0%) |
| Mobile Home / Other | 0 (0.0%) | 0 (0.0%) |
| Total | 23 (42.6%) | 31 (57.4%) |
Housing Structures by Number of Rooms in Klingerstown
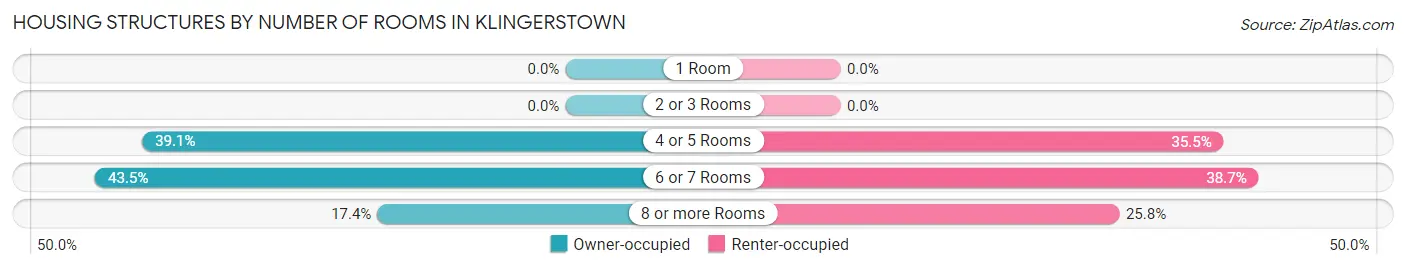
| Number of Rooms | Owner-occupied | Renter-occupied |
| 1 Room | 0 (0.0%) | 0 (0.0%) |
| 2 or 3 Rooms | 0 (0.0%) | 0 (0.0%) |
| 4 or 5 Rooms | 9 (39.1%) | 11 (35.5%) |
| 6 or 7 Rooms | 10 (43.5%) | 12 (38.7%) |
| 8 or more Rooms | 4 (17.4%) | 8 (25.8%) |
| Total | 23 (100.0%) | 31 (100.0%) |
Housing Structure by Heating Type in Klingerstown
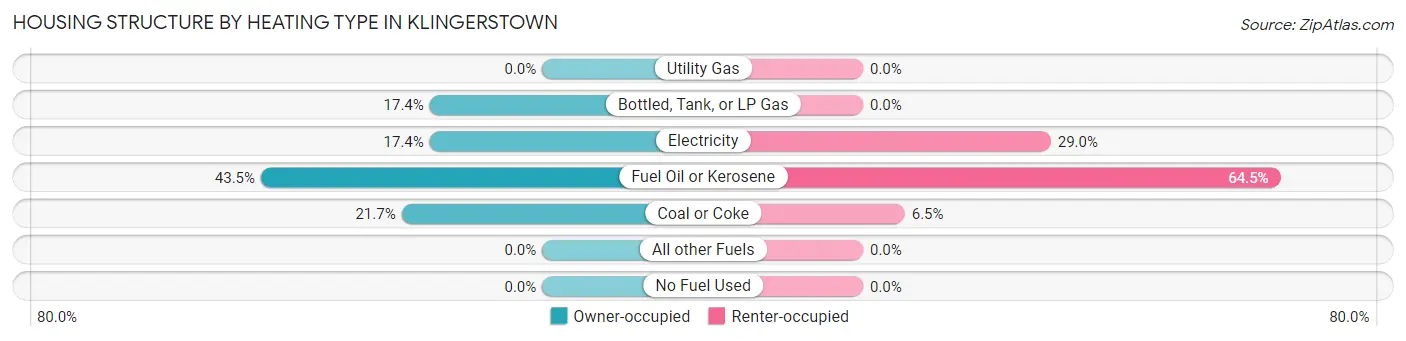
| Heating Type | Owner-occupied | Renter-occupied |
| Utility Gas | 0 (0.0%) | 0 (0.0%) |
| Bottled, Tank, or LP Gas | 4 (17.4%) | 0 (0.0%) |
| Electricity | 4 (17.4%) | 9 (29.0%) |
| Fuel Oil or Kerosene | 10 (43.5%) | 20 (64.5%) |
| Coal or Coke | 5 (21.7%) | 2 (6.5%) |
| All other Fuels | 0 (0.0%) | 0 (0.0%) |
| No Fuel Used | 0 (0.0%) | 0 (0.0%) |
| Total | 23 (100.0%) | 31 (100.0%) |
Household Vehicle Usage in Klingerstown
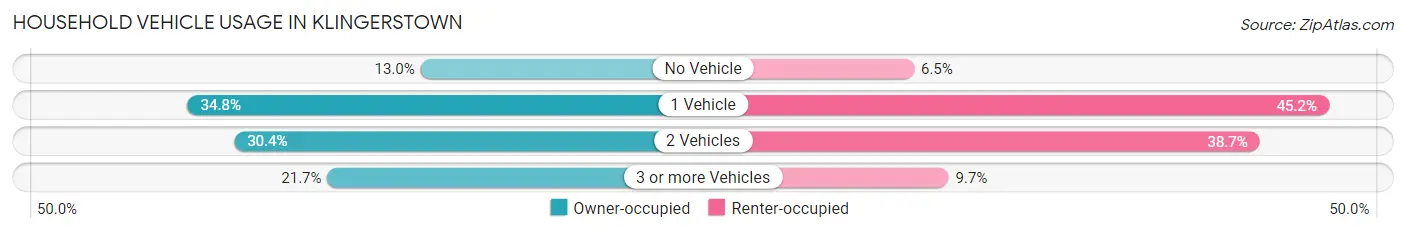
| Vehicles per Household | Owner-occupied | Renter-occupied |
| No Vehicle | 3 (13.0%) | 2 (6.5%) |
| 1 Vehicle | 8 (34.8%) | 14 (45.2%) |
| 2 Vehicles | 7 (30.4%) | 12 (38.7%) |
| 3 or more Vehicles | 5 (21.7%) | 3 (9.7%) |
| Total | 23 (100.0%) | 31 (100.0%) |
Real Estate & Mortgages in Klingerstown
Real Estate and Mortgage Overview in Klingerstown
| Characteristic | Without Mortgage | With Mortgage |
| Housing Units | 18 | 5 |
| Median Property Value | - | - |
| Median Household Income | $33,750 | $0 |
| Monthly Housing Costs | $433 | $0 |
| Real Estate Taxes | $1,250 | $0 |
Property Value by Mortgage Status in Klingerstown
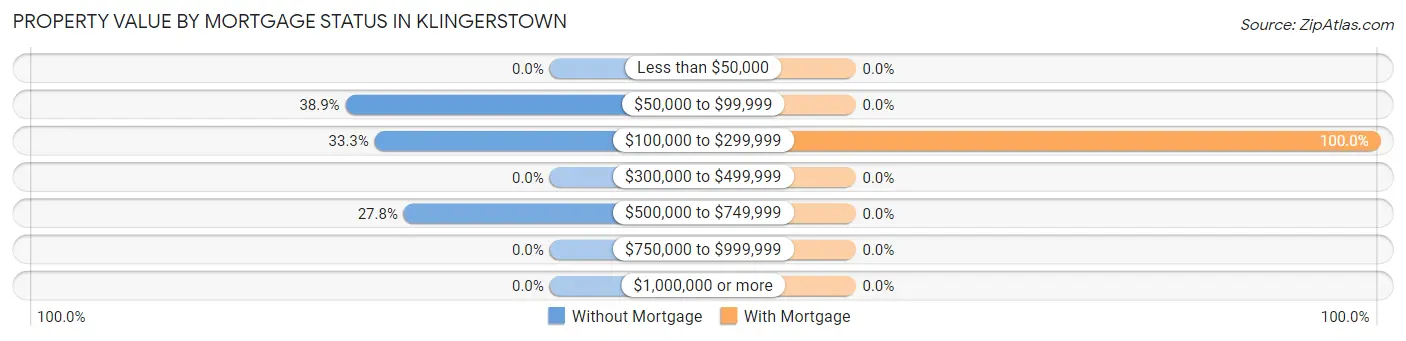
| Property Value | Without Mortgage | With Mortgage |
| Less than $50,000 | 0 (0.0%) | 0 (0.0%) |
| $50,000 to $99,999 | 7 (38.9%) | 0 (0.0%) |
| $100,000 to $299,999 | 6 (33.3%) | 5 (100.0%) |
| $300,000 to $499,999 | 0 (0.0%) | 0 (0.0%) |
| $500,000 to $749,999 | 5 (27.8%) | 0 (0.0%) |
| $750,000 to $999,999 | 0 (0.0%) | 0 (0.0%) |
| $1,000,000 or more | 0 (0.0%) | 0 (0.0%) |
| Total | 18 (100.0%) | 5 (100.0%) |
Household Income by Mortgage Status in Klingerstown
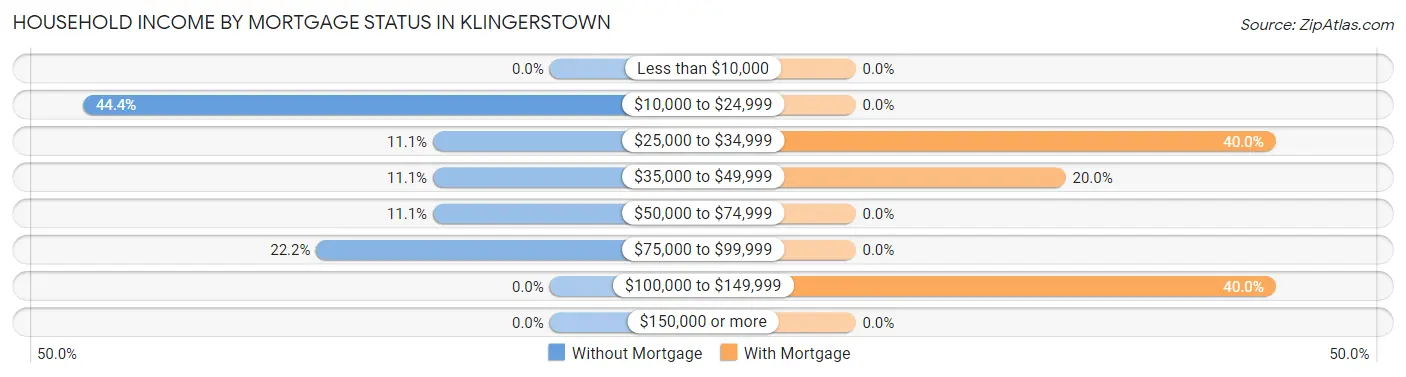
| Household Income | Without Mortgage | With Mortgage |
| Less than $10,000 | 0 (0.0%) | 0 (0.0%) |
| $10,000 to $24,999 | 8 (44.4%) | 0 (0.0%) |
| $25,000 to $34,999 | 2 (11.1%) | 2 (40.0%) |
| $35,000 to $49,999 | 2 (11.1%) | 1 (20.0%) |
| $50,000 to $74,999 | 2 (11.1%) | 0 (0.0%) |
| $75,000 to $99,999 | 4 (22.2%) | 0 (0.0%) |
| $100,000 to $149,999 | 0 (0.0%) | 2 (40.0%) |
| $150,000 or more | 0 (0.0%) | 0 (0.0%) |
| Total | 18 (100.0%) | 5 (100.0%) |
Property Value to Household Income Ratio in Klingerstown
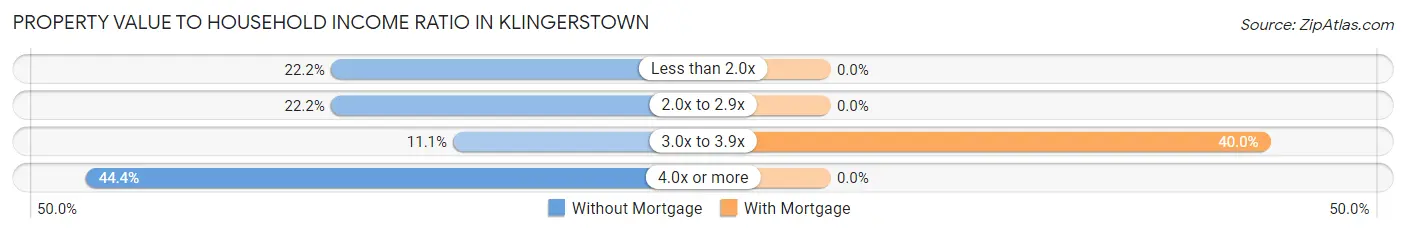
| Value-to-Income Ratio | Without Mortgage | With Mortgage |
| Less than 2.0x | 4 (22.2%) | 0 (0.0%) |
| 2.0x to 2.9x | 4 (22.2%) | 0 (0.0%) |
| 3.0x to 3.9x | 2 (11.1%) | 2 (40.0%) |
| 4.0x or more | 8 (44.4%) | 0 (0.0%) |
| Total | 18 (100.0%) | 5 (100.0%) |
Real Estate Taxes by Mortgage Status in Klingerstown
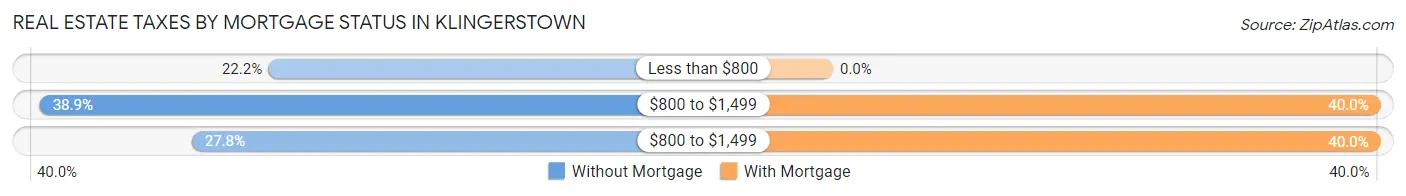
| Property Taxes | Without Mortgage | With Mortgage |
| Less than $800 | 4 (22.2%) | 0 (0.0%) |
| $800 to $1,499 | 7 (38.9%) | 2 (40.0%) |
| $800 to $1,499 | 5 (27.8%) | 2 (40.0%) |
| Total | 18 (100.0%) | 5 (100.0%) |
Health & Disability in Klingerstown
Health Insurance Coverage by Age in Klingerstown
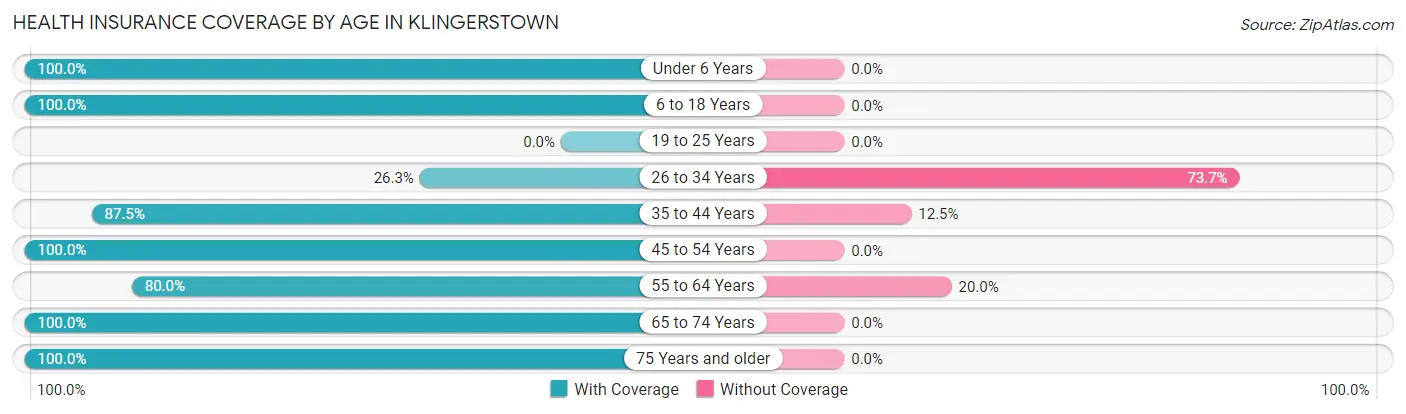
| Age Bracket | With Coverage | Without Coverage |
| Under 6 Years | 9 (100.0%) | 0 (0.0%) |
| 6 to 18 Years | 12 (100.0%) | 0 (0.0%) |
| 19 to 25 Years | 0 (0.0%) | 0 (0.0%) |
| 26 to 34 Years | 5 (26.3%) | 14 (73.7%) |
| 35 to 44 Years | 14 (87.5%) | 2 (12.5%) |
| 45 to 54 Years | 7 (100.0%) | 0 (0.0%) |
| 55 to 64 Years | 8 (80.0%) | 2 (20.0%) |
| 65 to 74 Years | 21 (100.0%) | 0 (0.0%) |
| 75 Years and older | 8 (100.0%) | 0 (0.0%) |
| Total | 84 (82.4%) | 18 (17.6%) |
Health Insurance Coverage by Citizenship Status in Klingerstown
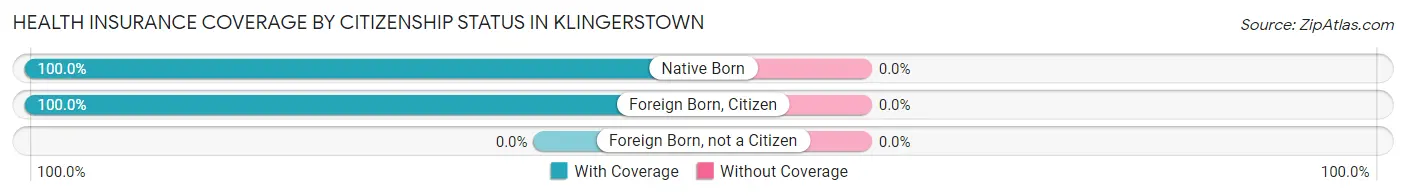
| Citizenship Status | With Coverage | Without Coverage |
| Native Born | 9 (100.0%) | 0 (0.0%) |
| Foreign Born, Citizen | 12 (100.0%) | 0 (0.0%) |
| Foreign Born, not a Citizen | 0 (0.0%) | 0 (0.0%) |
Health Insurance Coverage by Household Income in Klingerstown
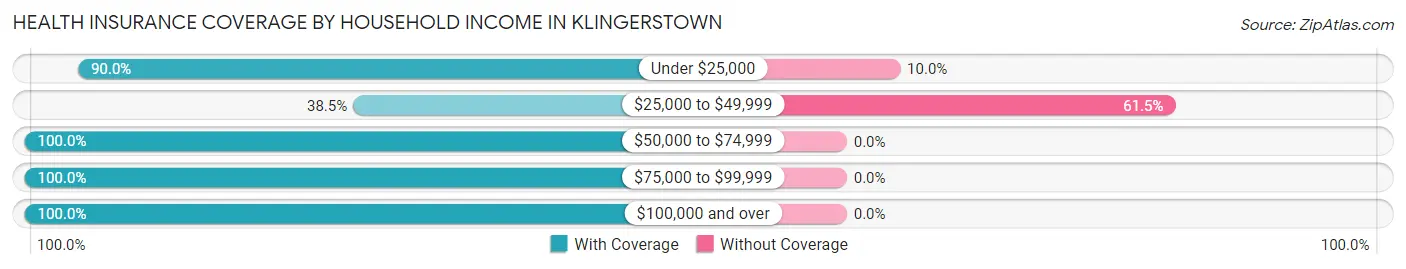
| Household Income | With Coverage | Without Coverage |
| Under $25,000 | 18 (90.0%) | 2 (10.0%) |
| $25,000 to $49,999 | 10 (38.5%) | 16 (61.5%) |
| $50,000 to $74,999 | 21 (100.0%) | 0 (0.0%) |
| $75,000 to $99,999 | 10 (100.0%) | 0 (0.0%) |
| $100,000 and over | 25 (100.0%) | 0 (0.0%) |
Public vs Private Health Insurance Coverage by Age in Klingerstown
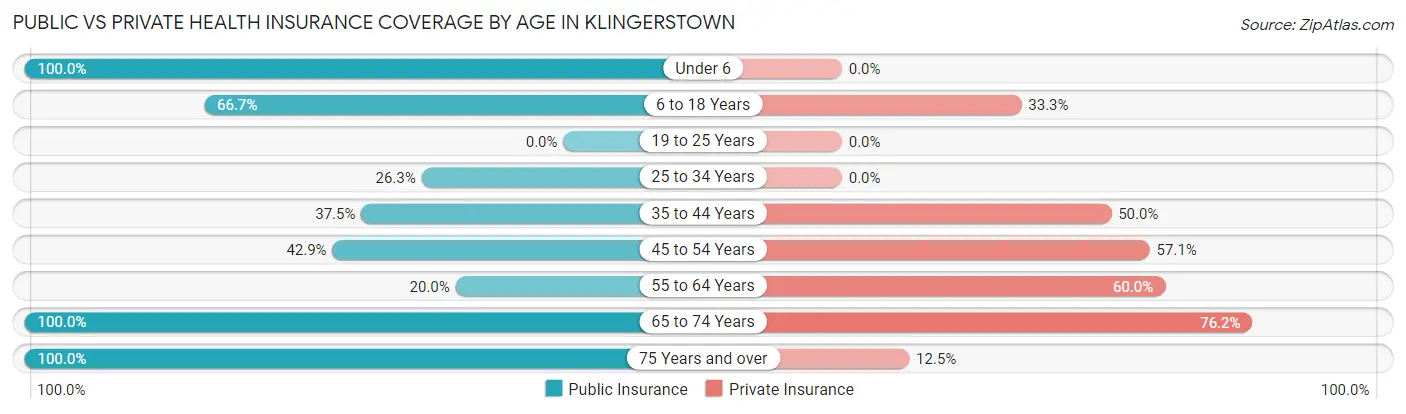
| Age Bracket | Public Insurance | Private Insurance |
| Under 6 | 9 (100.0%) | 0 (0.0%) |
| 6 to 18 Years | 8 (66.7%) | 4 (33.3%) |
| 19 to 25 Years | 0 (0.0%) | 0 (0.0%) |
| 25 to 34 Years | 5 (26.3%) | 0 (0.0%) |
| 35 to 44 Years | 6 (37.5%) | 8 (50.0%) |
| 45 to 54 Years | 3 (42.9%) | 4 (57.1%) |
| 55 to 64 Years | 2 (20.0%) | 6 (60.0%) |
| 65 to 74 Years | 21 (100.0%) | 16 (76.2%) |
| 75 Years and over | 8 (100.0%) | 1 (12.5%) |
| Total | 62 (60.8%) | 39 (38.2%) |
Disability Status by Sex by Age in Klingerstown
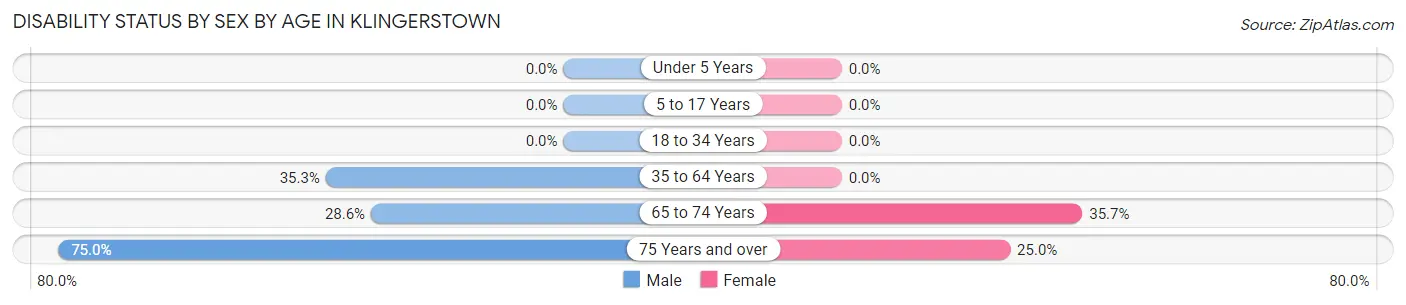
| Age Bracket | Male | Female |
| Under 5 Years | 0 (0.0%) | 0 (0.0%) |
| 5 to 17 Years | 0 (0.0%) | 0 (0.0%) |
| 18 to 34 Years | 0 (0.0%) | 0 (0.0%) |
| 35 to 64 Years | 6 (35.3%) | 0 (0.0%) |
| 65 to 74 Years | 2 (28.6%) | 5 (35.7%) |
| 75 Years and over | 3 (75.0%) | 1 (25.0%) |
Disability Class by Sex by Age in Klingerstown
Disability Class: Hearing Difficulty
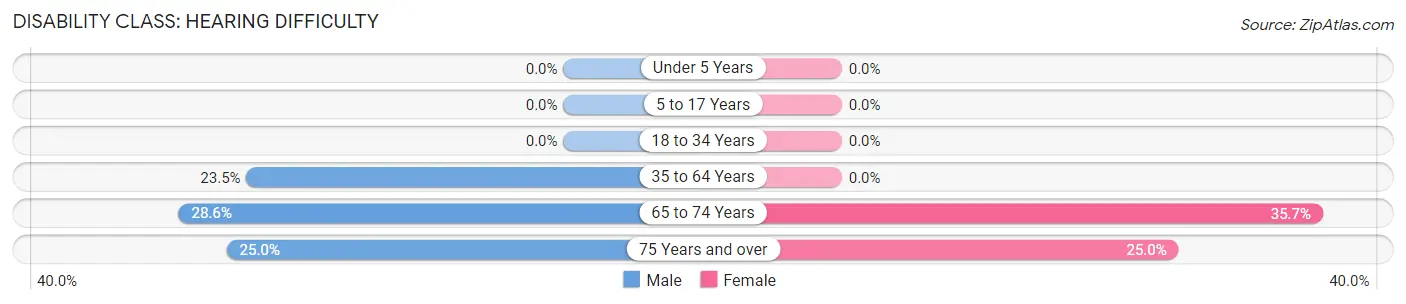
| Age Bracket | Male | Female |
| Under 5 Years | 0 (0.0%) | 0 (0.0%) |
| 5 to 17 Years | 0 (0.0%) | 0 (0.0%) |
| 18 to 34 Years | 0 (0.0%) | 0 (0.0%) |
| 35 to 64 Years | 4 (23.5%) | 0 (0.0%) |
| 65 to 74 Years | 2 (28.6%) | 5 (35.7%) |
| 75 Years and over | 1 (25.0%) | 1 (25.0%) |
Disability Class: Vision Difficulty
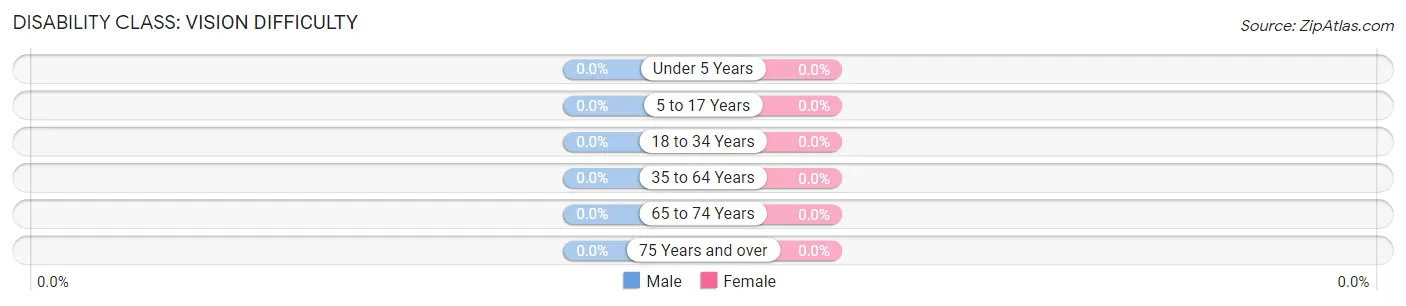
| Age Bracket | Male | Female |
| Under 5 Years | 0 (0.0%) | 0 (0.0%) |
| 5 to 17 Years | 0 (0.0%) | 0 (0.0%) |
| 18 to 34 Years | 0 (0.0%) | 0 (0.0%) |
| 35 to 64 Years | 0 (0.0%) | 0 (0.0%) |
| 65 to 74 Years | 0 (0.0%) | 0 (0.0%) |
| 75 Years and over | 0 (0.0%) | 0 (0.0%) |
Disability Class: Cognitive Difficulty
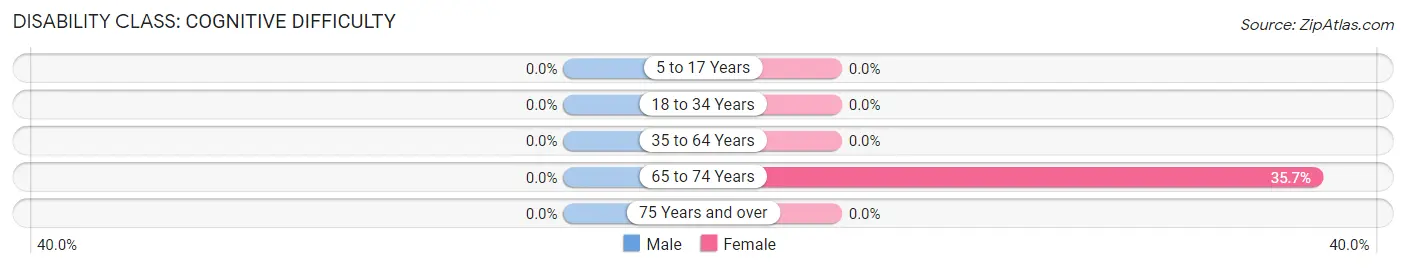
| Age Bracket | Male | Female |
| 5 to 17 Years | 0 (0.0%) | 0 (0.0%) |
| 18 to 34 Years | 0 (0.0%) | 0 (0.0%) |
| 35 to 64 Years | 0 (0.0%) | 0 (0.0%) |
| 65 to 74 Years | 0 (0.0%) | 5 (35.7%) |
| 75 Years and over | 0 (0.0%) | 0 (0.0%) |
Disability Class: Ambulatory Difficulty
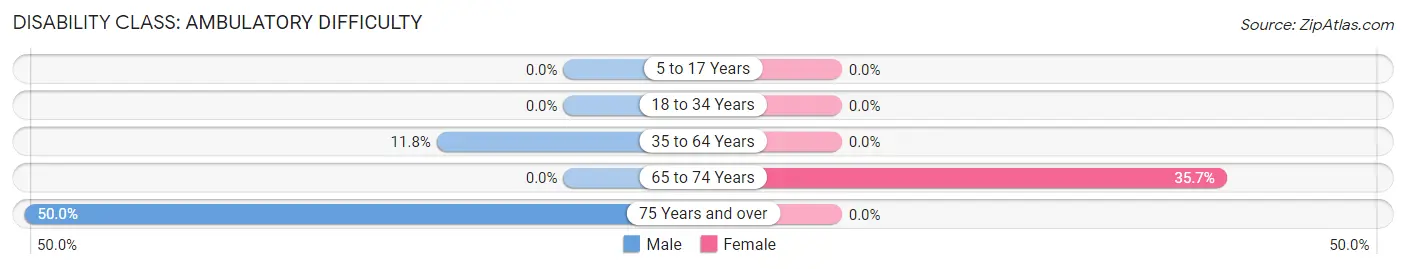
| Age Bracket | Male | Female |
| 5 to 17 Years | 0 (0.0%) | 0 (0.0%) |
| 18 to 34 Years | 0 (0.0%) | 0 (0.0%) |
| 35 to 64 Years | 2 (11.8%) | 0 (0.0%) |
| 65 to 74 Years | 0 (0.0%) | 5 (35.7%) |
| 75 Years and over | 2 (50.0%) | 0 (0.0%) |
Disability Class: Self-Care Difficulty
| Age Bracket | Male | Female |
| 5 to 17 Years | 0 (0.0%) | 0 (0.0%) |
| 18 to 34 Years | 0 (0.0%) | 0 (0.0%) |
| 35 to 64 Years | 0 (0.0%) | 0 (0.0%) |
| 65 to 74 Years | 0 (0.0%) | 0 (0.0%) |
| 75 Years and over | 0 (0.0%) | 0 (0.0%) |
Technology Access in Klingerstown
Computing Device Access in Klingerstown
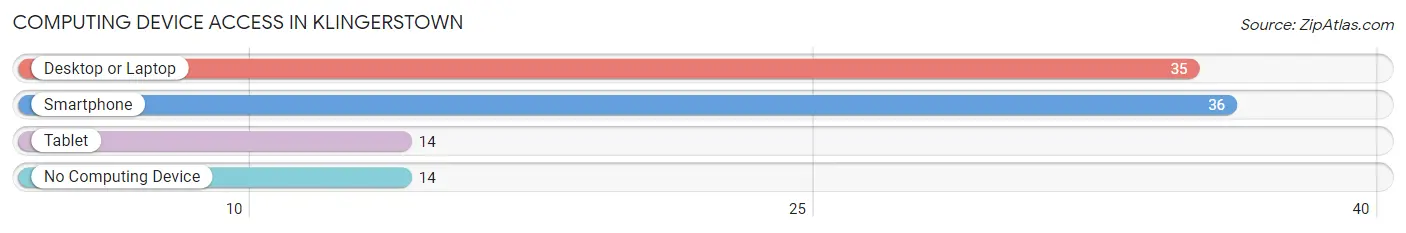
| Device Type | # Households | % Households |
| Desktop or Laptop | 35 | 64.8% |
| Smartphone | 36 | 66.7% |
| Tablet | 14 | 25.9% |
| No Computing Device | 14 | 25.9% |
| Total | 54 | 100.0% |
Internet Access in Klingerstown
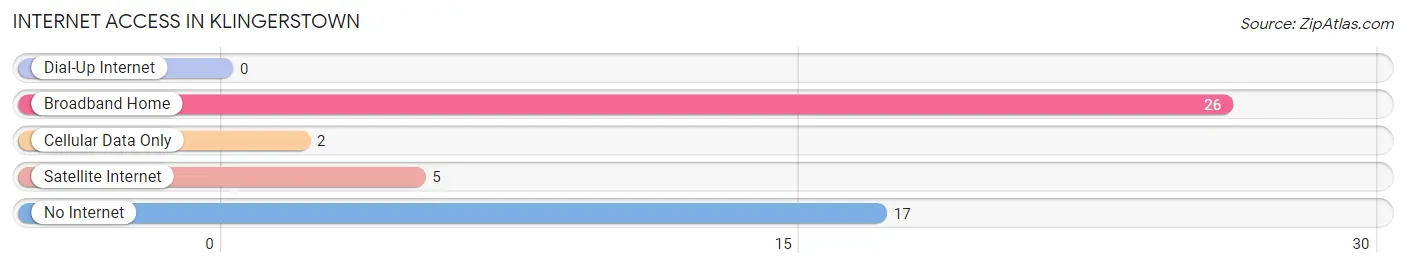
| Internet Type | # Households | % Households |
| Dial-Up Internet | 0 | 0.0% |
| Broadband Home | 26 | 48.1% |
| Cellular Data Only | 2 | 3.7% |
| Satellite Internet | 5 | 9.3% |
| No Internet | 17 | 31.5% |
| Total | 54 | 100.0% |
Klingerstown Summary
Klingerstown is a small borough located in Schuylkill County, Pennsylvania. It is situated in the Mahantongo Valley, a region of the Appalachian Mountains. The borough is located approximately 10 miles south of Pottsville and is part of the Pottsville Metropolitan Statistical Area. As of the 2010 census, the population of Klingerstown was 545.
History
Klingerstown was founded in 1845 by John Klinger, a German immigrant who had settled in the area in 1835. The town was originally known as Klingerstown, but the name was changed to Klingerstown in 1876. The town was incorporated in 1887.
Klingerstown was a major coal mining center in the late 19th and early 20th centuries. The town was home to several coal mines, including the Klingerstown Coal Company, the Klingerstown Coal and Coke Company, and the Klingerstown Coal and Iron Company. The town also had several brickyards, a tannery, and a sawmill.
Geography
Klingerstown is located in the Mahantongo Valley, a region of the Appalachian Mountains. The borough is situated in the western part of Schuylkill County, approximately 10 miles south of Pottsville. The borough is bordered by the townships of Upper Mahantongo, Washington, and Wayne.
Klingerstown has a total area of 0.6 square miles, all of which is land. The borough is located in the Schuylkill River watershed. The Mahantongo Creek, a tributary of the Schuylkill River, flows through the borough.
Economy
Klingerstown’s economy is largely based on agriculture and tourism. The borough is home to several farms, including the Klingerstown Dairy Farm, which produces milk, cheese, and other dairy products. The borough is also home to several tourist attractions, including the Klingerstown Historical Society Museum, the Klingerstown Covered Bridge, and the Klingerstown Covered Bridge Festival.
Demographics
As of the 2010 census, the population of Klingerstown was 545. The racial makeup of the borough was 97.3% White, 0.7% African American, 0.2% Native American, 0.2% Asian, and 1.6% from two or more races. Hispanic or Latino of any race were 0.7% of the population.
The median household income in Klingerstown was $41,250, and the median family income was $48,750. The per capita income for the borough was $19,945. About 8.3% of families and 10.2% of the population were below the poverty line, including 14.3% of those under age 18 and 8.3% of those age 65 or over.
Common Questions
What is Per Capita Income in Klingerstown?
Per Capita income in Klingerstown is $28,236.
What is the Median Household income in Klingerstown?
Median Household Income in Klingerstown is $34,318.
What is Income or Wage Gap in Klingerstown?
Income or Wage Gap in Klingerstown is 64.9%.
Women in Klingerstown earn 35.1 cents for every dollar earned by a man.
What is Inequality or Gini Index in Klingerstown?
Inequality or Gini Index in Klingerstown is 0.45.
What is the Total Population of Klingerstown?
Total Population of Klingerstown is 102.
What is the Total Male Population of Klingerstown?
Total Male Population of Klingerstown is 57.
What is the Total Female Population of Klingerstown?
Total Female Population of Klingerstown is 45.
What is the Ratio of Males per 100 Females in Klingerstown?
There are 126.67 Males per 100 Females in Klingerstown.
What is the Ratio of Females per 100 Males in Klingerstown?
There are 78.95 Females per 100 Males in Klingerstown.
What is the Median Population Age in Klingerstown?
Median Population Age in Klingerstown is 43.5 Years.
What is the Average Family Size in Klingerstown
Average Family Size in Klingerstown is 2.5 People.
What is the Average Household Size in Klingerstown
Average Household Size in Klingerstown is 1.9 People.
How Large is the Labor Force in Klingerstown?
There are 51 People in the Labor Forcein in Klingerstown.
What is the Percentage of People in the Labor Force in Klingerstown?
60.0% of People are in the Labor Force in Klingerstown.