Delano, PA Map & Demographics
Delano Map
Delano Overview
$28,925
PER CAPITA INCOME
$80,536
AVG FAMILY INCOME
$45,000
AVG HOUSEHOLD INCOME
0.31
INEQUALITY / GINI INDEX
214
TOTAL POPULATION
135
MALE POPULATION
79
FEMALE POPULATION
170.89
MALES / 100 FEMALES
58.52
FEMALES / 100 MALES
47.3
MEDIAN AGE
2.6
AVG FAMILY SIZE
2.0
AVG HOUSEHOLD SIZE
123
LABOR FORCE [ PEOPLE ]
67.2%
PERCENT IN LABOR FORCE
10.6%
UNEMPLOYMENT RATE
Delano Zip Codes
Delano Area Codes
Income in Delano
Income Overview in Delano
Per Capita Income in Delano is $28,925, while median incomes of families and households are $80,536 and $45,000 respectively.
| Characteristic | Number | Measure |
| Per Capita Income | 214 | $28,925 |
| Median Family Income | 60 | $80,536 |
| Mean Family Income | 60 | $71,697 |
| Median Household Income | 106 | $45,000 |
| Mean Household Income | 106 | $59,952 |
| Income Deficit | 60 | $0 |
| Wage / Income Gap (%) | 214 | 0.00% |
| Wage / Income Gap ($) | 214 | 100.00¢ per $1 |
| Gini / Inequality Index | 214 | 0.31 |
Earnings by Sex in Delano
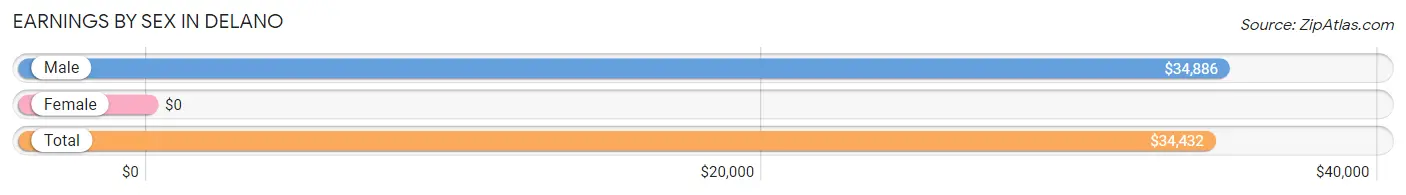
| Sex | Number | Average Earnings |
| Male | 87 (65.4%) | $34,886 |
| Female | 46 (34.6%) | $0 |
| Total | 133 (100.0%) | $34,432 |
Earnings by Sex by Income Bracket in Delano
The most common earnings brackets in Delano are $55,000 to $64,999 for men (21 | 24.1%) and $20,000 to $22,499 for women (8 | 17.4%).
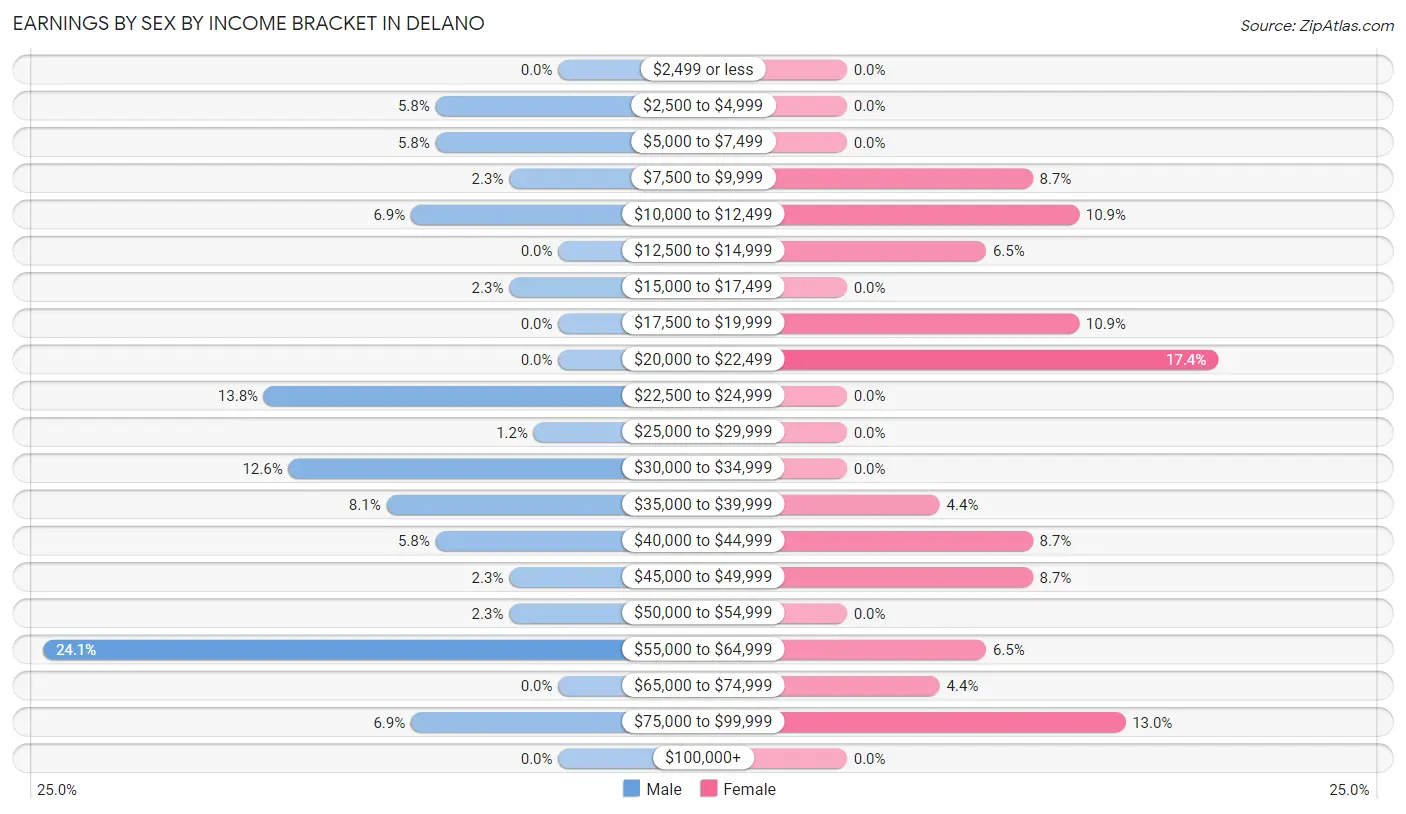
| Income | Male | Female |
| $2,499 or less | 0 (0.0%) | 0 (0.0%) |
| $2,500 to $4,999 | 5 (5.8%) | 0 (0.0%) |
| $5,000 to $7,499 | 5 (5.8%) | 0 (0.0%) |
| $7,500 to $9,999 | 2 (2.3%) | 4 (8.7%) |
| $10,000 to $12,499 | 6 (6.9%) | 5 (10.9%) |
| $12,500 to $14,999 | 0 (0.0%) | 3 (6.5%) |
| $15,000 to $17,499 | 2 (2.3%) | 0 (0.0%) |
| $17,500 to $19,999 | 0 (0.0%) | 5 (10.9%) |
| $20,000 to $22,499 | 0 (0.0%) | 8 (17.4%) |
| $22,500 to $24,999 | 12 (13.8%) | 0 (0.0%) |
| $25,000 to $29,999 | 1 (1.1%) | 0 (0.0%) |
| $30,000 to $34,999 | 11 (12.6%) | 0 (0.0%) |
| $35,000 to $39,999 | 7 (8.1%) | 2 (4.3%) |
| $40,000 to $44,999 | 5 (5.8%) | 4 (8.7%) |
| $45,000 to $49,999 | 2 (2.3%) | 4 (8.7%) |
| $50,000 to $54,999 | 2 (2.3%) | 0 (0.0%) |
| $55,000 to $64,999 | 21 (24.1%) | 3 (6.5%) |
| $65,000 to $74,999 | 0 (0.0%) | 2 (4.3%) |
| $75,000 to $99,999 | 6 (6.9%) | 6 (13.0%) |
| $100,000+ | 0 (0.0%) | 0 (0.0%) |
| Total | 87 (100.0%) | 46 (100.0%) |
Earnings by Sex by Educational Attainment in Delano
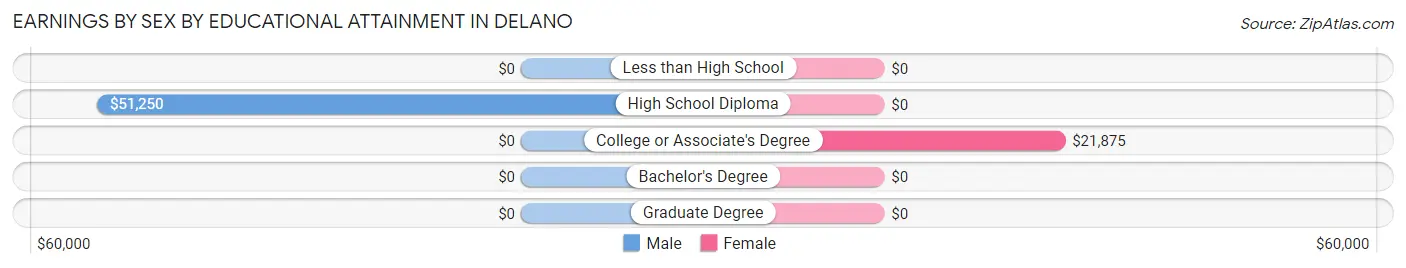
| Educational Attainment | Male Income | Female Income |
| Less than High School | - | - |
| High School Diploma | $51,250 | $0 |
| College or Associate's Degree | - | - |
| Bachelor's Degree | - | - |
| Graduate Degree | - | - |
| Total | $37,143 | $0 |
Family Income in Delano
Family Income Brackets in Delano
According to the Delano family income data, there are 33 families falling into the $75,000 to $99,999 income range, which is the most common income bracket and makes up 55.0% of all families.
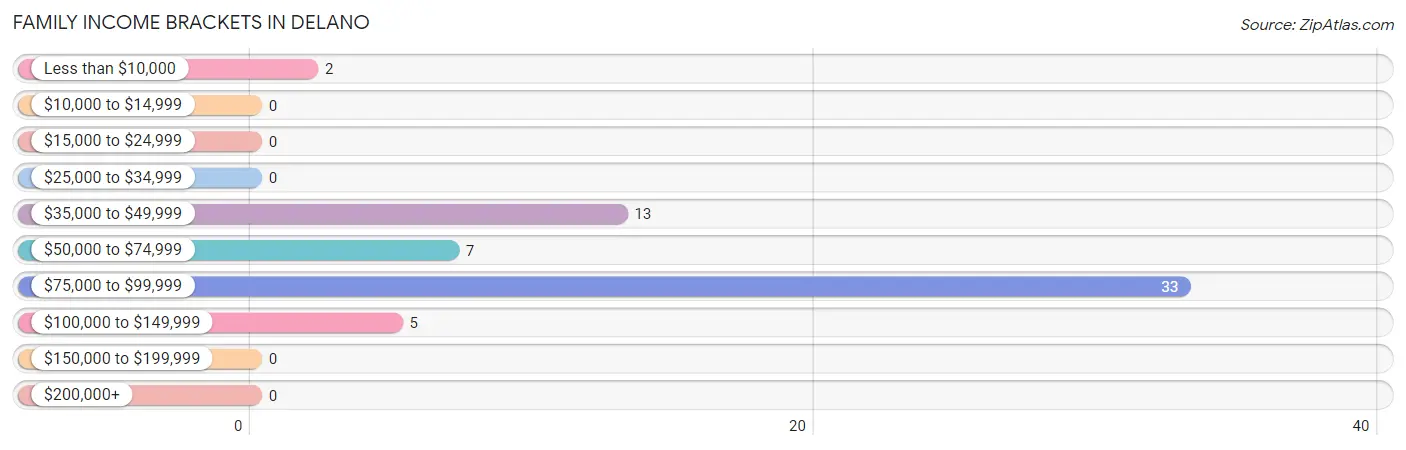
| Income Bracket | # Families | % Families |
| Less than $10,000 | 2 | 3.3% |
| $10,000 to $14,999 | 0 | 0.0% |
| $15,000 to $24,999 | 0 | 0.0% |
| $25,000 to $34,999 | 0 | 0.0% |
| $35,000 to $49,999 | 13 | 21.7% |
| $50,000 to $74,999 | 7 | 11.7% |
| $75,000 to $99,999 | 33 | 55.0% |
| $100,000 to $149,999 | 5 | 8.3% |
| $150,000 to $199,999 | 0 | 0.0% |
| $200,000+ | 0 | 0.0% |
Family Income by Famaliy Size in Delano
2-person families (43 | 71.7%) account for the highest median family income in Delano with $79,750 per family, while 2-person families (43 | 71.7%) have the highest median income of $39,875 per family member.
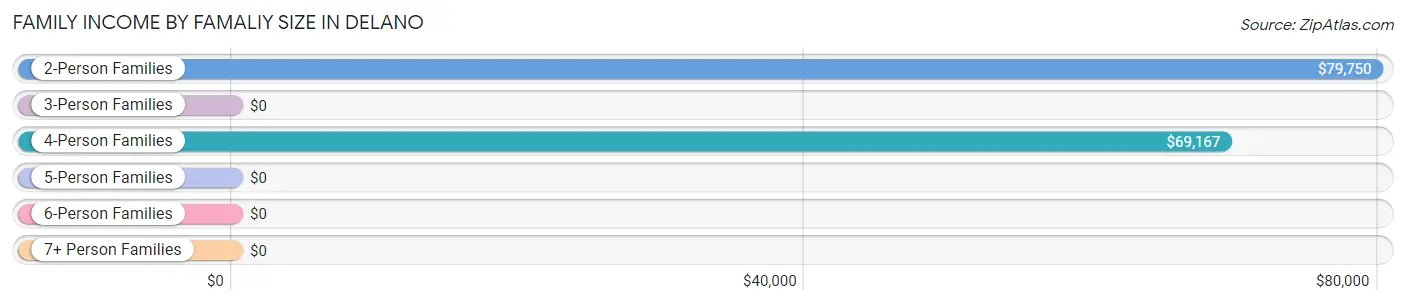
| Income Bracket | # Families | Median Income |
| 2-Person Families | 43 (71.7%) | $79,750 |
| 3-Person Families | 4 (6.7%) | $0 |
| 4-Person Families | 8 (13.3%) | $69,167 |
| 5-Person Families | 5 (8.3%) | $0 |
| 6-Person Families | 0 (0.0%) | $0 |
| 7+ Person Families | 0 (0.0%) | $0 |
| Total | 60 (100.0%) | $80,536 |
Family Income by Number of Earners in Delano
The median family income in Delano is $80,536, with families comprising 3+ earners (9) having the highest median family income of $95,417, while families with no earners (11) have the lowest median family income of $36,964, accounting for 15.0% and 18.3% of families, respectively.
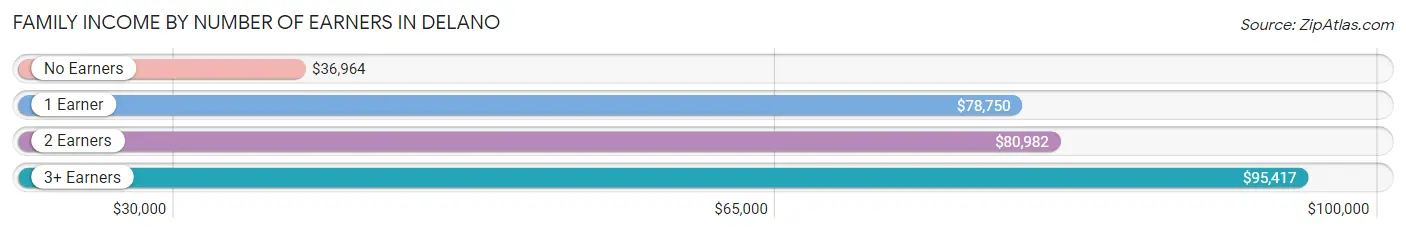
| Number of Earners | # Families | Median Income |
| No Earners | 11 (18.3%) | $36,964 |
| 1 Earner | 15 (25.0%) | $78,750 |
| 2 Earners | 25 (41.7%) | $80,982 |
| 3+ Earners | 9 (15.0%) | $95,417 |
| Total | 60 (100.0%) | $80,536 |
Household Income in Delano
Household Income Brackets in Delano
With 30 households falling in the category, the $75,000 to $99,999 income range is the most frequent in Delano, accounting for 28.3% of all households.
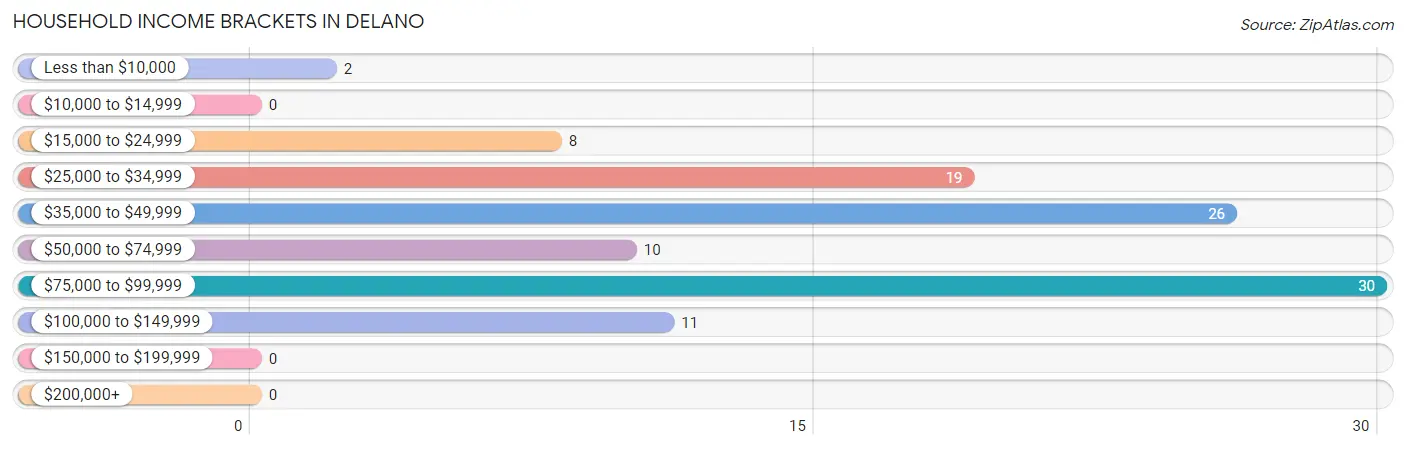
| Income Bracket | # Households | % Households |
| Less than $10,000 | 2 | 1.9% |
| $10,000 to $14,999 | 0 | 0.0% |
| $15,000 to $24,999 | 8 | 7.5% |
| $25,000 to $34,999 | 19 | 17.9% |
| $35,000 to $49,999 | 26 | 24.5% |
| $50,000 to $74,999 | 10 | 9.4% |
| $75,000 to $99,999 | 30 | 28.3% |
| $100,000 to $149,999 | 11 | 10.4% |
| $150,000 to $199,999 | 0 | 0.0% |
| $200,000+ | 0 | 0.0% |
Household Income by Householder Age in Delano
The median household income in Delano is $45,000, with the highest median household income of $80,125 found in the 45 to 64 years age bracket for the primary householder. A total of 61 households (57.6%) fall into this category. Meanwhile, the 15 to 24 years age bracket for the primary householder has the lowest median household income of $0, with 11 households (10.4%) in this group.
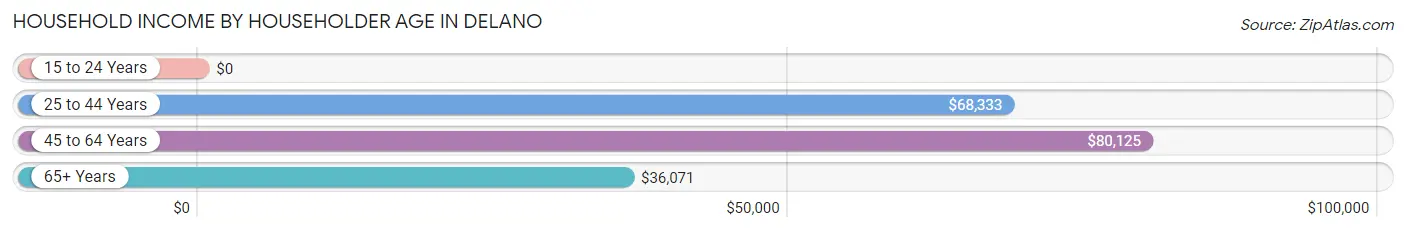
| Income Bracket | # Households | Median Income |
| 15 to 24 Years | 11 (10.4%) | $0 |
| 25 to 44 Years | 14 (13.2%) | $68,333 |
| 45 to 64 Years | 61 (57.6%) | $80,125 |
| 65+ Years | 20 (18.9%) | $36,071 |
| Total | 106 (100.0%) | $45,000 |
Poverty in Delano
Income Below Poverty by Sex and Age in Delano
With 1.5% poverty level for males and 3.8% for females among the residents of Delano, 55 to 64 year old males and 35 to 44 year old females are the most vulnerable to poverty, with 2 males (10.5%) and 2 females (25.0%) in their respective age groups living below the poverty level.
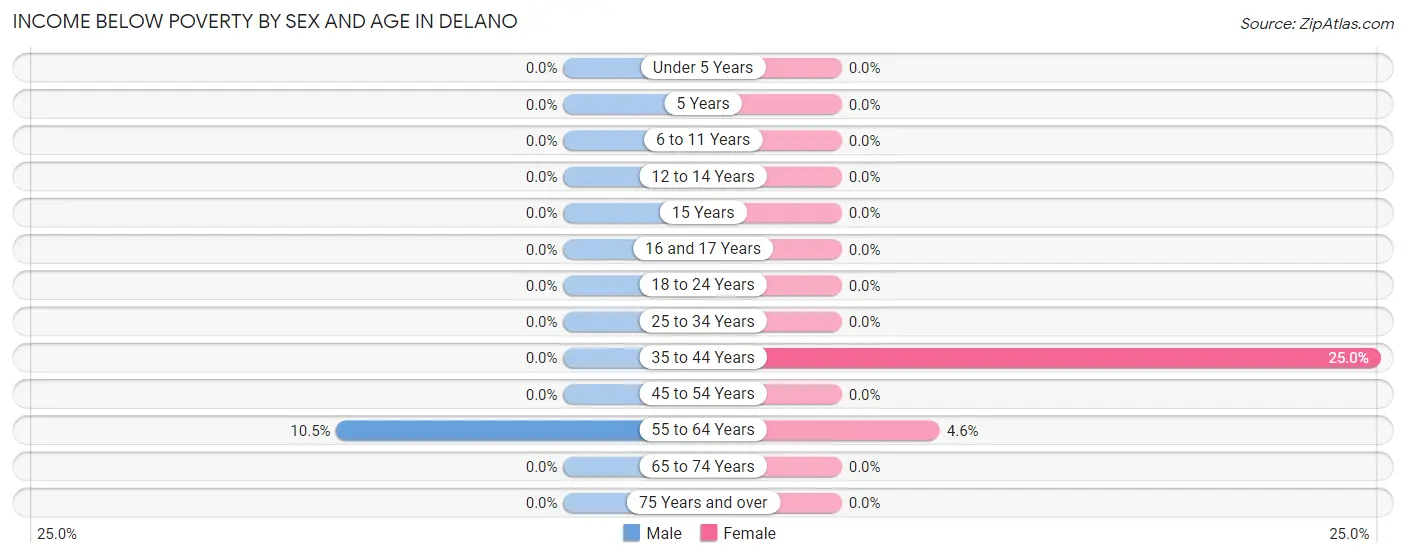
| Age Bracket | Male | Female |
| Under 5 Years | 0 (0.0%) | 0 (0.0%) |
| 5 Years | 0 (0.0%) | 0 (0.0%) |
| 6 to 11 Years | 0 (0.0%) | 0 (0.0%) |
| 12 to 14 Years | 0 (0.0%) | 0 (0.0%) |
| 15 Years | 0 (0.0%) | 0 (0.0%) |
| 16 and 17 Years | 0 (0.0%) | 0 (0.0%) |
| 18 to 24 Years | 0 (0.0%) | 0 (0.0%) |
| 25 to 34 Years | 0 (0.0%) | 0 (0.0%) |
| 35 to 44 Years | 0 (0.0%) | 2 (25.0%) |
| 45 to 54 Years | 0 (0.0%) | 0 (0.0%) |
| 55 to 64 Years | 2 (10.5%) | 1 (4.5%) |
| 65 to 74 Years | 0 (0.0%) | 0 (0.0%) |
| 75 Years and over | 0 (0.0%) | 0 (0.0%) |
| Total | 2 (1.5%) | 3 (3.8%) |
Income Above Poverty by Sex and Age in Delano
According to the poverty statistics in Delano, males aged under 5 years and females aged 6 to 11 years are the age groups that are most secure financially, with 100.0% of males and 100.0% of females in these age groups living above the poverty line.
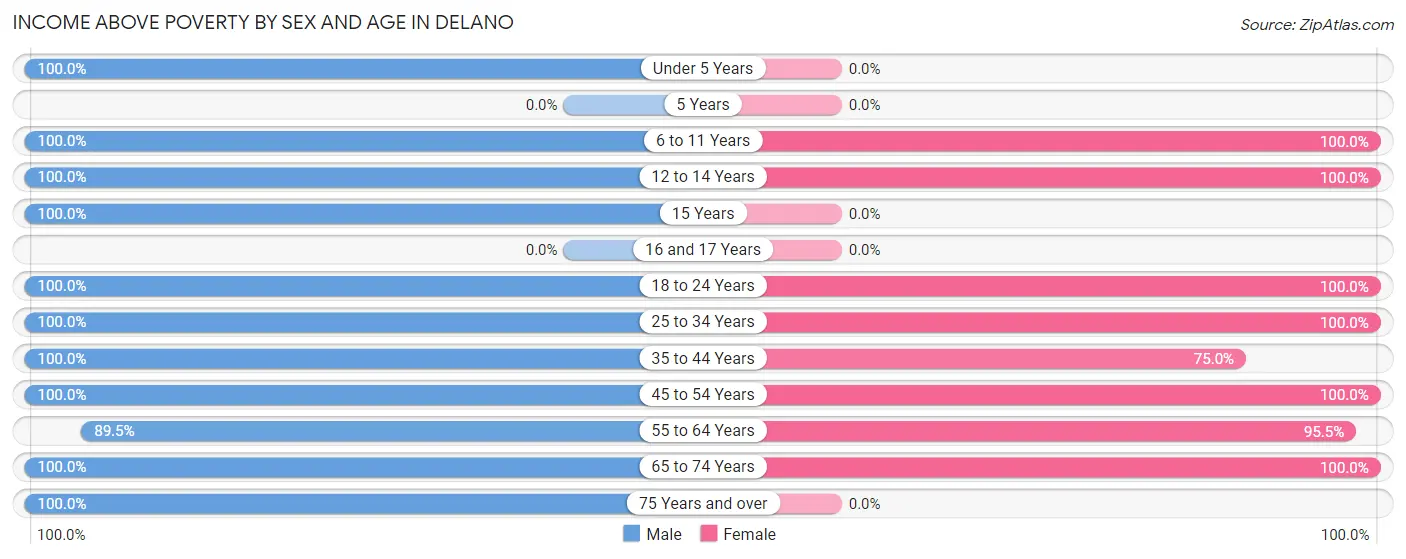
| Age Bracket | Male | Female |
| Under 5 Years | 8 (100.0%) | 0 (0.0%) |
| 5 Years | 0 (0.0%) | 0 (0.0%) |
| 6 to 11 Years | 5 (100.0%) | 9 (100.0%) |
| 12 to 14 Years | 2 (100.0%) | 5 (100.0%) |
| 15 Years | 2 (100.0%) | 0 (0.0%) |
| 16 and 17 Years | 0 (0.0%) | 0 (0.0%) |
| 18 to 24 Years | 25 (100.0%) | 4 (100.0%) |
| 25 to 34 Years | 15 (100.0%) | 7 (100.0%) |
| 35 to 44 Years | 10 (100.0%) | 6 (75.0%) |
| 45 to 54 Years | 23 (100.0%) | 10 (100.0%) |
| 55 to 64 Years | 17 (89.5%) | 21 (95.5%) |
| 65 to 74 Years | 17 (100.0%) | 14 (100.0%) |
| 75 Years and over | 9 (100.0%) | 0 (0.0%) |
| Total | 133 (98.5%) | 76 (96.2%) |
Income Below Poverty Among Married-Couple Families in Delano
The poverty statistics for married-couple families in Delano show that 6.1% or 2 of the total 33 families live below the poverty line. Families with no children have the highest poverty rate of 8.0%, comprising of 2 families. On the other hand, families with 1 or 2 children have the lowest poverty rate of 0.0%, which includes 0 families.
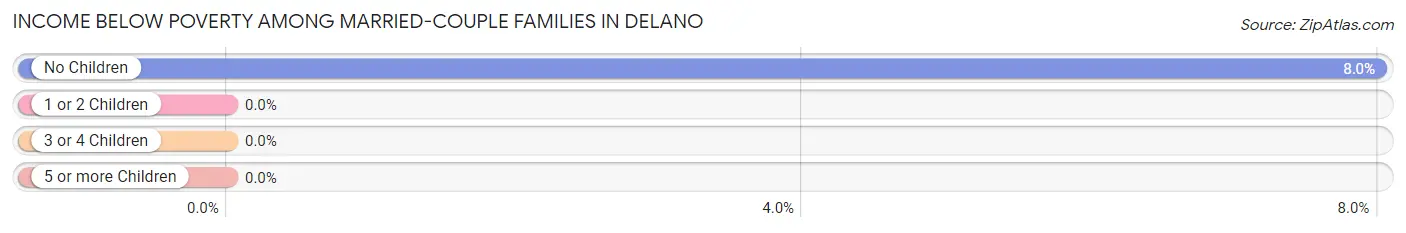
| Children | Above Poverty | Below Poverty |
| No Children | 23 (92.0%) | 2 (8.0%) |
| 1 or 2 Children | 8 (100.0%) | 0 (0.0%) |
| 3 or 4 Children | 0 (0.0%) | 0 (0.0%) |
| 5 or more Children | 0 (0.0%) | 0 (0.0%) |
| Total | 31 (93.9%) | 2 (6.1%) |
Income Below Poverty Among Single-Parent Households in Delano
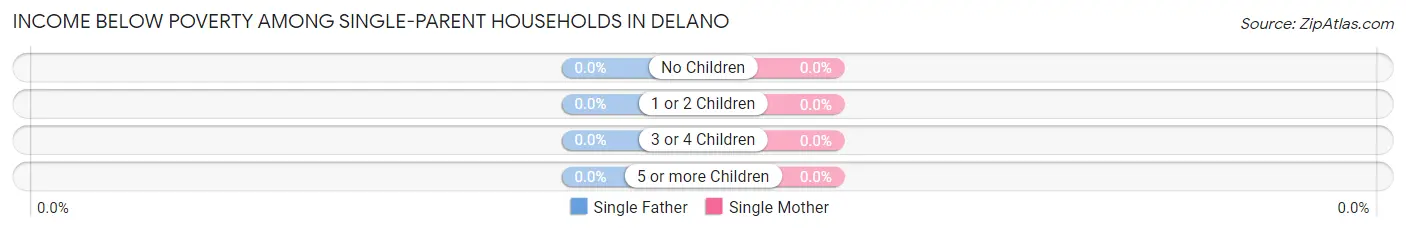
| Children | Single Father | Single Mother |
| No Children | 0 (0.0%) | 0 (0.0%) |
| 1 or 2 Children | 0 (0.0%) | 0 (0.0%) |
| 3 or 4 Children | 0 (0.0%) | 0 (0.0%) |
| 5 or more Children | 0 (0.0%) | 0 (0.0%) |
| Total | 0 (0.0%) | 0 (0.0%) |
Income Below Poverty Among Married-Couple vs Single-Parent Households in Delano
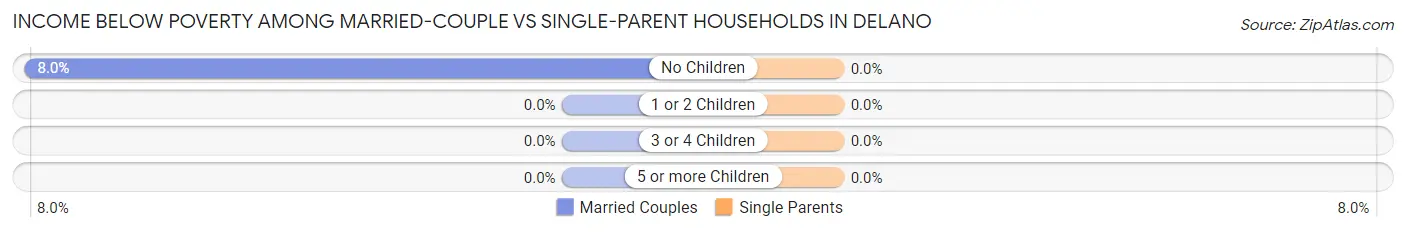
| Children | Married-Couple Families | Single-Parent Households |
| No Children | 2 (8.0%) | 0 (0.0%) |
| 1 or 2 Children | 0 (0.0%) | 0 (0.0%) |
| 3 or 4 Children | 0 (0.0%) | 0 (0.0%) |
| 5 or more Children | 0 (0.0%) | 0 (0.0%) |
| Total | 2 (6.1%) | 0 (0.0%) |
Race in Delano
The most populous races in Delano are White / Caucasian (205 | 95.8%), Hispanic or Latino (5 | 2.3%), and Some other Race (5 | 2.3%).
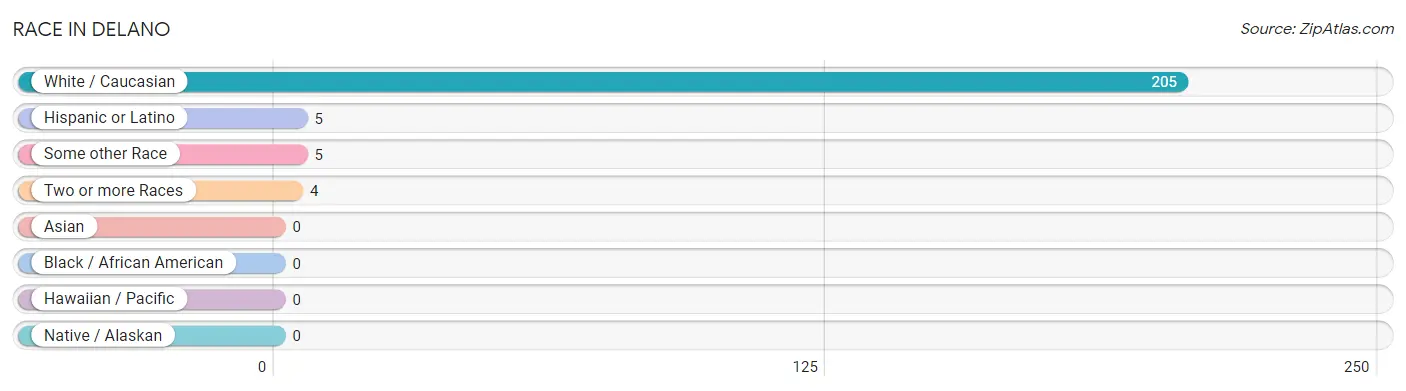
| Race | # Population | % Population |
| Asian | 0 | 0.0% |
| Black / African American | 0 | 0.0% |
| Hawaiian / Pacific | 0 | 0.0% |
| Hispanic or Latino | 5 | 2.3% |
| Native / Alaskan | 0 | 0.0% |
| White / Caucasian | 205 | 95.8% |
| Two or more Races | 4 | 1.9% |
| Some other Race | 5 | 2.3% |
| Total | 214 | 100.0% |
Ancestry in Delano
The most populous ancestries reported in Delano are German (41 | 19.2%), Lithuanian (33 | 15.4%), Irish (31 | 14.5%), Polish (22 | 10.3%), and European (20 | 9.3%), together accounting for 68.7% of all Delano residents.
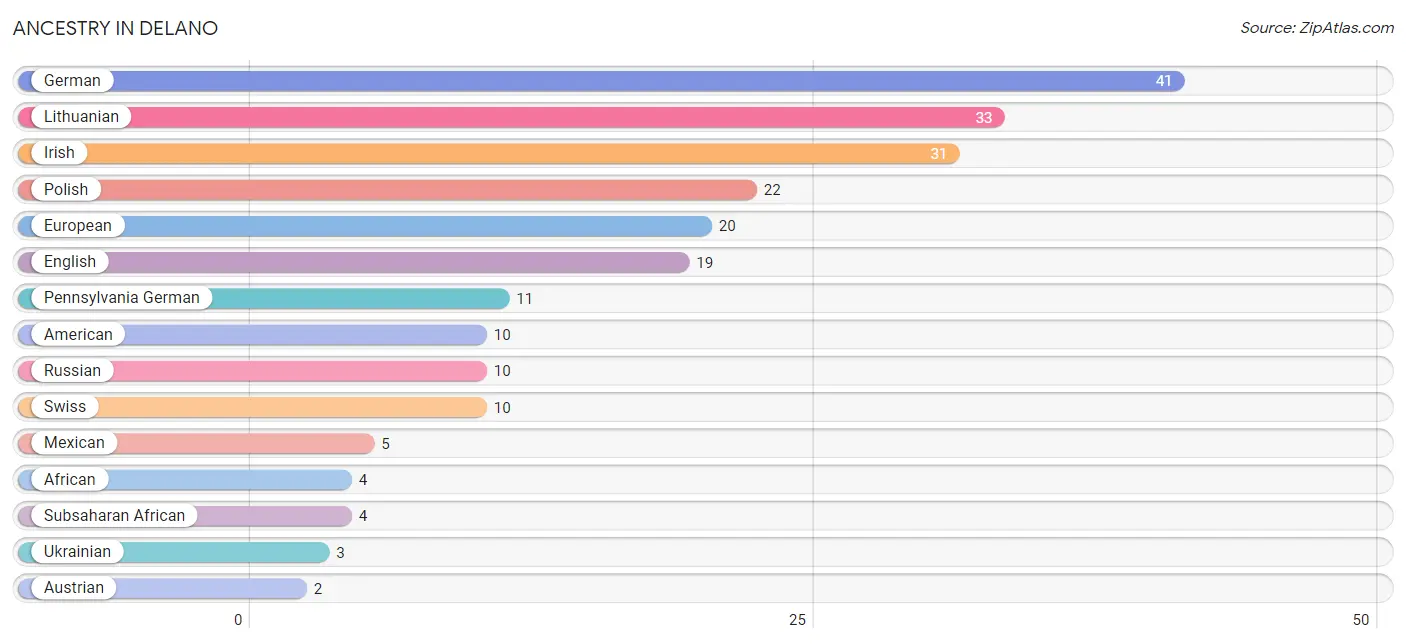
| Ancestry | # Population | % Population |
| African | 4 | 1.9% |
| American | 10 | 4.7% |
| Arab | 1 | 0.5% |
| Austrian | 2 | 0.9% |
| English | 19 | 8.9% |
| European | 20 | 9.3% |
| German | 41 | 19.2% |
| Irish | 31 | 14.5% |
| Italian | 2 | 0.9% |
| Lebanese | 1 | 0.5% |
| Lithuanian | 33 | 15.4% |
| Mexican | 5 | 2.3% |
| Pennsylvania German | 11 | 5.1% |
| Polish | 22 | 10.3% |
| Russian | 10 | 4.7% |
| Slovak | 2 | 0.9% |
| Subsaharan African | 4 | 1.9% |
| Swiss | 10 | 4.7% |
| Ukrainian | 3 | 1.4% |
| Welsh | 2 | 0.9% | View All 20 Rows |
Immigrants in Delano
The most numerous immigrant groups reported in Delano came from Central America (5 | 2.3%), Latin America (5 | 2.3%), and Mexico (5 | 2.3%), together accounting for 7.0% of all Delano residents.
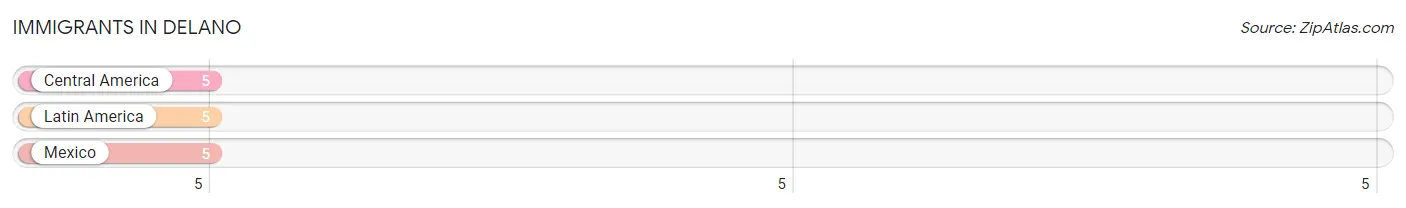
| Immigration Origin | # Population | % Population |
| Central America | 5 | 2.3% |
| Latin America | 5 | 2.3% |
| Mexico | 5 | 2.3% | View All 3 Rows |
Sex and Age in Delano
Sex and Age in Delano
The most populous age groups in Delano are 50 to 54 Years (17 | 12.6%) for men and 60 to 64 Years (15 | 19.0%) for women.
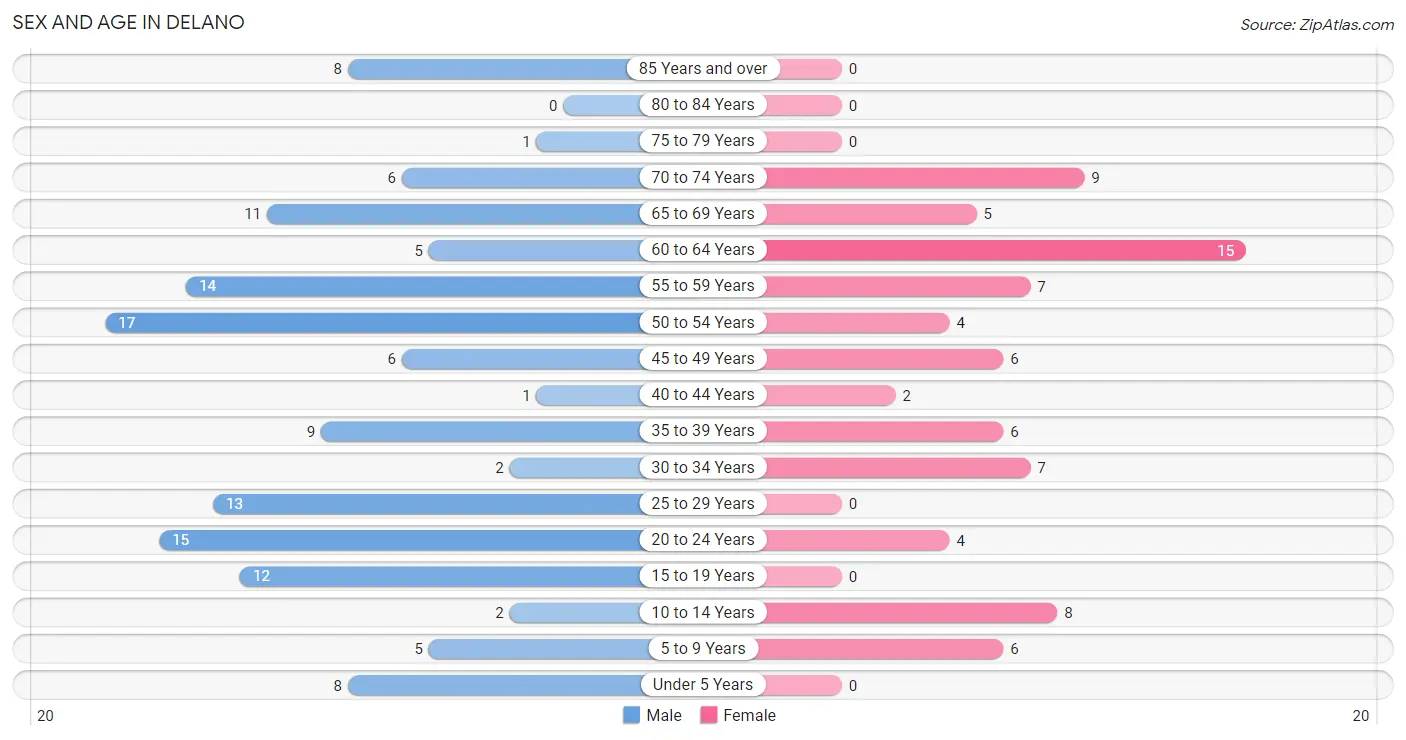
| Age Bracket | Male | Female |
| Under 5 Years | 8 (5.9%) | 0 (0.0%) |
| 5 to 9 Years | 5 (3.7%) | 6 (7.6%) |
| 10 to 14 Years | 2 (1.5%) | 8 (10.1%) |
| 15 to 19 Years | 12 (8.9%) | 0 (0.0%) |
| 20 to 24 Years | 15 (11.1%) | 4 (5.1%) |
| 25 to 29 Years | 13 (9.6%) | 0 (0.0%) |
| 30 to 34 Years | 2 (1.5%) | 7 (8.9%) |
| 35 to 39 Years | 9 (6.7%) | 6 (7.6%) |
| 40 to 44 Years | 1 (0.7%) | 2 (2.5%) |
| 45 to 49 Years | 6 (4.4%) | 6 (7.6%) |
| 50 to 54 Years | 17 (12.6%) | 4 (5.1%) |
| 55 to 59 Years | 14 (10.4%) | 7 (8.9%) |
| 60 to 64 Years | 5 (3.7%) | 15 (19.0%) |
| 65 to 69 Years | 11 (8.2%) | 5 (6.3%) |
| 70 to 74 Years | 6 (4.4%) | 9 (11.4%) |
| 75 to 79 Years | 1 (0.7%) | 0 (0.0%) |
| 80 to 84 Years | 0 (0.0%) | 0 (0.0%) |
| 85 Years and over | 8 (5.9%) | 0 (0.0%) |
| Total | 135 (100.0%) | 79 (100.0%) |
Families and Households in Delano
Median Family Size in Delano
The median family size in Delano is 2.58 persons per family, with single female/mother families (7 | 11.7%) accounting for the largest median family size of 2.86 persons per family. On the other hand, single male/father families (20 | 33.3%) represent the smallest median family size with 2.20 persons per family.
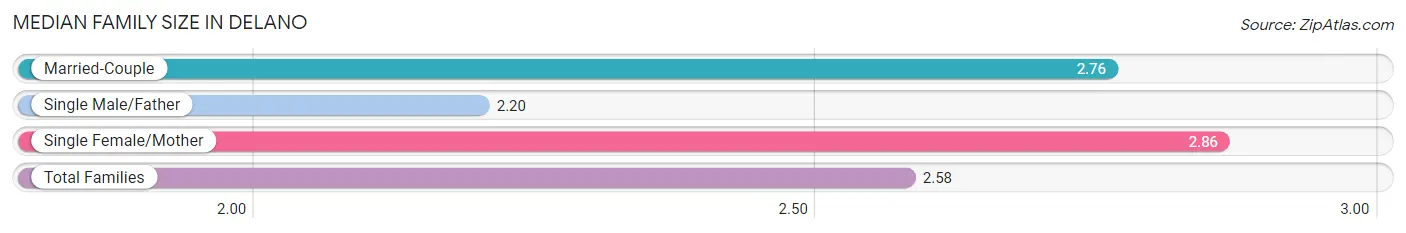
| Family Type | # Families | Family Size |
| Married-Couple | 33 (55.0%) | 2.76 |
| Single Male/Father | 20 (33.3%) | 2.20 |
| Single Female/Mother | 7 (11.7%) | 2.86 |
| Total Families | 60 (100.0%) | 2.58 |
Median Household Size in Delano
The median household size in Delano is 2.02 persons per household, with single female/mother households (7 | 6.6%) accounting for the largest median household size of 2.86 persons per household. non-family households (46 | 43.4%) represent the smallest median household size with 1.22 persons per household.
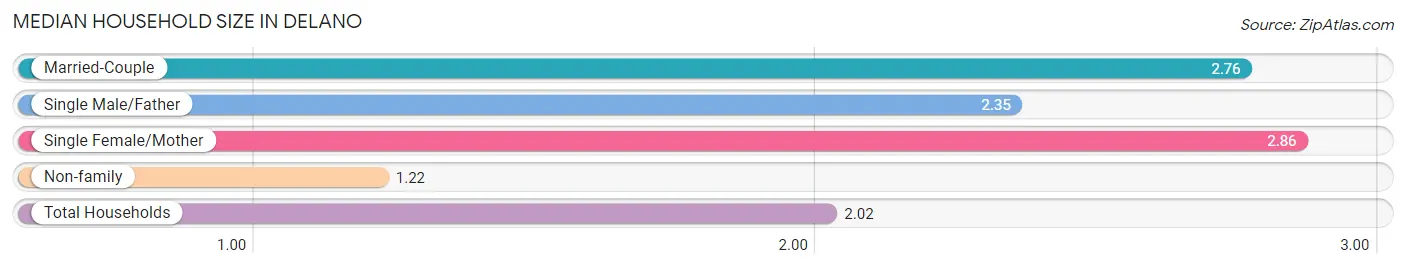
| Household Type | # Households | Household Size |
| Married-Couple | 33 (31.1%) | 2.76 |
| Single Male/Father | 20 (18.9%) | 2.35 |
| Single Female/Mother | 7 (6.6%) | 2.86 |
| Non-family | 46 (43.4%) | 1.22 |
| Total Households | 106 (100.0%) | 2.02 |
Household Size by Marriage Status in Delano
Out of a total of 106 households in Delano, 60 (56.6%) are family households, while 46 (43.4%) are nonfamily households. The most numerous type of family households are 2-person households, comprising 40, and the most common type of nonfamily households are 1-person households, comprising 36.
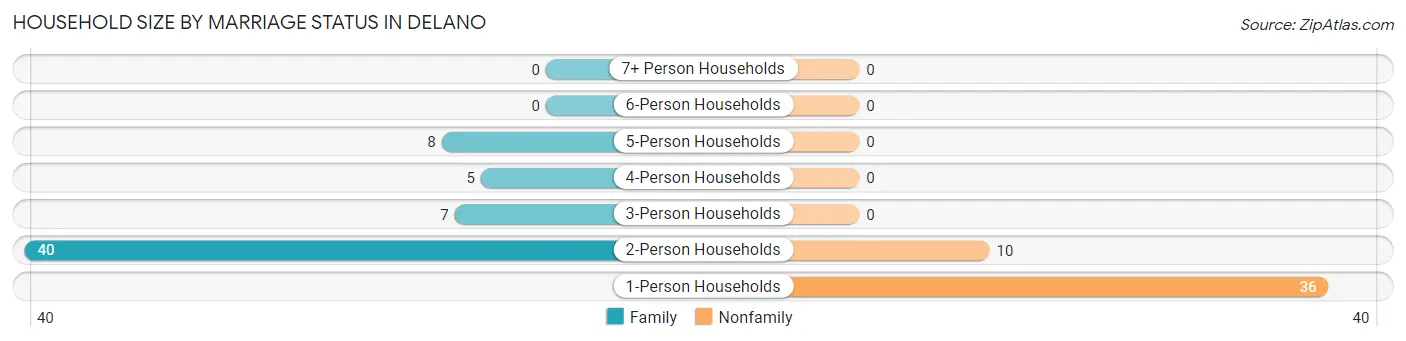
| Household Size | Family Households | Nonfamily Households |
| 1-Person Households | - | 36 (34.0%) |
| 2-Person Households | 40 (37.7%) | 10 (9.4%) |
| 3-Person Households | 7 (6.6%) | 0 (0.0%) |
| 4-Person Households | 5 (4.7%) | 0 (0.0%) |
| 5-Person Households | 8 (7.5%) | 0 (0.0%) |
| 6-Person Households | 0 (0.0%) | 0 (0.0%) |
| 7+ Person Households | 0 (0.0%) | 0 (0.0%) |
| Total | 60 (56.6%) | 46 (43.4%) |
Female Fertility in Delano
Fertility by Age in Delano
Average fertility rate in Delano is 160.0 births per 1,000 women. Women in the age bracket of 20 to 34 years have the highest fertility rate with 364.0 births per 1,000 women. Women in the age bracket of 20 to 34 years acount for 100.0% of all women with births.
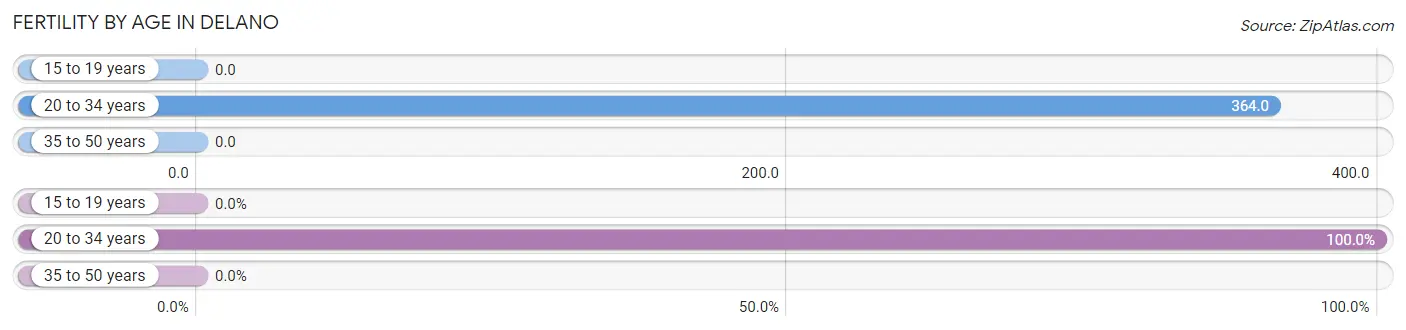
| Age Bracket | Women with Births | Births / 1,000 Women |
| 15 to 19 years | 0 (0.0%) | 0.0 |
| 20 to 34 years | 4 (100.0%) | 364.0 |
| 35 to 50 years | 0 (0.0%) | 0.0 |
| Total | 4 (100.0%) | 160.0 |
Fertility by Age by Marriage Status in Delano
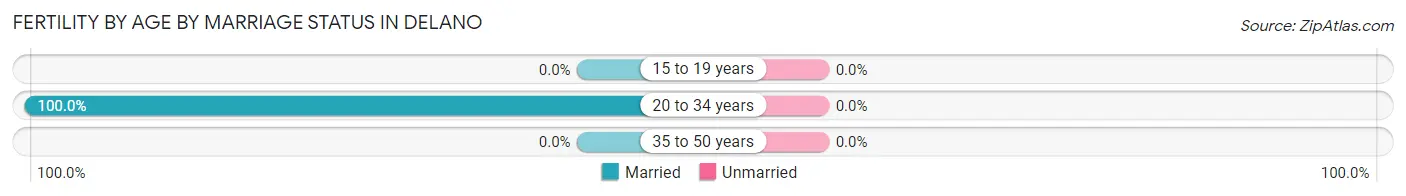
| Age Bracket | Married | Unmarried |
| 15 to 19 years | 0 (0.0%) | 0 (0.0%) |
| 20 to 34 years | 4 (100.0%) | 0 (0.0%) |
| 35 to 50 years | 0 (0.0%) | 0 (0.0%) |
| Total | 4 (100.0%) | 0 (0.0%) |
Fertility by Education in Delano
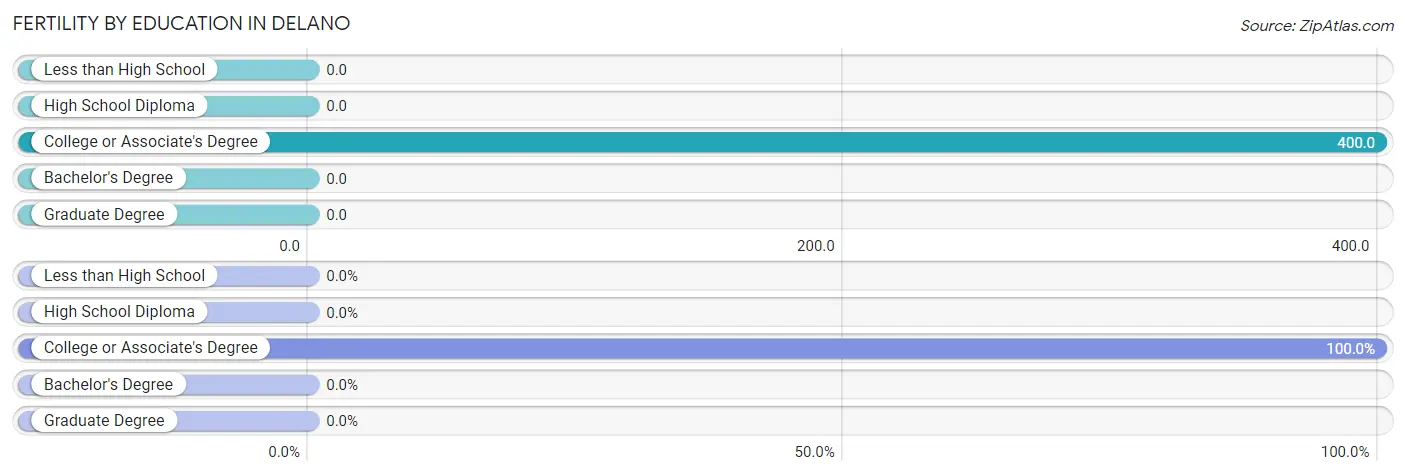
| Educational Attainment | Women with Births | Births / 1,000 Women |
| Less than High School | 0 (0.0%) | 0.0 |
| High School Diploma | 0 (0.0%) | 0.0 |
| College or Associate's Degree | 4 (100.0%) | 400.0 |
| Bachelor's Degree | 0 (0.0%) | 0.0 |
| Graduate Degree | 0 (0.0%) | 0.0 |
| Total | 4 (100.0%) | 160.0 |
Fertility by Education by Marriage Status in Delano
| Educational Attainment | Married | Unmarried |
| Less than High School | 0 (0.0%) | 0 (0.0%) |
| High School Diploma | 0 (0.0%) | 0 (0.0%) |
| College or Associate's Degree | 4 (100.0%) | 0 (0.0%) |
| Bachelor's Degree | 0 (0.0%) | 0 (0.0%) |
| Graduate Degree | 0 (0.0%) | 0 (0.0%) |
| Total | 4 (100.0%) | 0 (0.0%) |
Employment Characteristics in Delano
Employment by Class of Employer in Delano
Among the 110 employed individuals in Delano, private company employees (90 | 81.8%), federal government employees (6 | 5.4%), and not-for-profit organizations (5 | 4.5%) make up the most common classes of employment.
| Employer Class | # Employees | % Employees |
| Private Company Employees | 90 | 81.8% |
| Self-Employed (Incorporated) | 0 | 0.0% |
| Self-Employed (Not Incorporated) | 1 | 0.9% |
| Not-for-profit Organizations | 5 | 4.5% |
| Local Government Employees | 5 | 4.5% |
| State Government Employees | 3 | 2.7% |
| Federal Government Employees | 6 | 5.4% |
| Unpaid Family Workers | 0 | 0.0% |
| Total | 110 | 100.0% |
Employment Status by Age in Delano
According to the labor force statistics for Delano, out of the total population over 16 years of age (183), 67.2% or 123 individuals are in the labor force, with 10.6% or 13 of them unemployed. The age group with the highest labor force participation rate is 25 to 29 years, with 100.0% or 13 individuals in the labor force. Within the labor force, the 20 to 24 years age range has the highest percentage of unemployed individuals, with 73.3% or 11 of them being unemployed.
| Age Bracket | In Labor Force | Unemployed |
| 16 to 19 Years | 3 (30.0%) | 0 (0.0%) |
| 20 to 24 Years | 15 (78.9%) | 11 (73.3%) |
| 25 to 29 Years | 13 (100.0%) | 0 (0.0%) |
| 30 to 34 Years | 9 (100.0%) | 0 (0.0%) |
| 35 to 44 Years | 12 (66.7%) | 0 (0.0%) |
| 45 to 54 Years | 32 (97.0%) | 0 (0.0%) |
| 55 to 59 Years | 20 (95.2%) | 0 (0.0%) |
| 60 to 64 Years | 11 (55.0%) | 2 (18.2%) |
| 65 to 74 Years | 8 (25.8%) | 0 (0.0%) |
| 75 Years and over | 0 (0.0%) | 0 (0.0%) |
| Total | 123 (67.2%) | 13 (10.6%) |
Employment Status by Educational Attainment in Delano
According to labor force statistics for Delano, 85.1% of individuals (97) out of the total population between 25 and 64 years of age (114) are in the labor force, with 2.1% or 2 of them being unemployed. The group with the highest labor force participation rate are those with the educational attainment of bachelor's degree or higher, with 100.0% or 12 individuals in the labor force. Within the labor force, individuals with college / associate degree education have the highest percentage of unemployment, with 7.4% or 2 of them being unemployed.
| Educational Attainment | In Labor Force | Unemployed |
| Less than High School | 5 (83.3%) | 0 (0.0%) |
| High School Diploma | 53 (82.8%) | 0 (0.0%) |
| College / Associate Degree | 27 (84.4%) | 2 (7.4%) |
| Bachelor's Degree or higher | 12 (100.0%) | 0 (0.0%) |
| Total | 97 (85.1%) | 2 (2.1%) |
Employment Occupations by Sex in Delano
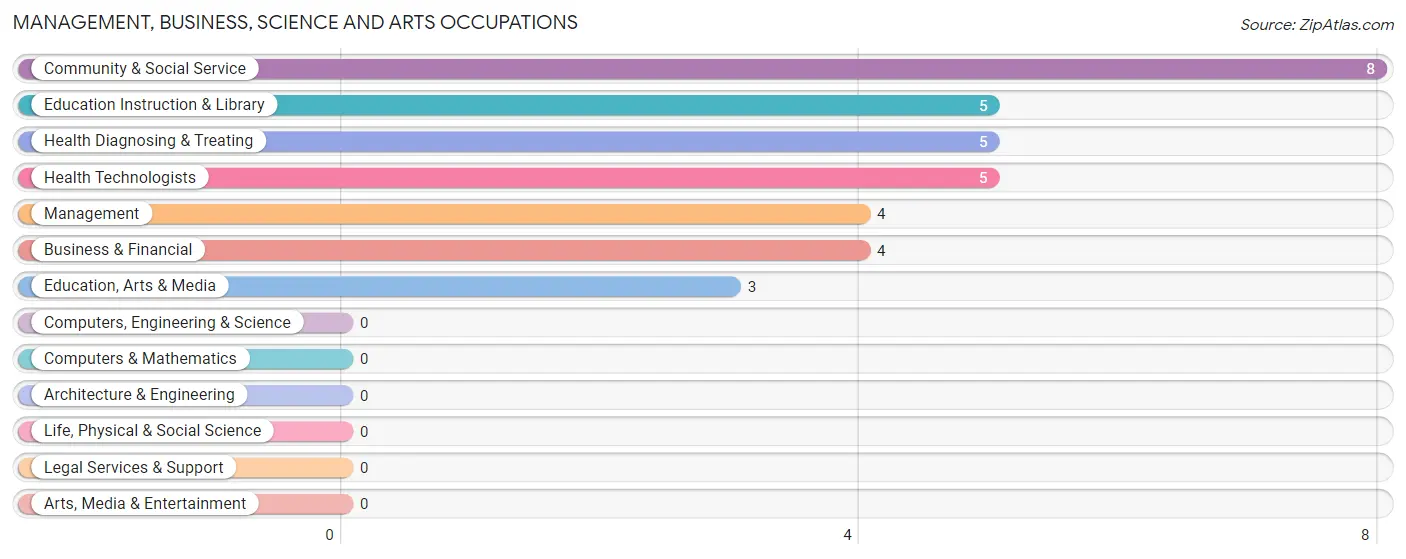
Management, Business, Science and Arts Occupations
The most common Management, Business, Science and Arts occupations in Delano are Community & Social Service (8 | 7.3%), Education Instruction & Library (5 | 4.5%), Health Diagnosing & Treating (5 | 4.5%), Health Technologists (5 | 4.5%), and Management (4 | 3.6%).
Management, Business, Science and Arts Occupations by Sex
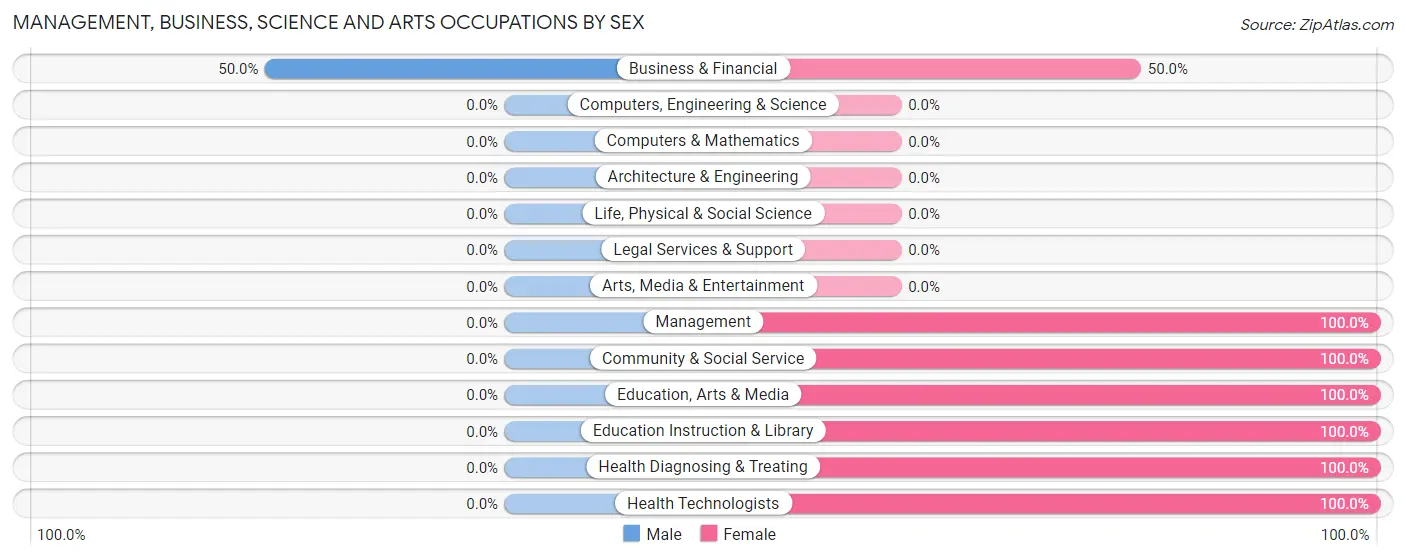
| Occupation | Male | Female |
| Management | 0 (0.0%) | 4 (100.0%) |
| Business & Financial | 2 (50.0%) | 2 (50.0%) |
| Computers, Engineering & Science | 0 (0.0%) | 0 (0.0%) |
| Computers & Mathematics | 0 (0.0%) | 0 (0.0%) |
| Architecture & Engineering | 0 (0.0%) | 0 (0.0%) |
| Life, Physical & Social Science | 0 (0.0%) | 0 (0.0%) |
| Community & Social Service | 0 (0.0%) | 8 (100.0%) |
| Education, Arts & Media | 0 (0.0%) | 3 (100.0%) |
| Legal Services & Support | 0 (0.0%) | 0 (0.0%) |
| Education Instruction & Library | 0 (0.0%) | 5 (100.0%) |
| Arts, Media & Entertainment | 0 (0.0%) | 0 (0.0%) |
| Health Diagnosing & Treating | 0 (0.0%) | 5 (100.0%) |
| Health Technologists | 0 (0.0%) | 5 (100.0%) |
| Total (Category) | 2 (9.5%) | 19 (90.5%) |
| Total (Overall) | 64 (58.2%) | 46 (41.8%) |
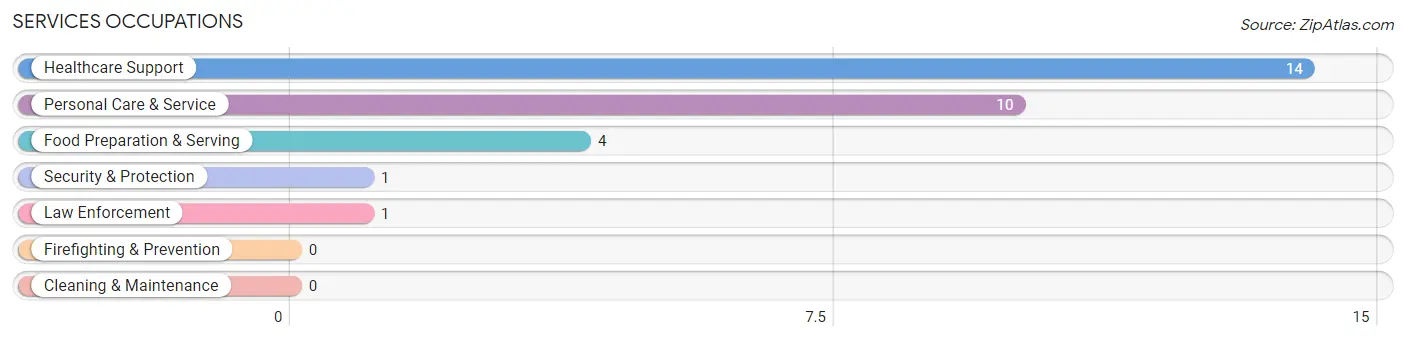
Services Occupations
The most common Services occupations in Delano are Healthcare Support (14 | 12.7%), Personal Care & Service (10 | 9.1%), Food Preparation & Serving (4 | 3.6%), Security & Protection (1 | 0.9%), and Law Enforcement (1 | 0.9%).
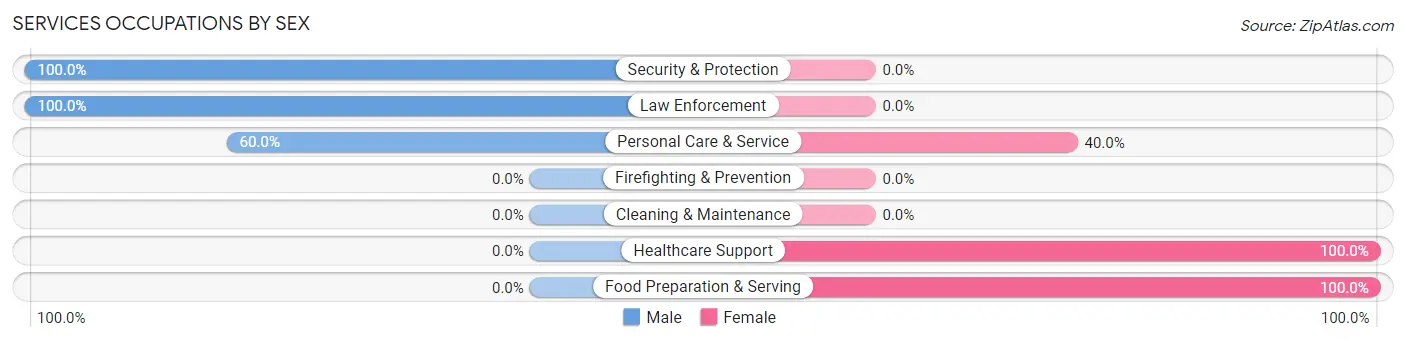
Services Occupations by Sex
Within the Services occupations in Delano, the most male-oriented occupations are Security & Protection (100.0%), Law Enforcement (100.0%), and Personal Care & Service (60.0%), while the most female-oriented occupations are Healthcare Support (100.0%), Food Preparation & Serving (100.0%), and Personal Care & Service (40.0%).
| Occupation | Male | Female |
| Healthcare Support | 0 (0.0%) | 14 (100.0%) |
| Security & Protection | 1 (100.0%) | 0 (0.0%) |
| Firefighting & Prevention | 0 (0.0%) | 0 (0.0%) |
| Law Enforcement | 1 (100.0%) | 0 (0.0%) |
| Food Preparation & Serving | 0 (0.0%) | 4 (100.0%) |
| Cleaning & Maintenance | 0 (0.0%) | 0 (0.0%) |
| Personal Care & Service | 6 (60.0%) | 4 (40.0%) |
| Total (Category) | 7 (24.1%) | 22 (75.9%) |
| Total (Overall) | 64 (58.2%) | 46 (41.8%) |
Sales and Office Occupations
The most common Sales and Office occupations in Delano are Sales & Related (3 | 2.7%), and Office & Administration (3 | 2.7%).

Sales and Office Occupations by Sex

| Occupation | Male | Female |
| Sales & Related | 1 (33.3%) | 2 (66.7%) |
| Office & Administration | 0 (0.0%) | 3 (100.0%) |
| Total (Category) | 1 (16.7%) | 5 (83.3%) |
| Total (Overall) | 64 (58.2%) | 46 (41.8%) |
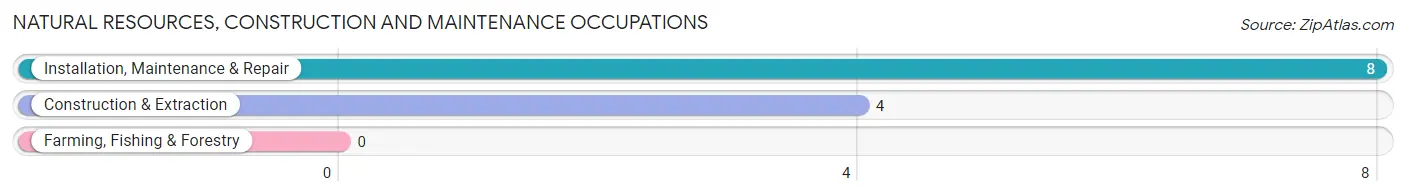
Natural Resources, Construction and Maintenance Occupations
The most common Natural Resources, Construction and Maintenance occupations in Delano are Installation, Maintenance & Repair (8 | 7.3%), and Construction & Extraction (4 | 3.6%).
Natural Resources, Construction and Maintenance Occupations by Sex
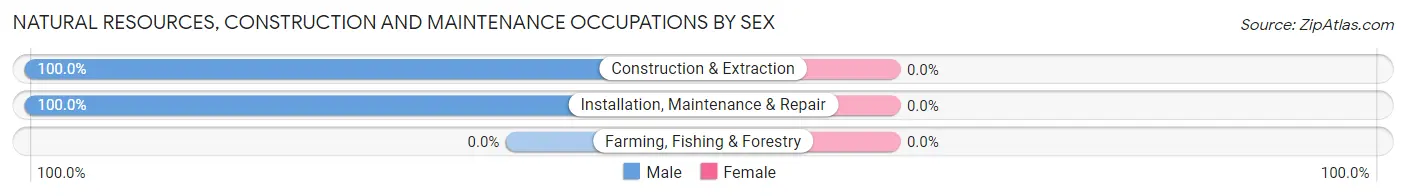
| Occupation | Male | Female |
| Farming, Fishing & Forestry | 0 (0.0%) | 0 (0.0%) |
| Construction & Extraction | 4 (100.0%) | 0 (0.0%) |
| Installation, Maintenance & Repair | 8 (100.0%) | 0 (0.0%) |
| Total (Category) | 12 (100.0%) | 0 (0.0%) |
| Total (Overall) | 64 (58.2%) | 46 (41.8%) |
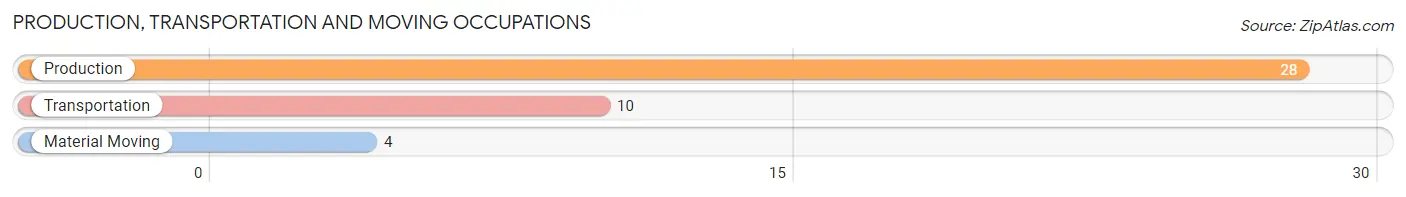
Production, Transportation and Moving Occupations
The most common Production, Transportation and Moving occupations in Delano are Production (28 | 25.5%), Transportation (10 | 9.1%), and Material Moving (4 | 3.6%).
Production, Transportation and Moving Occupations by Sex
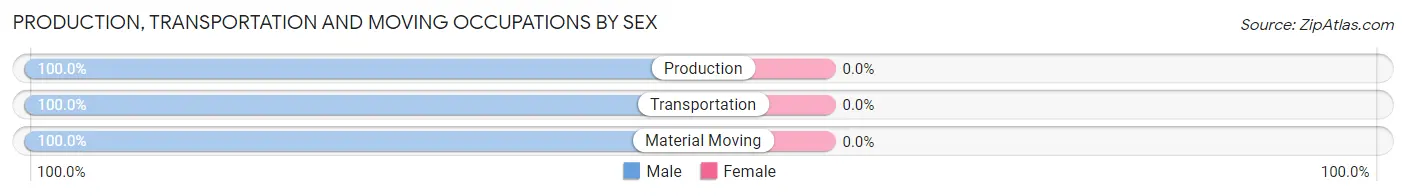
| Occupation | Male | Female |
| Production | 28 (100.0%) | 0 (0.0%) |
| Transportation | 10 (100.0%) | 0 (0.0%) |
| Material Moving | 4 (100.0%) | 0 (0.0%) |
| Total (Category) | 42 (100.0%) | 0 (0.0%) |
| Total (Overall) | 64 (58.2%) | 46 (41.8%) |
Employment Industries by Sex in Delano
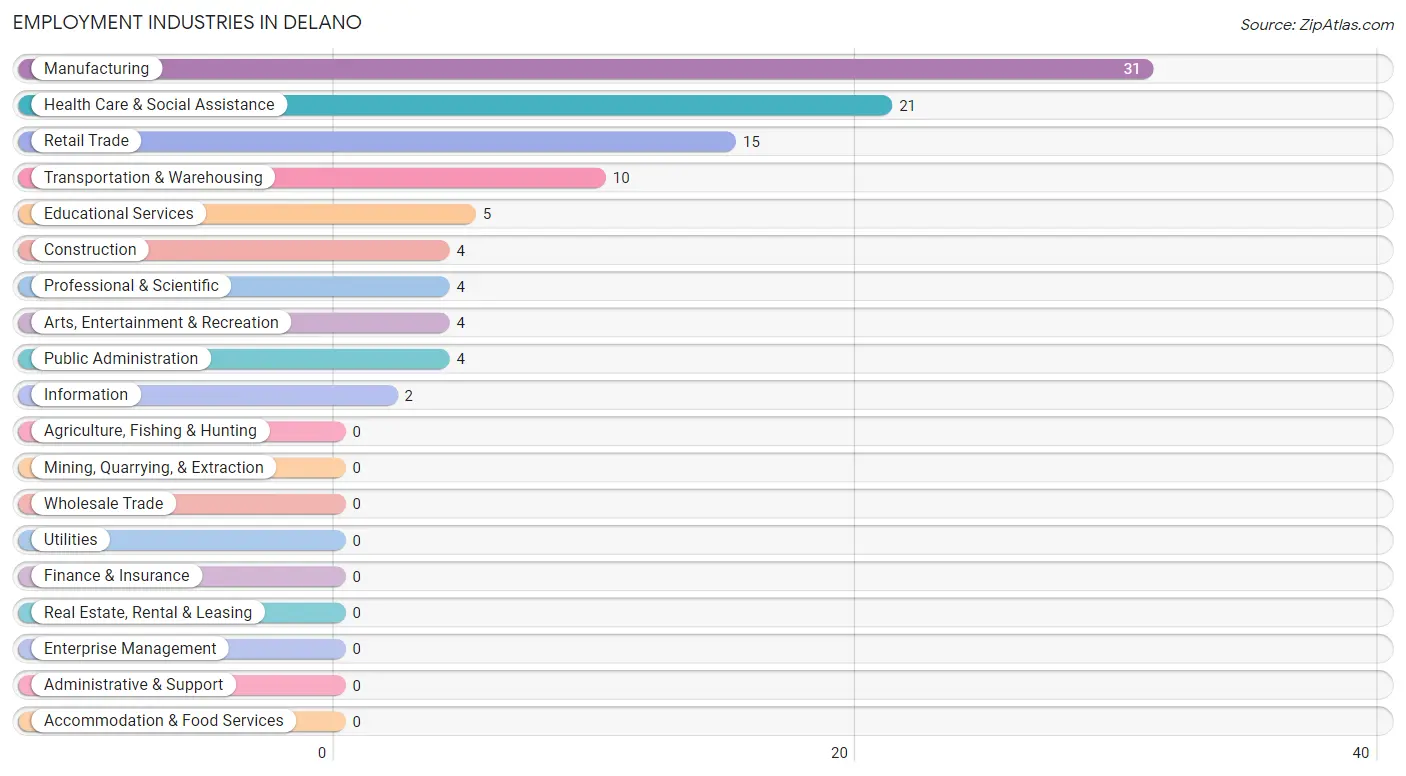
Employment Industries in Delano
The major employment industries in Delano include Manufacturing (31 | 28.2%), Health Care & Social Assistance (21 | 19.1%), Retail Trade (15 | 13.6%), Transportation & Warehousing (10 | 9.1%), and Educational Services (5 | 4.5%).
Employment Industries by Sex in Delano
The Delano industries that see more men than women are Construction (100.0%), Transportation & Warehousing (100.0%), and Information (100.0%), whereas the industries that tend to have a higher number of women are Professional & Scientific (100.0%), Educational Services (100.0%), and Health Care & Social Assistance (100.0%).
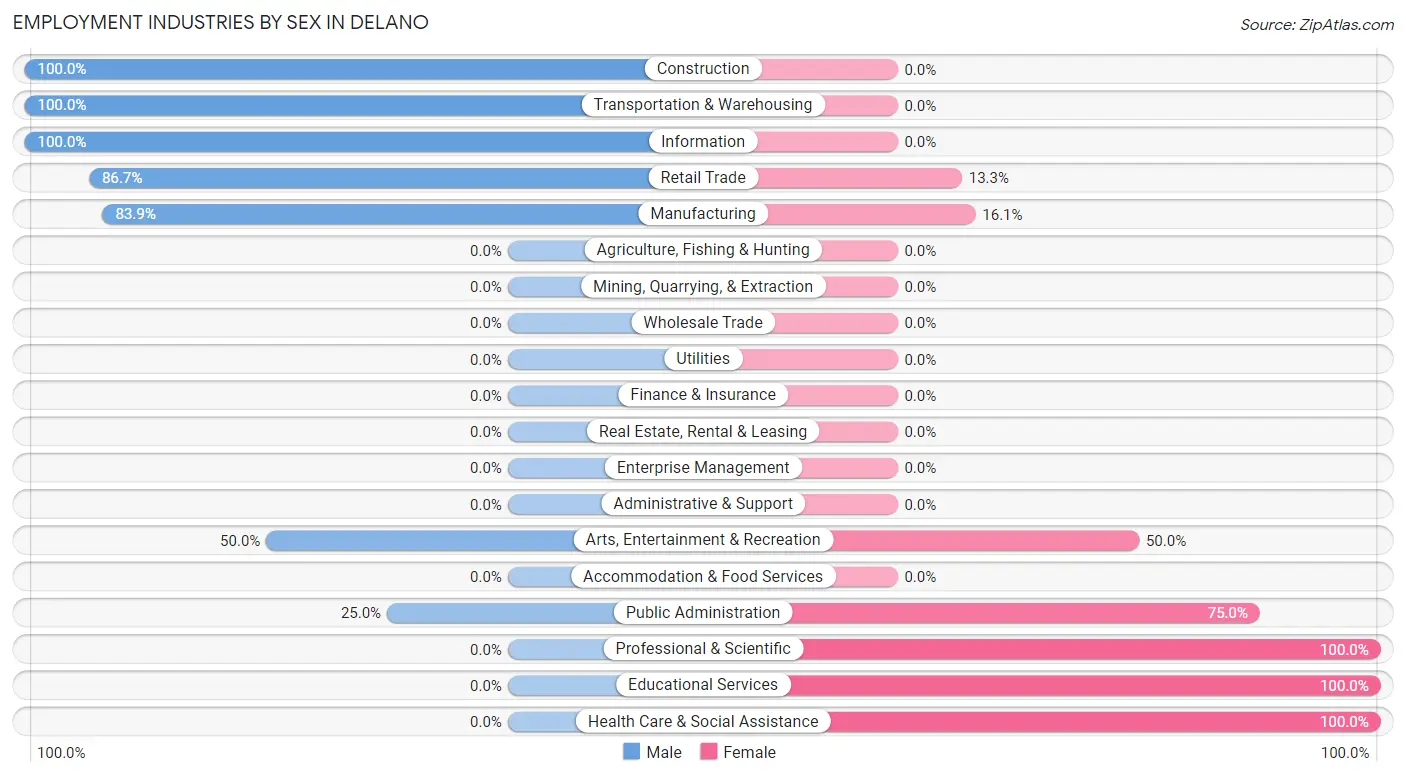
| Industry | Male | Female |
| Agriculture, Fishing & Hunting | 0 (0.0%) | 0 (0.0%) |
| Mining, Quarrying, & Extraction | 0 (0.0%) | 0 (0.0%) |
| Construction | 4 (100.0%) | 0 (0.0%) |
| Manufacturing | 26 (83.9%) | 5 (16.1%) |
| Wholesale Trade | 0 (0.0%) | 0 (0.0%) |
| Retail Trade | 13 (86.7%) | 2 (13.3%) |
| Transportation & Warehousing | 10 (100.0%) | 0 (0.0%) |
| Utilities | 0 (0.0%) | 0 (0.0%) |
| Information | 2 (100.0%) | 0 (0.0%) |
| Finance & Insurance | 0 (0.0%) | 0 (0.0%) |
| Real Estate, Rental & Leasing | 0 (0.0%) | 0 (0.0%) |
| Professional & Scientific | 0 (0.0%) | 4 (100.0%) |
| Enterprise Management | 0 (0.0%) | 0 (0.0%) |
| Administrative & Support | 0 (0.0%) | 0 (0.0%) |
| Educational Services | 0 (0.0%) | 5 (100.0%) |
| Health Care & Social Assistance | 0 (0.0%) | 21 (100.0%) |
| Arts, Entertainment & Recreation | 2 (50.0%) | 2 (50.0%) |
| Accommodation & Food Services | 0 (0.0%) | 0 (0.0%) |
| Public Administration | 1 (25.0%) | 3 (75.0%) |
| Total | 64 (58.2%) | 46 (41.8%) |
Education in Delano
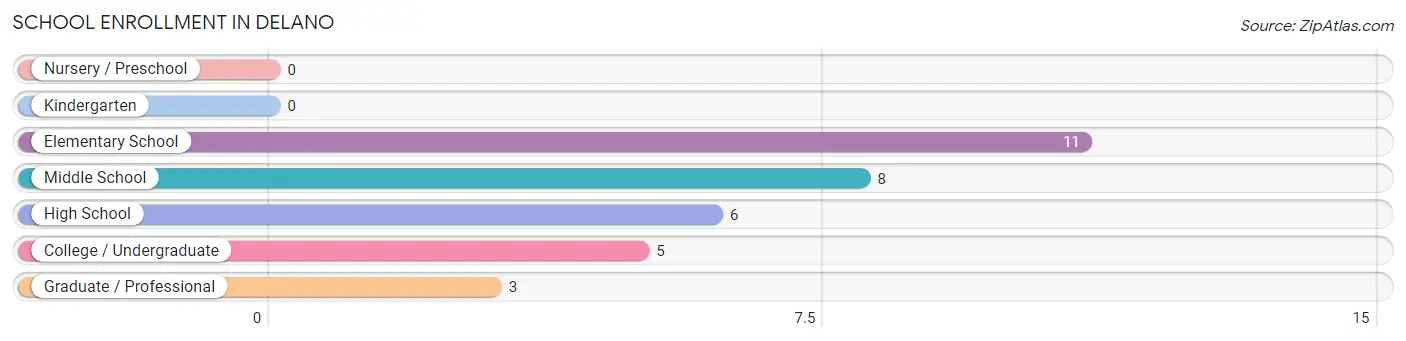
School Enrollment in Delano
The most common levels of schooling among the 33 students in Delano are elementary school (11 | 33.3%), middle school (8 | 24.2%), and high school (6 | 18.2%).
| School Level | # Students | % Students |
| Nursery / Preschool | 0 | 0.0% |
| Kindergarten | 0 | 0.0% |
| Elementary School | 11 | 33.3% |
| Middle School | 8 | 24.2% |
| High School | 6 | 18.2% |
| College / Undergraduate | 5 | 15.1% |
| Graduate / Professional | 3 | 9.1% |
| Total | 33 | 100.0% |
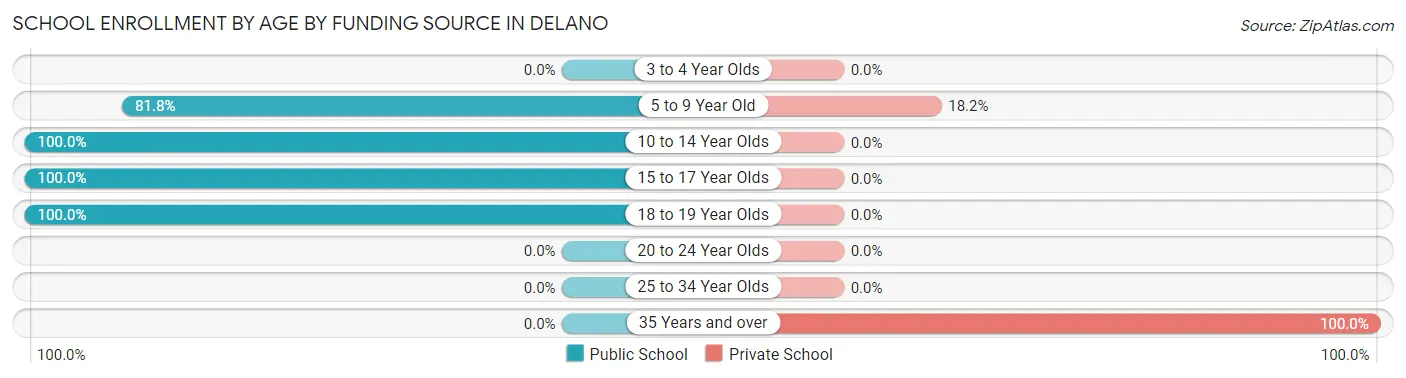
School Enrollment by Age by Funding Source in Delano
Out of a total of 33 students who are enrolled in schools in Delano, 5 (15.2%) attend a private institution, while the remaining 28 (84.8%) are enrolled in public schools. The age group of 35 years and over has the highest likelihood of being enrolled in private schools, with 3 (100.0% in the age bracket) enrolled. Conversely, the age group of 10 to 14 year olds has the lowest likelihood of being enrolled in a private school, with 10 (100.0% in the age bracket) attending a public institution.
| Age Bracket | Public School | Private School |
| 3 to 4 Year Olds | 0 (0.0%) | 0 (0.0%) |
| 5 to 9 Year Old | 9 (81.8%) | 2 (18.2%) |
| 10 to 14 Year Olds | 10 (100.0%) | 0 (0.0%) |
| 15 to 17 Year Olds | 2 (100.0%) | 0 (0.0%) |
| 18 to 19 Year Olds | 7 (100.0%) | 0 (0.0%) |
| 20 to 24 Year Olds | 0 (0.0%) | 0 (0.0%) |
| 25 to 34 Year Olds | 0 (0.0%) | 0 (0.0%) |
| 35 Years and over | 0 (0.0%) | 3 (100.0%) |
| Total | 28 (84.8%) | 5 (15.2%) |
Educational Attainment by Field of Study in Delano
Education (7 | 53.8%), science & technology (3 | 23.1%), visual & performing arts (2 | 15.4%), and bio, nature & agricultural (1 | 7.7%) are the most common fields of study among 13 individuals in Delano who have obtained a bachelor's degree or higher.
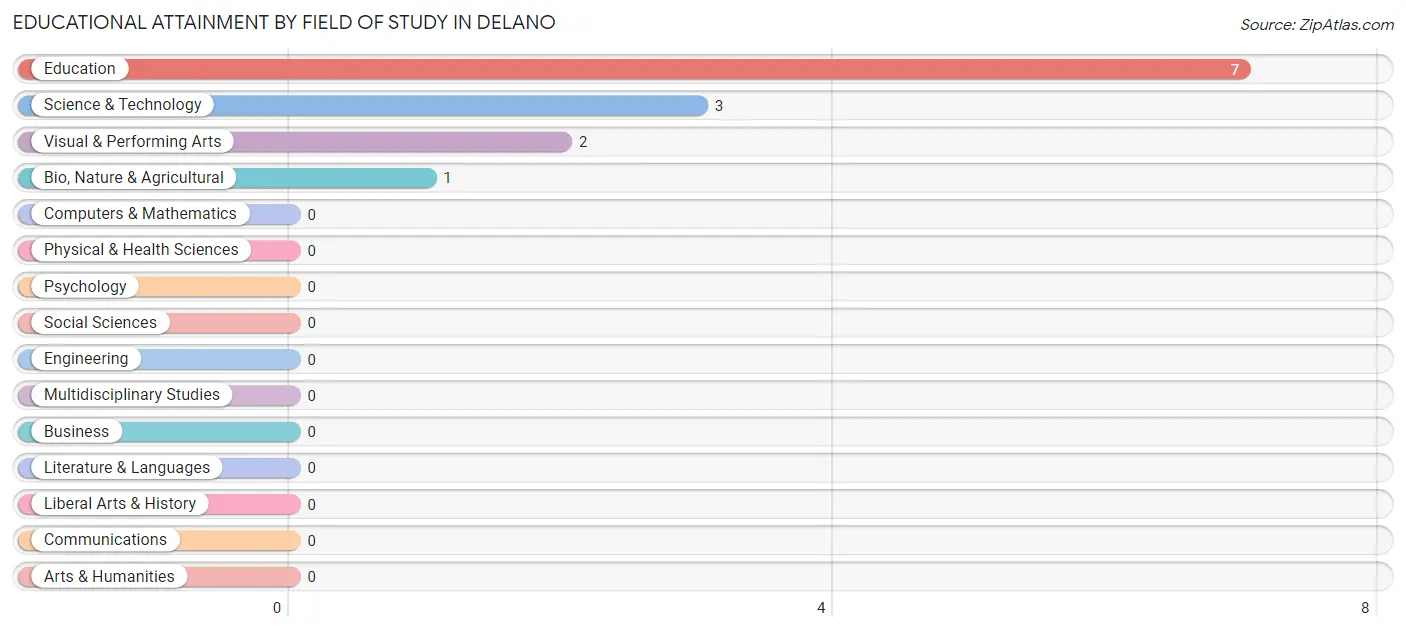
| Field of Study | # Graduates | % Graduates |
| Computers & Mathematics | 0 | 0.0% |
| Bio, Nature & Agricultural | 1 | 7.7% |
| Physical & Health Sciences | 0 | 0.0% |
| Psychology | 0 | 0.0% |
| Social Sciences | 0 | 0.0% |
| Engineering | 0 | 0.0% |
| Multidisciplinary Studies | 0 | 0.0% |
| Science & Technology | 3 | 23.1% |
| Business | 0 | 0.0% |
| Education | 7 | 53.8% |
| Literature & Languages | 0 | 0.0% |
| Liberal Arts & History | 0 | 0.0% |
| Visual & Performing Arts | 2 | 15.4% |
| Communications | 0 | 0.0% |
| Arts & Humanities | 0 | 0.0% |
| Total | 13 | 100.0% |
Transportation & Commute in Delano
Vehicle Availability by Sex in Delano
The most prevalent vehicle ownership categories in Delano are males with 2 vehicles (40, accounting for 62.5%) and females with 2 vehicles (26, making up 87.0%).
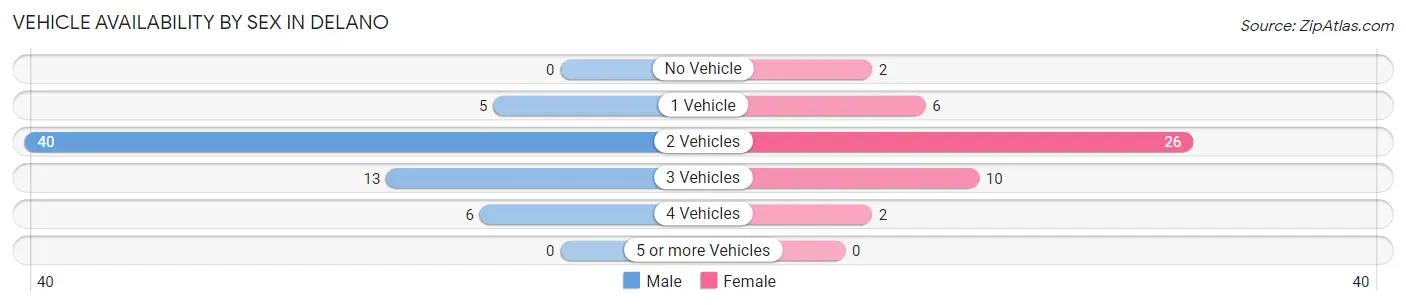
| Vehicles Available | Male | Female |
| No Vehicle | 0 (0.0%) | 2 (4.3%) |
| 1 Vehicle | 5 (7.8%) | 6 (13.0%) |
| 2 Vehicles | 40 (62.5%) | 26 (56.5%) |
| 3 Vehicles | 13 (20.3%) | 10 (21.7%) |
| 4 Vehicles | 6 (9.4%) | 2 (4.3%) |
| 5 or more Vehicles | 0 (0.0%) | 0 (0.0%) |
| Total | 64 (100.0%) | 46 (100.0%) |
Commute Time in Delano
The most frequently occuring commute durations in Delano are 15 to 19 minutes (31 commuters, 29.2%), 20 to 24 minutes (21 commuters, 19.8%), and 40 to 44 minutes (12 commuters, 11.3%).
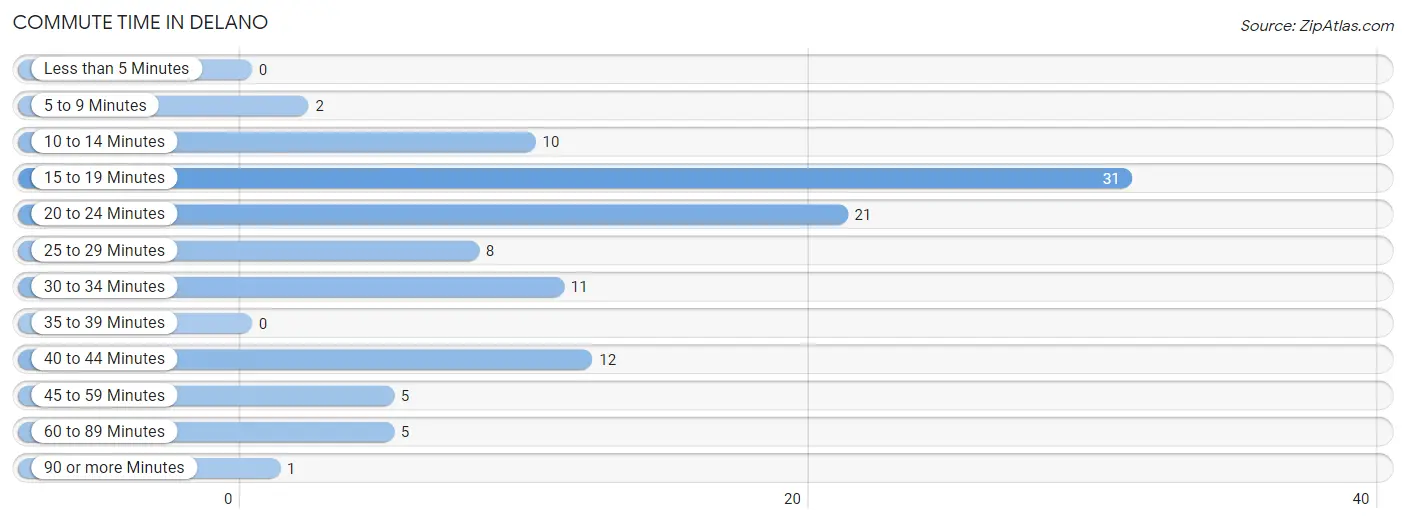
| Commute Time | # Commuters | % Commuters |
| Less than 5 Minutes | 0 | 0.0% |
| 5 to 9 Minutes | 2 | 1.9% |
| 10 to 14 Minutes | 10 | 9.4% |
| 15 to 19 Minutes | 31 | 29.2% |
| 20 to 24 Minutes | 21 | 19.8% |
| 25 to 29 Minutes | 8 | 7.5% |
| 30 to 34 Minutes | 11 | 10.4% |
| 35 to 39 Minutes | 0 | 0.0% |
| 40 to 44 Minutes | 12 | 11.3% |
| 45 to 59 Minutes | 5 | 4.7% |
| 60 to 89 Minutes | 5 | 4.7% |
| 90 or more Minutes | 1 | 0.9% |
Commute Time by Sex in Delano
The most common commute times in Delano are 15 to 19 minutes (25 commuters, 39.1%) for males and 20 to 24 minutes (11 commuters, 26.2%) for females.
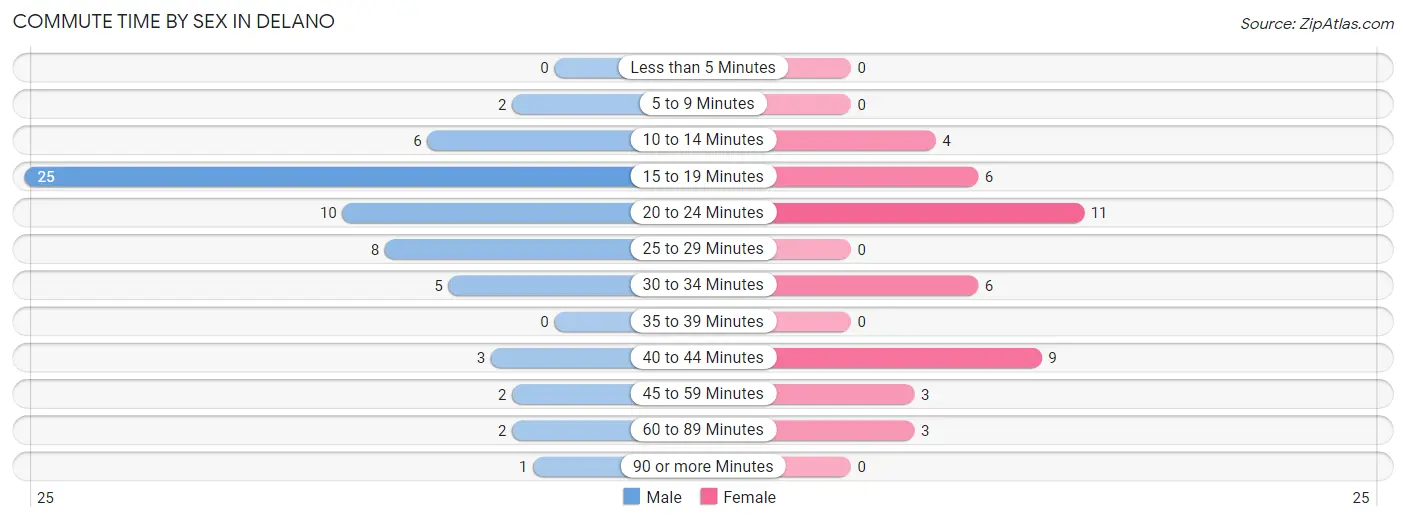
| Commute Time | Male | Female |
| Less than 5 Minutes | 0 (0.0%) | 0 (0.0%) |
| 5 to 9 Minutes | 2 (3.1%) | 0 (0.0%) |
| 10 to 14 Minutes | 6 (9.4%) | 4 (9.5%) |
| 15 to 19 Minutes | 25 (39.1%) | 6 (14.3%) |
| 20 to 24 Minutes | 10 (15.6%) | 11 (26.2%) |
| 25 to 29 Minutes | 8 (12.5%) | 0 (0.0%) |
| 30 to 34 Minutes | 5 (7.8%) | 6 (14.3%) |
| 35 to 39 Minutes | 0 (0.0%) | 0 (0.0%) |
| 40 to 44 Minutes | 3 (4.7%) | 9 (21.4%) |
| 45 to 59 Minutes | 2 (3.1%) | 3 (7.1%) |
| 60 to 89 Minutes | 2 (3.1%) | 3 (7.1%) |
| 90 or more Minutes | 1 (1.6%) | 0 (0.0%) |
Time of Departure to Work by Sex in Delano
The most frequent times of departure to work in Delano are 6:00 AM to 6:29 AM (32, 50.0%) for males and 7:30 AM to 7:59 AM (14, 33.3%) for females.
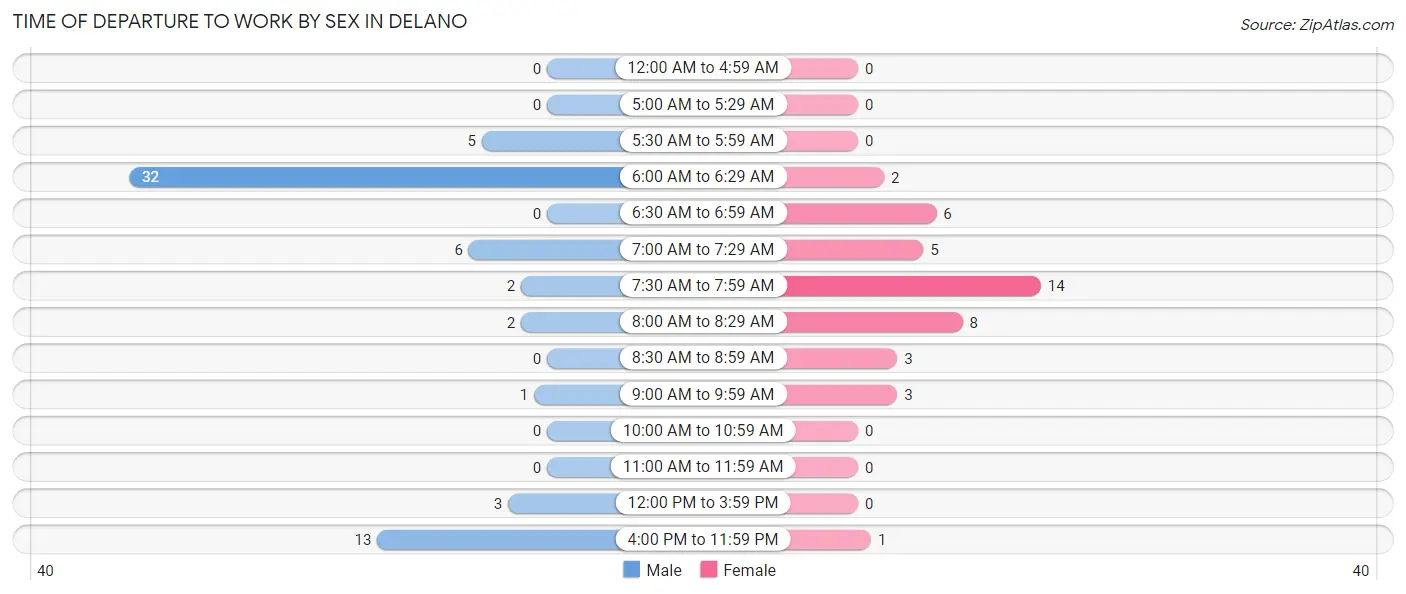
| Time of Departure | Male | Female |
| 12:00 AM to 4:59 AM | 0 (0.0%) | 0 (0.0%) |
| 5:00 AM to 5:29 AM | 0 (0.0%) | 0 (0.0%) |
| 5:30 AM to 5:59 AM | 5 (7.8%) | 0 (0.0%) |
| 6:00 AM to 6:29 AM | 32 (50.0%) | 2 (4.8%) |
| 6:30 AM to 6:59 AM | 0 (0.0%) | 6 (14.3%) |
| 7:00 AM to 7:29 AM | 6 (9.4%) | 5 (11.9%) |
| 7:30 AM to 7:59 AM | 2 (3.1%) | 14 (33.3%) |
| 8:00 AM to 8:29 AM | 2 (3.1%) | 8 (19.1%) |
| 8:30 AM to 8:59 AM | 0 (0.0%) | 3 (7.1%) |
| 9:00 AM to 9:59 AM | 1 (1.6%) | 3 (7.1%) |
| 10:00 AM to 10:59 AM | 0 (0.0%) | 0 (0.0%) |
| 11:00 AM to 11:59 AM | 0 (0.0%) | 0 (0.0%) |
| 12:00 PM to 3:59 PM | 3 (4.7%) | 0 (0.0%) |
| 4:00 PM to 11:59 PM | 13 (20.3%) | 1 (2.4%) |
| Total | 64 (100.0%) | 42 (100.0%) |
Housing Occupancy in Delano
Occupancy by Ownership in Delano
Of the total 106 dwellings in Delano, owner-occupied units account for 96 (90.6%), while renter-occupied units make up 10 (9.4%).
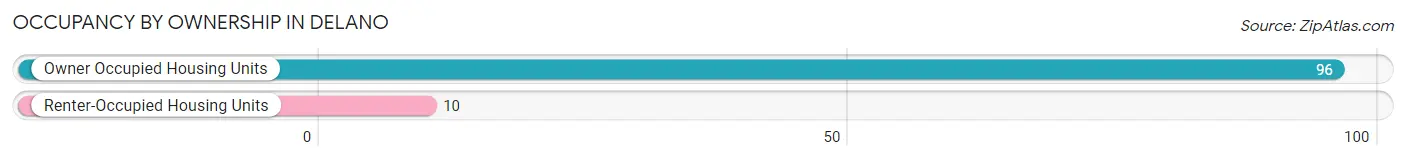
| Occupancy | # Housing Units | % Housing Units |
| Owner Occupied Housing Units | 96 | 90.6% |
| Renter-Occupied Housing Units | 10 | 9.4% |
| Total Occupied Housing Units | 106 | 100.0% |
Occupancy by Household Size in Delano
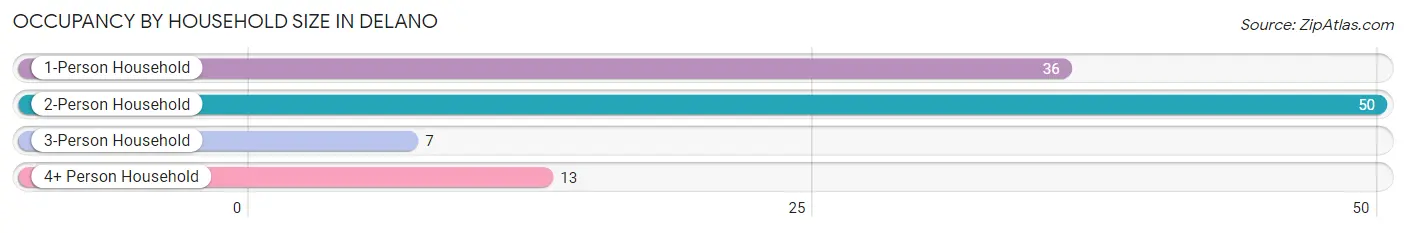
| Household Size | # Housing Units | % Housing Units |
| 1-Person Household | 36 | 34.0% |
| 2-Person Household | 50 | 47.2% |
| 3-Person Household | 7 | 6.6% |
| 4+ Person Household | 13 | 12.3% |
| Total Housing Units | 106 | 100.0% |
Occupancy by Ownership by Household Size in Delano
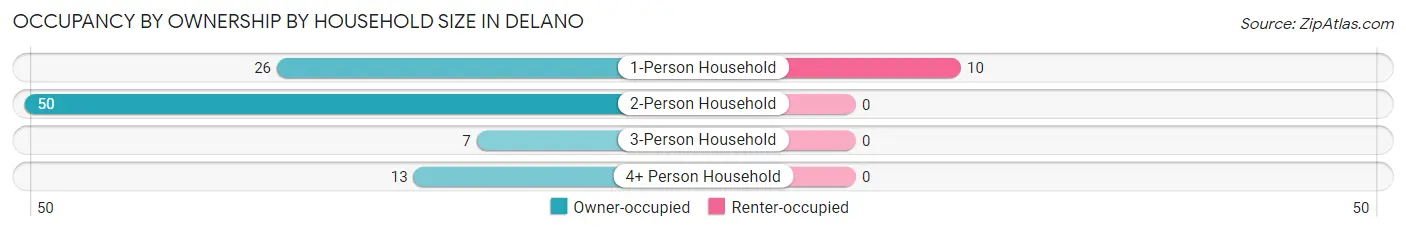
| Household Size | Owner-occupied | Renter-occupied |
| 1-Person Household | 26 (72.2%) | 10 (27.8%) |
| 2-Person Household | 50 (100.0%) | 0 (0.0%) |
| 3-Person Household | 7 (100.0%) | 0 (0.0%) |
| 4+ Person Household | 13 (100.0%) | 0 (0.0%) |
| Total Housing Units | 96 (90.6%) | 10 (9.4%) |
Occupancy by Educational Attainment in Delano
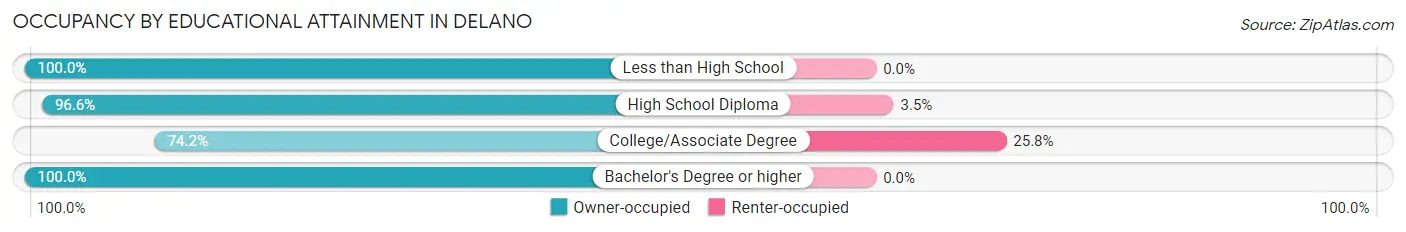
| Household Size | Owner-occupied | Renter-occupied |
| Less than High School | 4 (100.0%) | 0 (0.0%) |
| High School Diploma | 56 (96.6%) | 2 (3.5%) |
| College/Associate Degree | 23 (74.2%) | 8 (25.8%) |
| Bachelor's Degree or higher | 13 (100.0%) | 0 (0.0%) |
Occupancy by Age of Householder in Delano
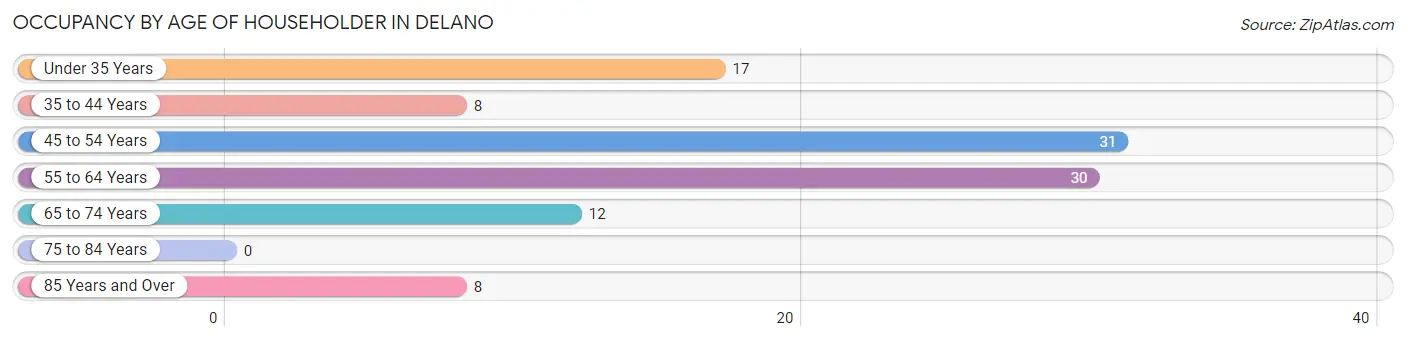
| Age Bracket | # Households | % Households |
| Under 35 Years | 17 | 16.0% |
| 35 to 44 Years | 8 | 7.5% |
| 45 to 54 Years | 31 | 29.2% |
| 55 to 64 Years | 30 | 28.3% |
| 65 to 74 Years | 12 | 11.3% |
| 75 to 84 Years | 0 | 0.0% |
| 85 Years and Over | 8 | 7.5% |
| Total | 106 | 100.0% |
Housing Finances in Delano
Median Income by Occupancy in Delano
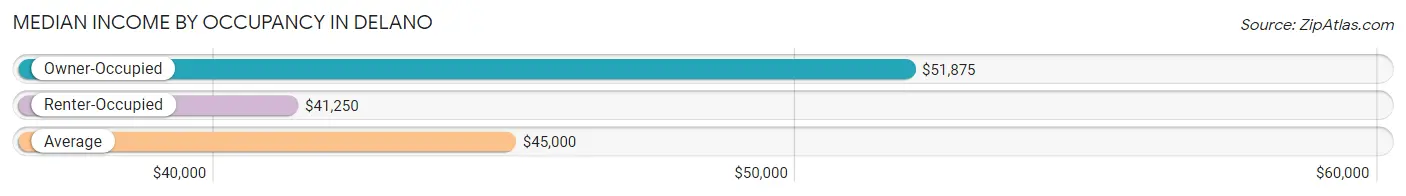
| Occupancy Type | # Households | Median Income |
| Owner-Occupied | 96 (90.6%) | $51,875 |
| Renter-Occupied | 10 (9.4%) | $41,250 |
| Average | 106 (100.0%) | $45,000 |
Occupancy by Householder Income Bracket in Delano
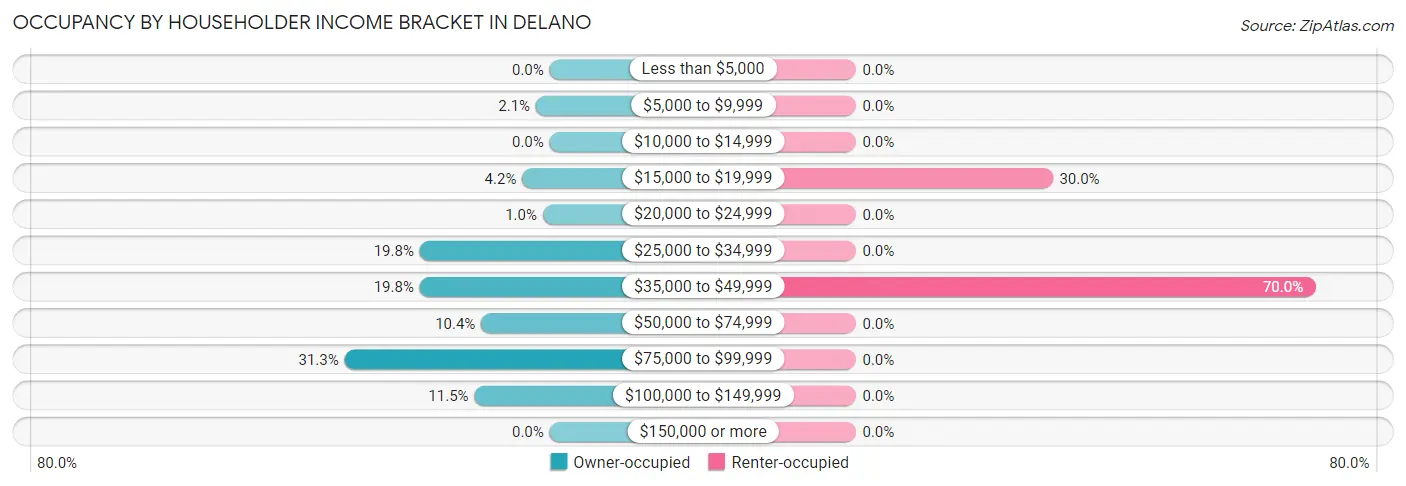
| Income Bracket | Owner-occupied | Renter-occupied |
| Less than $5,000 | 0 (0.0%) | 0 (0.0%) |
| $5,000 to $9,999 | 2 (2.1%) | 0 (0.0%) |
| $10,000 to $14,999 | 0 (0.0%) | 0 (0.0%) |
| $15,000 to $19,999 | 4 (4.2%) | 3 (30.0%) |
| $20,000 to $24,999 | 1 (1.0%) | 0 (0.0%) |
| $25,000 to $34,999 | 19 (19.8%) | 0 (0.0%) |
| $35,000 to $49,999 | 19 (19.8%) | 7 (70.0%) |
| $50,000 to $74,999 | 10 (10.4%) | 0 (0.0%) |
| $75,000 to $99,999 | 30 (31.2%) | 0 (0.0%) |
| $100,000 to $149,999 | 11 (11.5%) | 0 (0.0%) |
| $150,000 or more | 0 (0.0%) | 0 (0.0%) |
| Total | 96 (100.0%) | 10 (100.0%) |
Monthly Housing Cost Tiers in Delano
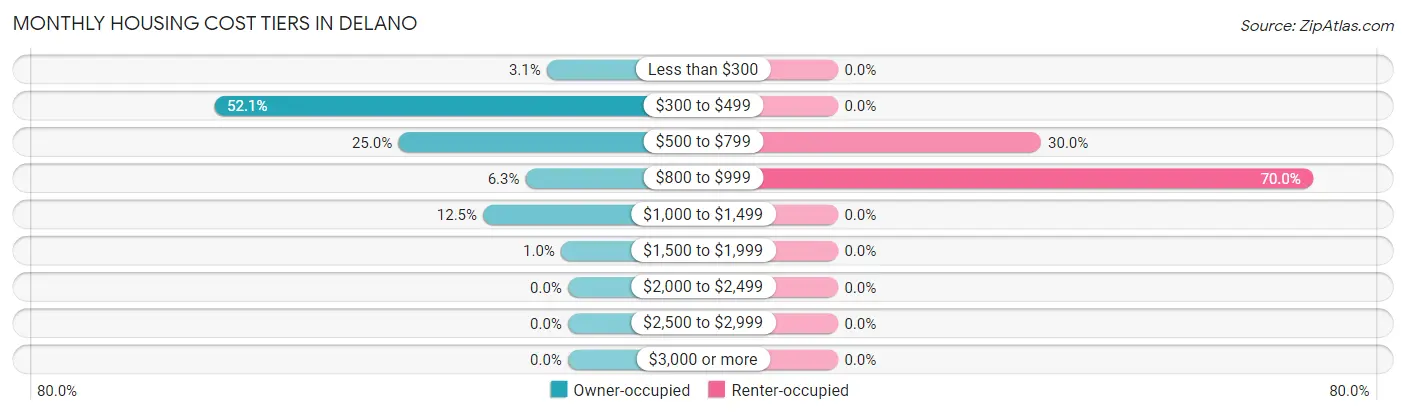
| Monthly Cost | Owner-occupied | Renter-occupied |
| Less than $300 | 3 (3.1%) | 0 (0.0%) |
| $300 to $499 | 50 (52.1%) | 0 (0.0%) |
| $500 to $799 | 24 (25.0%) | 3 (30.0%) |
| $800 to $999 | 6 (6.2%) | 7 (70.0%) |
| $1,000 to $1,499 | 12 (12.5%) | 0 (0.0%) |
| $1,500 to $1,999 | 1 (1.0%) | 0 (0.0%) |
| $2,000 to $2,499 | 0 (0.0%) | 0 (0.0%) |
| $2,500 to $2,999 | 0 (0.0%) | 0 (0.0%) |
| $3,000 or more | 0 (0.0%) | 0 (0.0%) |
| Total | 96 (100.0%) | 10 (100.0%) |
Physical Housing Characteristics in Delano
Housing Structures in Delano
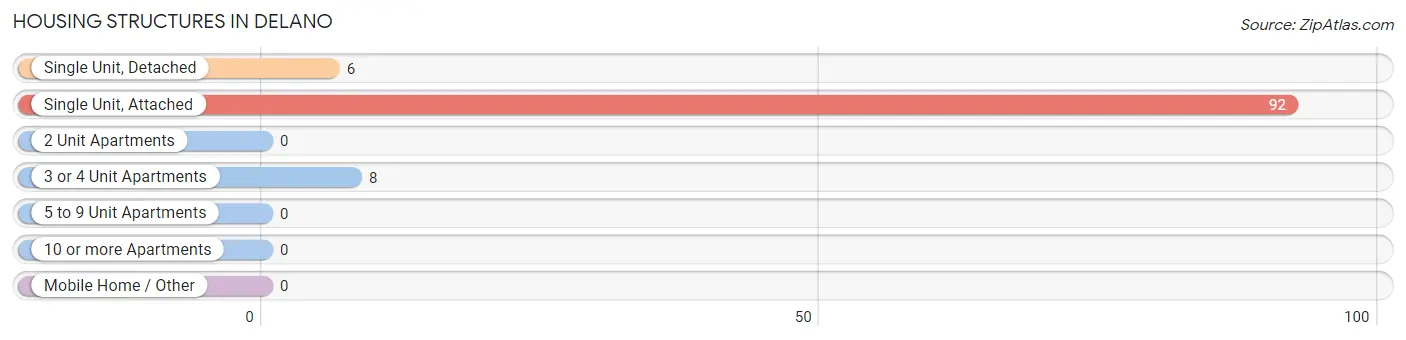
| Structure Type | # Housing Units | % Housing Units |
| Single Unit, Detached | 6 | 5.7% |
| Single Unit, Attached | 92 | 86.8% |
| 2 Unit Apartments | 0 | 0.0% |
| 3 or 4 Unit Apartments | 8 | 7.5% |
| 5 to 9 Unit Apartments | 0 | 0.0% |
| 10 or more Apartments | 0 | 0.0% |
| Mobile Home / Other | 0 | 0.0% |
| Total | 106 | 100.0% |
Housing Structures by Occupancy in Delano
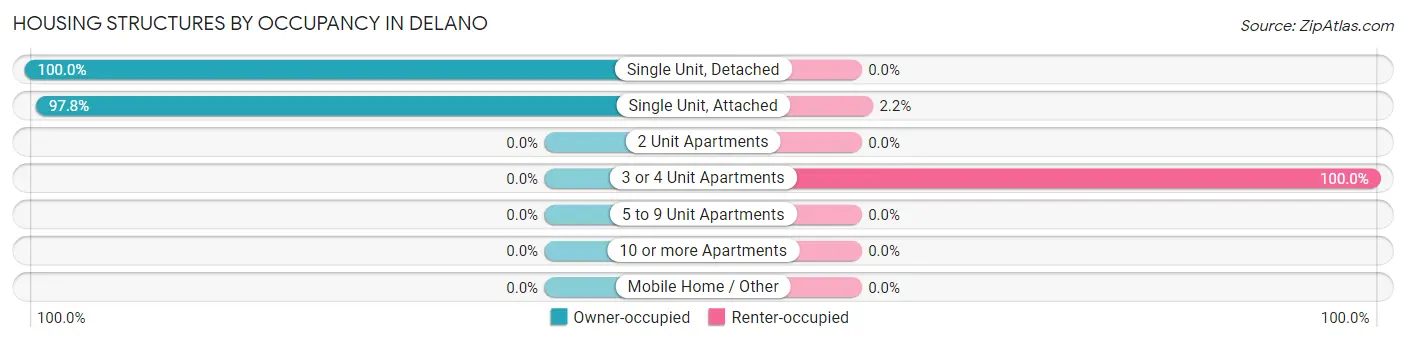
| Structure Type | Owner-occupied | Renter-occupied |
| Single Unit, Detached | 6 (100.0%) | 0 (0.0%) |
| Single Unit, Attached | 90 (97.8%) | 2 (2.2%) |
| 2 Unit Apartments | 0 (0.0%) | 0 (0.0%) |
| 3 or 4 Unit Apartments | 0 (0.0%) | 8 (100.0%) |
| 5 to 9 Unit Apartments | 0 (0.0%) | 0 (0.0%) |
| 10 or more Apartments | 0 (0.0%) | 0 (0.0%) |
| Mobile Home / Other | 0 (0.0%) | 0 (0.0%) |
| Total | 96 (90.6%) | 10 (9.4%) |
Housing Structures by Number of Rooms in Delano
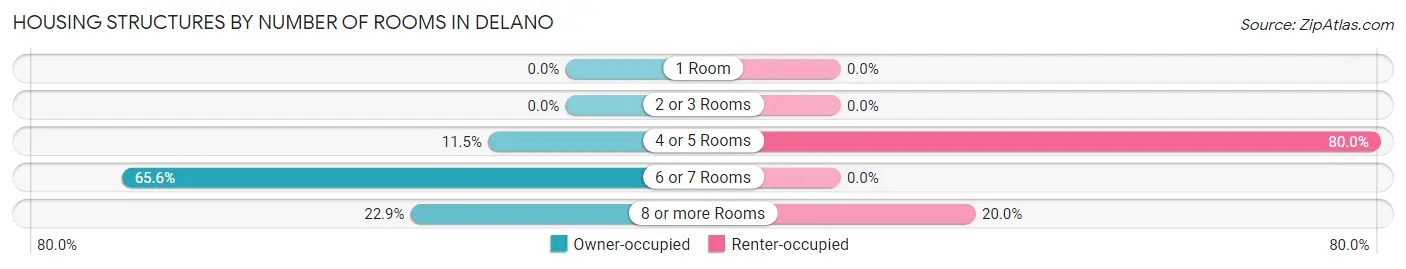
| Number of Rooms | Owner-occupied | Renter-occupied |
| 1 Room | 0 (0.0%) | 0 (0.0%) |
| 2 or 3 Rooms | 0 (0.0%) | 0 (0.0%) |
| 4 or 5 Rooms | 11 (11.5%) | 8 (80.0%) |
| 6 or 7 Rooms | 63 (65.6%) | 0 (0.0%) |
| 8 or more Rooms | 22 (22.9%) | 2 (20.0%) |
| Total | 96 (100.0%) | 10 (100.0%) |
Housing Structure by Heating Type in Delano
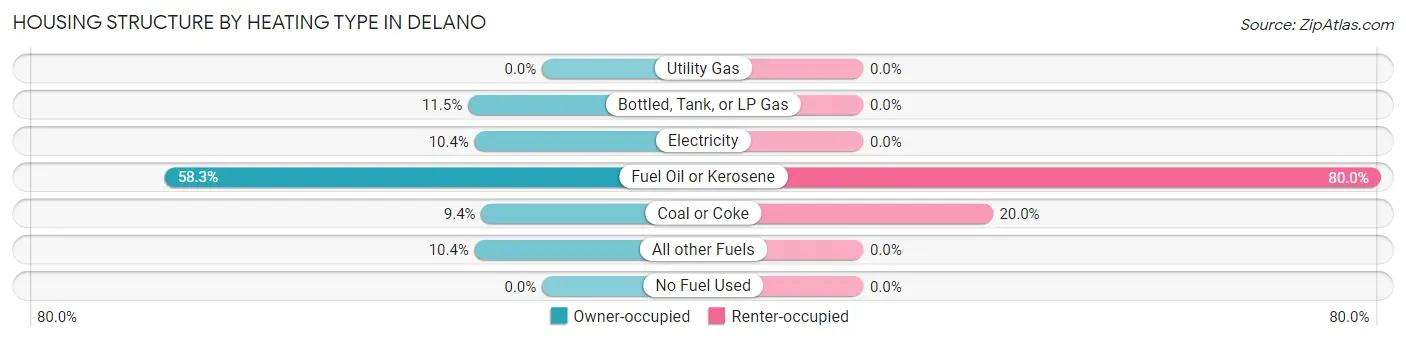
| Heating Type | Owner-occupied | Renter-occupied |
| Utility Gas | 0 (0.0%) | 0 (0.0%) |
| Bottled, Tank, or LP Gas | 11 (11.5%) | 0 (0.0%) |
| Electricity | 10 (10.4%) | 0 (0.0%) |
| Fuel Oil or Kerosene | 56 (58.3%) | 8 (80.0%) |
| Coal or Coke | 9 (9.4%) | 2 (20.0%) |
| All other Fuels | 10 (10.4%) | 0 (0.0%) |
| No Fuel Used | 0 (0.0%) | 0 (0.0%) |
| Total | 96 (100.0%) | 10 (100.0%) |
Household Vehicle Usage in Delano
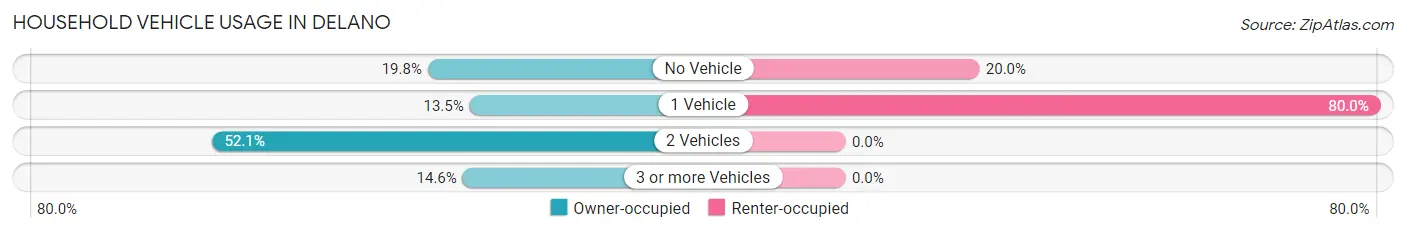
| Vehicles per Household | Owner-occupied | Renter-occupied |
| No Vehicle | 19 (19.8%) | 2 (20.0%) |
| 1 Vehicle | 13 (13.5%) | 8 (80.0%) |
| 2 Vehicles | 50 (52.1%) | 0 (0.0%) |
| 3 or more Vehicles | 14 (14.6%) | 0 (0.0%) |
| Total | 96 (100.0%) | 10 (100.0%) |
Real Estate & Mortgages in Delano
Real Estate and Mortgage Overview in Delano
| Characteristic | Without Mortgage | With Mortgage |
| Housing Units | 67 | 29 |
| Median Property Value | $42,300 | $42,300 |
| Median Household Income | $43,542 | $0 |
| Monthly Housing Costs | $454 | $0 |
| Real Estate Taxes | $1,275 | $3 |
Property Value by Mortgage Status in Delano

| Property Value | Without Mortgage | With Mortgage |
| Less than $50,000 | 42 (62.7%) | 23 (79.3%) |
| $50,000 to $99,999 | 24 (35.8%) | 5 (17.2%) |
| $100,000 to $299,999 | 1 (1.5%) | 1 (3.5%) |
| $300,000 to $499,999 | 0 (0.0%) | 0 (0.0%) |
| $500,000 to $749,999 | 0 (0.0%) | 0 (0.0%) |
| $750,000 to $999,999 | 0 (0.0%) | 0 (0.0%) |
| $1,000,000 or more | 0 (0.0%) | 0 (0.0%) |
| Total | 67 (100.0%) | 29 (100.0%) |
Household Income by Mortgage Status in Delano
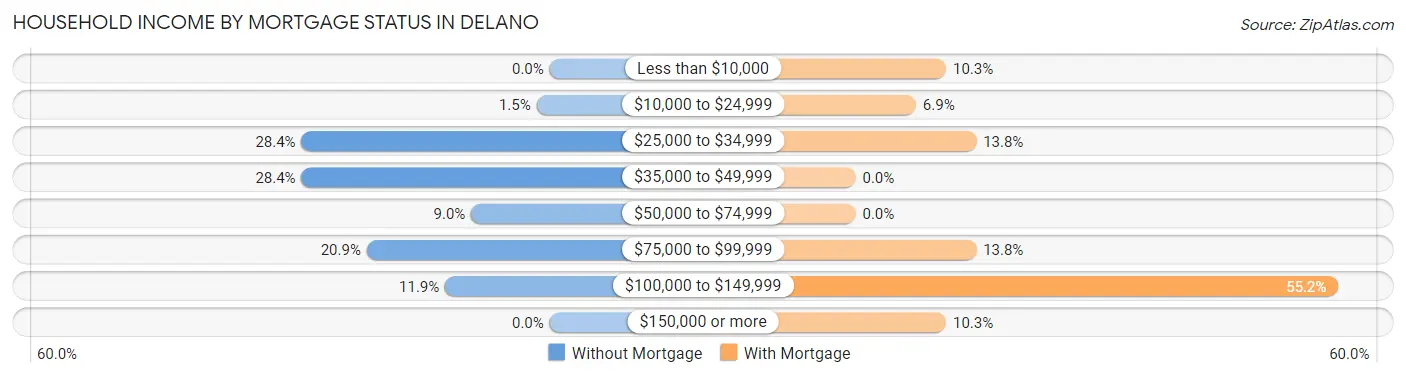
| Household Income | Without Mortgage | With Mortgage |
| Less than $10,000 | 0 (0.0%) | 3 (10.3%) |
| $10,000 to $24,999 | 1 (1.5%) | 2 (6.9%) |
| $25,000 to $34,999 | 19 (28.4%) | 4 (13.8%) |
| $35,000 to $49,999 | 19 (28.4%) | 0 (0.0%) |
| $50,000 to $74,999 | 6 (9.0%) | 0 (0.0%) |
| $75,000 to $99,999 | 14 (20.9%) | 4 (13.8%) |
| $100,000 to $149,999 | 8 (11.9%) | 16 (55.2%) |
| $150,000 or more | 0 (0.0%) | 3 (10.3%) |
| Total | 67 (100.0%) | 29 (100.0%) |
Property Value to Household Income Ratio in Delano
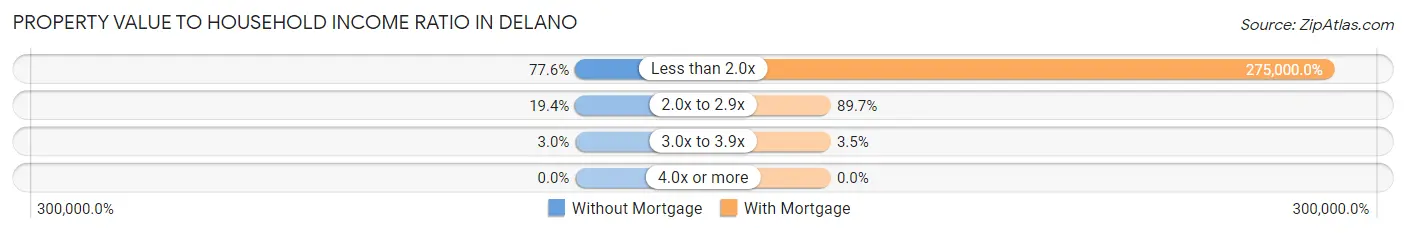
| Value-to-Income Ratio | Without Mortgage | With Mortgage |
| Less than 2.0x | 52 (77.6%) | 79,750 (275,000.0%) |
| 2.0x to 2.9x | 13 (19.4%) | 26 (89.7%) |
| 3.0x to 3.9x | 2 (3.0%) | 1 (3.5%) |
| 4.0x or more | 0 (0.0%) | 0 (0.0%) |
| Total | 67 (100.0%) | 29 (100.0%) |
Real Estate Taxes by Mortgage Status in Delano
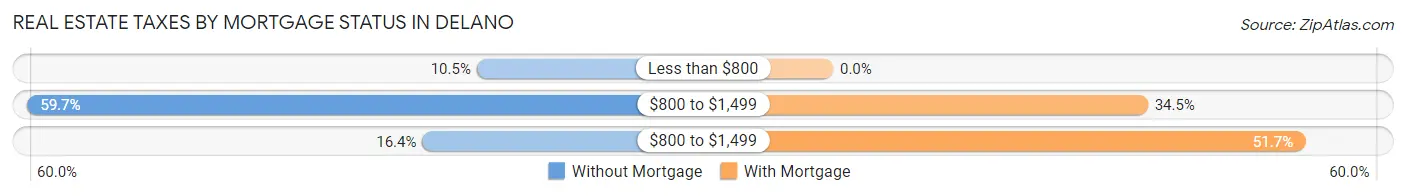
| Property Taxes | Without Mortgage | With Mortgage |
| Less than $800 | 7 (10.4%) | 0 (0.0%) |
| $800 to $1,499 | 40 (59.7%) | 10 (34.5%) |
| $800 to $1,499 | 11 (16.4%) | 15 (51.7%) |
| Total | 67 (100.0%) | 29 (100.0%) |
Health & Disability in Delano
Health Insurance Coverage by Age in Delano
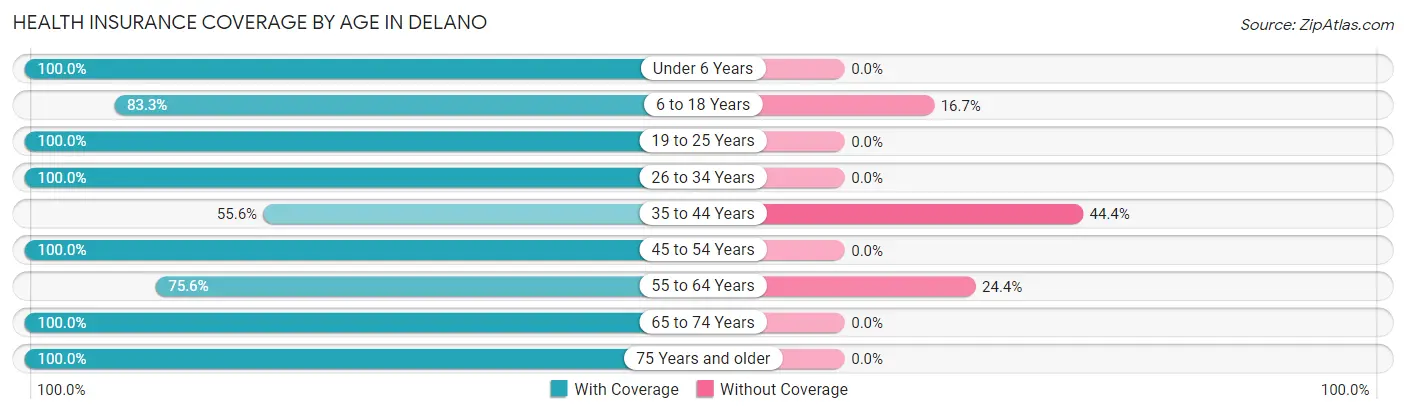
| Age Bracket | With Coverage | Without Coverage |
| Under 6 Years | 8 (100.0%) | 0 (0.0%) |
| 6 to 18 Years | 25 (83.3%) | 5 (16.7%) |
| 19 to 25 Years | 22 (100.0%) | 0 (0.0%) |
| 26 to 34 Years | 22 (100.0%) | 0 (0.0%) |
| 35 to 44 Years | 10 (55.6%) | 8 (44.4%) |
| 45 to 54 Years | 33 (100.0%) | 0 (0.0%) |
| 55 to 64 Years | 31 (75.6%) | 10 (24.4%) |
| 65 to 74 Years | 31 (100.0%) | 0 (0.0%) |
| 75 Years and older | 9 (100.0%) | 0 (0.0%) |
| Total | 191 (89.2%) | 23 (10.7%) |
Health Insurance Coverage by Citizenship Status in Delano

| Citizenship Status | With Coverage | Without Coverage |
| Native Born | 8 (100.0%) | 0 (0.0%) |
| Foreign Born, Citizen | 25 (83.3%) | 5 (16.7%) |
| Foreign Born, not a Citizen | 22 (100.0%) | 0 (0.0%) |
Health Insurance Coverage by Household Income in Delano
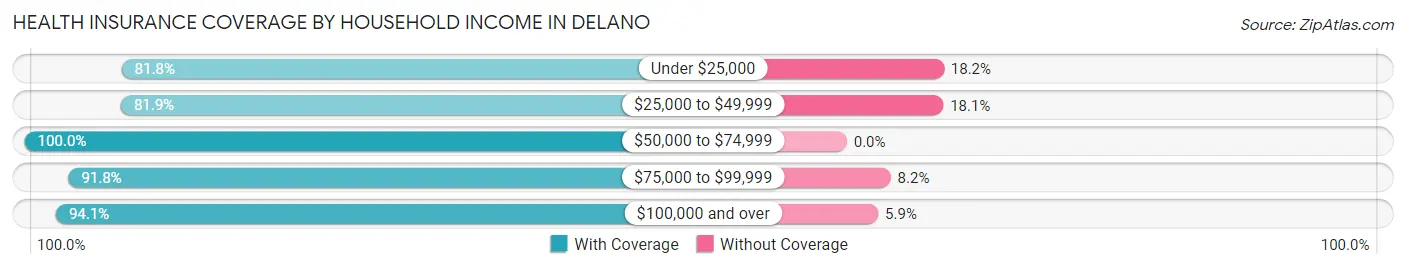
| Household Income | With Coverage | Without Coverage |
| Under $25,000 | 9 (81.8%) | 2 (18.2%) |
| $25,000 to $49,999 | 59 (81.9%) | 13 (18.1%) |
| $50,000 to $74,999 | 24 (100.0%) | 0 (0.0%) |
| $75,000 to $99,999 | 67 (91.8%) | 6 (8.2%) |
| $100,000 and over | 32 (94.1%) | 2 (5.9%) |
Public vs Private Health Insurance Coverage by Age in Delano
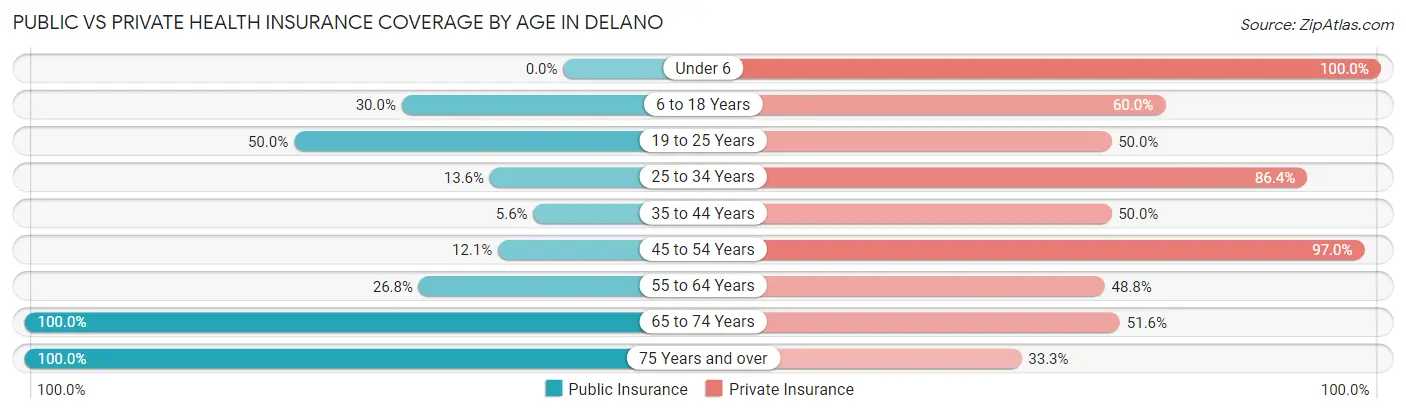
| Age Bracket | Public Insurance | Private Insurance |
| Under 6 | 0 (0.0%) | 8 (100.0%) |
| 6 to 18 Years | 9 (30.0%) | 18 (60.0%) |
| 19 to 25 Years | 11 (50.0%) | 11 (50.0%) |
| 25 to 34 Years | 3 (13.6%) | 19 (86.4%) |
| 35 to 44 Years | 1 (5.6%) | 9 (50.0%) |
| 45 to 54 Years | 4 (12.1%) | 32 (97.0%) |
| 55 to 64 Years | 11 (26.8%) | 20 (48.8%) |
| 65 to 74 Years | 31 (100.0%) | 16 (51.6%) |
| 75 Years and over | 9 (100.0%) | 3 (33.3%) |
| Total | 79 (36.9%) | 136 (63.5%) |
Disability Status by Sex by Age in Delano
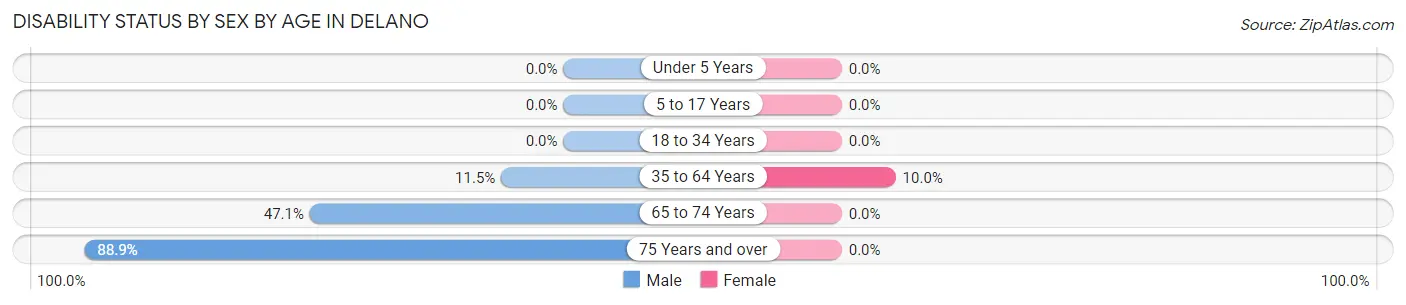
| Age Bracket | Male | Female |
| Under 5 Years | 0 (0.0%) | 0 (0.0%) |
| 5 to 17 Years | 0 (0.0%) | 0 (0.0%) |
| 18 to 34 Years | 0 (0.0%) | 0 (0.0%) |
| 35 to 64 Years | 6 (11.5%) | 4 (10.0%) |
| 65 to 74 Years | 8 (47.1%) | 0 (0.0%) |
| 75 Years and over | 8 (88.9%) | 0 (0.0%) |
Disability Class by Sex by Age in Delano
Disability Class: Hearing Difficulty
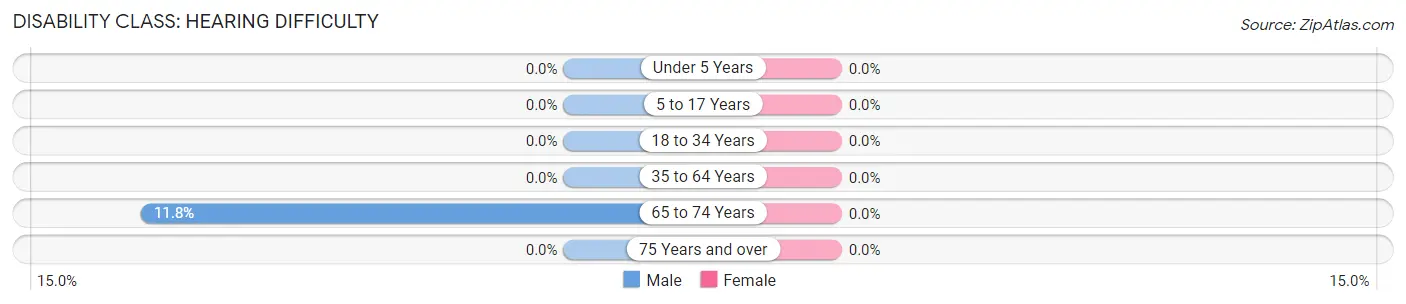
| Age Bracket | Male | Female |
| Under 5 Years | 0 (0.0%) | 0 (0.0%) |
| 5 to 17 Years | 0 (0.0%) | 0 (0.0%) |
| 18 to 34 Years | 0 (0.0%) | 0 (0.0%) |
| 35 to 64 Years | 0 (0.0%) | 0 (0.0%) |
| 65 to 74 Years | 2 (11.8%) | 0 (0.0%) |
| 75 Years and over | 0 (0.0%) | 0 (0.0%) |
Disability Class: Vision Difficulty
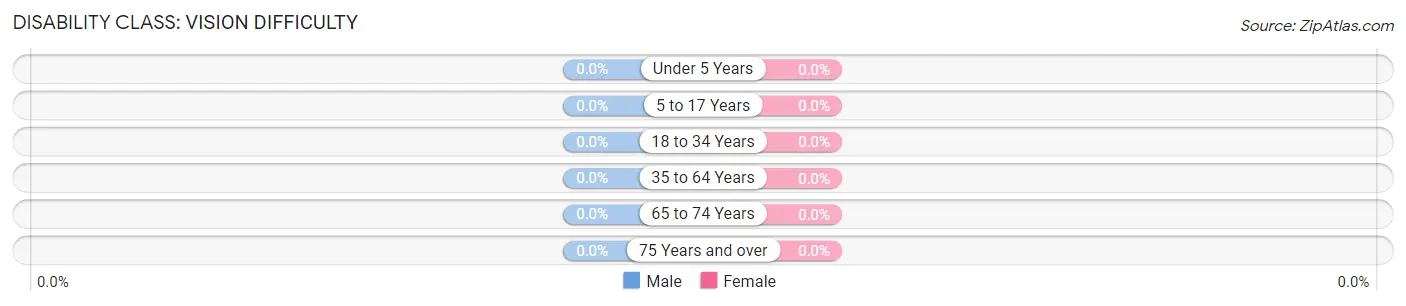
| Age Bracket | Male | Female |
| Under 5 Years | 0 (0.0%) | 0 (0.0%) |
| 5 to 17 Years | 0 (0.0%) | 0 (0.0%) |
| 18 to 34 Years | 0 (0.0%) | 0 (0.0%) |
| 35 to 64 Years | 0 (0.0%) | 0 (0.0%) |
| 65 to 74 Years | 0 (0.0%) | 0 (0.0%) |
| 75 Years and over | 0 (0.0%) | 0 (0.0%) |
Disability Class: Cognitive Difficulty
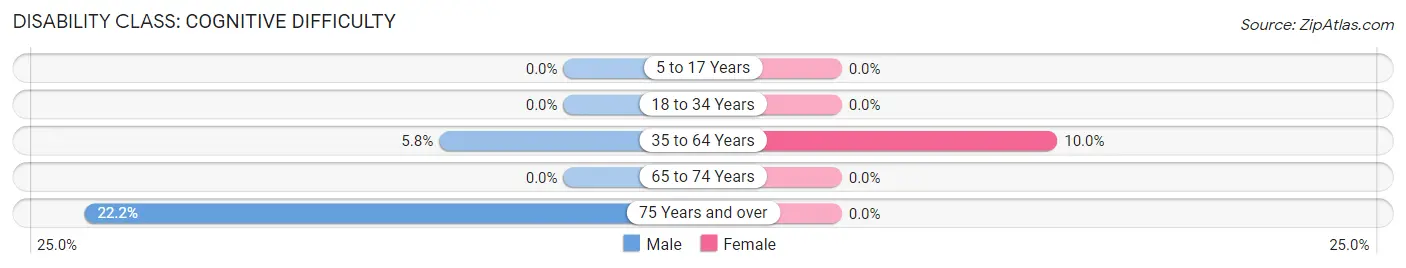
| Age Bracket | Male | Female |
| 5 to 17 Years | 0 (0.0%) | 0 (0.0%) |
| 18 to 34 Years | 0 (0.0%) | 0 (0.0%) |
| 35 to 64 Years | 3 (5.8%) | 4 (10.0%) |
| 65 to 74 Years | 0 (0.0%) | 0 (0.0%) |
| 75 Years and over | 2 (22.2%) | 0 (0.0%) |
Disability Class: Ambulatory Difficulty
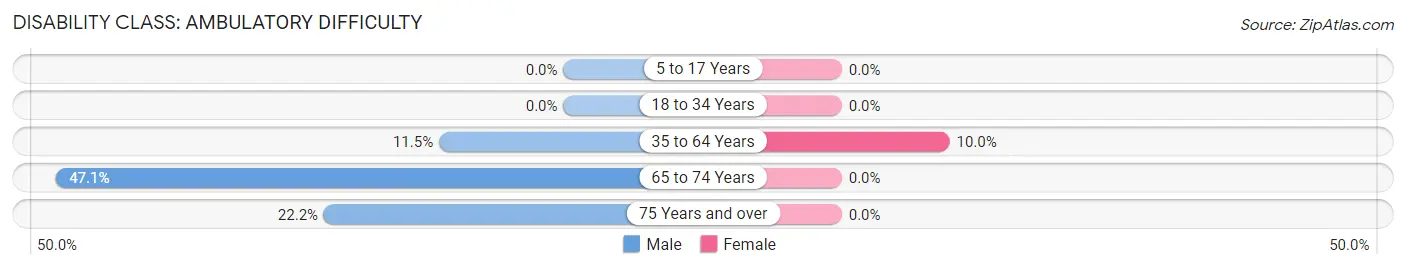
| Age Bracket | Male | Female |
| 5 to 17 Years | 0 (0.0%) | 0 (0.0%) |
| 18 to 34 Years | 0 (0.0%) | 0 (0.0%) |
| 35 to 64 Years | 6 (11.5%) | 4 (10.0%) |
| 65 to 74 Years | 8 (47.1%) | 0 (0.0%) |
| 75 Years and over | 2 (22.2%) | 0 (0.0%) |
Disability Class: Self-Care Difficulty
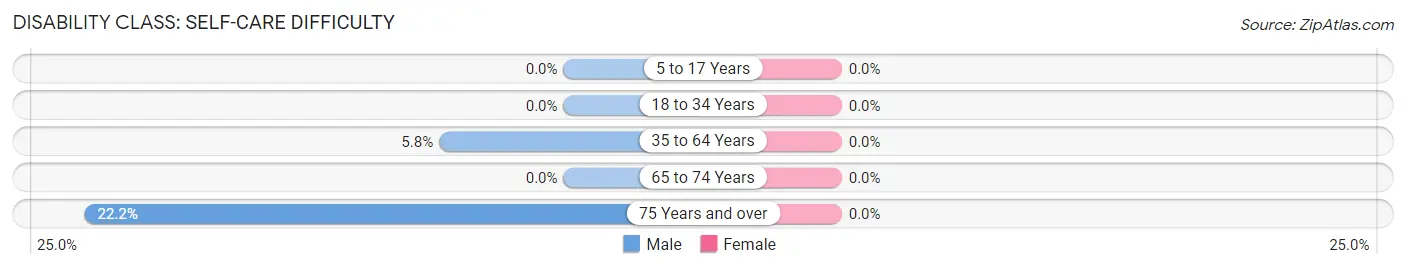
| Age Bracket | Male | Female |
| 5 to 17 Years | 0 (0.0%) | 0 (0.0%) |
| 18 to 34 Years | 0 (0.0%) | 0 (0.0%) |
| 35 to 64 Years | 3 (5.8%) | 0 (0.0%) |
| 65 to 74 Years | 0 (0.0%) | 0 (0.0%) |
| 75 Years and over | 2 (22.2%) | 0 (0.0%) |
Technology Access in Delano
Computing Device Access in Delano
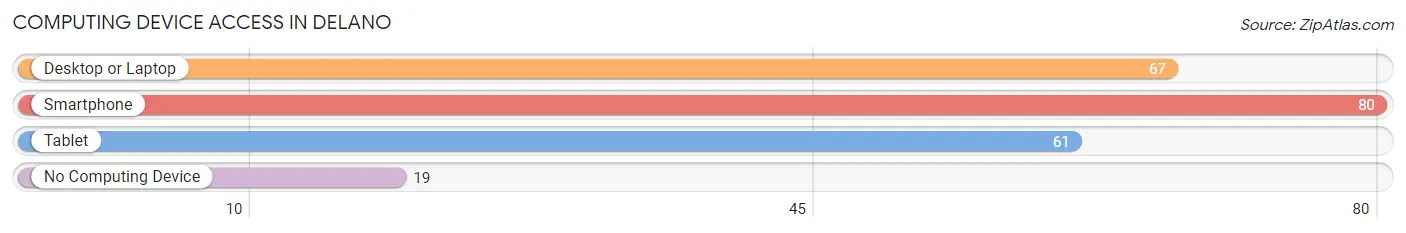
| Device Type | # Households | % Households |
| Desktop or Laptop | 67 | 63.2% |
| Smartphone | 80 | 75.5% |
| Tablet | 61 | 57.6% |
| No Computing Device | 19 | 17.9% |
| Total | 106 | 100.0% |
Internet Access in Delano
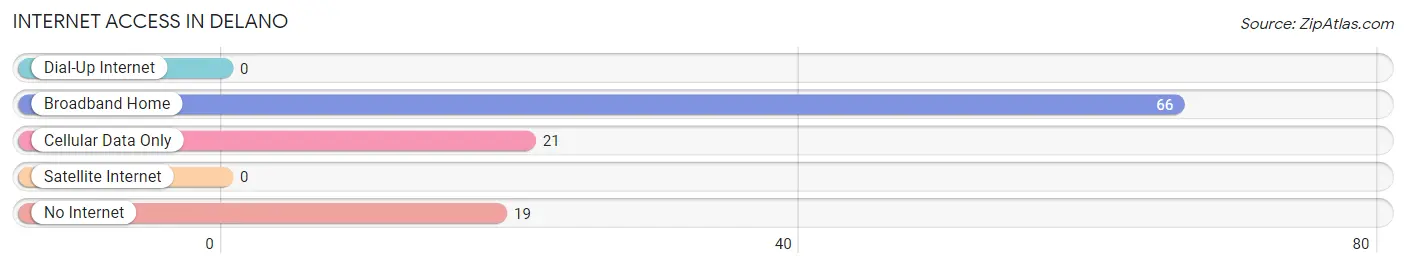
| Internet Type | # Households | % Households |
| Dial-Up Internet | 0 | 0.0% |
| Broadband Home | 66 | 62.3% |
| Cellular Data Only | 21 | 19.8% |
| Satellite Internet | 0 | 0.0% |
| No Internet | 19 | 17.9% |
| Total | 106 | 100.0% |
Delano Summary
Delano, Pennsylvania is a small borough located in Luzerne County, Pennsylvania. It is situated in the foothills of the Pocono Mountains, approximately 10 miles south of Wilkes-Barre. The borough was founded in 1851 and is named after Columbus Delano, the Secretary of the Interior under President Ulysses S. Grant.
Geography
Delano is located at 41°14'N 75°51'W (41.23, -75.85). It has a total area of 0.7 square miles, all of which is land. The borough is situated in the foothills of the Pocono Mountains, and is surrounded by the townships of Butler, Franklin, and Newport. The borough is located in the Susquehanna River watershed.
History
Delano was founded in 1851 by a group of settlers from the nearby town of Wilkes-Barre. The settlers chose the name Delano in honor of Columbus Delano, the Secretary of the Interior under President Ulysses S. Grant. The borough was incorporated in 1867.
In the late 19th century, Delano was a thriving coal mining town. The coal industry was the primary source of employment for the town's residents. The coal mines were eventually closed in the early 20th century, and the town's economy shifted to agriculture and light industry.
Economy
Delano's economy is largely based on agriculture and light industry. The borough is home to several small businesses, including a lumber mill, a furniture factory, and a printing company. The town also has a few retail stores, including a grocery store and a hardware store.
Demographics
As of the 2010 census, Delano had a population of 1,845. The racial makeup of the borough was 97.2% White, 0.9% African American, 0.2% Native American, 0.2% Asian, 0.2% from other races, and 1.3% from two or more races. Hispanic or Latino of any race were 1.3% of the population.
The median household income in Delano was $37,917, and the median family income was $45,000. The per capita income for the borough was $17,917. About 11.2% of families and 13.2% of the population were below the poverty line, including 17.2% of those under age 18 and 8.2% of those age 65 or over.
Delano is served by the Wilkes-Barre Area School District. The borough is home to one elementary school, one middle school, and one high school. The town also has a public library and a community center.
Common Questions
What is Per Capita Income in Delano?
Per Capita income in Delano is $28,925.
What is the Median Family Income in Delano?
Median Family Income in Delano is $80,536.
What is the Median Household income in Delano?
Median Household Income in Delano is $45,000.
What is Inequality or Gini Index in Delano?
Inequality or Gini Index in Delano is 0.31.
What is the Total Population of Delano?
Total Population of Delano is 214.
What is the Total Male Population of Delano?
Total Male Population of Delano is 135.
What is the Total Female Population of Delano?
Total Female Population of Delano is 79.
What is the Ratio of Males per 100 Females in Delano?
There are 170.89 Males per 100 Females in Delano.
What is the Ratio of Females per 100 Males in Delano?
There are 58.52 Females per 100 Males in Delano.
What is the Median Population Age in Delano?
Median Population Age in Delano is 47.3 Years.
What is the Average Family Size in Delano
Average Family Size in Delano is 2.6 People.
What is the Average Household Size in Delano
Average Household Size in Delano is 2.0 People.
How Large is the Labor Force in Delano?
There are 123 People in the Labor Forcein in Delano.
What is the Percentage of People in the Labor Force in Delano?
67.2% of People are in the Labor Force in Delano.
What is the Unemployment Rate in Delano?
Unemployment Rate in Delano is 10.6%.