Carbondale, PA Map & Demographics
Carbondale Map
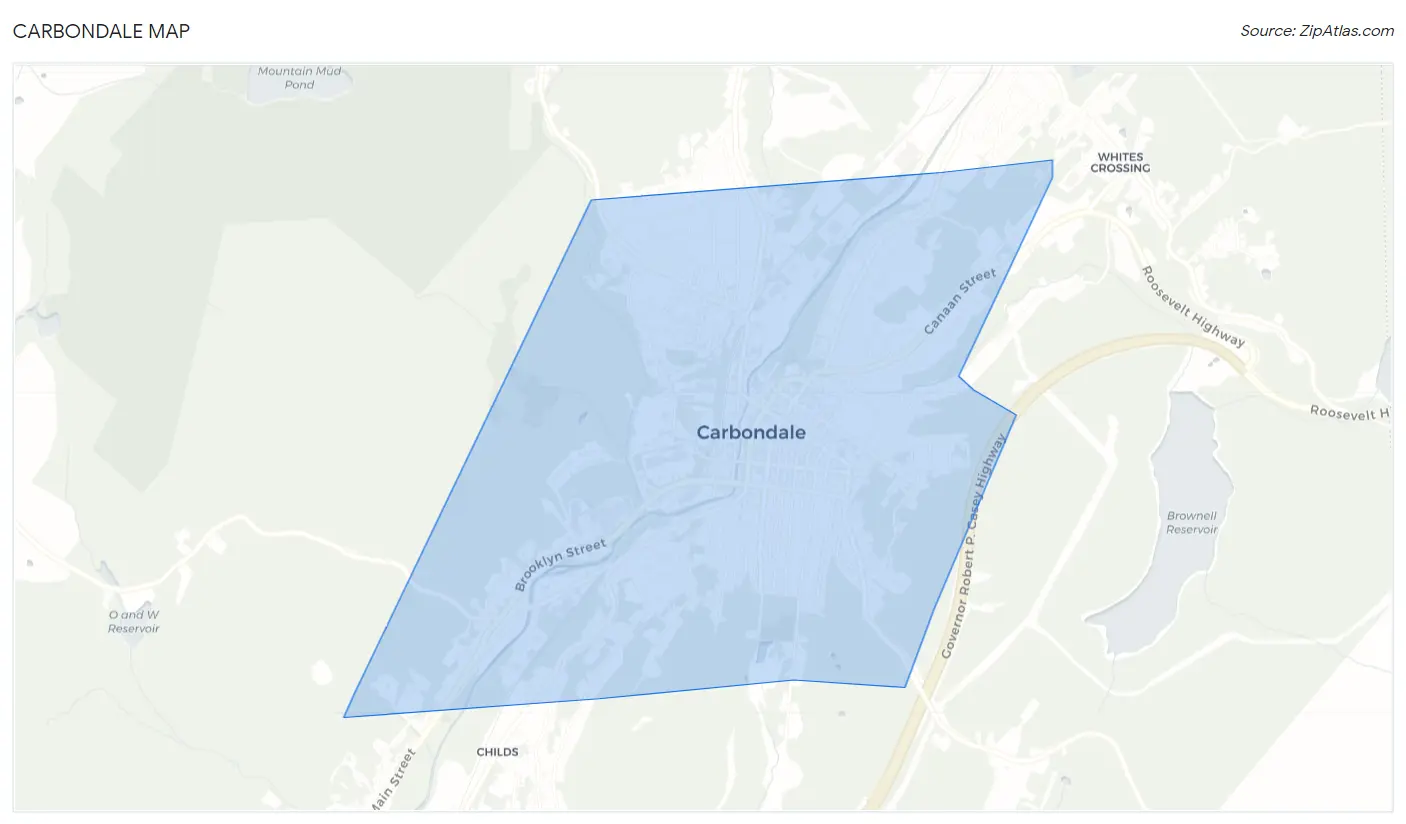
Carbondale Overview
$31,093
PER CAPITA INCOME
$66,484
AVG FAMILY INCOME
$52,681
AVG HOUSEHOLD INCOME
35.2%
WAGE / INCOME GAP [ % ]
64.8¢/ $1
WAGE / INCOME GAP [ $ ]
$11,244
FAMILY INCOME DEFICIT
0.48
INEQUALITY / GINI INDEX
8,818
TOTAL POPULATION
4,387
MALE POPULATION
4,431
FEMALE POPULATION
99.01
MALES / 100 FEMALES
101.00
FEMALES / 100 MALES
42.6
MEDIAN AGE
2.8
AVG FAMILY SIZE
2.2
AVG HOUSEHOLD SIZE
3,841
LABOR FORCE [ PEOPLE ]
53.2%
PERCENT IN LABOR FORCE
6.5%
UNEMPLOYMENT RATE
Carbondale Zip Codes
Carbondale Area Codes
Income in Carbondale
Income Overview in Carbondale
Per Capita Income in Carbondale is $31,093, while median incomes of families and households are $66,484 and $52,681 respectively.
| Characteristic | Number | Measure |
| Per Capita Income | 8,818 | $31,093 |
| Median Family Income | 2,227 | $66,484 |
| Mean Family Income | 2,227 | $76,515 |
| Median Household Income | 3,920 | $52,681 |
| Mean Household Income | 3,920 | $68,993 |
| Income Deficit | 2,227 | $11,244 |
| Wage / Income Gap (%) | 8,818 | 35.23% |
| Wage / Income Gap ($) | 8,818 | 64.77¢ per $1 |
| Gini / Inequality Index | 8,818 | 0.48 |
Earnings by Sex in Carbondale
Average Earnings in Carbondale are $33,663, $41,953 for men and $27,171 for women, a difference of 35.2%.
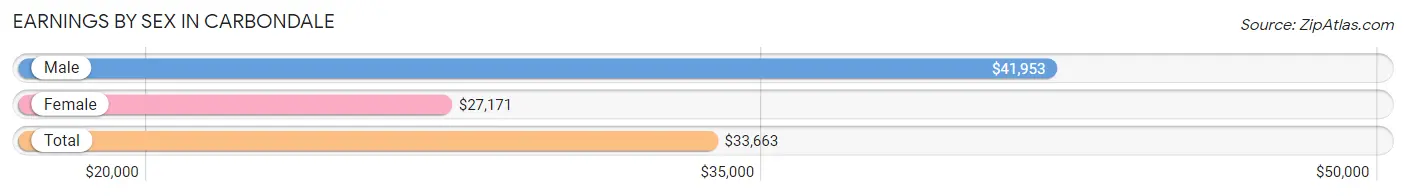
| Sex | Number | Average Earnings |
| Male | 2,200 (55.0%) | $41,953 |
| Female | 1,803 (45.0%) | $27,171 |
| Total | 4,003 (100.0%) | $33,663 |
Earnings by Sex by Income Bracket in Carbondale
The most common earnings brackets in Carbondale are $30,000 to $34,999 for men (286 | 13.0%) and $30,000 to $34,999 for women (152 | 8.4%).
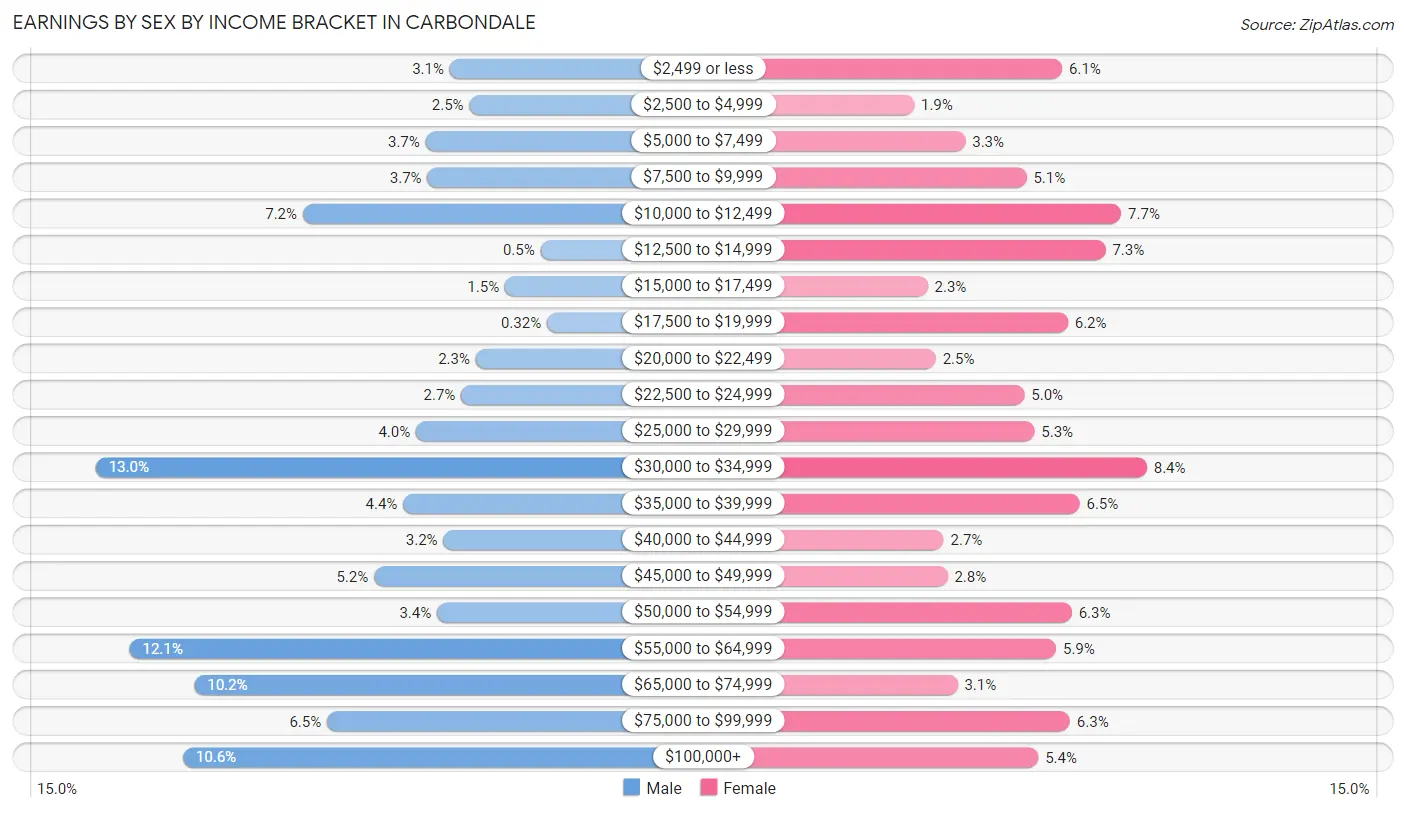
| Income | Male | Female |
| $2,499 or less | 67 (3.0%) | 109 (6.0%) |
| $2,500 to $4,999 | 55 (2.5%) | 34 (1.9%) |
| $5,000 to $7,499 | 82 (3.7%) | 60 (3.3%) |
| $7,500 to $9,999 | 81 (3.7%) | 91 (5.1%) |
| $10,000 to $12,499 | 158 (7.2%) | 139 (7.7%) |
| $12,500 to $14,999 | 11 (0.5%) | 131 (7.3%) |
| $15,000 to $17,499 | 33 (1.5%) | 41 (2.3%) |
| $17,500 to $19,999 | 7 (0.3%) | 112 (6.2%) |
| $20,000 to $22,499 | 51 (2.3%) | 45 (2.5%) |
| $22,500 to $24,999 | 60 (2.7%) | 90 (5.0%) |
| $25,000 to $29,999 | 88 (4.0%) | 95 (5.3%) |
| $30,000 to $34,999 | 286 (13.0%) | 152 (8.4%) |
| $35,000 to $39,999 | 96 (4.4%) | 118 (6.5%) |
| $40,000 to $44,999 | 71 (3.2%) | 49 (2.7%) |
| $45,000 to $49,999 | 114 (5.2%) | 51 (2.8%) |
| $50,000 to $54,999 | 75 (3.4%) | 114 (6.3%) |
| $55,000 to $64,999 | 265 (12.0%) | 106 (5.9%) |
| $65,000 to $74,999 | 225 (10.2%) | 56 (3.1%) |
| $75,000 to $99,999 | 143 (6.5%) | 113 (6.3%) |
| $100,000+ | 232 (10.5%) | 97 (5.4%) |
| Total | 2,200 (100.0%) | 1,803 (100.0%) |
Earnings by Sex by Educational Attainment in Carbondale
Average earnings in Carbondale are $48,554 for men and $31,168 for women, a difference of 35.8%. Men with an educational attainment of bachelor's degree enjoy the highest average annual earnings of $79,167, while those with less than high school education earn the least with $28,750. Women with an educational attainment of bachelor's degree earn the most with the average annual earnings of $90,417, while those with college or associate's degree education have the smallest earnings of $18,906.
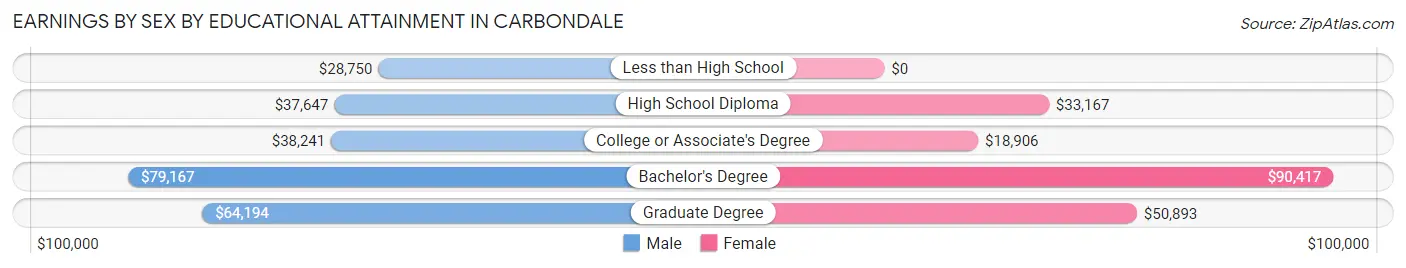
| Educational Attainment | Male Income | Female Income |
| Less than High School | $28,750 | $0 |
| High School Diploma | $37,647 | $33,167 |
| College or Associate's Degree | $38,241 | $18,906 |
| Bachelor's Degree | $79,167 | $90,417 |
| Graduate Degree | $64,194 | $50,893 |
| Total | $48,554 | $31,168 |
Family Income in Carbondale
Family Income Brackets in Carbondale
According to the Carbondale family income data, there are 506 families falling into the $50,000 to $74,999 income range, which is the most common income bracket and makes up 22.7% of all families. Conversely, the $10,000 to $14,999 income bracket is the least frequent group with only 58 families (2.6%) belonging to this category.
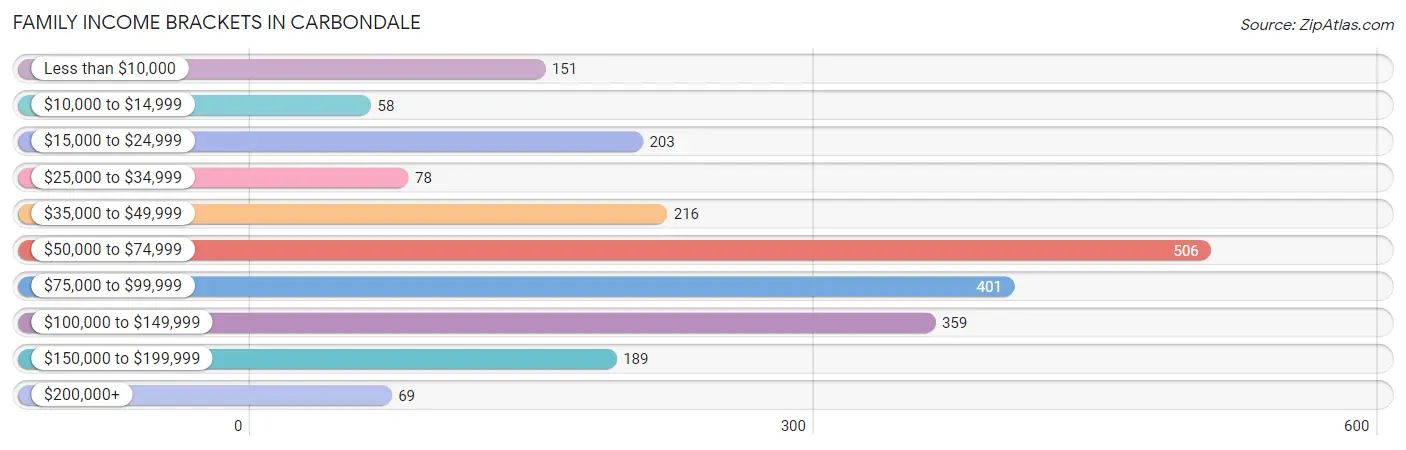
| Income Bracket | # Families | % Families |
| Less than $10,000 | 151 | 6.8% |
| $10,000 to $14,999 | 58 | 2.6% |
| $15,000 to $24,999 | 203 | 9.1% |
| $25,000 to $34,999 | 78 | 3.5% |
| $35,000 to $49,999 | 216 | 9.7% |
| $50,000 to $74,999 | 506 | 22.7% |
| $75,000 to $99,999 | 401 | 18.0% |
| $100,000 to $149,999 | 359 | 16.1% |
| $150,000 to $199,999 | 189 | 8.5% |
| $200,000+ | 69 | 3.1% |
Family Income by Famaliy Size in Carbondale
2-person families (1,125 | 50.5%) account for the highest median family income in Carbondale with $76,058 per family, while 2-person families (1,125 | 50.5%) have the highest median income of $38,029 per family member.
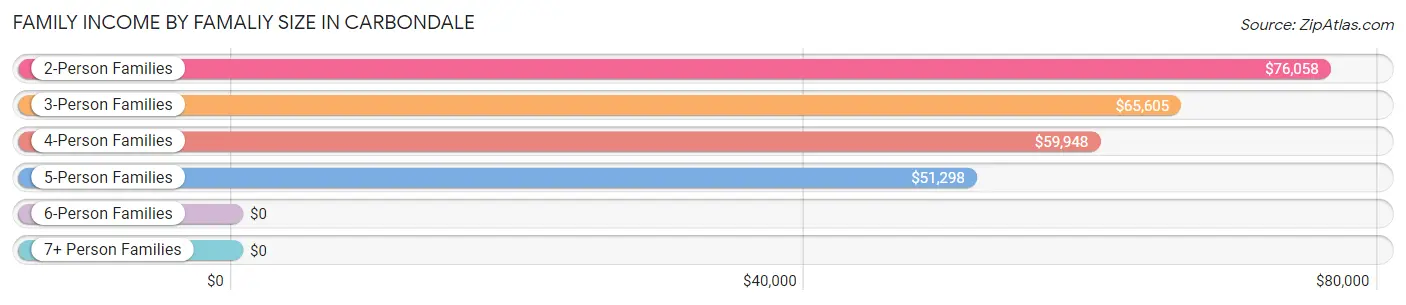
| Income Bracket | # Families | Median Income |
| 2-Person Families | 1,125 (50.5%) | $76,058 |
| 3-Person Families | 617 (27.7%) | $65,605 |
| 4-Person Families | 338 (15.2%) | $59,948 |
| 5-Person Families | 133 (6.0%) | $51,298 |
| 6-Person Families | 11 (0.5%) | $0 |
| 7+ Person Families | 3 (0.1%) | $0 |
| Total | 2,227 (100.0%) | $66,484 |
Family Income by Number of Earners in Carbondale
The median family income in Carbondale is $66,484, with families comprising 3+ earners (205) having the highest median family income of $120,819, while families with no earners (397) have the lowest median family income of $44,107, accounting for 9.2% and 17.8% of families, respectively.
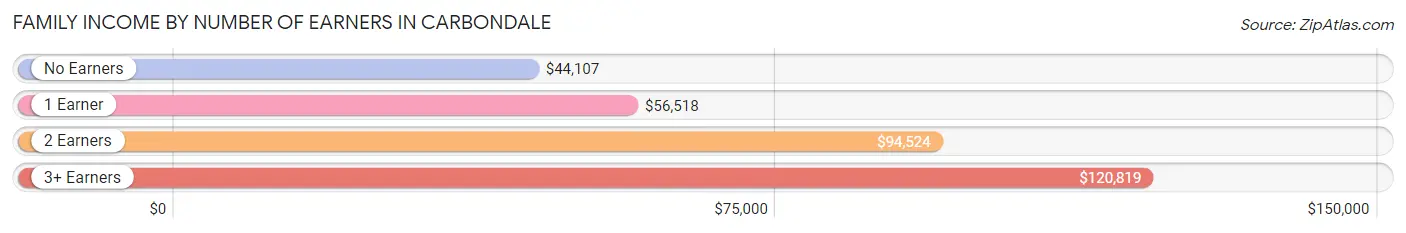
| Number of Earners | # Families | Median Income |
| No Earners | 397 (17.8%) | $44,107 |
| 1 Earner | 867 (38.9%) | $56,518 |
| 2 Earners | 758 (34.0%) | $94,524 |
| 3+ Earners | 205 (9.2%) | $120,819 |
| Total | 2,227 (100.0%) | $66,484 |
Household Income in Carbondale
Household Income Brackets in Carbondale
With 776 households falling in the category, the $50,000 to $74,999 income range is the most frequent in Carbondale, accounting for 19.8% of all households. In contrast, only 90 households (2.3%) fall into the $200,000+ income bracket, making it the least populous group.
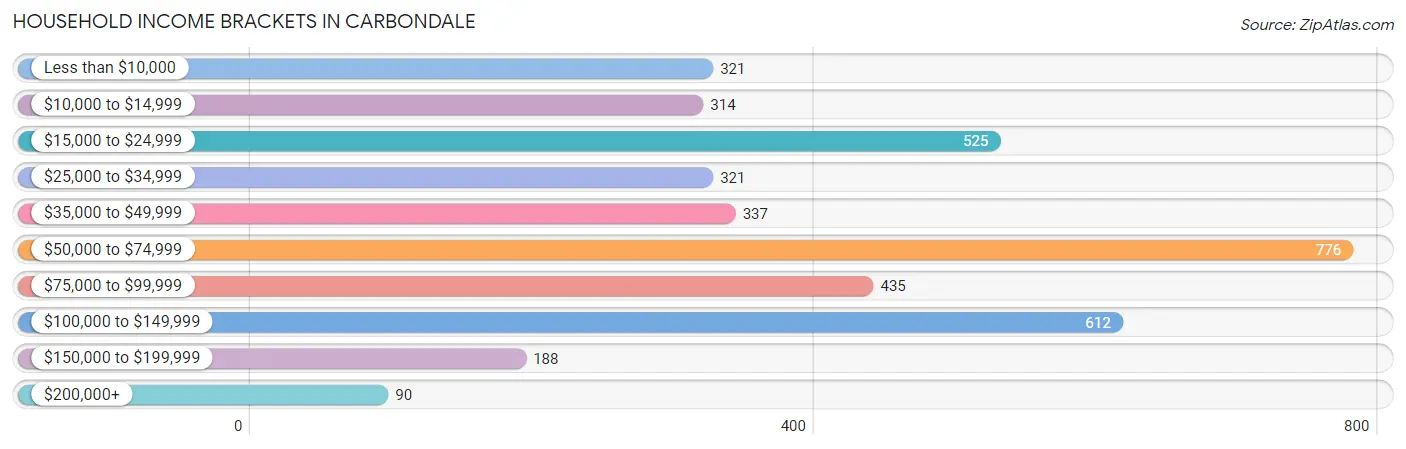
| Income Bracket | # Households | % Households |
| Less than $10,000 | 321 | 8.2% |
| $10,000 to $14,999 | 314 | 8.0% |
| $15,000 to $24,999 | 525 | 13.4% |
| $25,000 to $34,999 | 321 | 8.2% |
| $35,000 to $49,999 | 337 | 8.6% |
| $50,000 to $74,999 | 776 | 19.8% |
| $75,000 to $99,999 | 435 | 11.1% |
| $100,000 to $149,999 | 612 | 15.6% |
| $150,000 to $199,999 | 188 | 4.8% |
| $200,000+ | 90 | 2.3% |
Household Income by Householder Age in Carbondale
The median household income in Carbondale is $52,681, with the highest median household income of $67,708 found in the 25 to 44 years age bracket for the primary householder. A total of 1,227 households (31.3%) fall into this category. Meanwhile, the 15 to 24 years age bracket for the primary householder has the lowest median household income of $0, with 100 households (2.5%) in this group.
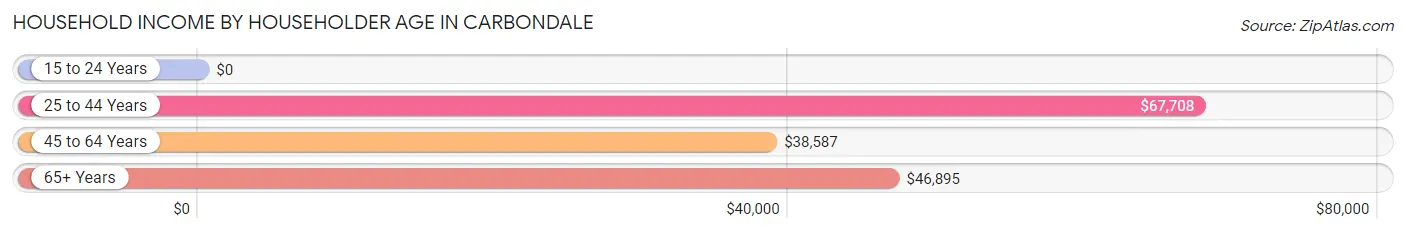
| Income Bracket | # Households | Median Income |
| 15 to 24 Years | 100 (2.5%) | $0 |
| 25 to 44 Years | 1,227 (31.3%) | $67,708 |
| 45 to 64 Years | 1,136 (29.0%) | $38,587 |
| 65+ Years | 1,457 (37.2%) | $46,895 |
| Total | 3,920 (100.0%) | $52,681 |
Poverty in Carbondale
Income Below Poverty by Sex and Age in Carbondale
With 22.5% poverty level for males and 25.6% for females among the residents of Carbondale, 12 to 14 year old males and 15 year old females are the most vulnerable to poverty, with 124 males (54.9%) and 10 females (100.0%) in their respective age groups living below the poverty level.
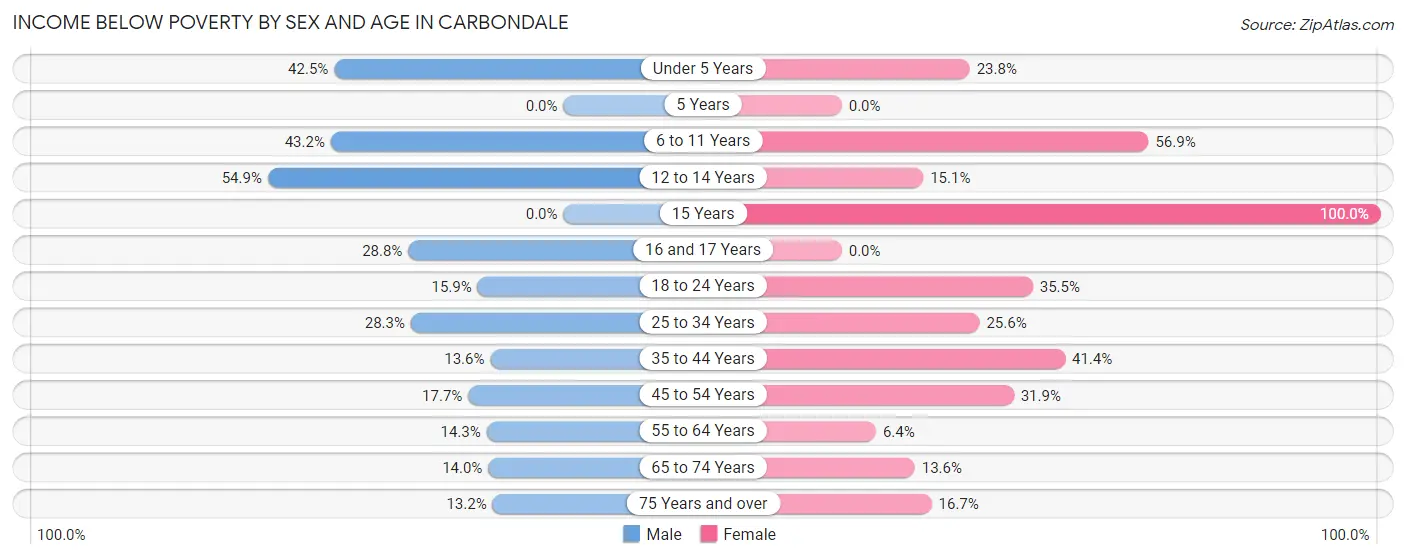
| Age Bracket | Male | Female |
| Under 5 Years | 114 (42.5%) | 71 (23.7%) |
| 5 Years | 0 (0.0%) | 0 (0.0%) |
| 6 to 11 Years | 114 (43.2%) | 189 (56.9%) |
| 12 to 14 Years | 124 (54.9%) | 13 (15.1%) |
| 15 Years | 0 (0.0%) | 10 (100.0%) |
| 16 and 17 Years | 36 (28.8%) | 0 (0.0%) |
| 18 to 24 Years | 47 (15.9%) | 95 (35.4%) |
| 25 to 34 Years | 177 (28.3%) | 171 (25.6%) |
| 35 to 44 Years | 67 (13.6%) | 218 (41.4%) |
| 45 to 54 Years | 88 (17.7%) | 135 (31.9%) |
| 55 to 64 Years | 81 (14.3%) | 38 (6.4%) |
| 65 to 74 Years | 71 (14.0%) | 84 (13.6%) |
| 75 Years and over | 43 (13.2%) | 79 (16.7%) |
| Total | 962 (22.5%) | 1,103 (25.6%) |
Income Above Poverty by Sex and Age in Carbondale
According to the poverty statistics in Carbondale, males aged 5 years and females aged 55 to 64 years are the age groups that are most secure financially, with 100.0% of males and 93.6% of females in these age groups living above the poverty line.
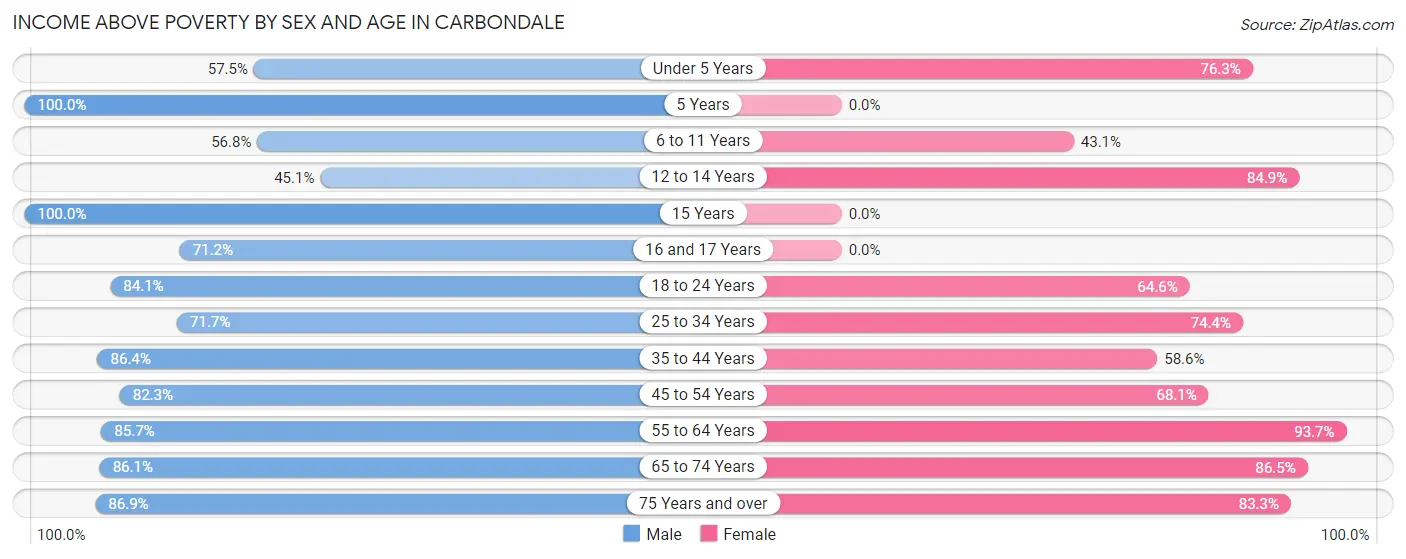
| Age Bracket | Male | Female |
| Under 5 Years | 154 (57.5%) | 228 (76.2%) |
| 5 Years | 57 (100.0%) | 0 (0.0%) |
| 6 to 11 Years | 150 (56.8%) | 143 (43.1%) |
| 12 to 14 Years | 102 (45.1%) | 73 (84.9%) |
| 15 Years | 16 (100.0%) | 0 (0.0%) |
| 16 and 17 Years | 89 (71.2%) | 0 (0.0%) |
| 18 to 24 Years | 248 (84.1%) | 173 (64.5%) |
| 25 to 34 Years | 448 (71.7%) | 498 (74.4%) |
| 35 to 44 Years | 427 (86.4%) | 308 (58.6%) |
| 45 to 54 Years | 410 (82.3%) | 288 (68.1%) |
| 55 to 64 Years | 487 (85.7%) | 560 (93.6%) |
| 65 to 74 Years | 438 (86.1%) | 536 (86.5%) |
| 75 Years and over | 284 (86.9%) | 395 (83.3%) |
| Total | 3,310 (77.5%) | 3,202 (74.4%) |
Income Below Poverty Among Married-Couple Families in Carbondale
The poverty statistics for married-couple families in Carbondale show that 6.4% or 87 of the total 1,354 families live below the poverty line. Families with 3 or 4 children have the highest poverty rate of 100.0%, comprising of 37 families. On the other hand, families with no children have the lowest poverty rate of 1.1%, which includes 10 families.
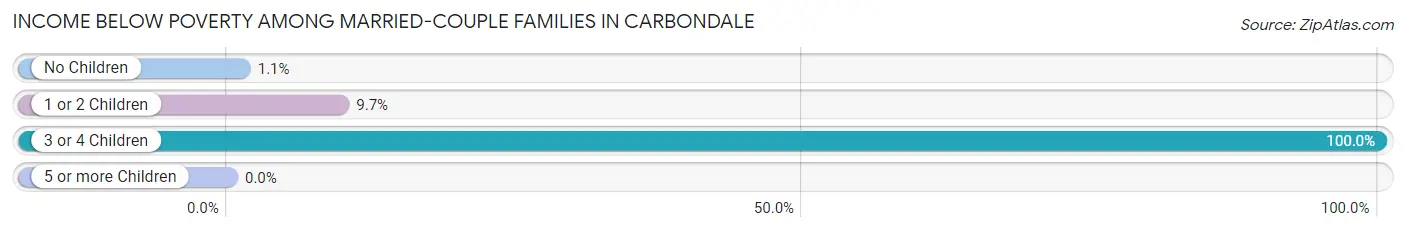
| Children | Above Poverty | Below Poverty |
| No Children | 894 (98.9%) | 10 (1.1%) |
| 1 or 2 Children | 373 (90.3%) | 40 (9.7%) |
| 3 or 4 Children | 0 (0.0%) | 37 (100.0%) |
| 5 or more Children | 0 (0.0%) | 0 (0.0%) |
| Total | 1,267 (93.6%) | 87 (6.4%) |
Income Below Poverty Among Single-Parent Households in Carbondale
According to the poverty data in Carbondale, 19.3% or 44 single-father households and 41.9% or 270 single-mother households are living below the poverty line. Among single-father households, those with 1 or 2 children have the highest poverty rate, with 34 households (26.0%) experiencing poverty. Likewise, among single-mother households, those with 3 or 4 children have the highest poverty rate, with 24 households (100.0%) falling below the poverty line.
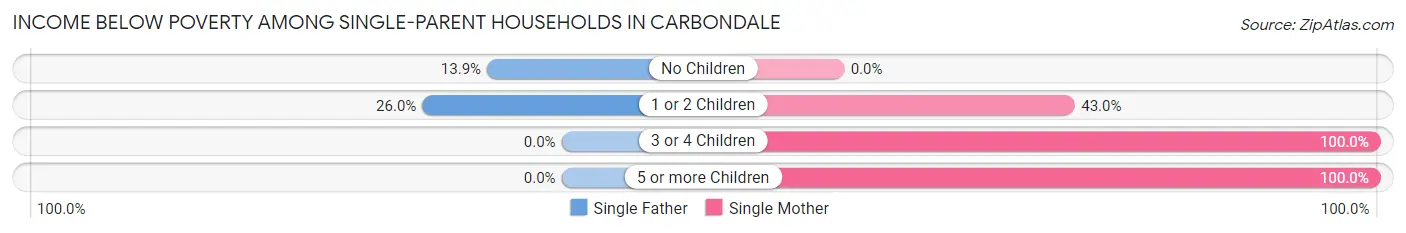
| Children | Single Father | Single Mother |
| No Children | 10 (13.9%) | 0 (0.0%) |
| 1 or 2 Children | 34 (26.0%) | 235 (43.0%) |
| 3 or 4 Children | 0 (0.0%) | 24 (100.0%) |
| 5 or more Children | 0 (0.0%) | 11 (100.0%) |
| Total | 44 (19.3%) | 270 (41.9%) |
Income Below Poverty Among Married-Couple vs Single-Parent Households in Carbondale
The poverty data for Carbondale shows that 87 of the married-couple family households (6.4%) and 314 of the single-parent households (36.0%) are living below the poverty level. Within the married-couple family households, those with 3 or 4 children have the highest poverty rate, with 37 households (100.0%) falling below the poverty line. Among the single-parent households, those with 5 or more children have the highest poverty rate, with 11 household (100.0%) living below poverty.
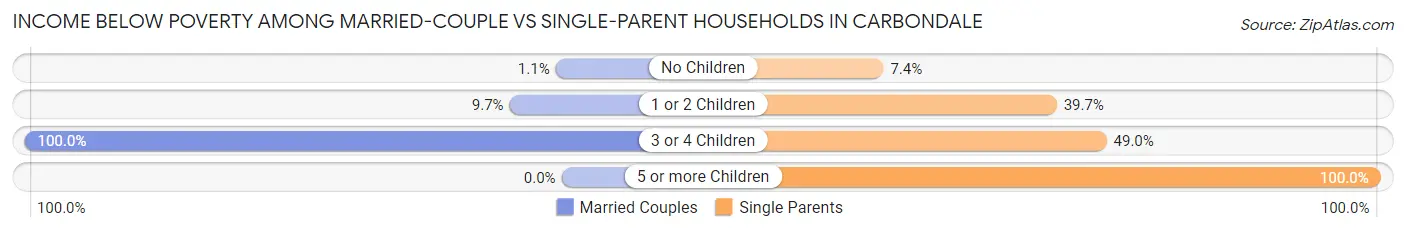
| Children | Married-Couple Families | Single-Parent Households |
| No Children | 10 (1.1%) | 10 (7.4%) |
| 1 or 2 Children | 40 (9.7%) | 269 (39.7%) |
| 3 or 4 Children | 37 (100.0%) | 24 (49.0%) |
| 5 or more Children | 0 (0.0%) | 11 (100.0%) |
| Total | 87 (6.4%) | 314 (36.0%) |
Race in Carbondale
The most populous races in Carbondale are White / Caucasian (8,028 | 91.0%), Hispanic or Latino (718 | 8.1%), and Two or more Races (484 | 5.5%).
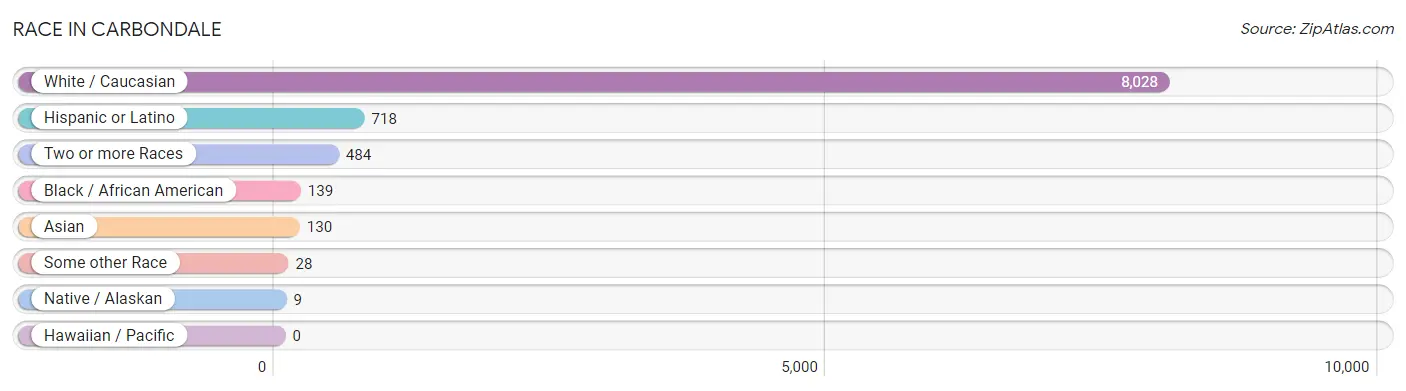
| Race | # Population | % Population |
| Asian | 130 | 1.5% |
| Black / African American | 139 | 1.6% |
| Hawaiian / Pacific | 0 | 0.0% |
| Hispanic or Latino | 718 | 8.1% |
| Native / Alaskan | 9 | 0.1% |
| White / Caucasian | 8,028 | 91.0% |
| Two or more Races | 484 | 5.5% |
| Some other Race | 28 | 0.3% |
| Total | 8,818 | 100.0% |
Ancestry in Carbondale
The most populous ancestries reported in Carbondale are Irish (1,961 | 22.2%), Italian (1,668 | 18.9%), American (1,584 | 18.0%), German (1,142 | 13.0%), and Polish (857 | 9.7%), together accounting for 81.8% of all Carbondale residents.
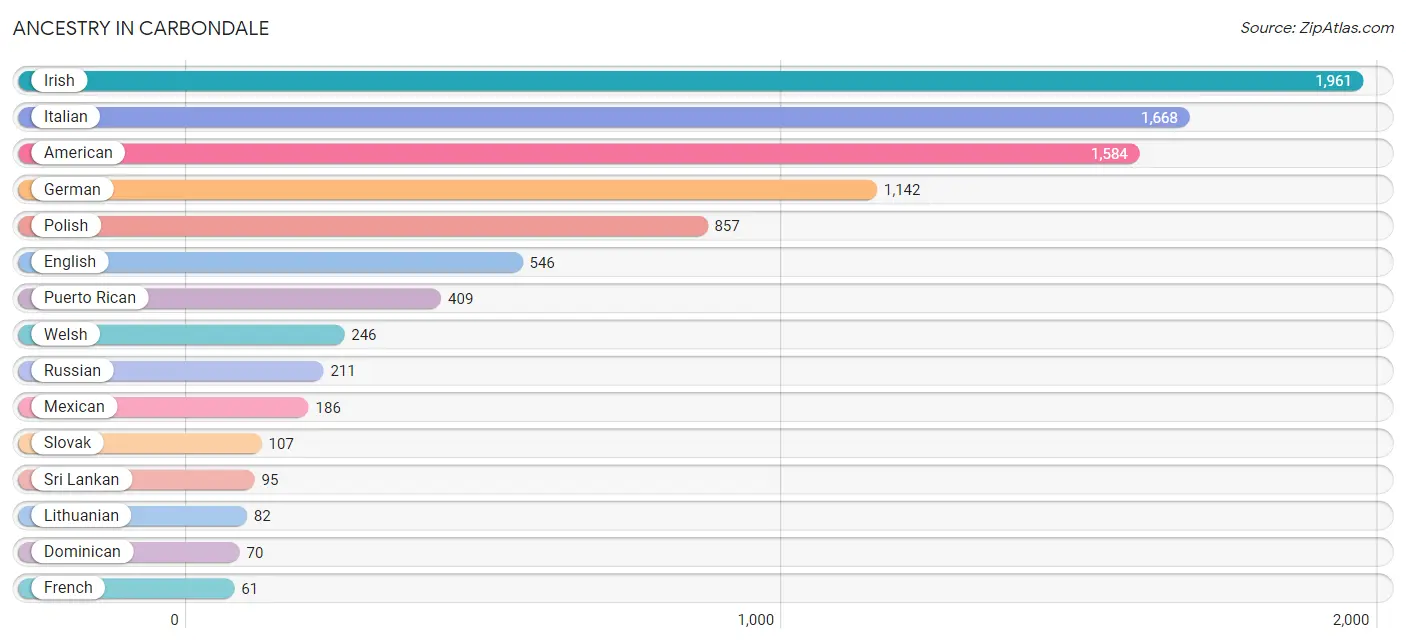
| Ancestry | # Population | % Population |
| American | 1,584 | 18.0% |
| Arab | 12 | 0.1% |
| Austrian | 38 | 0.4% |
| Bhutanese | 23 | 0.3% |
| Blackfeet | 15 | 0.2% |
| British | 30 | 0.3% |
| Canadian | 20 | 0.2% |
| Cherokee | 18 | 0.2% |
| Creek | 3 | 0.0% |
| Cuban | 2 | 0.0% |
| Dominican | 70 | 0.8% |
| Dutch | 34 | 0.4% |
| Eastern European | 31 | 0.4% |
| English | 546 | 6.2% |
| French | 61 | 0.7% |
| French Canadian | 6 | 0.1% |
| German | 1,142 | 13.0% |
| Greek | 60 | 0.7% |
| Hungarian | 27 | 0.3% |
| Indian (Asian) | 48 | 0.5% |
| Irish | 1,961 | 22.2% |
| Iroquois | 18 | 0.2% |
| Italian | 1,668 | 18.9% |
| Latvian | 11 | 0.1% |
| Lebanese | 10 | 0.1% |
| Lithuanian | 82 | 0.9% |
| Mexican | 186 | 2.1% |
| Mexican American Indian | 9 | 0.1% |
| Norwegian | 9 | 0.1% |
| Pennsylvania German | 20 | 0.2% |
| Polish | 857 | 9.7% |
| Puerto Rican | 409 | 4.6% |
| Russian | 211 | 2.4% |
| Scotch-Irish | 8 | 0.1% |
| Scottish | 39 | 0.4% |
| Seminole | 3 | 0.0% |
| Sioux | 5 | 0.1% |
| Slovak | 107 | 1.2% |
| Slovene | 40 | 0.4% |
| Spaniard | 25 | 0.3% |
| Spanish | 7 | 0.1% |
| Sri Lankan | 95 | 1.1% |
| Swedish | 9 | 0.1% |
| Syrian | 2 | 0.0% |
| Ukrainian | 20 | 0.2% |
| Welsh | 246 | 2.8% |
| West Indian | 4 | 0.1% | View All 47 Rows |
Immigrants in Carbondale
The most numerous immigrant groups reported in Carbondale came from Asia (117 | 1.3%), South Eastern Asia (82 | 0.9%), Vietnam (82 | 0.9%), Europe (43 | 0.5%), and Latin America (42 | 0.5%), together accounting for 4.2% of all Carbondale residents.
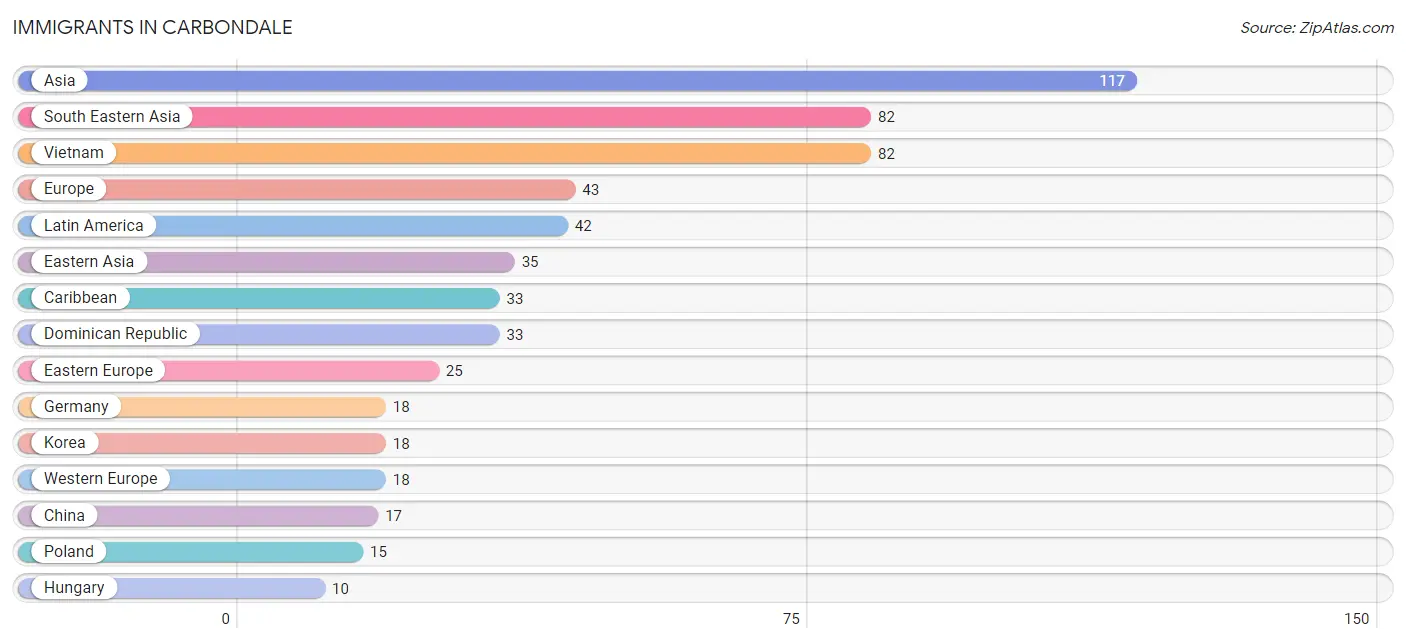
| Immigration Origin | # Population | % Population |
| Asia | 117 | 1.3% |
| Caribbean | 33 | 0.4% |
| Central America | 9 | 0.1% |
| China | 17 | 0.2% |
| Dominican Republic | 33 | 0.4% |
| Eastern Asia | 35 | 0.4% |
| Eastern Europe | 25 | 0.3% |
| Europe | 43 | 0.5% |
| Germany | 18 | 0.2% |
| Hungary | 10 | 0.1% |
| Korea | 18 | 0.2% |
| Latin America | 42 | 0.5% |
| Mexico | 9 | 0.1% |
| Poland | 15 | 0.2% |
| South Eastern Asia | 82 | 0.9% |
| Vietnam | 82 | 0.9% |
| Western Europe | 18 | 0.2% | View All 17 Rows |
Sex and Age in Carbondale
Sex and Age in Carbondale
The most populous age groups in Carbondale are 50 to 54 Years (383 | 8.7%) for men and 25 to 29 Years (416 | 9.4%) for women.
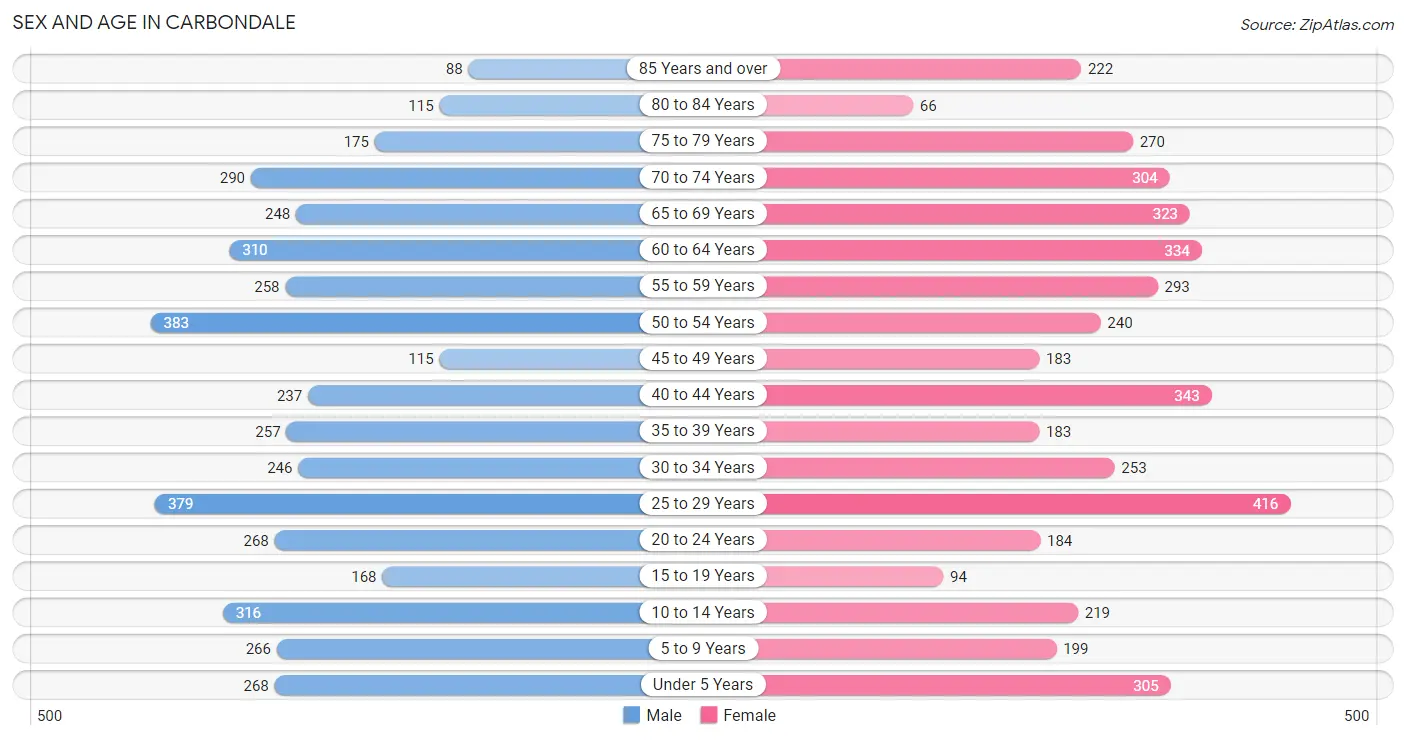
| Age Bracket | Male | Female |
| Under 5 Years | 268 (6.1%) | 305 (6.9%) |
| 5 to 9 Years | 266 (6.1%) | 199 (4.5%) |
| 10 to 14 Years | 316 (7.2%) | 219 (4.9%) |
| 15 to 19 Years | 168 (3.8%) | 94 (2.1%) |
| 20 to 24 Years | 268 (6.1%) | 184 (4.2%) |
| 25 to 29 Years | 379 (8.6%) | 416 (9.4%) |
| 30 to 34 Years | 246 (5.6%) | 253 (5.7%) |
| 35 to 39 Years | 257 (5.9%) | 183 (4.1%) |
| 40 to 44 Years | 237 (5.4%) | 343 (7.7%) |
| 45 to 49 Years | 115 (2.6%) | 183 (4.1%) |
| 50 to 54 Years | 383 (8.7%) | 240 (5.4%) |
| 55 to 59 Years | 258 (5.9%) | 293 (6.6%) |
| 60 to 64 Years | 310 (7.1%) | 334 (7.5%) |
| 65 to 69 Years | 248 (5.7%) | 323 (7.3%) |
| 70 to 74 Years | 290 (6.6%) | 304 (6.9%) |
| 75 to 79 Years | 175 (4.0%) | 270 (6.1%) |
| 80 to 84 Years | 115 (2.6%) | 66 (1.5%) |
| 85 Years and over | 88 (2.0%) | 222 (5.0%) |
| Total | 4,387 (100.0%) | 4,431 (100.0%) |
Families and Households in Carbondale
Median Family Size in Carbondale
The median family size in Carbondale is 2.77 persons per family, with single male/father families (228 | 10.2%) accounting for the largest median family size of 2.89 persons per family. On the other hand, married-couple families (1,354 | 60.8%) represent the smallest median family size with 2.73 persons per family.
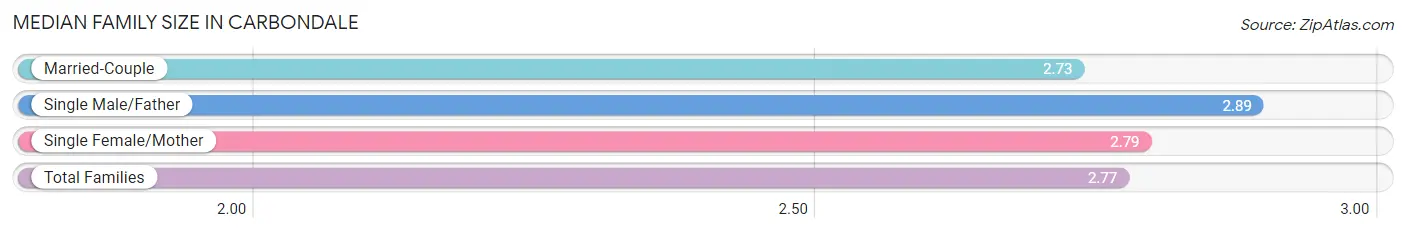
| Family Type | # Families | Family Size |
| Married-Couple | 1,354 (60.8%) | 2.73 |
| Single Male/Father | 228 (10.2%) | 2.89 |
| Single Female/Mother | 645 (29.0%) | 2.79 |
| Total Families | 2,227 (100.0%) | 2.77 |
Median Household Size in Carbondale
The median household size in Carbondale is 2.19 persons per household, with single male/father households (228 | 5.8%) accounting for the largest median household size of 3.39 persons per household. non-family households (1,693 | 43.2%) represent the smallest median household size with 1.15 persons per household.
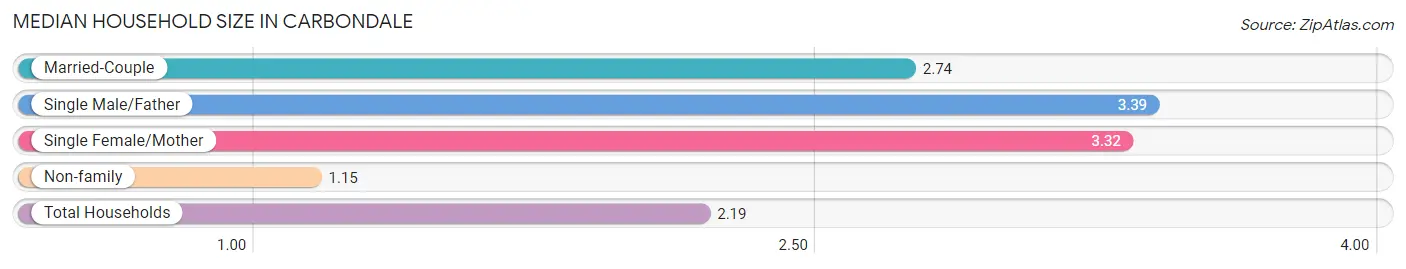
| Household Type | # Households | Household Size |
| Married-Couple | 1,354 (34.5%) | 2.74 |
| Single Male/Father | 228 (5.8%) | 3.39 |
| Single Female/Mother | 645 (16.5%) | 3.32 |
| Non-family | 1,693 (43.2%) | 1.15 |
| Total Households | 3,920 (100.0%) | 2.19 |
Household Size by Marriage Status in Carbondale
Out of a total of 3,920 households in Carbondale, 2,227 (56.8%) are family households, while 1,693 (43.2%) are nonfamily households. The most numerous type of family households are 2-person households, comprising 870, and the most common type of nonfamily households are 1-person households, comprising 1,501.
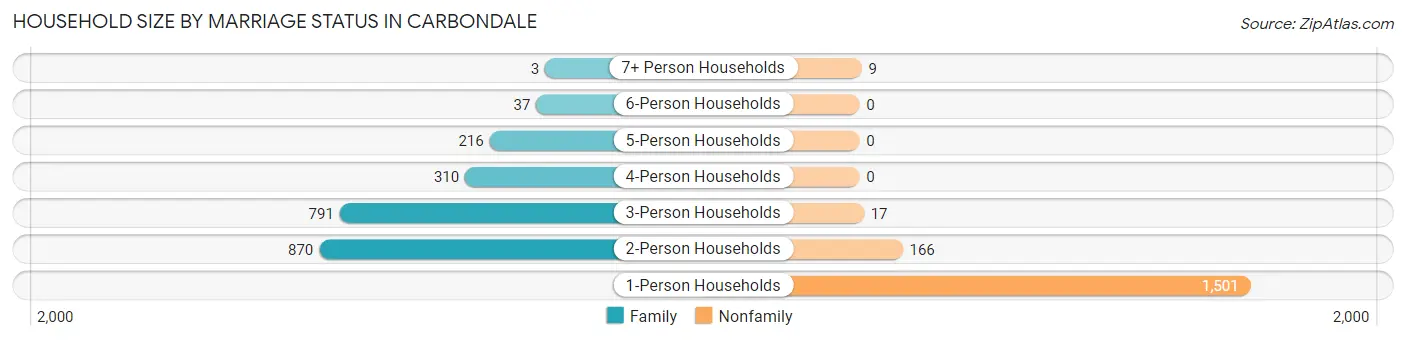
| Household Size | Family Households | Nonfamily Households |
| 1-Person Households | - | 1,501 (38.3%) |
| 2-Person Households | 870 (22.2%) | 166 (4.2%) |
| 3-Person Households | 791 (20.2%) | 17 (0.4%) |
| 4-Person Households | 310 (7.9%) | 0 (0.0%) |
| 5-Person Households | 216 (5.5%) | 0 (0.0%) |
| 6-Person Households | 37 (0.9%) | 0 (0.0%) |
| 7+ Person Households | 3 (0.1%) | 9 (0.2%) |
| Total | 2,227 (56.8%) | 1,693 (43.2%) |
Female Fertility in Carbondale
Fertility by Age in Carbondale
Average fertility rate in Carbondale is 57.0 births per 1,000 women. Women in the age bracket of 20 to 34 years have the highest fertility rate with 100.0 births per 1,000 women. Women in the age bracket of 20 to 34 years acount for 87.6% of all women with births.
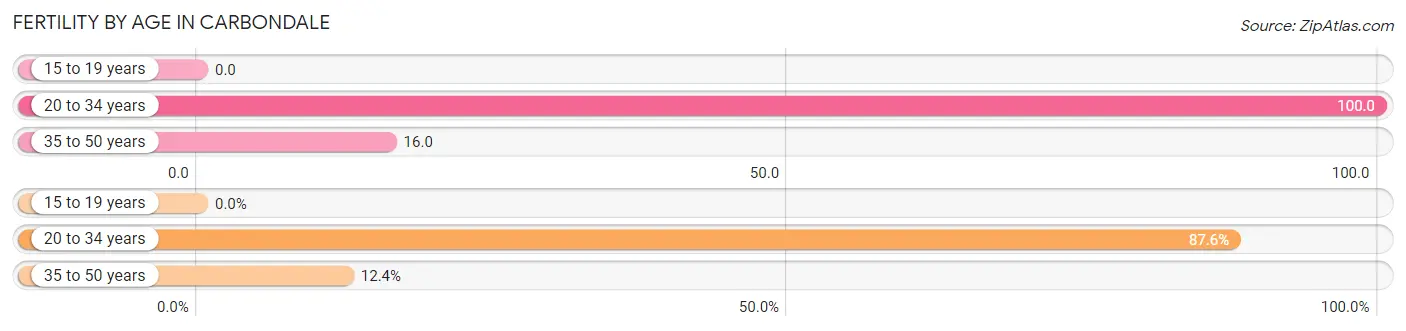
| Age Bracket | Women with Births | Births / 1,000 Women |
| 15 to 19 years | 0 (0.0%) | 0.0 |
| 20 to 34 years | 85 (87.6%) | 100.0 |
| 35 to 50 years | 12 (12.4%) | 16.0 |
| Total | 97 (100.0%) | 57.0 |
Fertility by Age by Marriage Status in Carbondale
39.2% of women with births (97) in Carbondale are married. The highest percentage of unmarried women with births falls into 35 to 50 years age bracket with 100.0% of them unmarried at the time of birth, while the lowest percentage of unmarried women with births belong to 20 to 34 years age bracket with 55.3% of them unmarried.
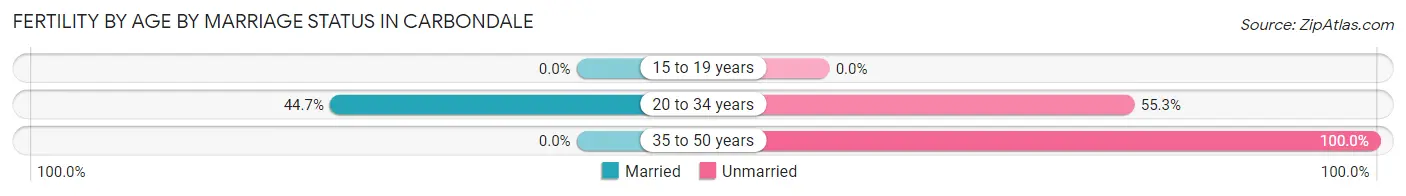
| Age Bracket | Married | Unmarried |
| 15 to 19 years | 0 (0.0%) | 0 (0.0%) |
| 20 to 34 years | 38 (44.7%) | 47 (55.3%) |
| 35 to 50 years | 0 (0.0%) | 12 (100.0%) |
| Total | 38 (39.2%) | 59 (60.8%) |
Fertility by Education in Carbondale
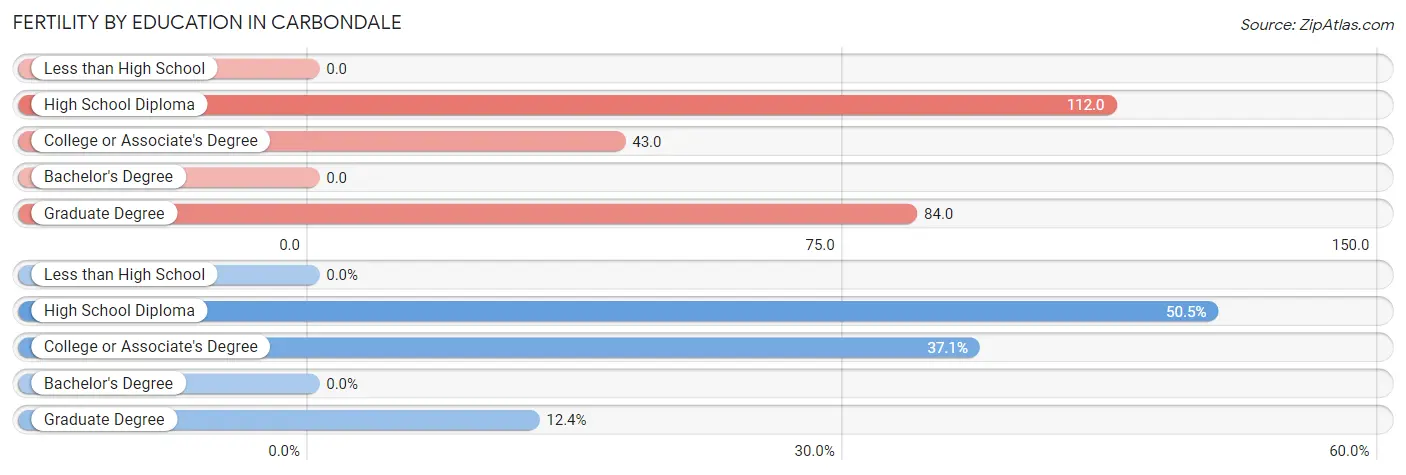
| Educational Attainment | Women with Births | Births / 1,000 Women |
| Less than High School | 0 (0.0%) | 0.0 |
| High School Diploma | 49 (50.5%) | 112.0 |
| College or Associate's Degree | 36 (37.1%) | 43.0 |
| Bachelor's Degree | 0 (0.0%) | 0.0 |
| Graduate Degree | 12 (12.4%) | 84.0 |
| Total | 97 (100.0%) | 57.0 |
Fertility by Education by Marriage Status in Carbondale
60.8% of women with births in Carbondale are unmarried. Women with the educational attainment of high school diploma are most likely to be married with 77.5% of them married at childbirth, while women with the educational attainment of college or associate's degree are least likely to be married with 100.0% of them unmarried at childbirth.
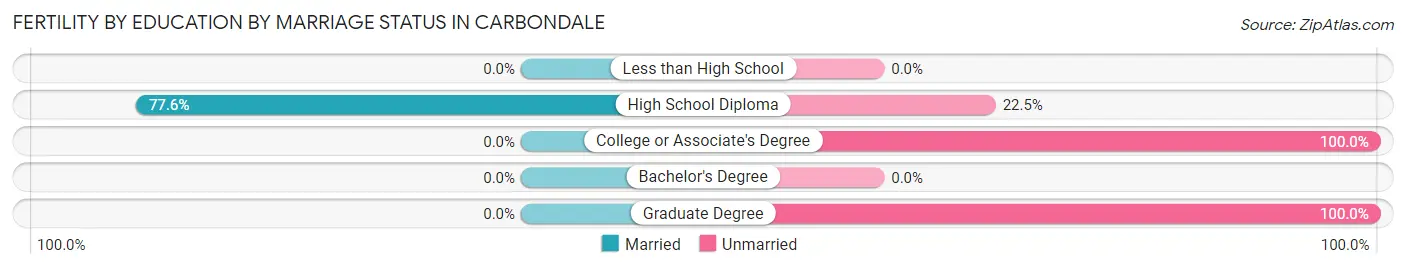
| Educational Attainment | Married | Unmarried |
| Less than High School | 0 (0.0%) | 0 (0.0%) |
| High School Diploma | 38 (77.5%) | 11 (22.5%) |
| College or Associate's Degree | 0 (0.0%) | 36 (100.0%) |
| Bachelor's Degree | 0 (0.0%) | 0 (0.0%) |
| Graduate Degree | 0 (0.0%) | 12 (100.0%) |
| Total | 38 (39.2%) | 59 (60.8%) |
Employment Characteristics in Carbondale
Employment by Class of Employer in Carbondale
Among the 3,568 employed individuals in Carbondale, private company employees (2,410 | 67.5%), not-for-profit organizations (585 | 16.4%), and local government employees (314 | 8.8%) make up the most common classes of employment.
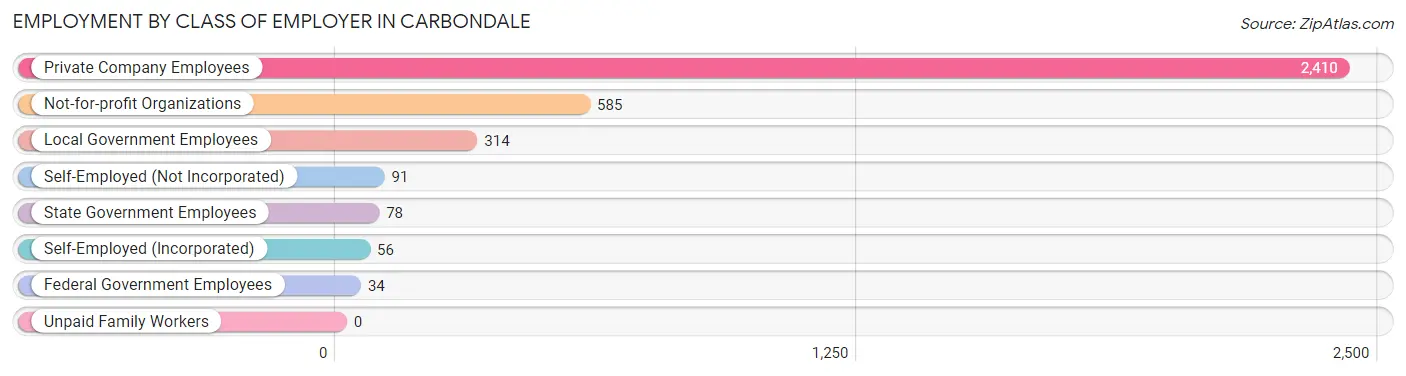
| Employer Class | # Employees | % Employees |
| Private Company Employees | 2,410 | 67.5% |
| Self-Employed (Incorporated) | 56 | 1.6% |
| Self-Employed (Not Incorporated) | 91 | 2.5% |
| Not-for-profit Organizations | 585 | 16.4% |
| Local Government Employees | 314 | 8.8% |
| State Government Employees | 78 | 2.2% |
| Federal Government Employees | 34 | 0.9% |
| Unpaid Family Workers | 0 | 0.0% |
| Total | 3,568 | 100.0% |
Employment Status by Age in Carbondale
According to the labor force statistics for Carbondale, out of the total population over 16 years of age (7,219), 53.2% or 3,841 individuals are in the labor force, with 6.5% or 250 of them unemployed. The age group with the highest labor force participation rate is 25 to 29 years, with 77.1% or 613 individuals in the labor force. Within the labor force, the 16 to 19 years age range has the highest percentage of unemployed individuals, with 21.7% or 26 of them being unemployed.
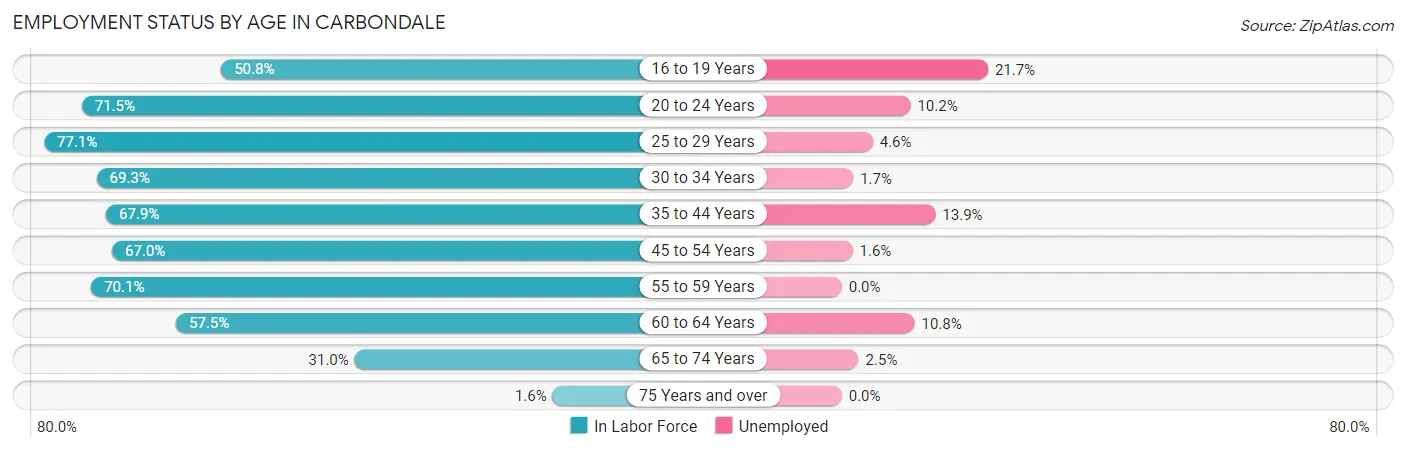
| Age Bracket | In Labor Force | Unemployed |
| 16 to 19 Years | 120 (50.8%) | 26 (21.7%) |
| 20 to 24 Years | 323 (71.5%) | 33 (10.2%) |
| 25 to 29 Years | 613 (77.1%) | 28 (4.6%) |
| 30 to 34 Years | 346 (69.3%) | 6 (1.7%) |
| 35 to 44 Years | 693 (67.9%) | 96 (13.9%) |
| 45 to 54 Years | 617 (67.0%) | 10 (1.6%) |
| 55 to 59 Years | 386 (70.1%) | 0 (0.0%) |
| 60 to 64 Years | 370 (57.5%) | 40 (10.8%) |
| 65 to 74 Years | 361 (31.0%) | 9 (2.5%) |
| 75 Years and over | 15 (1.6%) | 0 (0.0%) |
| Total | 3,841 (53.2%) | 250 (6.5%) |
Employment Status by Educational Attainment in Carbondale
According to labor force statistics for Carbondale, 68.3% of individuals (3,026) out of the total population between 25 and 64 years of age (4,430) are in the labor force, with 6.0% or 182 of them being unemployed. The group with the highest labor force participation rate are those with the educational attainment of bachelor's degree or higher, with 91.5% or 804 individuals in the labor force. Within the labor force, individuals with less than high school education have the highest percentage of unemployment, with 10.2% or 21 of them being unemployed.
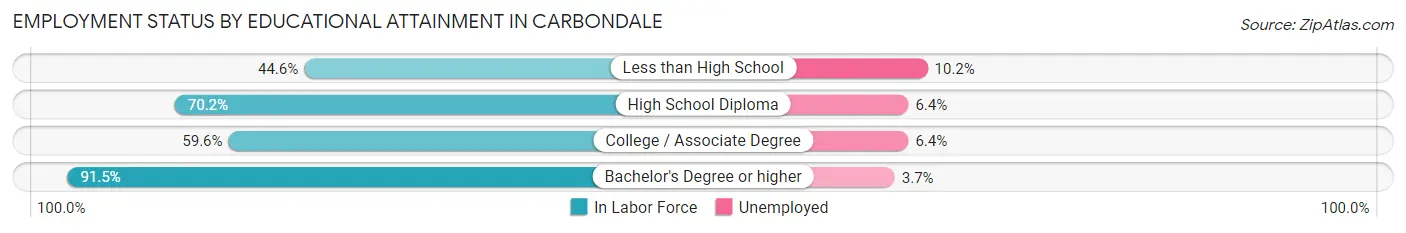
| Educational Attainment | In Labor Force | Unemployed |
| Less than High School | 206 (44.6%) | 47 (10.2%) |
| High School Diploma | 1,154 (70.2%) | 105 (6.4%) |
| College / Associate Degree | 861 (59.6%) | 92 (6.4%) |
| Bachelor's Degree or higher | 804 (91.5%) | 33 (3.7%) |
| Total | 3,026 (68.3%) | 266 (6.0%) |
Employment Occupations by Sex in Carbondale
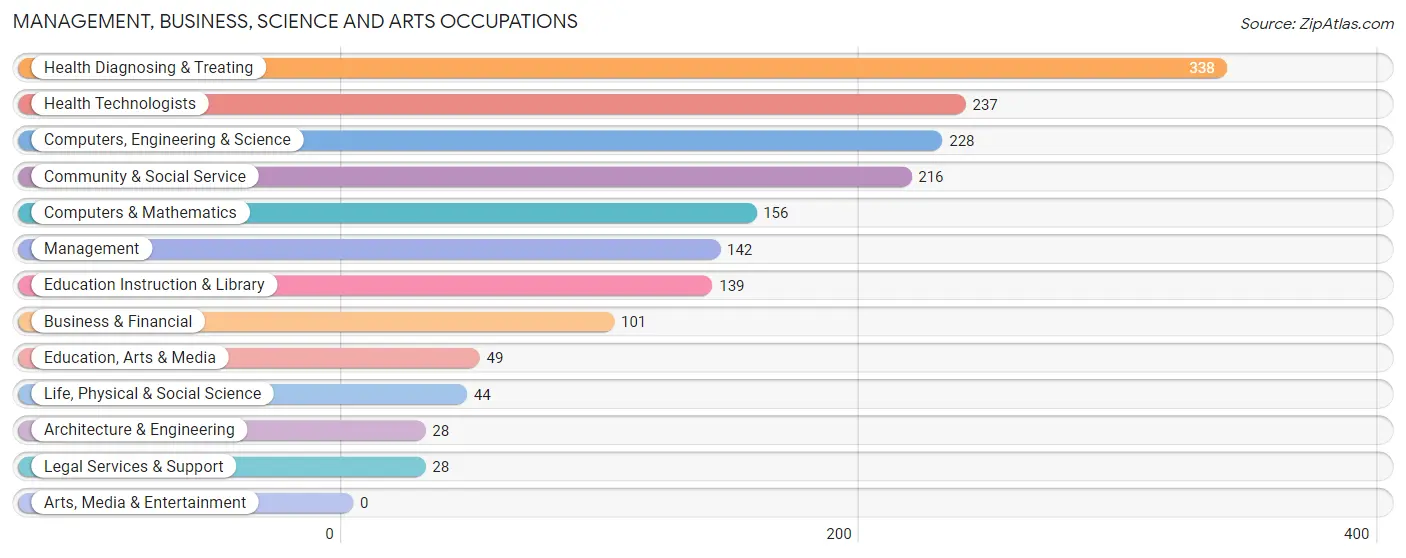
Management, Business, Science and Arts Occupations
The most common Management, Business, Science and Arts occupations in Carbondale are Health Diagnosing & Treating (338 | 9.4%), Health Technologists (237 | 6.6%), Computers, Engineering & Science (228 | 6.3%), Community & Social Service (216 | 6.0%), and Computers & Mathematics (156 | 4.3%).
Management, Business, Science and Arts Occupations by Sex
Within the Management, Business, Science and Arts occupations in Carbondale, the most male-oriented occupations are Architecture & Engineering (100.0%), Computers & Mathematics (87.8%), and Computers, Engineering & Science (78.1%), while the most female-oriented occupations are Legal Services & Support (100.0%), Community & Social Service (83.8%), and Education, Arts & Media (83.7%).
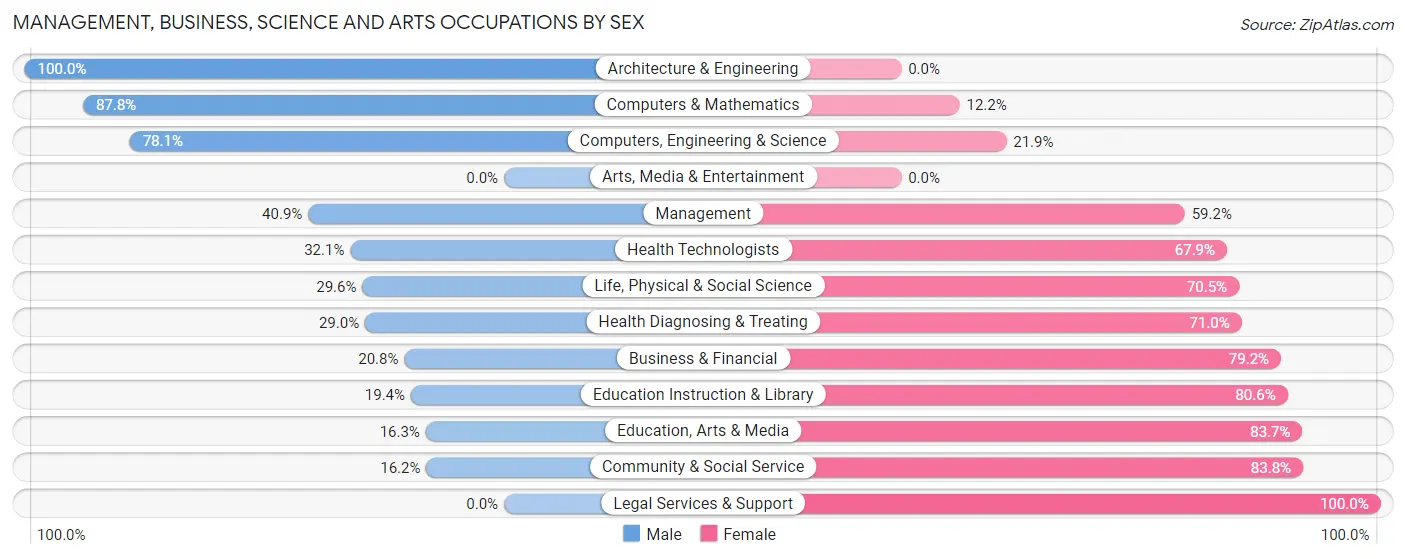
| Occupation | Male | Female |
| Management | 58 (40.8%) | 84 (59.2%) |
| Business & Financial | 21 (20.8%) | 80 (79.2%) |
| Computers, Engineering & Science | 178 (78.1%) | 50 (21.9%) |
| Computers & Mathematics | 137 (87.8%) | 19 (12.2%) |
| Architecture & Engineering | 28 (100.0%) | 0 (0.0%) |
| Life, Physical & Social Science | 13 (29.5%) | 31 (70.5%) |
| Community & Social Service | 35 (16.2%) | 181 (83.8%) |
| Education, Arts & Media | 8 (16.3%) | 41 (83.7%) |
| Legal Services & Support | 0 (0.0%) | 28 (100.0%) |
| Education Instruction & Library | 27 (19.4%) | 112 (80.6%) |
| Arts, Media & Entertainment | 0 (0.0%) | 0 (0.0%) |
| Health Diagnosing & Treating | 98 (29.0%) | 240 (71.0%) |
| Health Technologists | 76 (32.1%) | 161 (67.9%) |
| Total (Category) | 390 (38.1%) | 635 (62.0%) |
| Total (Overall) | 2,095 (58.3%) | 1,501 (41.7%) |
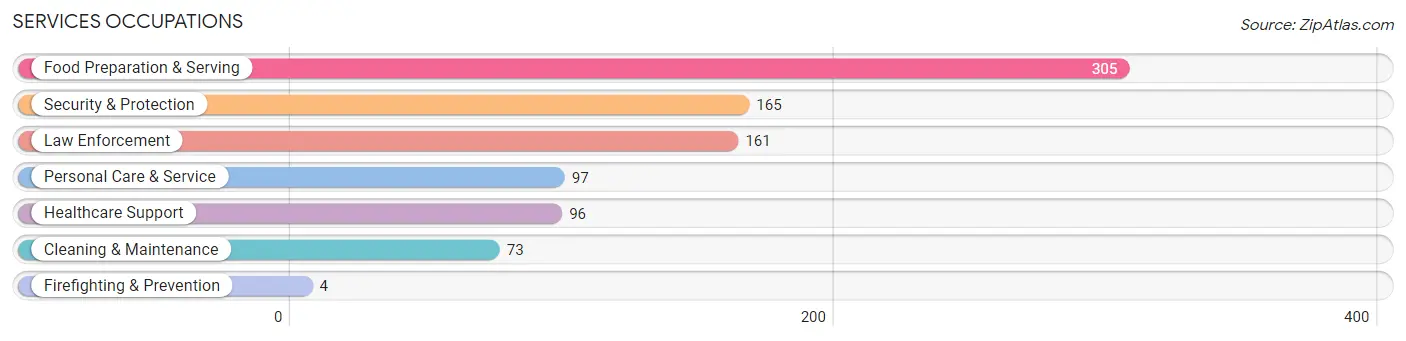
Services Occupations
The most common Services occupations in Carbondale are Food Preparation & Serving (305 | 8.5%), Security & Protection (165 | 4.6%), Law Enforcement (161 | 4.5%), Personal Care & Service (97 | 2.7%), and Healthcare Support (96 | 2.7%).
Services Occupations by Sex
Within the Services occupations in Carbondale, the most male-oriented occupations are Security & Protection (100.0%), Firefighting & Prevention (100.0%), and Law Enforcement (100.0%), while the most female-oriented occupations are Healthcare Support (78.1%), Food Preparation & Serving (54.1%), and Personal Care & Service (36.1%).
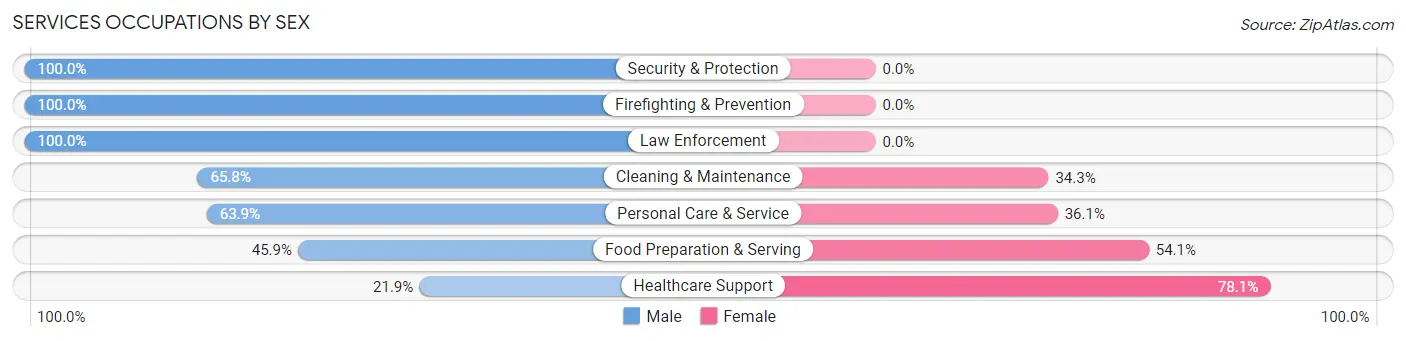
| Occupation | Male | Female |
| Healthcare Support | 21 (21.9%) | 75 (78.1%) |
| Security & Protection | 165 (100.0%) | 0 (0.0%) |
| Firefighting & Prevention | 4 (100.0%) | 0 (0.0%) |
| Law Enforcement | 161 (100.0%) | 0 (0.0%) |
| Food Preparation & Serving | 140 (45.9%) | 165 (54.1%) |
| Cleaning & Maintenance | 48 (65.7%) | 25 (34.3%) |
| Personal Care & Service | 62 (63.9%) | 35 (36.1%) |
| Total (Category) | 436 (59.2%) | 300 (40.8%) |
| Total (Overall) | 2,095 (58.3%) | 1,501 (41.7%) |
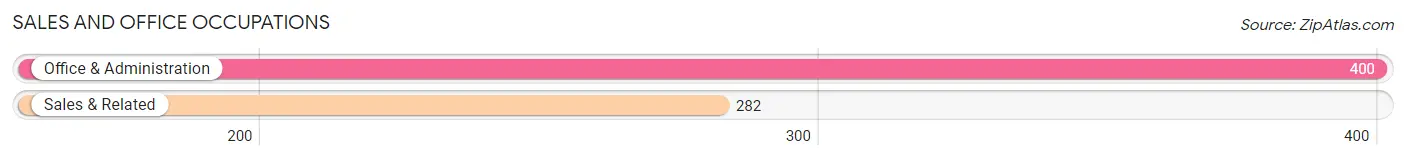
Sales and Office Occupations
The most common Sales and Office occupations in Carbondale are Office & Administration (400 | 11.1%), and Sales & Related (282 | 7.8%).
Sales and Office Occupations by Sex
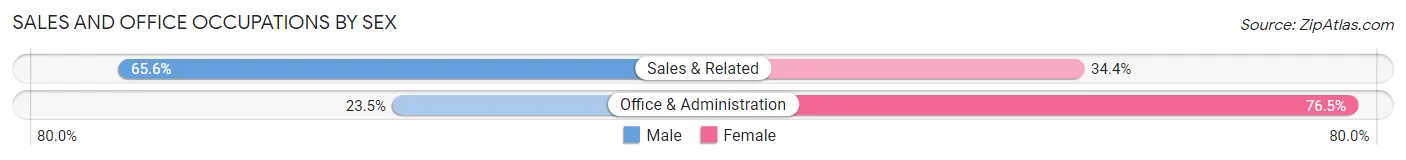
| Occupation | Male | Female |
| Sales & Related | 185 (65.6%) | 97 (34.4%) |
| Office & Administration | 94 (23.5%) | 306 (76.5%) |
| Total (Category) | 279 (40.9%) | 403 (59.1%) |
| Total (Overall) | 2,095 (58.3%) | 1,501 (41.7%) |
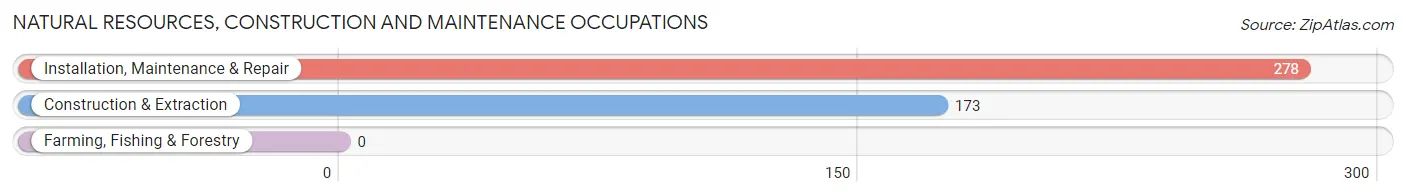
Natural Resources, Construction and Maintenance Occupations
The most common Natural Resources, Construction and Maintenance occupations in Carbondale are Installation, Maintenance & Repair (278 | 7.7%), and Construction & Extraction (173 | 4.8%).
Natural Resources, Construction and Maintenance Occupations by Sex
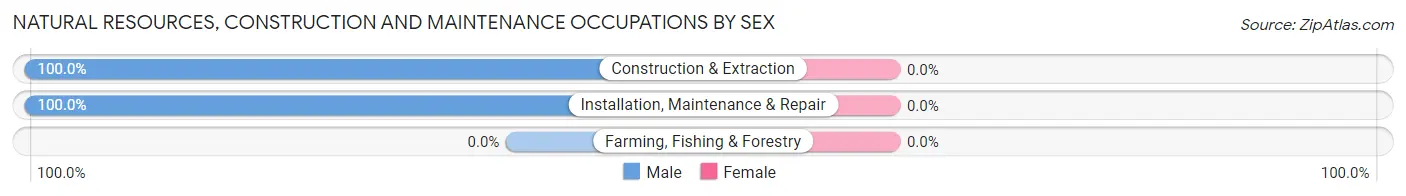
| Occupation | Male | Female |
| Farming, Fishing & Forestry | 0 (0.0%) | 0 (0.0%) |
| Construction & Extraction | 173 (100.0%) | 0 (0.0%) |
| Installation, Maintenance & Repair | 278 (100.0%) | 0 (0.0%) |
| Total (Category) | 451 (100.0%) | 0 (0.0%) |
| Total (Overall) | 2,095 (58.3%) | 1,501 (41.7%) |
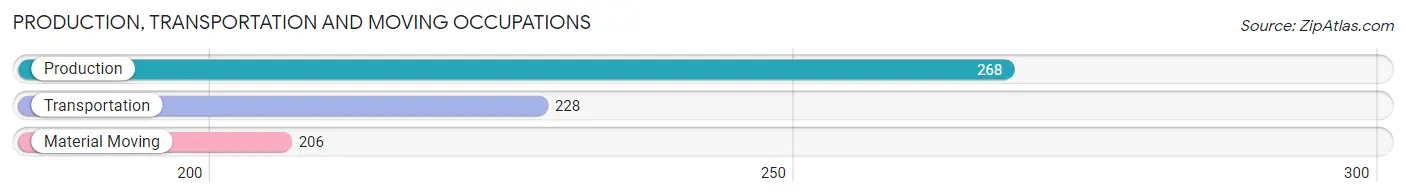
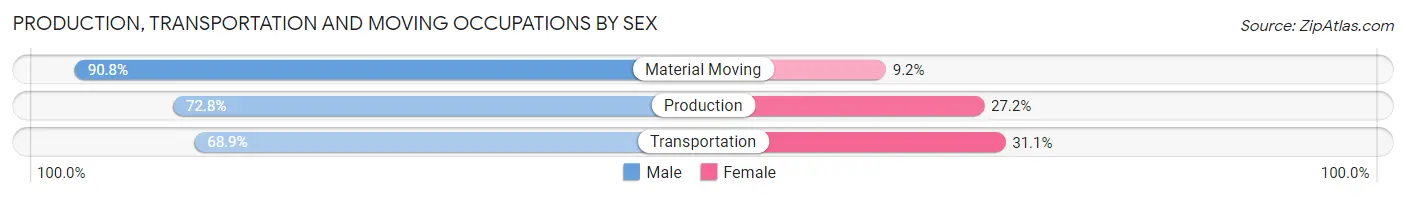
Production, Transportation and Moving Occupations
The most common Production, Transportation and Moving occupations in Carbondale are Production (268 | 7.4%), Transportation (228 | 6.3%), and Material Moving (206 | 5.7%).
Production, Transportation and Moving Occupations by Sex
| Occupation | Male | Female |
| Production | 195 (72.8%) | 73 (27.2%) |
| Transportation | 157 (68.9%) | 71 (31.1%) |
| Material Moving | 187 (90.8%) | 19 (9.2%) |
| Total (Category) | 539 (76.8%) | 163 (23.2%) |
| Total (Overall) | 2,095 (58.3%) | 1,501 (41.7%) |
Employment Industries by Sex in Carbondale
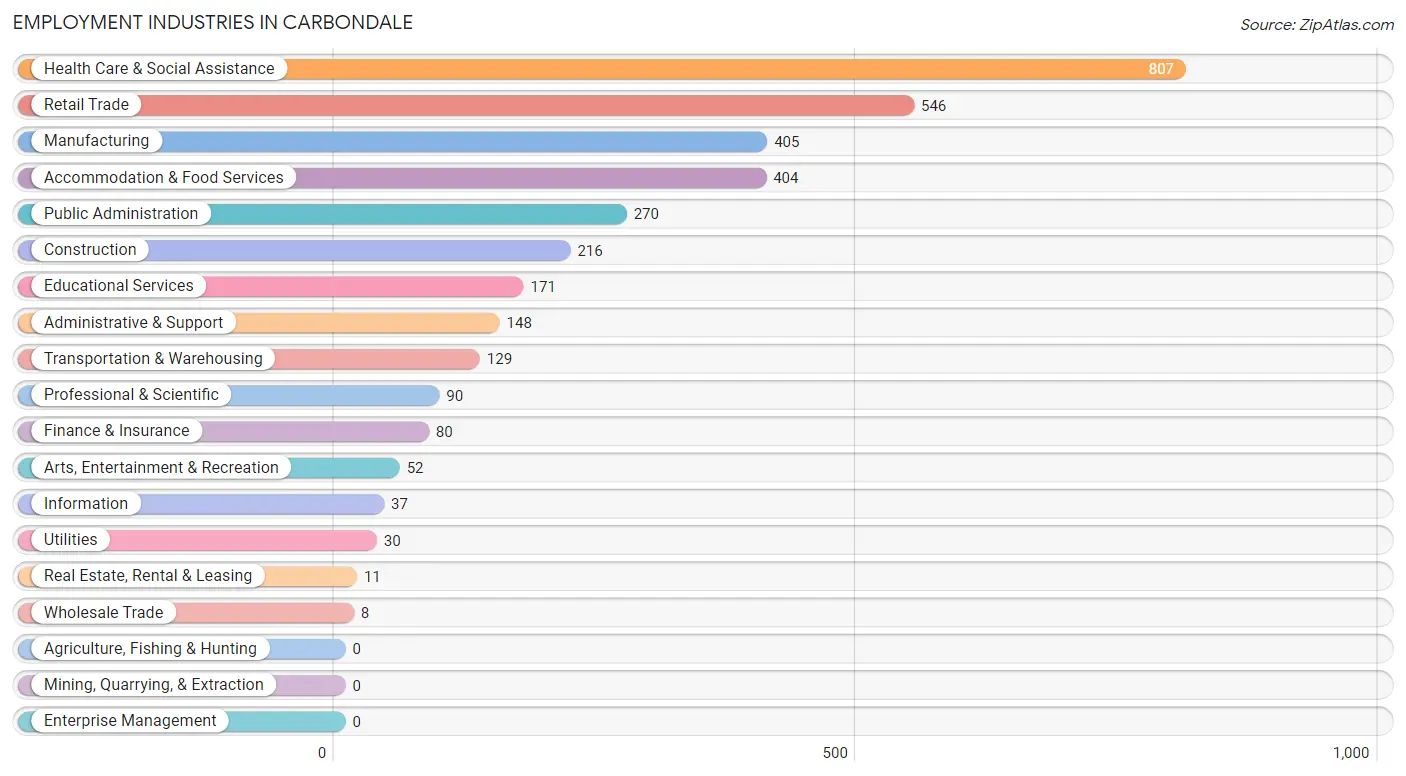
Employment Industries in Carbondale
The major employment industries in Carbondale include Health Care & Social Assistance (807 | 22.4%), Retail Trade (546 | 15.2%), Manufacturing (405 | 11.3%), Accommodation & Food Services (404 | 11.2%), and Public Administration (270 | 7.5%).
Employment Industries by Sex in Carbondale
The Carbondale industries that see more men than women are Construction (100.0%), Utilities (100.0%), and Real Estate, Rental & Leasing (100.0%), whereas the industries that tend to have a higher number of women are Wholesale Trade (100.0%), Educational Services (77.8%), and Professional & Scientific (73.3%).
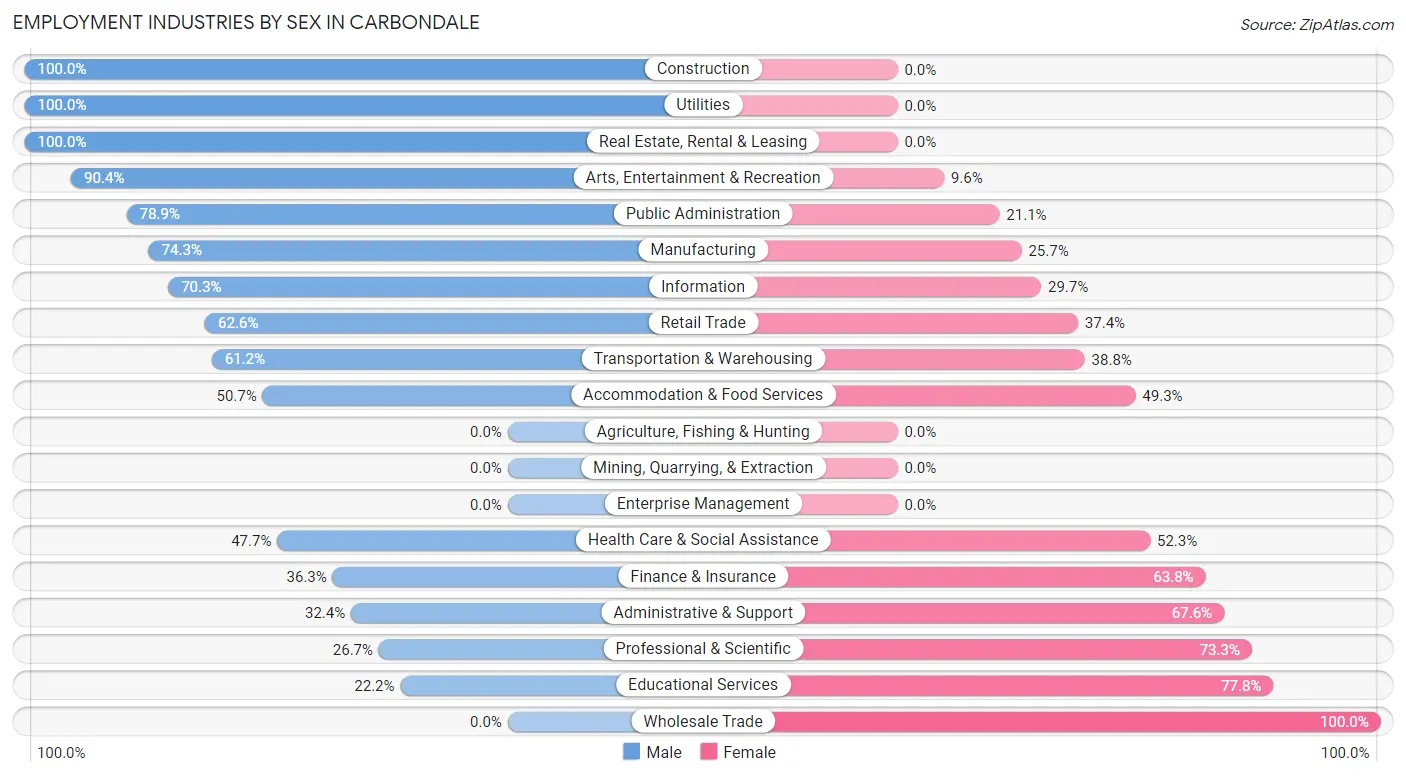
| Industry | Male | Female |
| Agriculture, Fishing & Hunting | 0 (0.0%) | 0 (0.0%) |
| Mining, Quarrying, & Extraction | 0 (0.0%) | 0 (0.0%) |
| Construction | 216 (100.0%) | 0 (0.0%) |
| Manufacturing | 301 (74.3%) | 104 (25.7%) |
| Wholesale Trade | 0 (0.0%) | 8 (100.0%) |
| Retail Trade | 342 (62.6%) | 204 (37.4%) |
| Transportation & Warehousing | 79 (61.2%) | 50 (38.8%) |
| Utilities | 30 (100.0%) | 0 (0.0%) |
| Information | 26 (70.3%) | 11 (29.7%) |
| Finance & Insurance | 29 (36.2%) | 51 (63.7%) |
| Real Estate, Rental & Leasing | 11 (100.0%) | 0 (0.0%) |
| Professional & Scientific | 24 (26.7%) | 66 (73.3%) |
| Enterprise Management | 0 (0.0%) | 0 (0.0%) |
| Administrative & Support | 48 (32.4%) | 100 (67.6%) |
| Educational Services | 38 (22.2%) | 133 (77.8%) |
| Health Care & Social Assistance | 385 (47.7%) | 422 (52.3%) |
| Arts, Entertainment & Recreation | 47 (90.4%) | 5 (9.6%) |
| Accommodation & Food Services | 205 (50.7%) | 199 (49.3%) |
| Public Administration | 213 (78.9%) | 57 (21.1%) |
| Total | 2,095 (58.3%) | 1,501 (41.7%) |
Education in Carbondale
School Enrollment in Carbondale
The most common levels of schooling among the 1,287 students in Carbondale are elementary school (428 | 33.3%), middle school (369 | 28.7%), and high school (180 | 14.0%).
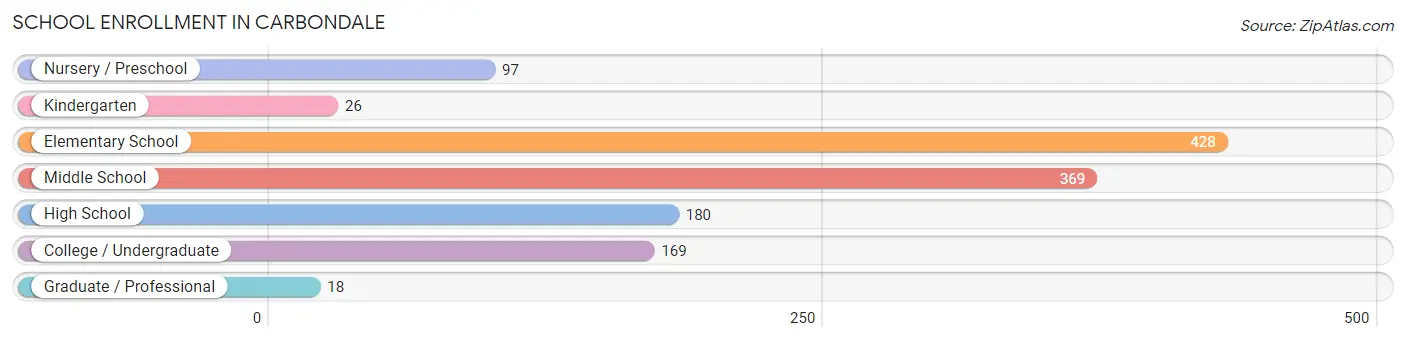
| School Level | # Students | % Students |
| Nursery / Preschool | 97 | 7.5% |
| Kindergarten | 26 | 2.0% |
| Elementary School | 428 | 33.3% |
| Middle School | 369 | 28.7% |
| High School | 180 | 14.0% |
| College / Undergraduate | 169 | 13.1% |
| Graduate / Professional | 18 | 1.4% |
| Total | 1,287 | 100.0% |
School Enrollment by Age by Funding Source in Carbondale
Out of a total of 1,287 students who are enrolled in schools in Carbondale, 115 (8.9%) attend a private institution, while the remaining 1,172 (91.1%) are enrolled in public schools. The age group of 25 to 34 year olds has the highest likelihood of being enrolled in private schools, with 19 (100.0% in the age bracket) enrolled. Conversely, the age group of 5 to 9 year old has the lowest likelihood of being enrolled in a private school, with 417 (100.0% in the age bracket) attending a public institution.
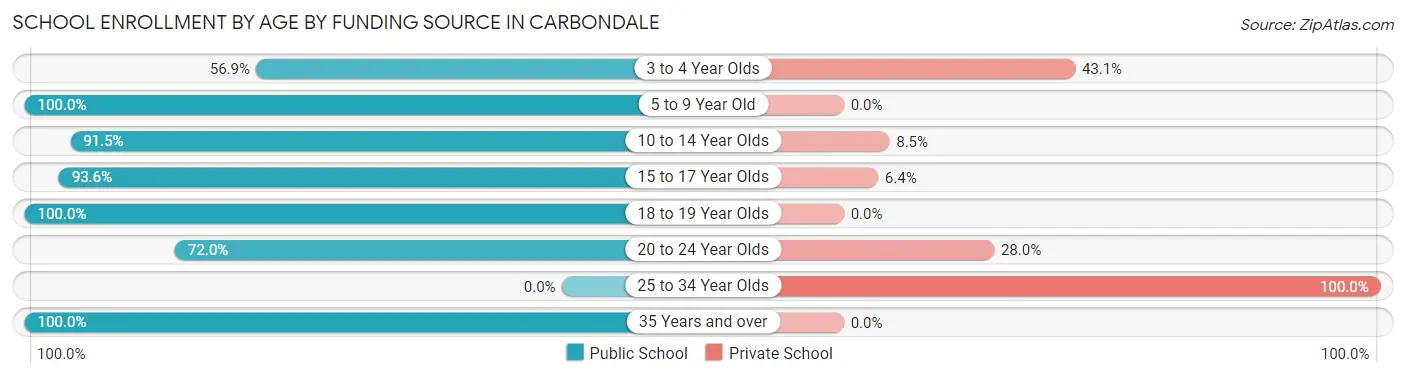
| Age Bracket | Public School | Private School |
| 3 to 4 Year Olds | 37 (56.9%) | 28 (43.1%) |
| 5 to 9 Year Old | 417 (100.0%) | 0 (0.0%) |
| 10 to 14 Year Olds | 409 (91.5%) | 38 (8.5%) |
| 15 to 17 Year Olds | 132 (93.6%) | 9 (6.4%) |
| 18 to 19 Year Olds | 66 (100.0%) | 0 (0.0%) |
| 20 to 24 Year Olds | 54 (72.0%) | 21 (28.0%) |
| 25 to 34 Year Olds | 0 (0.0%) | 19 (100.0%) |
| 35 Years and over | 57 (100.0%) | 0 (0.0%) |
| Total | 1,172 (91.1%) | 115 (8.9%) |
Educational Attainment by Field of Study in Carbondale
Science & technology (270 | 21.0%), education (219 | 17.0%), business (131 | 10.2%), computers & mathematics (116 | 9.0%), and arts & humanities (101 | 7.9%) are the most common fields of study among 1,287 individuals in Carbondale who have obtained a bachelor's degree or higher.
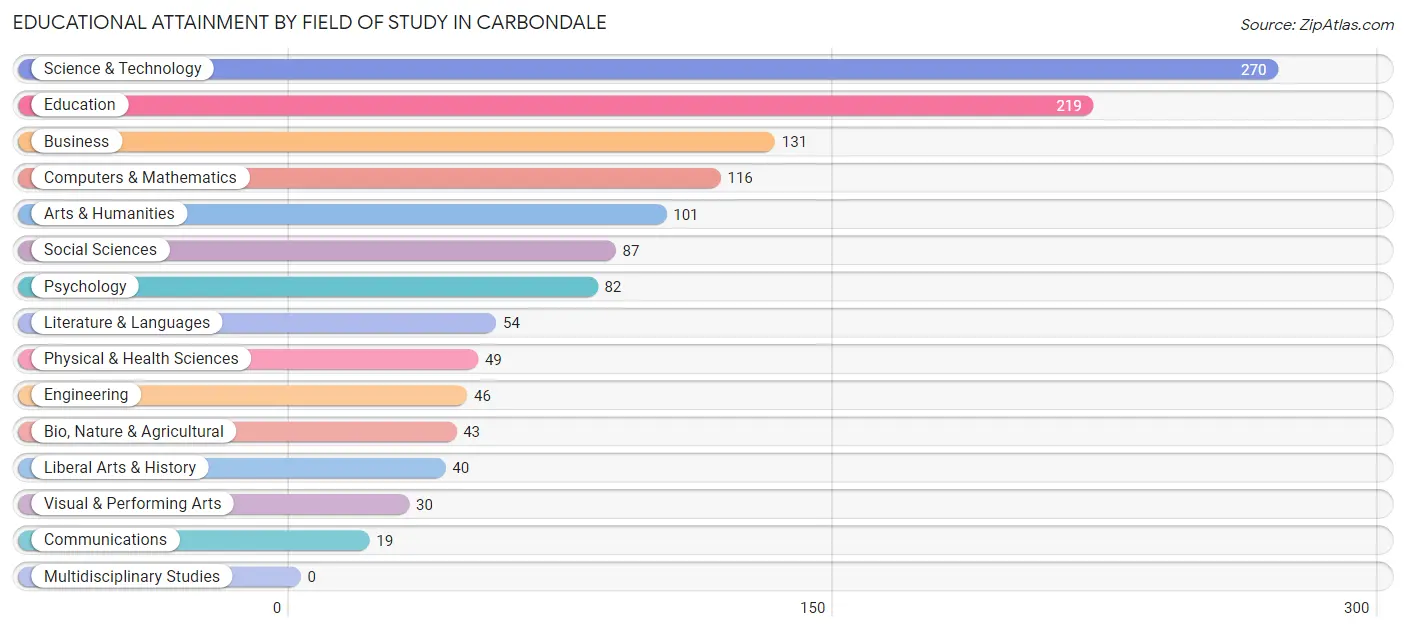
| Field of Study | # Graduates | % Graduates |
| Computers & Mathematics | 116 | 9.0% |
| Bio, Nature & Agricultural | 43 | 3.3% |
| Physical & Health Sciences | 49 | 3.8% |
| Psychology | 82 | 6.4% |
| Social Sciences | 87 | 6.8% |
| Engineering | 46 | 3.6% |
| Multidisciplinary Studies | 0 | 0.0% |
| Science & Technology | 270 | 21.0% |
| Business | 131 | 10.2% |
| Education | 219 | 17.0% |
| Literature & Languages | 54 | 4.2% |
| Liberal Arts & History | 40 | 3.1% |
| Visual & Performing Arts | 30 | 2.3% |
| Communications | 19 | 1.5% |
| Arts & Humanities | 101 | 7.9% |
| Total | 1,287 | 100.0% |
Transportation & Commute in Carbondale
Vehicle Availability by Sex in Carbondale
The most prevalent vehicle ownership categories in Carbondale are males with 2 vehicles (888, accounting for 42.8%) and females with 2 vehicles (534, making up 59.8%).
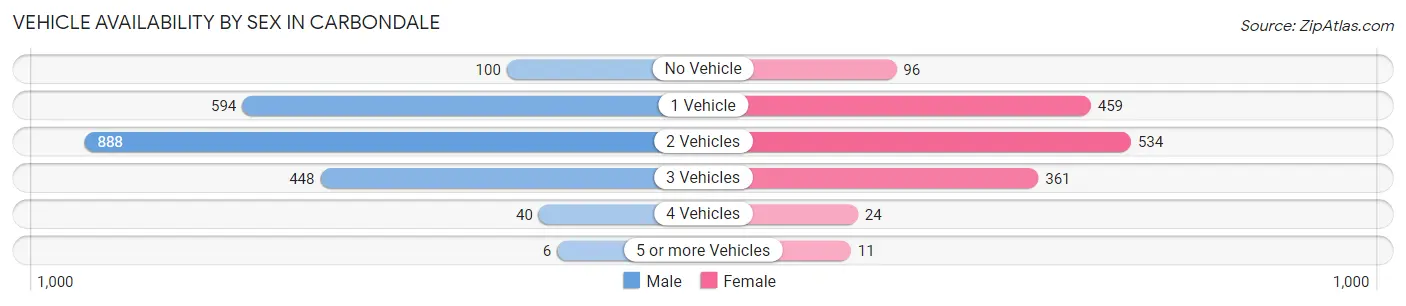
| Vehicles Available | Male | Female |
| No Vehicle | 100 (4.8%) | 96 (6.5%) |
| 1 Vehicle | 594 (28.6%) | 459 (30.9%) |
| 2 Vehicles | 888 (42.8%) | 534 (36.0%) |
| 3 Vehicles | 448 (21.6%) | 361 (24.3%) |
| 4 Vehicles | 40 (1.9%) | 24 (1.6%) |
| 5 or more Vehicles | 6 (0.3%) | 11 (0.7%) |
| Total | 2,076 (100.0%) | 1,485 (100.0%) |
Commute Time in Carbondale
The most frequently occuring commute durations in Carbondale are 15 to 19 minutes (639 commuters, 18.9%), 5 to 9 minutes (600 commuters, 17.7%), and 30 to 34 minutes (429 commuters, 12.7%).
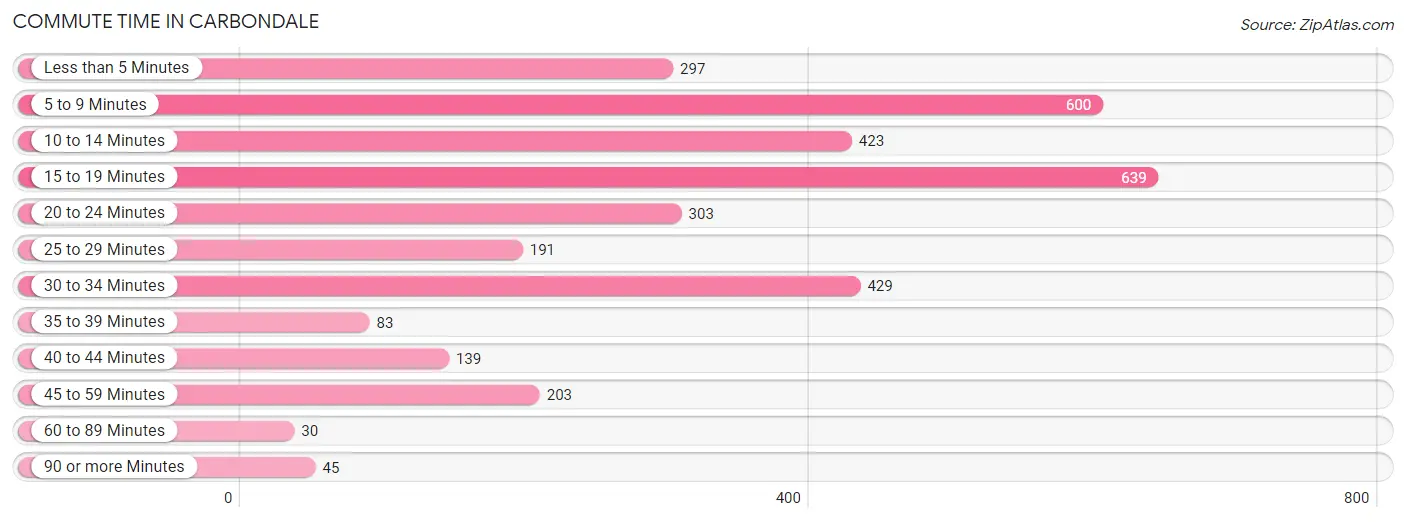
| Commute Time | # Commuters | % Commuters |
| Less than 5 Minutes | 297 | 8.8% |
| 5 to 9 Minutes | 600 | 17.7% |
| 10 to 14 Minutes | 423 | 12.5% |
| 15 to 19 Minutes | 639 | 18.9% |
| 20 to 24 Minutes | 303 | 9.0% |
| 25 to 29 Minutes | 191 | 5.7% |
| 30 to 34 Minutes | 429 | 12.7% |
| 35 to 39 Minutes | 83 | 2.5% |
| 40 to 44 Minutes | 139 | 4.1% |
| 45 to 59 Minutes | 203 | 6.0% |
| 60 to 89 Minutes | 30 | 0.9% |
| 90 or more Minutes | 45 | 1.3% |
Commute Time by Sex in Carbondale
The most common commute times in Carbondale are 15 to 19 minutes (432 commuters, 21.4%) for males and 5 to 9 minutes (290 commuters, 21.3%) for females.
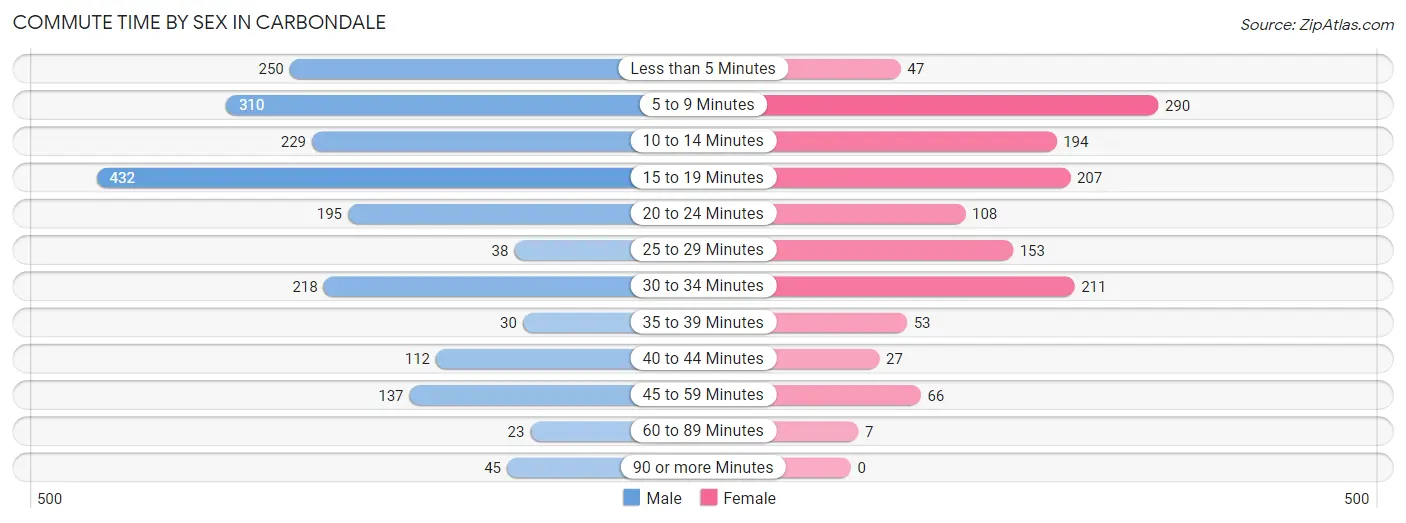
| Commute Time | Male | Female |
| Less than 5 Minutes | 250 (12.4%) | 47 (3.5%) |
| 5 to 9 Minutes | 310 (15.3%) | 290 (21.3%) |
| 10 to 14 Minutes | 229 (11.3%) | 194 (14.2%) |
| 15 to 19 Minutes | 432 (21.4%) | 207 (15.2%) |
| 20 to 24 Minutes | 195 (9.7%) | 108 (7.9%) |
| 25 to 29 Minutes | 38 (1.9%) | 153 (11.2%) |
| 30 to 34 Minutes | 218 (10.8%) | 211 (15.5%) |
| 35 to 39 Minutes | 30 (1.5%) | 53 (3.9%) |
| 40 to 44 Minutes | 112 (5.6%) | 27 (2.0%) |
| 45 to 59 Minutes | 137 (6.8%) | 66 (4.8%) |
| 60 to 89 Minutes | 23 (1.1%) | 7 (0.5%) |
| 90 or more Minutes | 45 (2.2%) | 0 (0.0%) |
Time of Departure to Work by Sex in Carbondale
The most frequent times of departure to work in Carbondale are 6:00 AM to 6:29 AM (317, 15.7%) for males and 7:00 AM to 7:29 AM (299, 21.9%) for females.
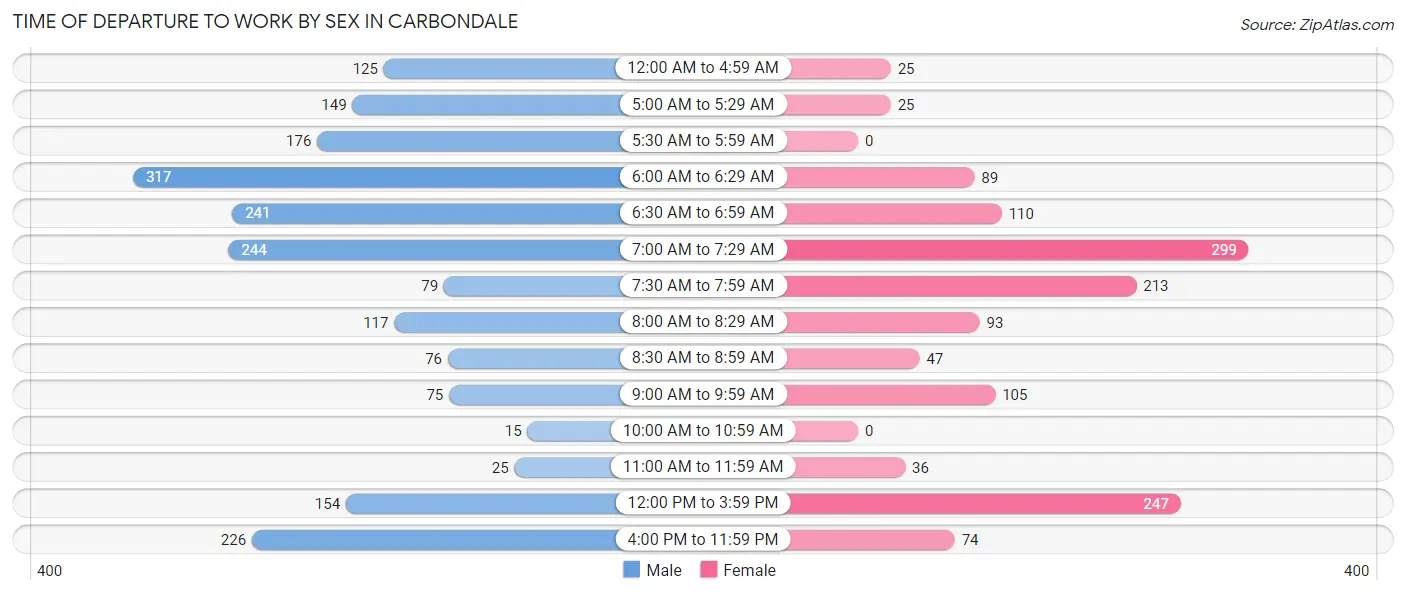
| Time of Departure | Male | Female |
| 12:00 AM to 4:59 AM | 125 (6.2%) | 25 (1.8%) |
| 5:00 AM to 5:29 AM | 149 (7.4%) | 25 (1.8%) |
| 5:30 AM to 5:59 AM | 176 (8.7%) | 0 (0.0%) |
| 6:00 AM to 6:29 AM | 317 (15.7%) | 89 (6.5%) |
| 6:30 AM to 6:59 AM | 241 (11.9%) | 110 (8.1%) |
| 7:00 AM to 7:29 AM | 244 (12.1%) | 299 (21.9%) |
| 7:30 AM to 7:59 AM | 79 (3.9%) | 213 (15.6%) |
| 8:00 AM to 8:29 AM | 117 (5.8%) | 93 (6.8%) |
| 8:30 AM to 8:59 AM | 76 (3.8%) | 47 (3.5%) |
| 9:00 AM to 9:59 AM | 75 (3.7%) | 105 (7.7%) |
| 10:00 AM to 10:59 AM | 15 (0.7%) | 0 (0.0%) |
| 11:00 AM to 11:59 AM | 25 (1.2%) | 36 (2.6%) |
| 12:00 PM to 3:59 PM | 154 (7.6%) | 247 (18.1%) |
| 4:00 PM to 11:59 PM | 226 (11.2%) | 74 (5.4%) |
| Total | 2,019 (100.0%) | 1,363 (100.0%) |
Housing Occupancy in Carbondale
Occupancy by Ownership in Carbondale
Of the total 3,920 dwellings in Carbondale, owner-occupied units account for 2,076 (53.0%), while renter-occupied units make up 1,844 (47.0%).
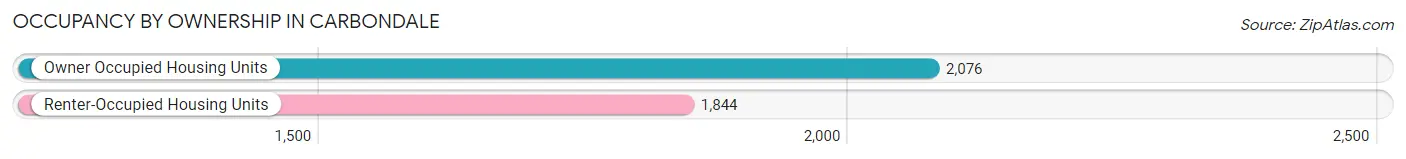
| Occupancy | # Housing Units | % Housing Units |
| Owner Occupied Housing Units | 2,076 | 53.0% |
| Renter-Occupied Housing Units | 1,844 | 47.0% |
| Total Occupied Housing Units | 3,920 | 100.0% |
Occupancy by Household Size in Carbondale
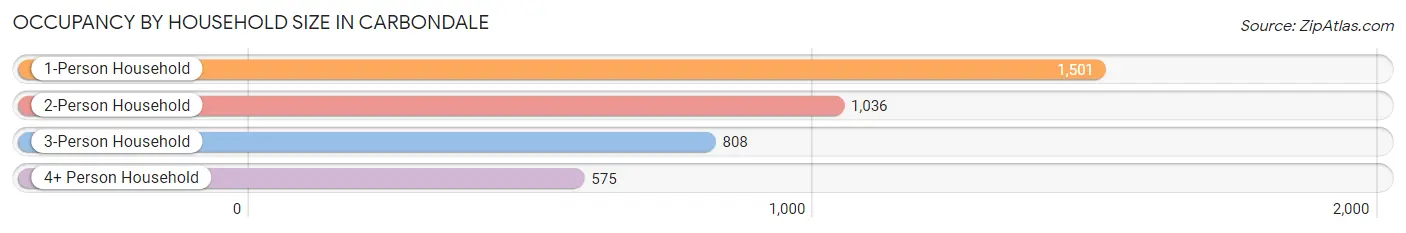
| Household Size | # Housing Units | % Housing Units |
| 1-Person Household | 1,501 | 38.3% |
| 2-Person Household | 1,036 | 26.4% |
| 3-Person Household | 808 | 20.6% |
| 4+ Person Household | 575 | 14.7% |
| Total Housing Units | 3,920 | 100.0% |
Occupancy by Ownership by Household Size in Carbondale
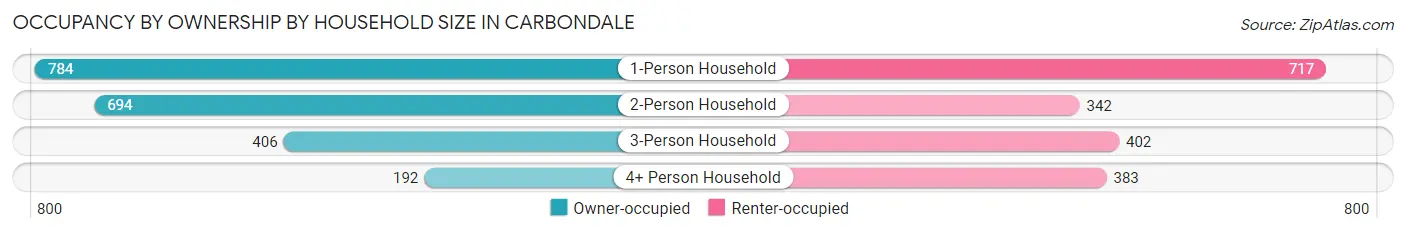
| Household Size | Owner-occupied | Renter-occupied |
| 1-Person Household | 784 (52.2%) | 717 (47.8%) |
| 2-Person Household | 694 (67.0%) | 342 (33.0%) |
| 3-Person Household | 406 (50.2%) | 402 (49.7%) |
| 4+ Person Household | 192 (33.4%) | 383 (66.6%) |
| Total Housing Units | 2,076 (53.0%) | 1,844 (47.0%) |
Occupancy by Educational Attainment in Carbondale
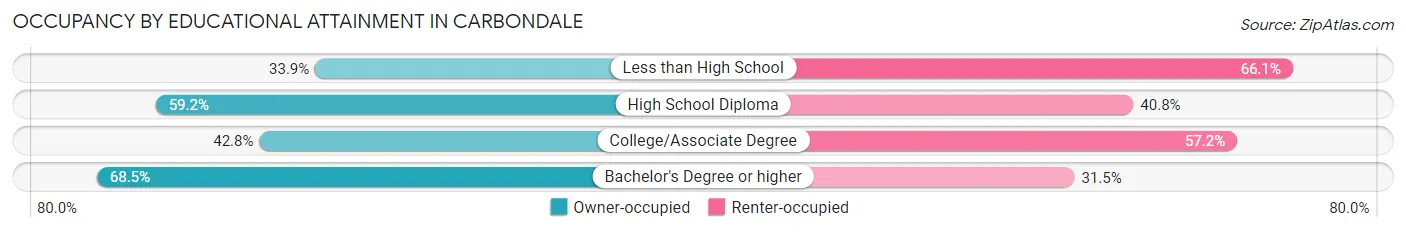
| Household Size | Owner-occupied | Renter-occupied |
| Less than High School | 135 (33.9%) | 263 (66.1%) |
| High School Diploma | 920 (59.2%) | 634 (40.8%) |
| College/Associate Degree | 544 (42.8%) | 728 (57.2%) |
| Bachelor's Degree or higher | 477 (68.5%) | 219 (31.5%) |
Occupancy by Age of Householder in Carbondale
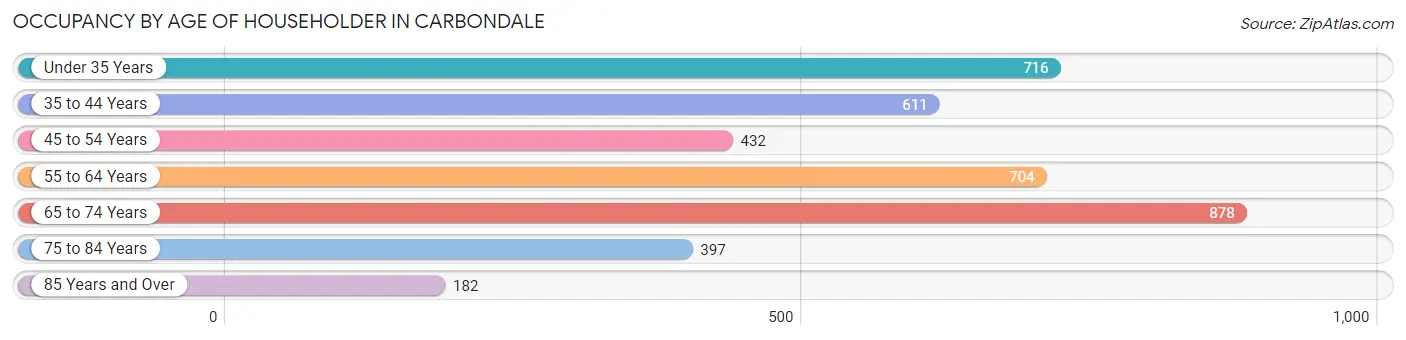
| Age Bracket | # Households | % Households |
| Under 35 Years | 716 | 18.3% |
| 35 to 44 Years | 611 | 15.6% |
| 45 to 54 Years | 432 | 11.0% |
| 55 to 64 Years | 704 | 18.0% |
| 65 to 74 Years | 878 | 22.4% |
| 75 to 84 Years | 397 | 10.1% |
| 85 Years and Over | 182 | 4.6% |
| Total | 3,920 | 100.0% |
Housing Finances in Carbondale
Median Income by Occupancy in Carbondale
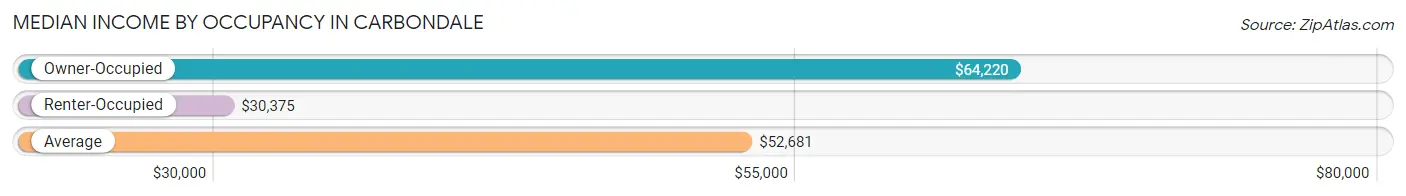
| Occupancy Type | # Households | Median Income |
| Owner-Occupied | 2,076 (53.0%) | $64,220 |
| Renter-Occupied | 1,844 (47.0%) | $30,375 |
| Average | 3,920 (100.0%) | $52,681 |
Occupancy by Householder Income Bracket in Carbondale
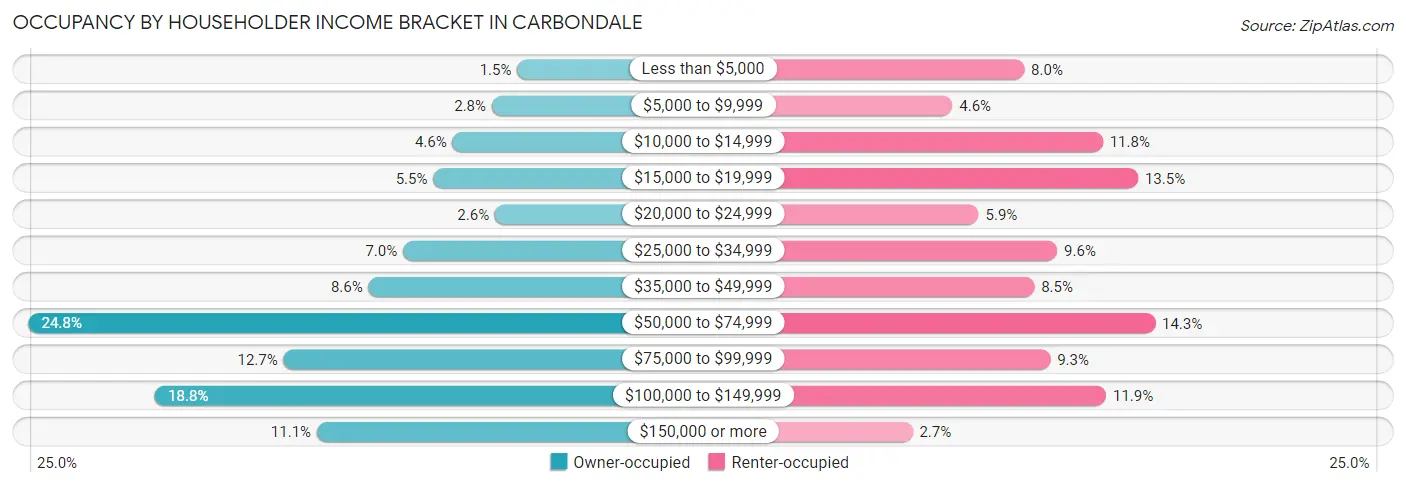
| Income Bracket | Owner-occupied | Renter-occupied |
| Less than $5,000 | 32 (1.5%) | 148 (8.0%) |
| $5,000 to $9,999 | 57 (2.8%) | 85 (4.6%) |
| $10,000 to $14,999 | 96 (4.6%) | 217 (11.8%) |
| $15,000 to $19,999 | 115 (5.5%) | 248 (13.5%) |
| $20,000 to $24,999 | 54 (2.6%) | 108 (5.9%) |
| $25,000 to $34,999 | 145 (7.0%) | 177 (9.6%) |
| $35,000 to $49,999 | 179 (8.6%) | 157 (8.5%) |
| $50,000 to $74,999 | 515 (24.8%) | 263 (14.3%) |
| $75,000 to $99,999 | 263 (12.7%) | 171 (9.3%) |
| $100,000 to $149,999 | 390 (18.8%) | 220 (11.9%) |
| $150,000 or more | 230 (11.1%) | 50 (2.7%) |
| Total | 2,076 (100.0%) | 1,844 (100.0%) |
Monthly Housing Cost Tiers in Carbondale
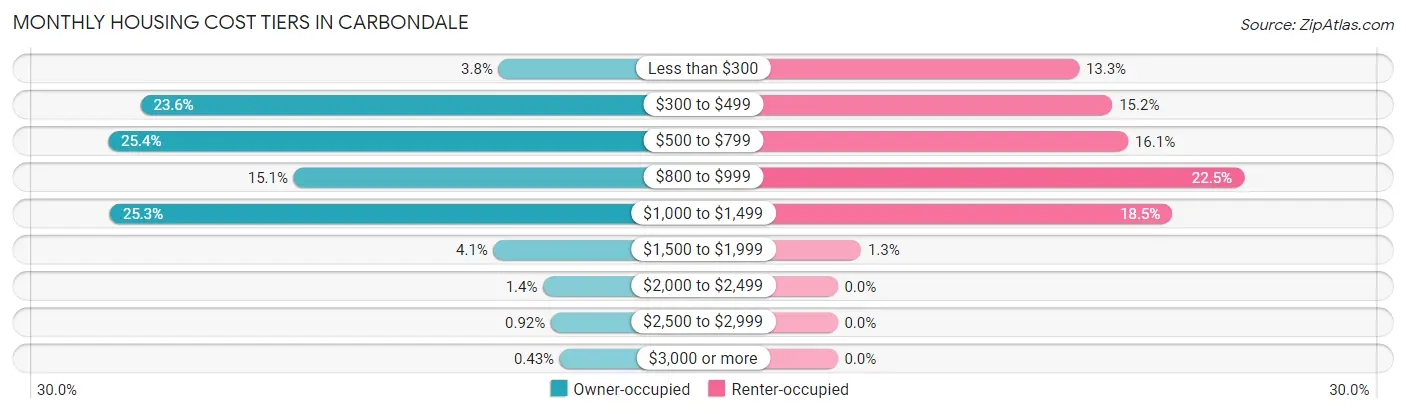
| Monthly Cost | Owner-occupied | Renter-occupied |
| Less than $300 | 79 (3.8%) | 246 (13.3%) |
| $300 to $499 | 490 (23.6%) | 280 (15.2%) |
| $500 to $799 | 527 (25.4%) | 296 (16.1%) |
| $800 to $999 | 314 (15.1%) | 414 (22.5%) |
| $1,000 to $1,499 | 525 (25.3%) | 341 (18.5%) |
| $1,500 to $1,999 | 85 (4.1%) | 24 (1.3%) |
| $2,000 to $2,499 | 28 (1.3%) | 0 (0.0%) |
| $2,500 to $2,999 | 19 (0.9%) | 0 (0.0%) |
| $3,000 or more | 9 (0.4%) | 0 (0.0%) |
| Total | 2,076 (100.0%) | 1,844 (100.0%) |
Physical Housing Characteristics in Carbondale
Housing Structures in Carbondale
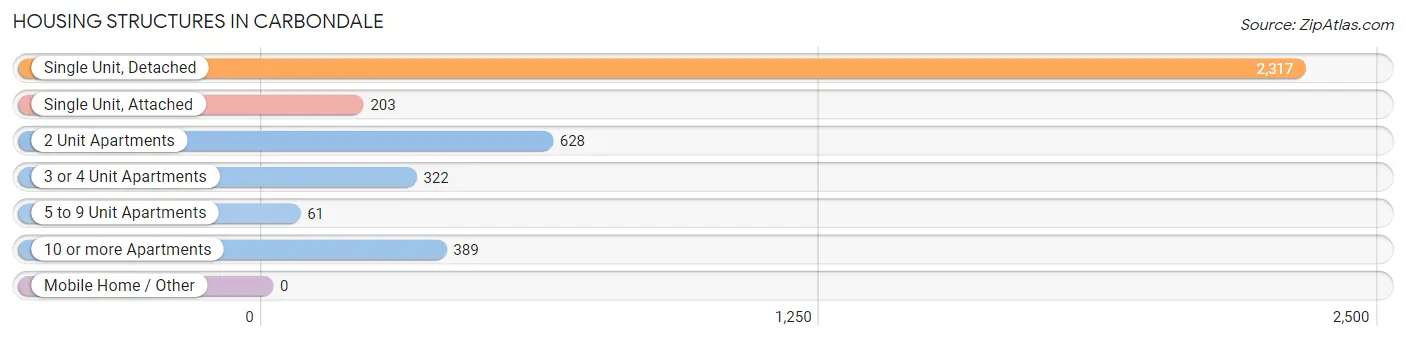
| Structure Type | # Housing Units | % Housing Units |
| Single Unit, Detached | 2,317 | 59.1% |
| Single Unit, Attached | 203 | 5.2% |
| 2 Unit Apartments | 628 | 16.0% |
| 3 or 4 Unit Apartments | 322 | 8.2% |
| 5 to 9 Unit Apartments | 61 | 1.6% |
| 10 or more Apartments | 389 | 9.9% |
| Mobile Home / Other | 0 | 0.0% |
| Total | 3,920 | 100.0% |
Housing Structures by Occupancy in Carbondale
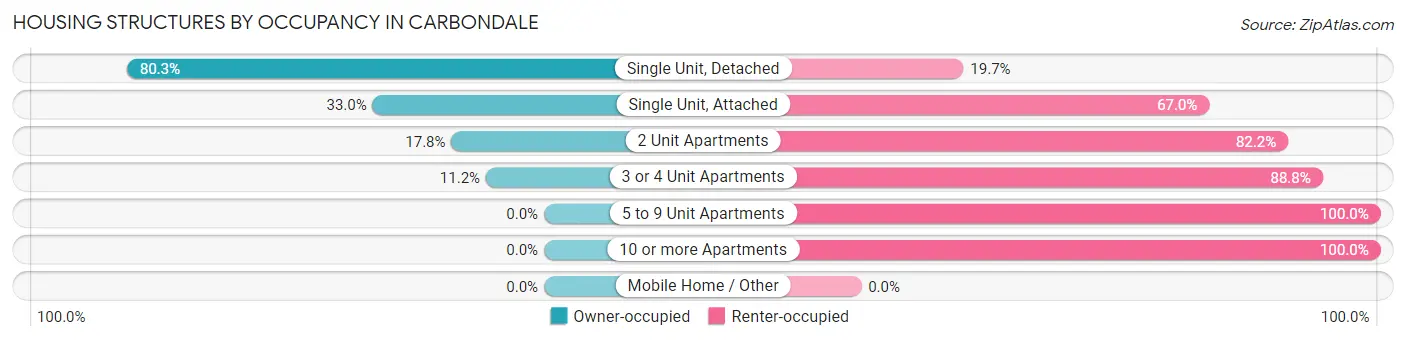
| Structure Type | Owner-occupied | Renter-occupied |
| Single Unit, Detached | 1,861 (80.3%) | 456 (19.7%) |
| Single Unit, Attached | 67 (33.0%) | 136 (67.0%) |
| 2 Unit Apartments | 112 (17.8%) | 516 (82.2%) |
| 3 or 4 Unit Apartments | 36 (11.2%) | 286 (88.8%) |
| 5 to 9 Unit Apartments | 0 (0.0%) | 61 (100.0%) |
| 10 or more Apartments | 0 (0.0%) | 389 (100.0%) |
| Mobile Home / Other | 0 (0.0%) | 0 (0.0%) |
| Total | 2,076 (53.0%) | 1,844 (47.0%) |
Housing Structures by Number of Rooms in Carbondale
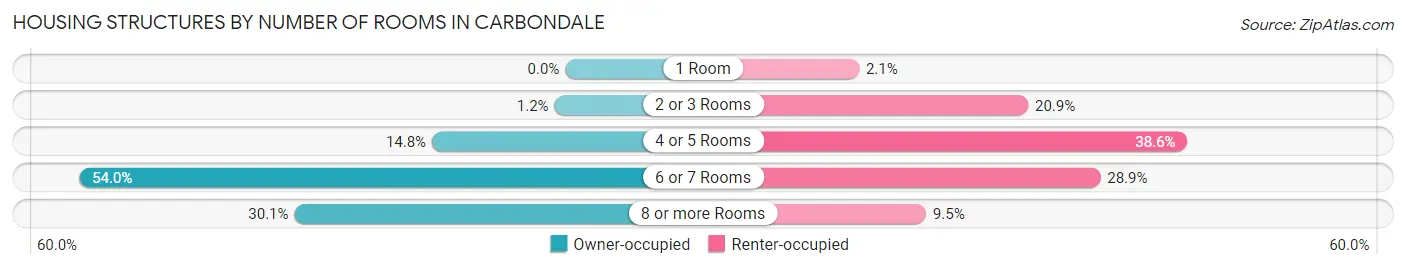
| Number of Rooms | Owner-occupied | Renter-occupied |
| 1 Room | 0 (0.0%) | 39 (2.1%) |
| 2 or 3 Rooms | 25 (1.2%) | 385 (20.9%) |
| 4 or 5 Rooms | 307 (14.8%) | 711 (38.6%) |
| 6 or 7 Rooms | 1,120 (53.9%) | 533 (28.9%) |
| 8 or more Rooms | 624 (30.1%) | 176 (9.5%) |
| Total | 2,076 (100.0%) | 1,844 (100.0%) |
Housing Structure by Heating Type in Carbondale
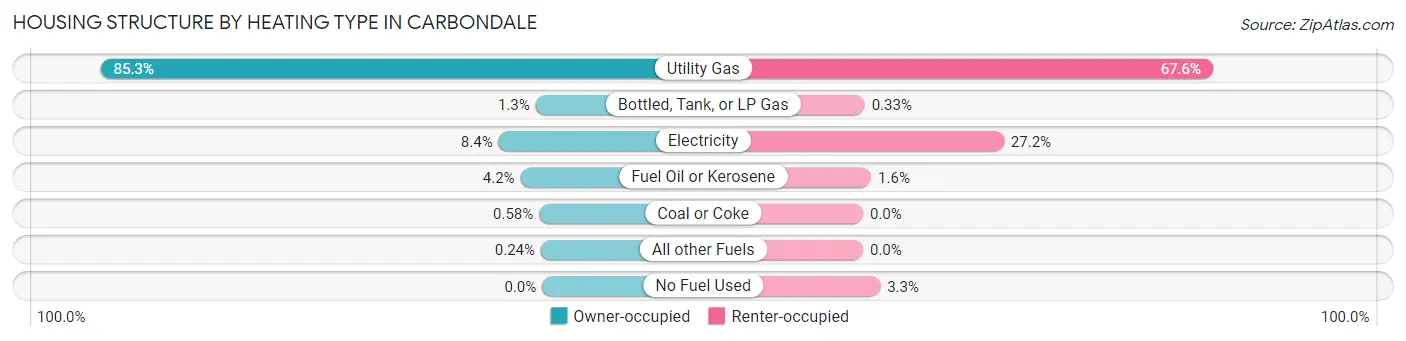
| Heating Type | Owner-occupied | Renter-occupied |
| Utility Gas | 1,771 (85.3%) | 1,246 (67.6%) |
| Bottled, Tank, or LP Gas | 26 (1.3%) | 6 (0.3%) |
| Electricity | 175 (8.4%) | 502 (27.2%) |
| Fuel Oil or Kerosene | 87 (4.2%) | 29 (1.6%) |
| Coal or Coke | 12 (0.6%) | 0 (0.0%) |
| All other Fuels | 5 (0.2%) | 0 (0.0%) |
| No Fuel Used | 0 (0.0%) | 61 (3.3%) |
| Total | 2,076 (100.0%) | 1,844 (100.0%) |
Household Vehicle Usage in Carbondale
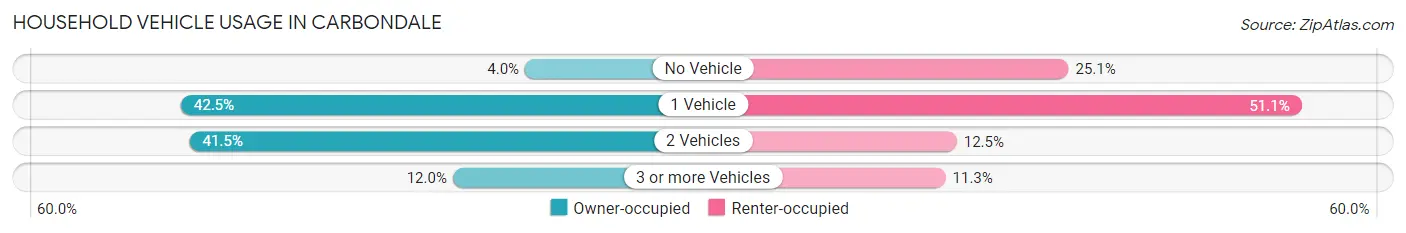
| Vehicles per Household | Owner-occupied | Renter-occupied |
| No Vehicle | 82 (4.0%) | 462 (25.1%) |
| 1 Vehicle | 882 (42.5%) | 943 (51.1%) |
| 2 Vehicles | 862 (41.5%) | 231 (12.5%) |
| 3 or more Vehicles | 250 (12.0%) | 208 (11.3%) |
| Total | 2,076 (100.0%) | 1,844 (100.0%) |
Real Estate & Mortgages in Carbondale
Real Estate and Mortgage Overview in Carbondale
| Characteristic | Without Mortgage | With Mortgage |
| Housing Units | 1,093 | 983 |
| Median Property Value | $96,500 | $124,600 |
| Median Household Income | $51,905 | $190 |
| Monthly Housing Costs | $495 | $9 |
| Real Estate Taxes | $2,316 | $29 |
Property Value by Mortgage Status in Carbondale
| Property Value | Without Mortgage | With Mortgage |
| Less than $50,000 | 109 (10.0%) | 24 (2.4%) |
| $50,000 to $99,999 | 501 (45.8%) | 256 (26.0%) |
| $100,000 to $299,999 | 447 (40.9%) | 674 (68.6%) |
| $300,000 to $499,999 | 30 (2.7%) | 20 (2.0%) |
| $500,000 to $749,999 | 0 (0.0%) | 9 (0.9%) |
| $750,000 to $999,999 | 0 (0.0%) | 0 (0.0%) |
| $1,000,000 or more | 6 (0.5%) | 0 (0.0%) |
| Total | 1,093 (100.0%) | 983 (100.0%) |
Household Income by Mortgage Status in Carbondale
| Household Income | Without Mortgage | With Mortgage |
| Less than $10,000 | 34 (3.1%) | 55 (5.6%) |
| $10,000 to $24,999 | 222 (20.3%) | 55 (5.6%) |
| $25,000 to $34,999 | 68 (6.2%) | 43 (4.4%) |
| $35,000 to $49,999 | 128 (11.7%) | 77 (7.8%) |
| $50,000 to $74,999 | 339 (31.0%) | 51 (5.2%) |
| $75,000 to $99,999 | 183 (16.7%) | 176 (17.9%) |
| $100,000 to $149,999 | 79 (7.2%) | 80 (8.1%) |
| $150,000 or more | 40 (3.7%) | 311 (31.6%) |
| Total | 1,093 (100.0%) | 983 (100.0%) |
Property Value to Household Income Ratio in Carbondale
| Value-to-Income Ratio | Without Mortgage | With Mortgage |
| Less than 2.0x | 410 (37.5%) | 100,153 (10,188.5%) |
| 2.0x to 2.9x | 213 (19.5%) | 653 (66.4%) |
| 3.0x to 3.9x | 162 (14.8%) | 117 (11.9%) |
| 4.0x or more | 304 (27.8%) | 93 (9.5%) |
| Total | 1,093 (100.0%) | 983 (100.0%) |
Real Estate Taxes by Mortgage Status in Carbondale
| Property Taxes | Without Mortgage | With Mortgage |
| Less than $800 | 92 (8.4%) | 0 (0.0%) |
| $800 to $1,499 | 152 (13.9%) | 167 (17.0%) |
| $800 to $1,499 | 780 (71.4%) | 135 (13.7%) |
| Total | 1,093 (100.0%) | 983 (100.0%) |
Health & Disability in Carbondale
Health Insurance Coverage by Age in Carbondale
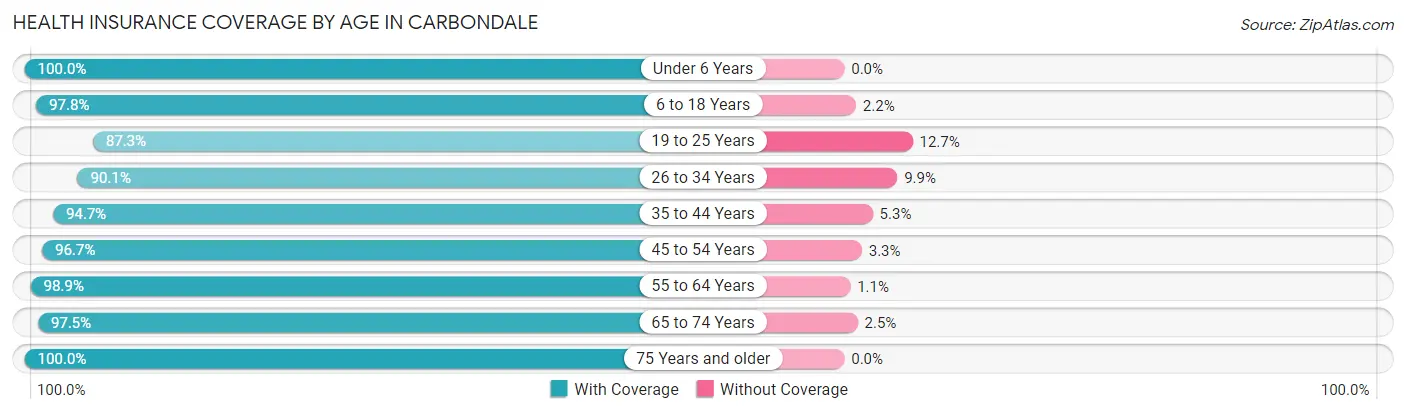
| Age Bracket | With Coverage | Without Coverage |
| Under 6 Years | 656 (100.0%) | 0 (0.0%) |
| 6 to 18 Years | 1,088 (97.8%) | 24 (2.2%) |
| 19 to 25 Years | 707 (87.3%) | 103 (12.7%) |
| 26 to 34 Years | 904 (90.1%) | 99 (9.9%) |
| 35 to 44 Years | 966 (94.7%) | 54 (5.3%) |
| 45 to 54 Years | 891 (96.7%) | 30 (3.3%) |
| 55 to 64 Years | 1,153 (98.9%) | 13 (1.1%) |
| 65 to 74 Years | 1,101 (97.5%) | 28 (2.5%) |
| 75 Years and older | 801 (100.0%) | 0 (0.0%) |
| Total | 8,267 (95.9%) | 351 (4.1%) |
Health Insurance Coverage by Citizenship Status in Carbondale
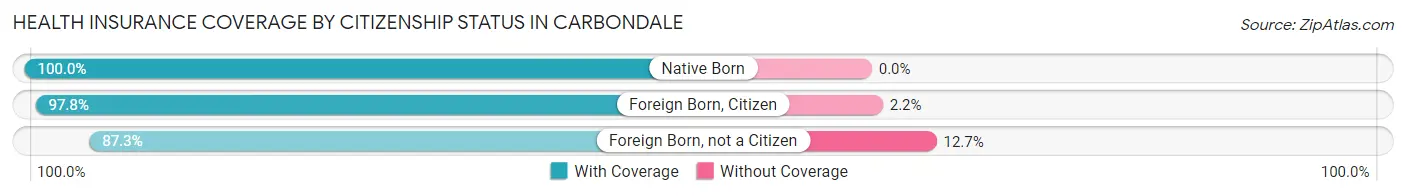
| Citizenship Status | With Coverage | Without Coverage |
| Native Born | 656 (100.0%) | 0 (0.0%) |
| Foreign Born, Citizen | 1,088 (97.8%) | 24 (2.2%) |
| Foreign Born, not a Citizen | 707 (87.3%) | 103 (12.7%) |
Health Insurance Coverage by Household Income in Carbondale
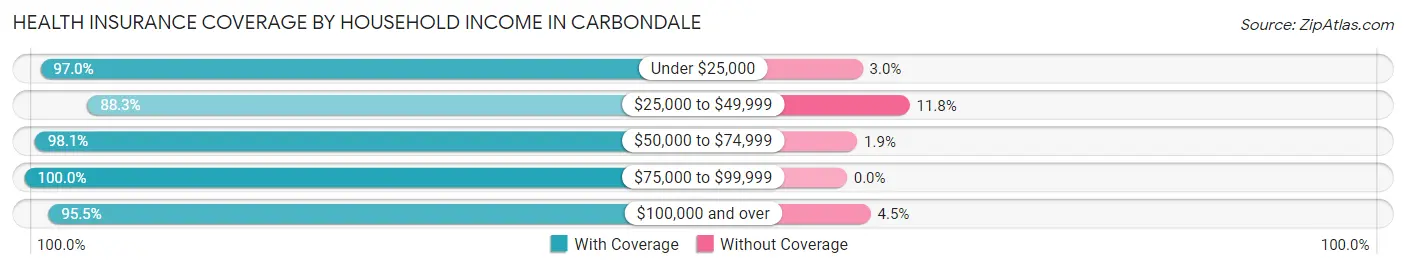
| Household Income | With Coverage | Without Coverage |
| Under $25,000 | 1,769 (97.0%) | 54 (3.0%) |
| $25,000 to $49,999 | 1,157 (88.2%) | 154 (11.7%) |
| $50,000 to $74,999 | 1,717 (98.1%) | 34 (1.9%) |
| $75,000 to $99,999 | 1,249 (100.0%) | 0 (0.0%) |
| $100,000 and over | 2,333 (95.5%) | 109 (4.5%) |
Public vs Private Health Insurance Coverage by Age in Carbondale
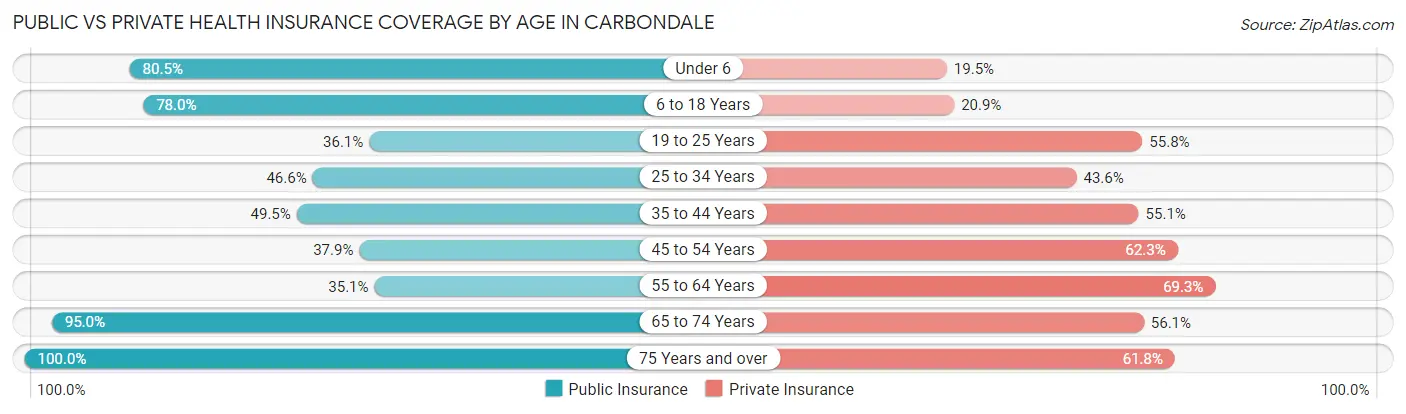
| Age Bracket | Public Insurance | Private Insurance |
| Under 6 | 528 (80.5%) | 128 (19.5%) |
| 6 to 18 Years | 867 (78.0%) | 232 (20.9%) |
| 19 to 25 Years | 292 (36.0%) | 452 (55.8%) |
| 25 to 34 Years | 467 (46.6%) | 437 (43.6%) |
| 35 to 44 Years | 505 (49.5%) | 562 (55.1%) |
| 45 to 54 Years | 349 (37.9%) | 574 (62.3%) |
| 55 to 64 Years | 409 (35.1%) | 808 (69.3%) |
| 65 to 74 Years | 1,072 (95.0%) | 633 (56.1%) |
| 75 Years and over | 801 (100.0%) | 495 (61.8%) |
| Total | 5,290 (61.4%) | 4,321 (50.1%) |
Disability Status by Sex by Age in Carbondale
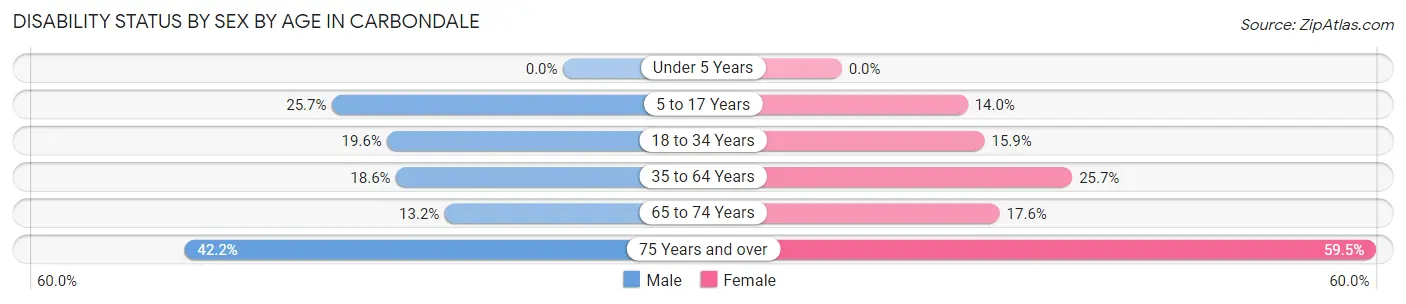
| Age Bracket | Male | Female |
| Under 5 Years | 0 (0.0%) | 0 (0.0%) |
| 5 to 17 Years | 186 (25.7%) | 60 (14.0%) |
| 18 to 34 Years | 180 (19.6%) | 149 (15.9%) |
| 35 to 64 Years | 290 (18.6%) | 397 (25.7%) |
| 65 to 74 Years | 67 (13.2%) | 109 (17.6%) |
| 75 Years and over | 138 (42.2%) | 282 (59.5%) |
Disability Class by Sex by Age in Carbondale
Disability Class: Hearing Difficulty
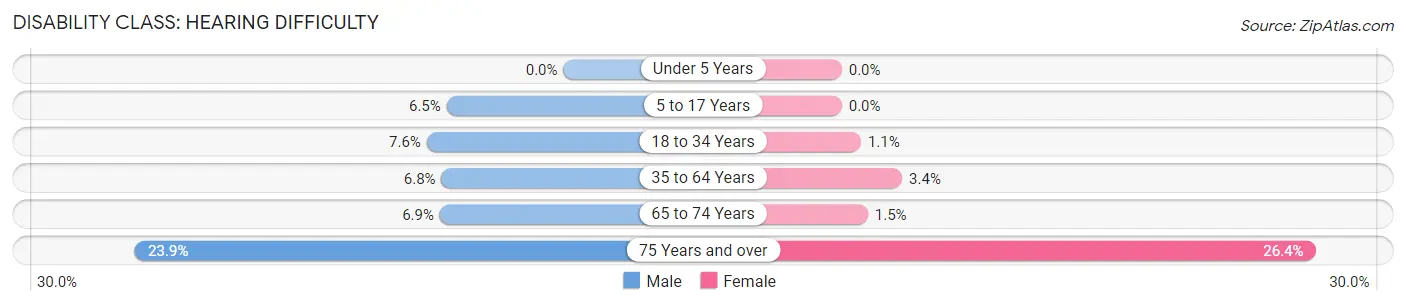
| Age Bracket | Male | Female |
| Under 5 Years | 0 (0.0%) | 0 (0.0%) |
| 5 to 17 Years | 47 (6.5%) | 0 (0.0%) |
| 18 to 34 Years | 70 (7.6%) | 10 (1.1%) |
| 35 to 64 Years | 106 (6.8%) | 52 (3.4%) |
| 65 to 74 Years | 35 (6.9%) | 9 (1.5%) |
| 75 Years and over | 78 (23.8%) | 125 (26.4%) |
Disability Class: Vision Difficulty
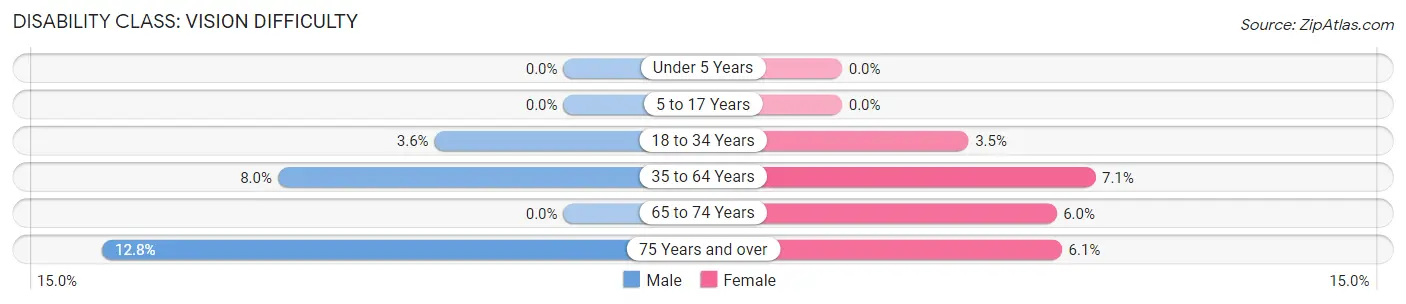
| Age Bracket | Male | Female |
| Under 5 Years | 0 (0.0%) | 0 (0.0%) |
| 5 to 17 Years | 0 (0.0%) | 0 (0.0%) |
| 18 to 34 Years | 33 (3.6%) | 33 (3.5%) |
| 35 to 64 Years | 124 (8.0%) | 109 (7.0%) |
| 65 to 74 Years | 0 (0.0%) | 37 (6.0%) |
| 75 Years and over | 42 (12.8%) | 29 (6.1%) |
Disability Class: Cognitive Difficulty
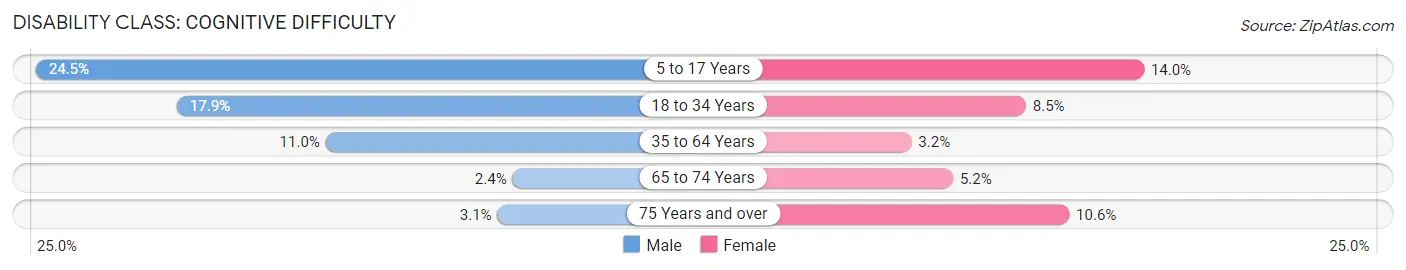
| Age Bracket | Male | Female |
| 5 to 17 Years | 177 (24.5%) | 60 (14.0%) |
| 18 to 34 Years | 165 (17.9%) | 80 (8.5%) |
| 35 to 64 Years | 172 (11.0%) | 50 (3.2%) |
| 65 to 74 Years | 12 (2.4%) | 32 (5.2%) |
| 75 Years and over | 10 (3.1%) | 50 (10.5%) |
Disability Class: Ambulatory Difficulty
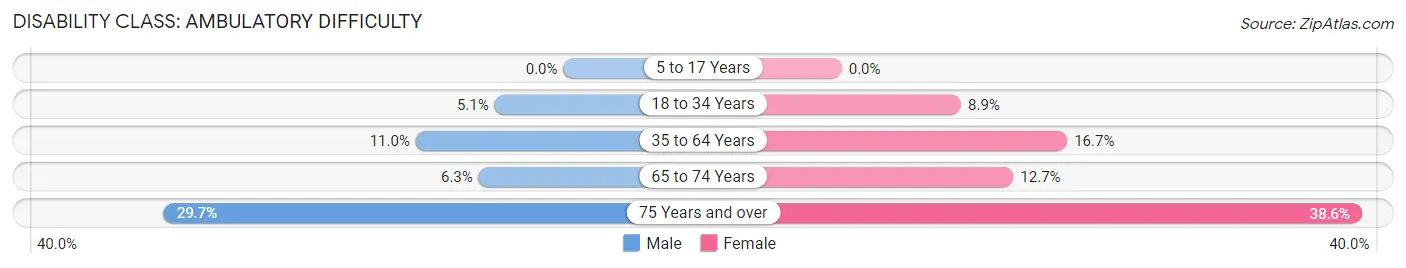
| Age Bracket | Male | Female |
| 5 to 17 Years | 0 (0.0%) | 0 (0.0%) |
| 18 to 34 Years | 47 (5.1%) | 83 (8.9%) |
| 35 to 64 Years | 171 (11.0%) | 259 (16.7%) |
| 65 to 74 Years | 32 (6.3%) | 79 (12.7%) |
| 75 Years and over | 97 (29.7%) | 183 (38.6%) |
Disability Class: Self-Care Difficulty
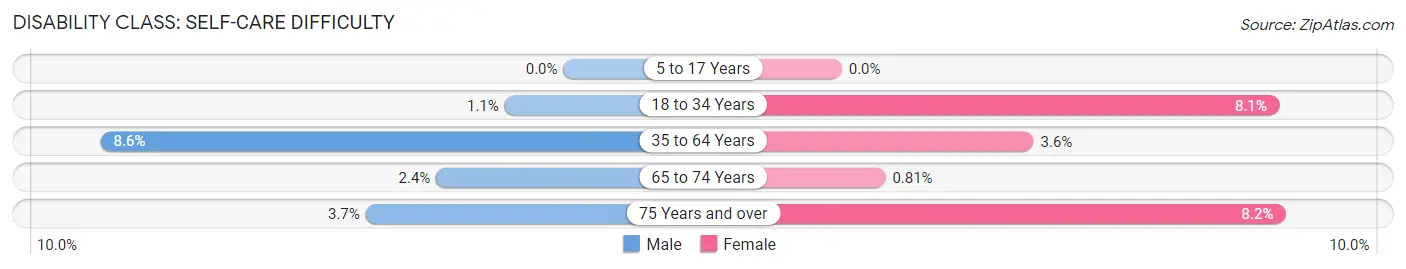
| Age Bracket | Male | Female |
| 5 to 17 Years | 0 (0.0%) | 0 (0.0%) |
| 18 to 34 Years | 10 (1.1%) | 76 (8.1%) |
| 35 to 64 Years | 134 (8.6%) | 55 (3.6%) |
| 65 to 74 Years | 12 (2.4%) | 5 (0.8%) |
| 75 Years and over | 12 (3.7%) | 39 (8.2%) |
Technology Access in Carbondale
Computing Device Access in Carbondale
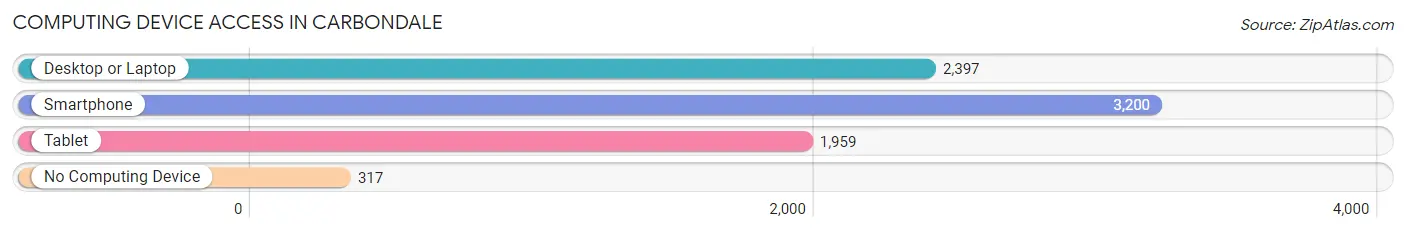
| Device Type | # Households | % Households |
| Desktop or Laptop | 2,397 | 61.2% |
| Smartphone | 3,200 | 81.6% |
| Tablet | 1,959 | 50.0% |
| No Computing Device | 317 | 8.1% |
| Total | 3,920 | 100.0% |
Internet Access in Carbondale
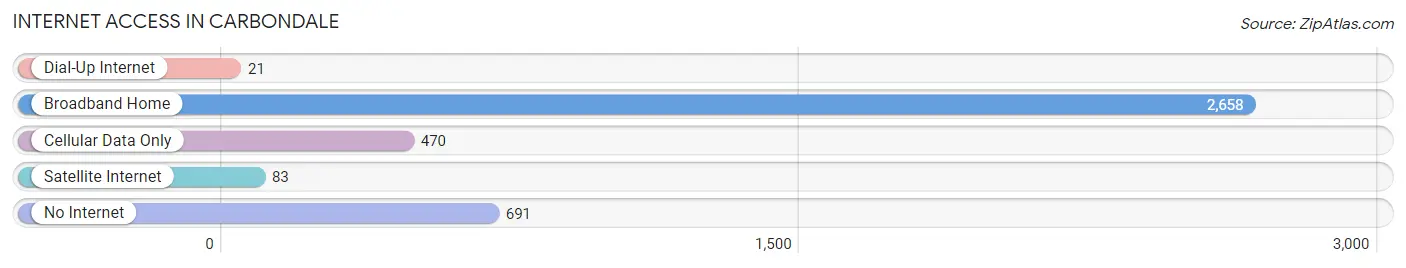
| Internet Type | # Households | % Households |
| Dial-Up Internet | 21 | 0.5% |
| Broadband Home | 2,658 | 67.8% |
| Cellular Data Only | 470 | 12.0% |
| Satellite Internet | 83 | 2.1% |
| No Internet | 691 | 17.6% |
| Total | 3,920 | 100.0% |
Carbondale Summary
Carbondale is a city located in Lackawanna County, Pennsylvania, United States. It is the county seat of Lackawanna County and is located in the heart of the Pocono Mountains. The city is situated in the foothills of the Pocono Mountains and is surrounded by rolling hills and lush forests. The city is located approximately 30 miles northeast of Scranton and is part of the Scranton–Wilkes-Barre–Hazleton Metropolitan Statistical Area. As of the 2010 census, the city had a total population of 8,891.
History
Carbondale was founded in 1824 by a group of settlers from Carbondale, New York. The settlers were attracted to the area by the abundance of coal and timber in the region. The city was originally known as Slocum Hollow, but the name was changed to Carbondale in 1828. The city was incorporated in 1851 and was designated as the county seat of Lackawanna County in 1878.
Carbondale was an important center of the coal mining industry in the late 19th and early 20th centuries. The city was home to several large coal mining companies, including the Carbondale Coal Company, the Lackawanna Coal Company, and the Delaware and Hudson Coal Company. The city was also home to several large manufacturing companies, including the Carbondale Iron Works and the Carbondale Glass Works.
Geography
Carbondale is located at 41°30'N 75°30'W (41.50, -75.50). According to the United States Census Bureau, the city has a total area of 4.2 square miles (10.8 km2), all of it land.
Carbondale is located in the foothills of the Pocono Mountains and is surrounded by rolling hills and lush forests. The city is located approximately 30 miles northeast of Scranton and is part of the Scranton–Wilkes-Barre–Hazleton Metropolitan Statistical Area.
Economy
Carbondale is a small city with a diverse economy. The city is home to several large manufacturing companies, including the Carbondale Iron Works and the Carbondale Glass Works. The city is also home to several small businesses, including restaurants, retail stores, and professional services.
The city is also home to several large coal mining companies, including the Carbondale Coal Company, the Lackawanna Coal Company, and the Delaware and Hudson Coal Company. The city is also home to several small coal mining companies, including the Carbondale Coal Company, the Lackawanna Coal Company, and the Delaware and Hudson Coal Company.
Demographics
As of the 2010 census, the city had a total population of 8,891. The racial makeup of the city was 94.2% White, 2.7% African American, 0.2% Native American, 0.7% Asian, 0.1% Pacific Islander, 0.7% from other races, and 1.5% from two or more races. Hispanic or Latino of any race were 2.7% of the population.
The median income for a household in the city was $37,917, and the median income for a family was $45,917. The per capita income for the city was $19,917. About 11.2% of families and 14.2% of the population were below the poverty line, including 22.2% of those under age 18 and 8.2% of those age 65 or over.
Carbondale is a small city with a diverse population and a vibrant economy. The city is home to several large manufacturing companies, coal mining companies, and small businesses. The city is also home to a diverse population, with a median income that is slightly below the national average.
Common Questions
What is Per Capita Income in Carbondale?
Per Capita income in Carbondale is $31,093.
What is the Median Family Income in Carbondale?
Median Family Income in Carbondale is $66,484.
What is the Median Household income in Carbondale?
Median Household Income in Carbondale is $52,681.
What is Income or Wage Gap in Carbondale?
Income or Wage Gap in Carbondale is 35.2%.
Women in Carbondale earn 64.8 cents for every dollar earned by a man.
What is Family Income Deficit in Carbondale?
Family Income Deficit in Carbondale is $11,244.
Families that are below poverty line in Carbondale earn $11,244 less on average than the poverty threshold level.
What is Inequality or Gini Index in Carbondale?
Inequality or Gini Index in Carbondale is 0.48.
What is the Total Population of Carbondale?
Total Population of Carbondale is 8,818.
What is the Total Male Population of Carbondale?
Total Male Population of Carbondale is 4,387.
What is the Total Female Population of Carbondale?
Total Female Population of Carbondale is 4,431.
What is the Ratio of Males per 100 Females in Carbondale?
There are 99.01 Males per 100 Females in Carbondale.
What is the Ratio of Females per 100 Males in Carbondale?
There are 101.00 Females per 100 Males in Carbondale.
What is the Median Population Age in Carbondale?
Median Population Age in Carbondale is 42.6 Years.
What is the Average Family Size in Carbondale
Average Family Size in Carbondale is 2.8 People.
What is the Average Household Size in Carbondale
Average Household Size in Carbondale is 2.2 People.
How Large is the Labor Force in Carbondale?
There are 3,841 People in the Labor Forcein in Carbondale.
What is the Percentage of People in the Labor Force in Carbondale?
53.2% of People are in the Labor Force in Carbondale.
What is the Unemployment Rate in Carbondale?
Unemployment Rate in Carbondale is 6.5%.