Zip Codes with the Highest Percentage of Population with a Degree in Liberal Arts and History in Eugene, OR
RELATED REPORTS & OPTIONS
Liberal Arts and History
Eugene
Compare Zip Codes
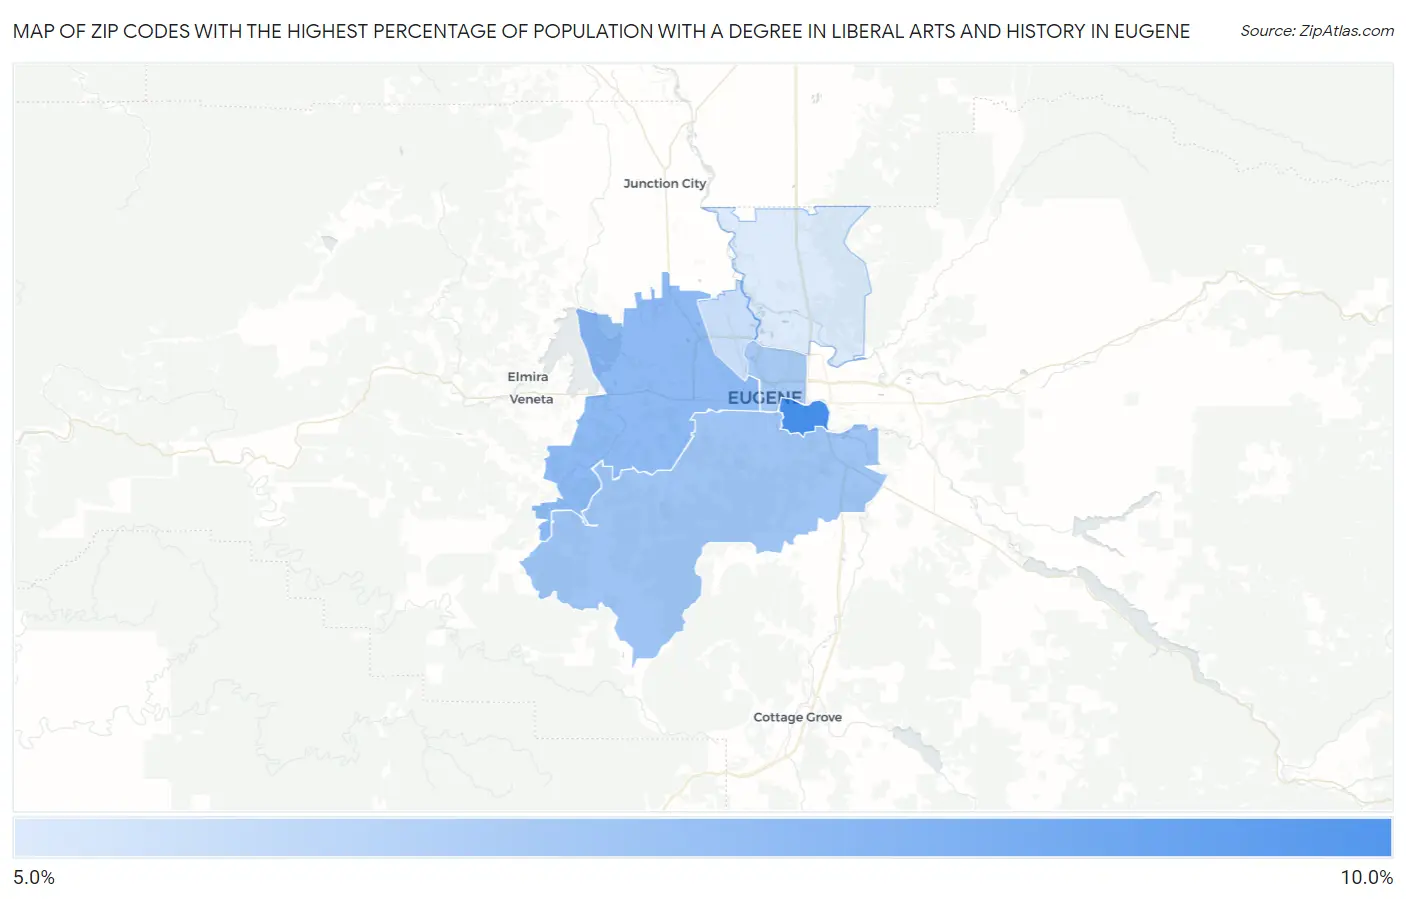
Map of Zip Codes with the Highest Percentage of Population with a Degree in Liberal Arts and History in Eugene
5.3%
8.1%
Zip Codes with the Highest Percentage of Population with a Degree in Liberal Arts and History in Eugene, OR
| Zip Code | % Graduates | vs State | vs National | |
| 1. | 97403 | 8.1% | 6.1%(+2.06)#107 | 4.9%(+3.26)#4,742 |
| 2. | 97402 | 6.8% | 6.1%(+0.673)#150 | 4.9%(+1.88)#6,827 |
| 3. | 97405 | 6.4% | 6.1%(+0.355)#162 | 4.9%(+1.56)#7,498 |
| 4. | 97401 | 6.3% | 6.1%(+0.204)#169 | 4.9%(+1.41)#7,837 |
| 5. | 97404 | 5.6% | 6.1%(-0.429)#196 | 4.9%(+0.777)#9,436 |
| 6. | 97408 | 5.3% | 6.1%(-0.815)#219 | 4.9%(+0.391)#10,542 |
1
Common Questions
What are the Top 5 Zip Codes with the Highest Percentage of Population with a Degree in Liberal Arts and History in Eugene, OR?
Top 5 Zip Codes with the Highest Percentage of Population with a Degree in Liberal Arts and History in Eugene, OR are:
What zip code has the Highest Percentage of Population with a Degree in Liberal Arts and History in Eugene, OR?
97403 has the Highest Percentage of Population with a Degree in Liberal Arts and History in Eugene, OR with 8.1%.
What is the Percentage of Population with a Degree in Liberal Arts and History in Eugene, OR?
Percentage of Population with a Degree in Liberal Arts and History in Eugene is 6.4%.
What is the Percentage of Population with a Degree in Liberal Arts and History in Oregon?
Percentage of Population with a Degree in Liberal Arts and History in Oregon is 6.1%.
What is the Percentage of Population with a Degree in Liberal Arts and History in the United States?
Percentage of Population with a Degree in Liberal Arts and History in the United States is 4.9%.