Zip Codes with the Highest Percentage of Self-Employed / Incorporated in Oklahoma City, OK

RELATED REPORTS & OPTIONS

Self-Employed / Incorporated
Population
Families and Households
Female Fertility
Female Fertility (Unmarried)
Race (Community Size)
Race (Percentage)
Ancestry (Community Size)
AfricanAlaska NativeAlbanianAmericanApacheArabArapahoArgentineanArmenianAustralianAustrianBahamianBangladeshiBarbadianBasqueBelgianBhutaneseBlackfeetBolivianBrazilianBritishBritish West IndianBulgarianBurmeseCajunCambodianCanadianCelticCentral AmericanCentral American IndianCherokeeCheyenneChickasawChileanChippewaChoctawColombianComancheCreeCreekCroatianCubanCzechCzechoslovakianDanishDelawareDominicanDutchDutch West IndianEastern EuropeanEcuadorianEgyptianEnglishEstonianEthiopianEuropeanFijianFilipinoFinnishFrenchFrench American IndianFrench CanadianGermanGerman RussianGhanaianGreekGuamanian / ChamorroGuatemalanGuyaneseHaitianHonduranHopiHungarianIcelanderIndian (Asian)IndonesianInupiatIranianIraqiIrishIroquoisIsraeliItalianJamaicanJapaneseJordanianKenyanKiowaKoreanLaotianLatvianLebaneseLiberianLithuanianLuxembourgerMalaysianMexicanMexican American IndianMongolianMoroccanNative HawaiianNavajoNew ZealanderNicaraguanNigerianNorthern EuropeanNorwegianOkinawanOsagePakistaniPalestinianPanamanianPennsylvania GermanPeruvianPimaPolishPortuguesePotawatomiPuebloPuerto RicanRomanianRussianSalvadoranSamoanScandinavianScotch-IrishScottishSeminoleSerbianSiouxSlavicSlovakSloveneSouth AfricanSouth AmericanSouth American IndianSpaniardSpanishSpanish American IndianSri LankanSubsaharan AfricanSudaneseSwedishSwissSyrianThaiTlingit-HaidaTonganTrinidadian and TobagonianTurkishU.S. Virgin IslanderUkrainianUruguayanVenezuelanVietnameseWelshWest IndianYugoslavianZimbabwean
Ancestry (Percentage)
AfricanAlaska NativeAlbanianAmericanApacheArabArapahoArgentineanArmenianAustralianAustrianBahamianBangladeshiBarbadianBasqueBelgianBhutaneseBlackfeetBolivianBrazilianBritishBritish West IndianBulgarianBurmeseCajunCambodianCanadianCelticCentral AmericanCentral American IndianCherokeeCheyenneChickasawChileanChippewaChoctawColombianComancheCreeCreekCroatianCubanCzechCzechoslovakianDanishDelawareDominicanDutchDutch West IndianEastern EuropeanEcuadorianEgyptianEnglishEstonianEthiopianEuropeanFijianFilipinoFinnishFrenchFrench American IndianFrench CanadianGermanGerman RussianGhanaianGreekGuamanian / ChamorroGuatemalanGuyaneseHaitianHonduranHopiHungarianIcelanderIndian (Asian)IndonesianInupiatIranianIraqiIrishIroquoisIsraeliItalianJamaicanJapaneseJordanianKenyanKiowaKoreanLaotianLatvianLebaneseLiberianLithuanianLuxembourgerMalaysianMexicanMexican American IndianMongolianMoroccanNative HawaiianNavajoNew ZealanderNicaraguanNigerianNorthern EuropeanNorwegianOkinawanOsagePakistaniPalestinianPanamanianPennsylvania GermanPeruvianPimaPolishPortuguesePotawatomiPuebloPuerto RicanRomanianRussianSalvadoranSamoanScandinavianScotch-IrishScottishSeminoleSerbianSiouxSlavicSlovakSloveneSouth AfricanSouth AmericanSouth American IndianSpaniardSpanishSpanish American IndianSri LankanSubsaharan AfricanSudaneseSwedishSwissSyrianThaiTlingit-HaidaTonganTrinidadian and TobagonianTurkishU.S. Virgin IslanderUkrainianUruguayanVenezuelanVietnameseWelshWest IndianYugoslavianZimbabwean
Immigrant Origin (Total)
AfricaArgentinaAsiaAustraliaAustriaBahamasBangladeshBosnia and HerzegovinaBrazilBulgariaBurma / MyanmarCambodiaCameroonCanadaCaribbeanCentral AmericaChileChinaColombiaCubaDominican RepublicEastern AfricaEastern AsiaEastern EuropeEcuadorEgyptEl SalvadorEnglandEritreaEthiopiaEuropeFranceGermanyGhanaGreeceGuatemalaHondurasHong KongIndiaIndonesiaIranIraqIrelandItalyJamaicaJapanJordanKazakhstanKenyaKoreaKuwaitLaosLatin AmericaLebanonLiberiaMalaysiaMexicoMiddle AfricaMoroccoNepalNetherlandsNicaraguaNigeriaNorthern AfricaNorthern EuropeNorwayOceaniaPakistanPanamaPeruPhilippinesPolandPortugalRussiaSaudi ArabiaScotlandSingaporeSouth AfricaSouth AmericaSouth Central AsiaSouth Eastern AsiaSouthern EuropeSpainSudanSyriaTaiwanThailandTrinidad and TobagoTurkeyUkraineVenezuelaVietnamWestern AfricaWestern AsiaWestern EuropeZaireZimbabwe
Immigrant Origin (Percentage)
AfricaArgentinaAsiaAustraliaAustriaBahamasBangladeshBosnia and HerzegovinaBrazilBulgariaBurma / MyanmarCambodiaCameroonCanadaCaribbeanCentral AmericaChileChinaColombiaCubaDominican RepublicEastern AfricaEastern AsiaEastern EuropeEcuadorEgyptEl SalvadorEnglandEritreaEthiopiaEuropeFranceGermanyGhanaGreeceGuatemalaHondurasHong KongIndiaIndonesiaIranIraqIrelandItalyJamaicaJapanJordanKazakhstanKenyaKoreaKuwaitLaosLatin AmericaLebanonLiberiaMalaysiaMexicoMiddle AfricaMoroccoNepalNetherlandsNicaraguaNigeriaNorthern AfricaNorthern EuropeNorwayOceaniaPakistanPanamaPeruPhilippinesPolandPortugalRussiaSaudi ArabiaScotlandSingaporeSouth AfricaSouth AmericaSouth Central AsiaSouth Eastern AsiaSouthern EuropeSpainSudanSyriaTaiwanThailandTrinidad and TobagoTurkeyUkraineVenezuelaVietnamWestern AfricaWestern AsiaWestern EuropeZaireZimbabwe
Income
Income (Families)
Income (Households)
Poverty
Poverty (Families)
Unemployment
Employment Occupations
Employment Industries
Employer Class
Commute Time
Commute Means
School Enrollment
Education by Degree Field
Occupancy
Finances
Physical Characteristics
Oklahoma City
Compare Zip Codes
Comparison Subject

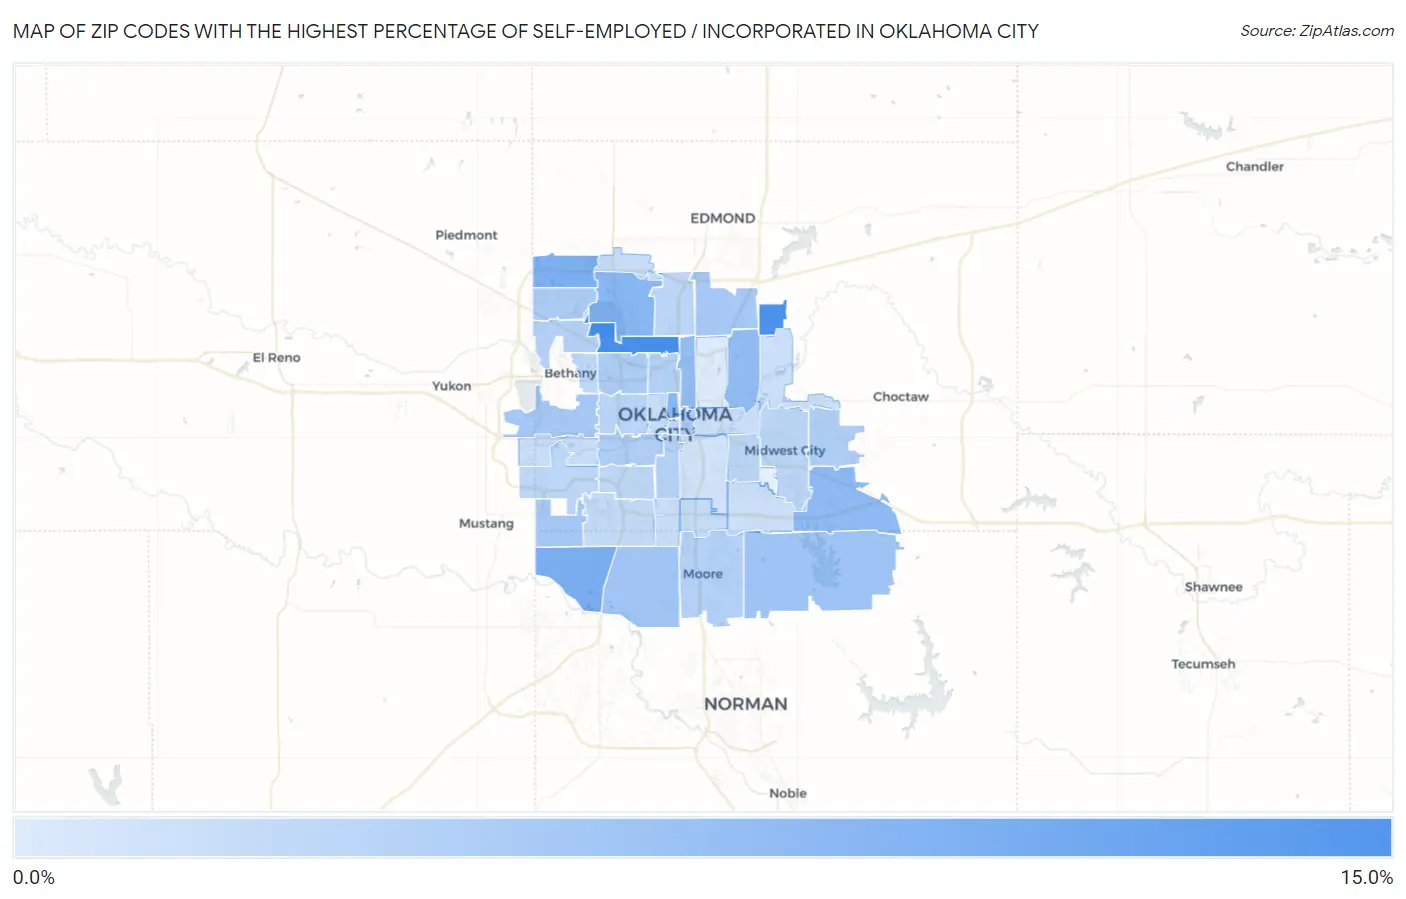
Map of Zip Codes with the Highest Percentage of Self-Employed / Incorporated in Oklahoma City

0.0%
15.0%
Zip Codes with the Highest Percentage of Self-Employed / Incorporated in Oklahoma City Map

Zip Codes with the Highest Percentage of Self-Employed / Incorporated in Oklahoma City, OK

Zip Code % Self-Employed / Incorporated vs State vs National
1.7311611.8%3.7%(+8.10)#193.8%(+7.95)#1,619
2.7315111.5%3.7%(+7.82)#223.8%(+7.67)#1,725
3.731737.7%3.7%(+4.02)#523.8%(+3.88)#3,968
4.731427.6%3.7%(+3.89)#573.8%(+3.74)#4,106
5.731206.7%3.7%(+3.07)#733.8%(+2.92)#5,132
6.731036.7%3.7%(+2.98)#793.8%(+2.83)#5,270
7.731506.2%3.7%(+2.57)#893.8%(+2.42)#5,912
8.731216.0%3.7%(+2.33)#943.8%(+2.18)#6,339
9.731055.8%3.7%(+2.16)#983.8%(+2.01)#6,657
10.731654.9%3.7%(+1.24)#1473.8%(+1.09)#8,845
11.731704.8%3.7%(+1.12)#1533.8%(+0.975)#9,206
12.731274.4%3.7%(+0.749)#1843.8%(+0.599)#10,383
13.731314.4%3.7%(+0.704)#1873.8%(+0.554)#10,539
14.731694.4%3.7%(+0.686)#1893.8%(+0.536)#10,608
15.731044.0%3.7%(+0.329)#2173.8%(+0.179)#11,938
16.731623.8%3.7%(+0.154)#2283.8%(+0.004)#12,672
17.731123.8%3.7%(+0.142)#2293.8%(-0.008)#12,718
18.731083.7%3.7%(+0.007)#2403.8%(-0.143)#13,294
19.731303.5%3.7%(-0.203)#2643.8%(-0.353)#14,198
20.731603.4%3.7%(-0.293)#2743.8%(-0.443)#14,623
21.731183.3%3.7%(-0.375)#2823.8%(-0.525)#14,992
22.731093.2%3.7%(-0.490)#2913.8%(-0.639)#15,509
23.731323.1%3.7%(-0.542)#2983.8%(-0.692)#15,749
24.731072.8%3.7%(-0.850)#3323.8%(-1.000)#17,294
25.731792.7%3.7%(-0.945)#3423.8%(-1.09)#17,751
26.731152.7%3.7%(-0.979)#3463.8%(-1.13)#17,944
27.731142.7%3.7%(-1.01)#3513.8%(-1.16)#18,118
28.731102.6%3.7%(-1.07)#3583.8%(-1.22)#18,433
29.731222.6%3.7%(-1.10)#3603.8%(-1.25)#18,572
30.731192.5%3.7%(-1.17)#3673.8%(-1.32)#18,922
31.731022.3%3.7%(-1.34)#3873.8%(-1.49)#19,701
32.731592.1%3.7%(-1.57)#4193.8%(-1.72)#20,880
33.731492.0%3.7%(-1.65)#4283.8%(-1.80)#21,316
34.731061.8%3.7%(-1.83)#4393.8%(-1.98)#22,109
35.731341.8%3.7%(-1.84)#4403.8%(-1.99)#22,150
36.731281.8%3.7%(-1.87)#4463.8%(-2.02)#22,304
37.731391.7%3.7%(-2.01)#4563.8%(-2.16)#22,847
38.731171.6%3.7%(-2.06)#4643.8%(-2.21)#23,075
39.731351.5%3.7%(-2.19)#4723.8%(-2.34)#23,566
40.731411.4%3.7%(-2.26)#4793.8%(-2.41)#23,825
41.731291.2%3.7%(-2.47)#4973.8%(-2.62)#24,660
42.731110.31%3.7%(-3.35)#5483.8%(-3.50)#26,777

Common Questions

What are the Top 10 Zip Codes with the Highest Percentage of Self-Employed / Incorporated in Oklahoma City, OK?
Top 10 Zip Codes with the Highest Percentage of Self-Employed / Incorporated in Oklahoma City, OK are:
#1
11.8%
#2
11.5%
#3
7.7%
#4
7.6%
#5
6.7%
#6
6.7%
#7
6.2%
#8
6.0%
#9
5.8%
#10
4.9%
What zip code has the Highest Percentage of Self-Employed / Incorporated in Oklahoma City, OK?
73116 has the Highest Percentage of Self-Employed / Incorporated in Oklahoma City, OK with 11.8%.
What is the Percentage of Self-Employed / Incorporated in Oklahoma City, OK?
Percentage of Self-Employed / Incorporated in Oklahoma City is 4.0%.
What is the Percentage of Self-Employed / Incorporated in Oklahoma?
Percentage of Self-Employed / Incorporated in Oklahoma is 3.7%.
What is the Percentage of Self-Employed / Incorporated in the United States?
Percentage of Self-Employed / Incorporated in the United States is 3.8%.