Zip Codes with the Highest Percentage of Population Employed in Installation, Maintenance & Repair in Muskogee, OK
RELATED REPORTS & OPTIONS
Installation, Maintenance & Repair
Muskogee
Compare Zip Codes
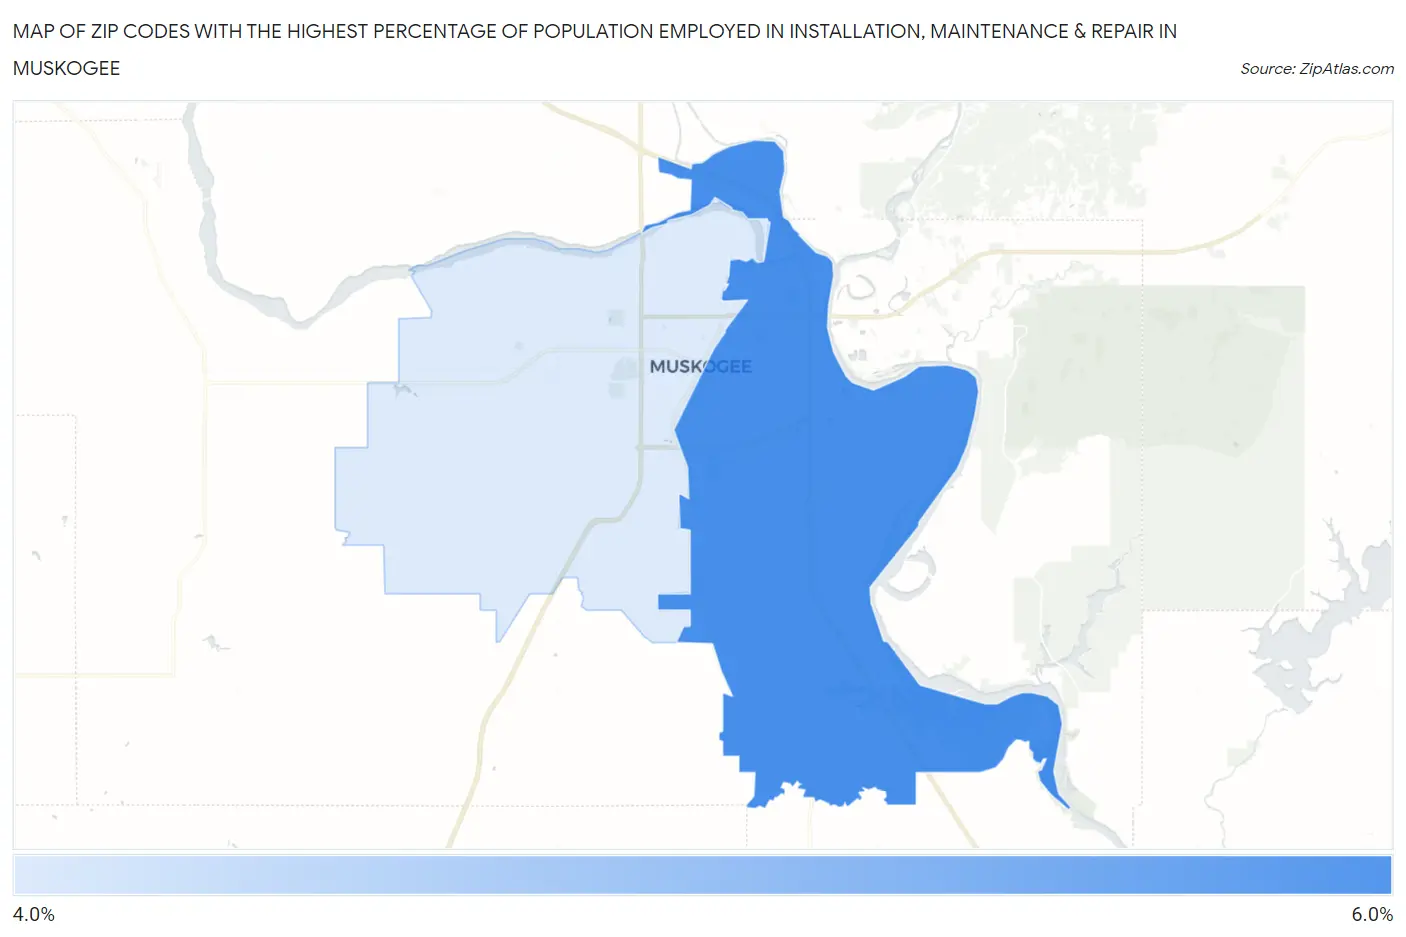
Map of Zip Codes with the Highest Percentage of Population Employed in Installation, Maintenance & Repair in Muskogee
4.1%
5.7%
Zip Codes with the Highest Percentage of Population Employed in Installation, Maintenance & Repair in Muskogee, OK
| Zip Code | % Employed | vs State | vs National | |
| 1. | 74403 | 5.7% | 4.2%(+1.49)#197 | 3.1%(+2.59)#6,867 |
| 2. | 74401 | 4.1% | 4.2%(-0.103)#342 | 3.1%(+0.998)#12,068 |
1
Common Questions
What are the Top Zip Codes with the Highest Percentage of Population Employed in Installation, Maintenance & Repair in Muskogee, OK?
Top Zip Codes with the Highest Percentage of Population Employed in Installation, Maintenance & Repair in Muskogee, OK are:
What zip code has the Highest Percentage of Population Employed in Installation, Maintenance & Repair in Muskogee, OK?
74403 has the Highest Percentage of Population Employed in Installation, Maintenance & Repair in Muskogee, OK with 5.7%.
What is the Percentage of Population Employed in Installation, Maintenance & Repair in Muskogee, OK?
Percentage of Population Employed in Installation, Maintenance & Repair in Muskogee is 4.7%.
What is the Percentage of Population Employed in Installation, Maintenance & Repair in Oklahoma?
Percentage of Population Employed in Installation, Maintenance & Repair in Oklahoma is 4.2%.
What is the Percentage of Population Employed in Installation, Maintenance & Repair in the United States?
Percentage of Population Employed in Installation, Maintenance & Repair in the United States is 3.1%.