Zip Codes with the Highest Percentage of Population Employed in Administrative & Support Services in Lima, OH
RELATED REPORTS & OPTIONS
Administrative & Support Services
Lima
Compare Zip Codes
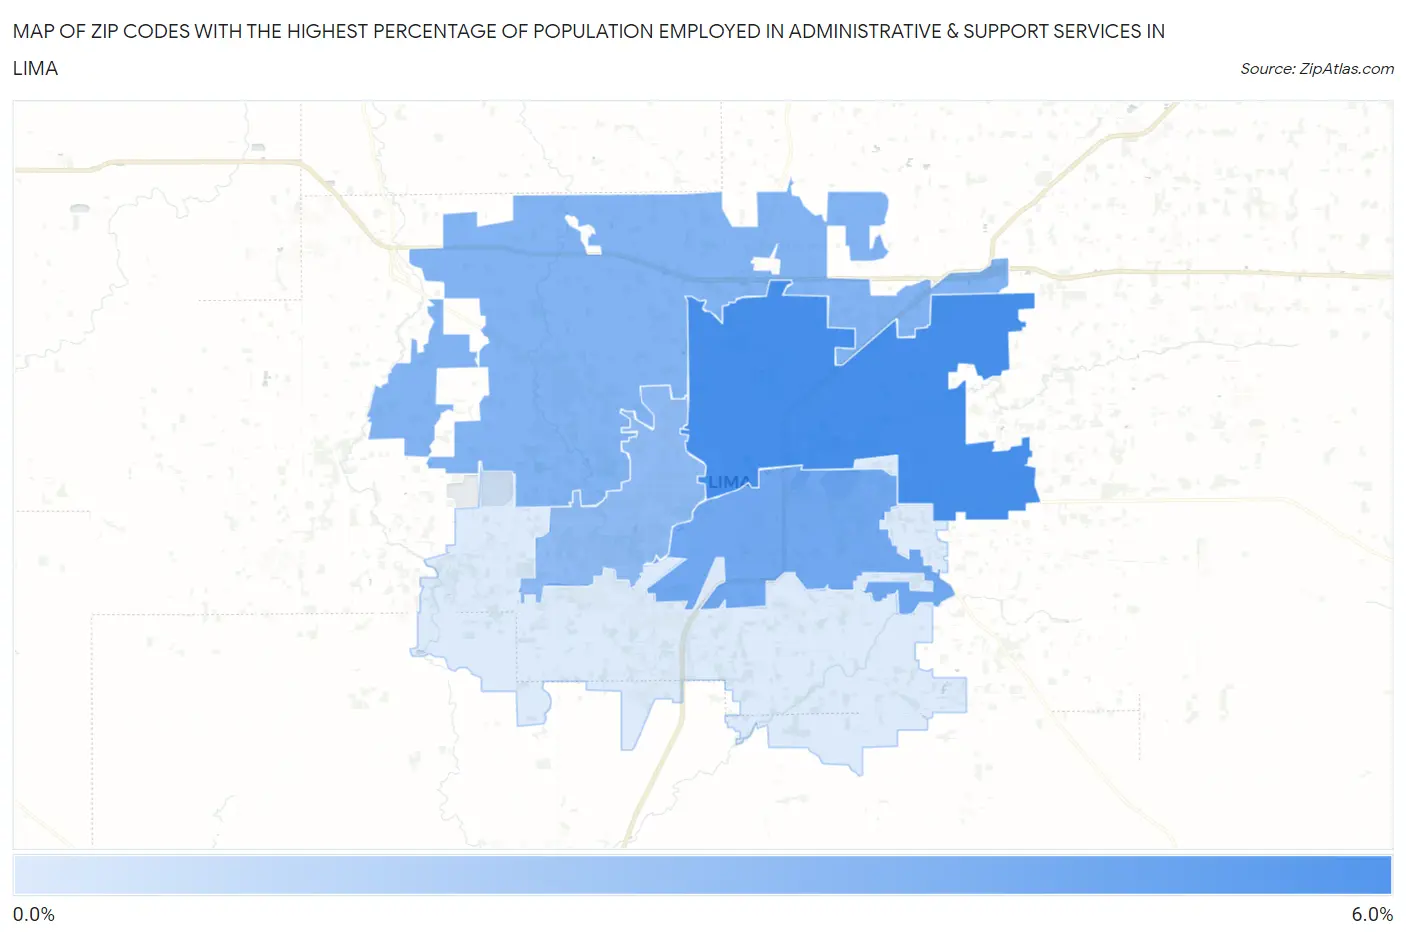
Map of Zip Codes with the Highest Percentage of Population Employed in Administrative & Support Services in Lima
0.97%
5.9%
Zip Codes with the Highest Percentage of Population Employed in Administrative & Support Services in Lima, OH
| Zip Code | % Employed | vs State | vs National | |
| 1. | 45801 | 5.9% | 3.7%(+2.14)#192 | 4.1%(+1.71)#5,033 |
| 2. | 45804 | 4.5% | 3.7%(+0.792)#336 | 4.1%(+0.366)#8,672 |
| 3. | 45807 | 4.0% | 3.7%(+0.245)#418 | 4.1%(-0.181)#10,822 |
| 4. | 45805 | 3.5% | 3.7%(-0.259)#498 | 4.1%(-0.684)#13,138 |
| 5. | 45806 | 0.97% | 3.7%(-2.76)#984 | 4.1%(-3.18)#24,601 |
1
Common Questions
What are the Top 3 Zip Codes with the Highest Percentage of Population Employed in Administrative & Support Services in Lima, OH?
Top 3 Zip Codes with the Highest Percentage of Population Employed in Administrative & Support Services in Lima, OH are:
What zip code has the Highest Percentage of Population Employed in Administrative & Support Services in Lima, OH?
45801 has the Highest Percentage of Population Employed in Administrative & Support Services in Lima, OH with 5.9%.
What is the Percentage of Population Employed in Administrative & Support Services in Lima, OH?
Percentage of Population Employed in Administrative & Support Services in Lima is 5.5%.
What is the Percentage of Population Employed in Administrative & Support Services in Ohio?
Percentage of Population Employed in Administrative & Support Services in Ohio is 3.7%.
What is the Percentage of Population Employed in Administrative & Support Services in the United States?
Percentage of Population Employed in Administrative & Support Services in the United States is 4.1%.