Zip Codes with the Highest Percentage of Population Employed in Administrative & Support Services in Hamilton, OH
RELATED REPORTS & OPTIONS
Administrative & Support Services
Hamilton
Compare Zip Codes
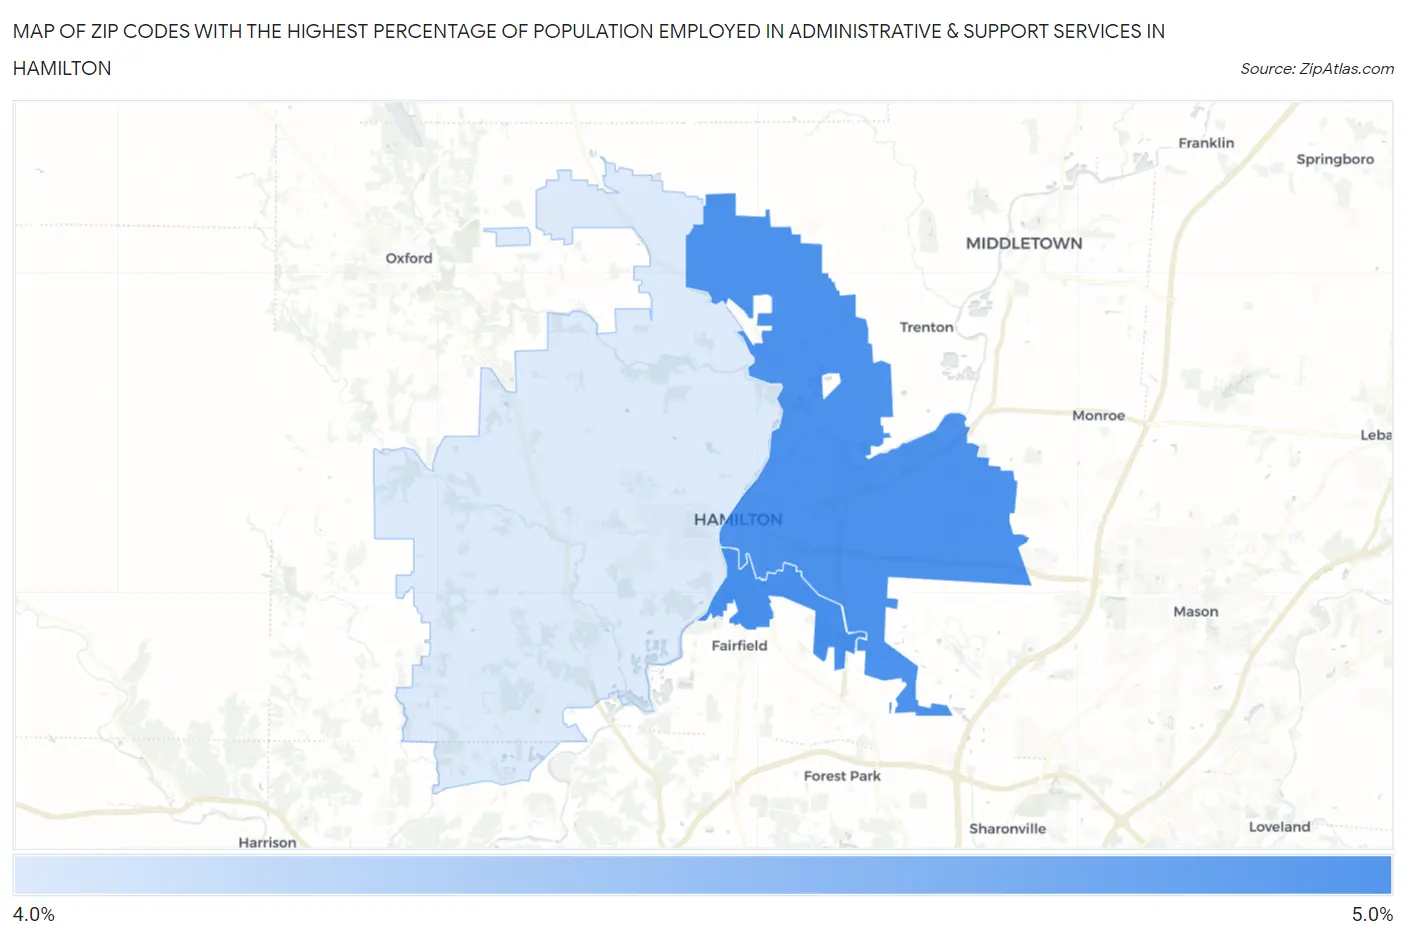
Map of Zip Codes with the Highest Percentage of Population Employed in Administrative & Support Services in Hamilton
4.1%
4.8%
Zip Codes with the Highest Percentage of Population Employed in Administrative & Support Services in Hamilton, OH
| Zip Code | % Employed | vs State | vs National | |
| 1. | 45015 | 4.8% | 3.7%(+1.11)#292 | 4.1%(+0.681)#7,627 |
| 2. | 45011 | 4.8% | 3.7%(+1.09)#296 | 4.1%(+0.661)#7,691 |
| 3. | 45013 | 4.1% | 3.7%(+0.407)#392 | 4.1%(-0.019)#10,117 |
1
Common Questions
What are the Top Zip Codes with the Highest Percentage of Population Employed in Administrative & Support Services in Hamilton, OH?
Top Zip Codes with the Highest Percentage of Population Employed in Administrative & Support Services in Hamilton, OH are:
What zip code has the Highest Percentage of Population Employed in Administrative & Support Services in Hamilton, OH?
45015 has the Highest Percentage of Population Employed in Administrative & Support Services in Hamilton, OH with 4.8%.
What is the Percentage of Population Employed in Administrative & Support Services in Hamilton, OH?
Percentage of Population Employed in Administrative & Support Services in Hamilton is 5.1%.
What is the Percentage of Population Employed in Administrative & Support Services in Ohio?
Percentage of Population Employed in Administrative & Support Services in Ohio is 3.7%.
What is the Percentage of Population Employed in Administrative & Support Services in the United States?
Percentage of Population Employed in Administrative & Support Services in the United States is 4.1%.