Zip Codes with the Highest Percentage of Population Employed in Security & Protection in Absecon, NJ
RELATED REPORTS & OPTIONS
Security & Protection
Absecon
Compare Zip Codes
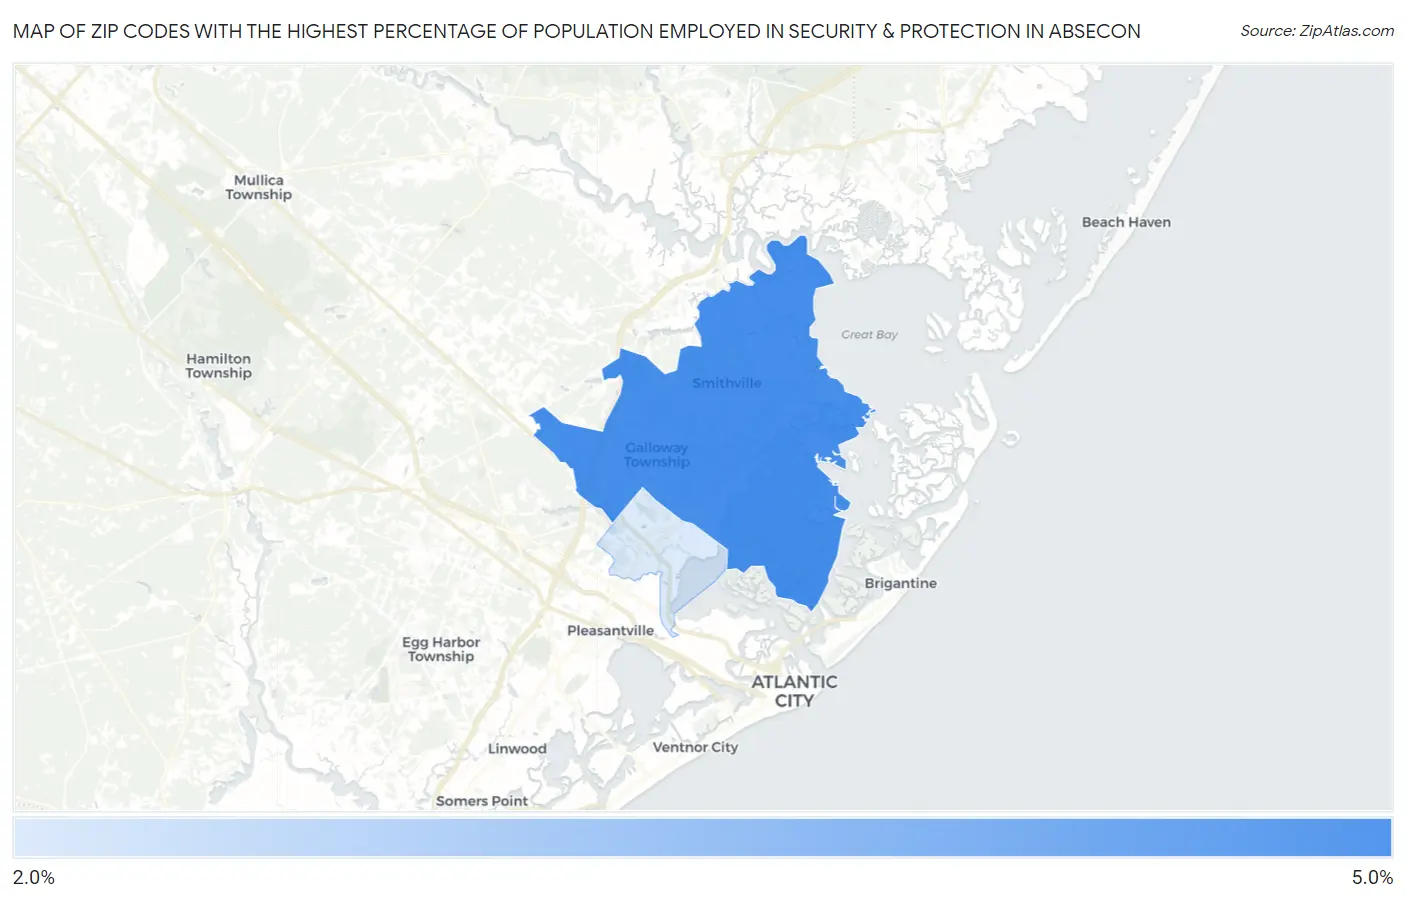
Map of Zip Codes with the Highest Percentage of Population Employed in Security & Protection in Absecon
2.8%
4.4%
Zip Codes with the Highest Percentage of Population Employed in Security & Protection in Absecon, NJ
| Zip Code | % Employed | vs State | vs National | |
| 1. | 08205 | 4.4% | 2.4%(+2.05)#65 | 2.1%(+2.30)#3,691 |
| 2. | 08201 | 2.8% | 2.4%(+0.423)#186 | 2.1%(+0.677)#7,993 |
1
Common Questions
What are the Top Zip Codes with the Highest Percentage of Population Employed in Security & Protection in Absecon, NJ?
Top Zip Codes with the Highest Percentage of Population Employed in Security & Protection in Absecon, NJ are:
What zip code has the Highest Percentage of Population Employed in Security & Protection in Absecon, NJ?
08205 has the Highest Percentage of Population Employed in Security & Protection in Absecon, NJ with 4.4%.
What is the Percentage of Population Employed in Security & Protection in Absecon, NJ?
Percentage of Population Employed in Security & Protection in Absecon is 3.3%.
What is the Percentage of Population Employed in Security & Protection in New Jersey?
Percentage of Population Employed in Security & Protection in New Jersey is 2.4%.
What is the Percentage of Population Employed in Security & Protection in the United States?
Percentage of Population Employed in Security & Protection in the United States is 2.1%.