Zip Codes with the Highest Percentage of Population with a Degree in Liberal Arts and History in Nashua, NH
RELATED REPORTS & OPTIONS
Liberal Arts and History
Nashua
Compare Zip Codes
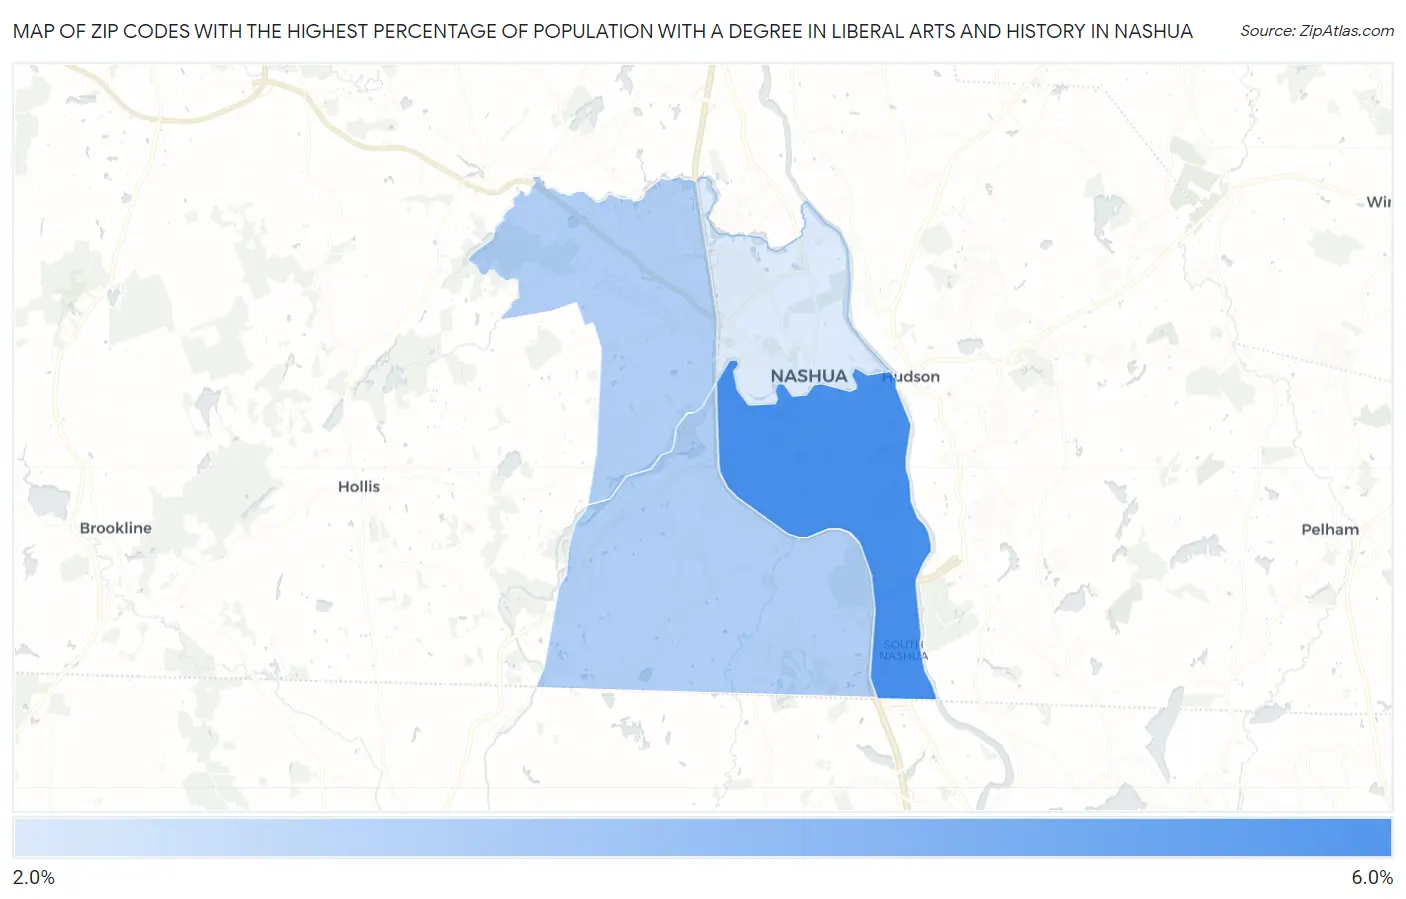
Map of Zip Codes with the Highest Percentage of Population with a Degree in Liberal Arts and History in Nashua
2.0%
6.0%
Zip Codes with the Highest Percentage of Population with a Degree in Liberal Arts and History in Nashua, NH
| Zip Code | % Graduates | vs State | vs National | |
| 1. | 03060 | 6.0% | 4.9%(+1.11)#86 | 4.9%(+1.11)#8,582 |
| 2. | 03063 | 3.2% | 4.9%(-1.65)#165 | 4.9%(-1.65)#17,585 |
| 3. | 03062 | 3.2% | 4.9%(-1.67)#166 | 4.9%(-1.68)#17,662 |
| 4. | 03064 | 2.0% | 4.9%(-2.86)#202 | 4.9%(-2.86)#21,353 |
1
Common Questions
What are the Top 3 Zip Codes with the Highest Percentage of Population with a Degree in Liberal Arts and History in Nashua, NH?
Top 3 Zip Codes with the Highest Percentage of Population with a Degree in Liberal Arts and History in Nashua, NH are:
What zip code has the Highest Percentage of Population with a Degree in Liberal Arts and History in Nashua, NH?
03060 has the Highest Percentage of Population with a Degree in Liberal Arts and History in Nashua, NH with 6.0%.
What is the Percentage of Population with a Degree in Liberal Arts and History in Nashua, NH?
Percentage of Population with a Degree in Liberal Arts and History in Nashua is 3.7%.
What is the Percentage of Population with a Degree in Liberal Arts and History in New Hampshire?
Percentage of Population with a Degree in Liberal Arts and History in New Hampshire is 4.9%.
What is the Percentage of Population with a Degree in Liberal Arts and History in the United States?
Percentage of Population with a Degree in Liberal Arts and History in the United States is 4.9%.