Zip Codes with the Highest Percentage of Population Employed in Legal Services & Support in Nashua, NH
RELATED REPORTS & OPTIONS
Legal Services & Support
Nashua
Compare Zip Codes
Map of Zip Codes with the Highest Percentage of Population Employed in Legal Services & Support in Nashua
0.50%
1.1%
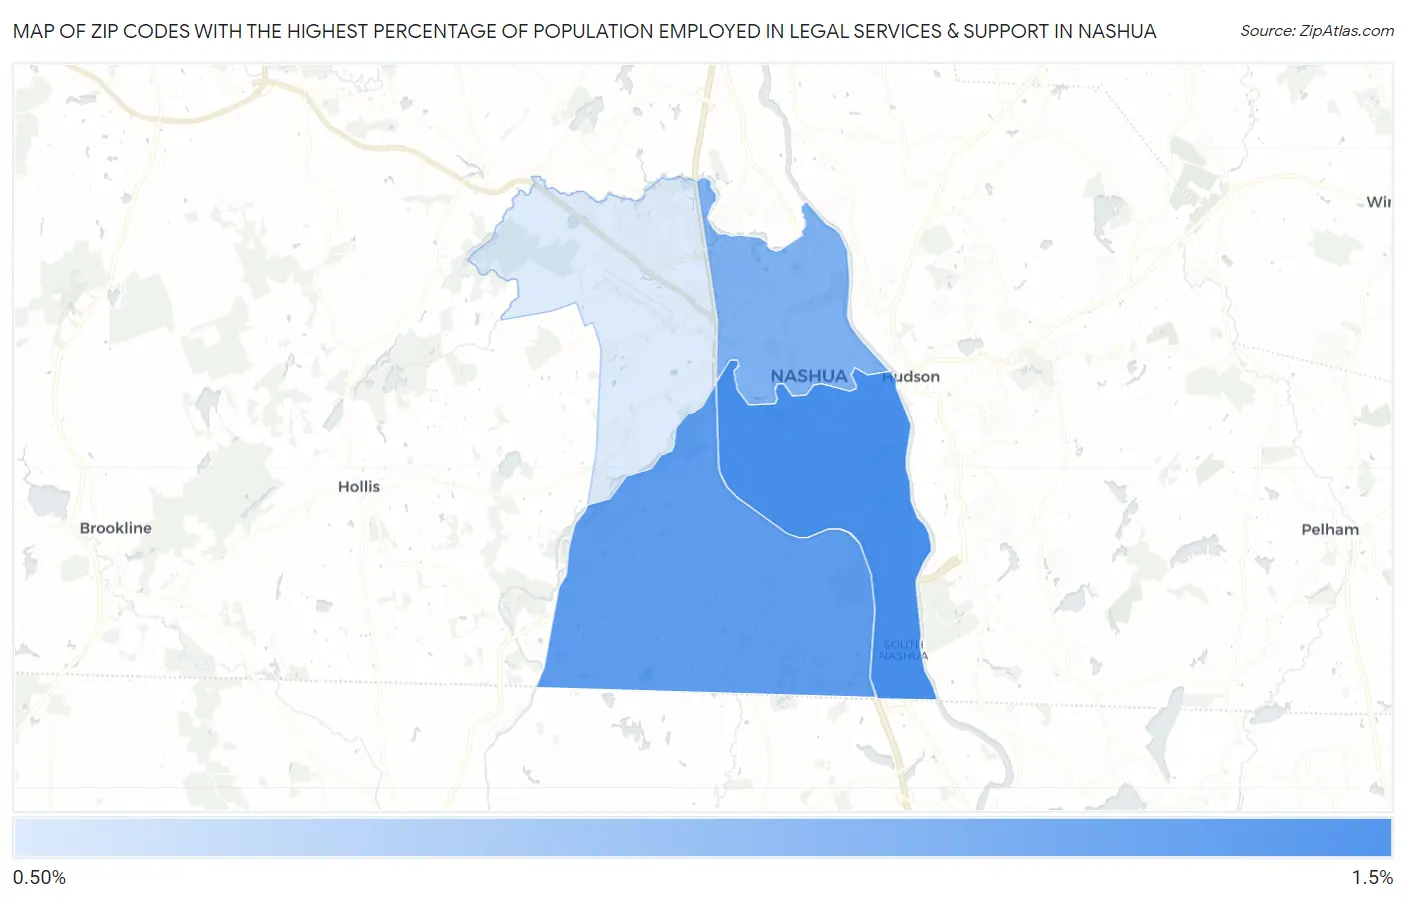
Zip Codes with the Highest Percentage of Population Employed in Legal Services & Support in Nashua, NH
| Zip Code | % Employed | vs State | vs National | |
| 1. | 03060 | 1.1% | 0.83%(+0.231)#53 | 1.2%(-0.120)#7,399 |
| 2. | 03062 | 0.97% | 0.83%(+0.140)#58 | 1.2%(-0.210)#8,013 |
| 3. | 03064 | 0.85% | 0.83%(+0.019)#72 | 1.2%(-0.331)#8,995 |
| 4. | 03063 | 0.50% | 0.83%(-0.330)#108 | 1.2%(-0.681)#12,587 |
1
Common Questions
What are the Top 3 Zip Codes with the Highest Percentage of Population Employed in Legal Services & Support in Nashua, NH?
Top 3 Zip Codes with the Highest Percentage of Population Employed in Legal Services & Support in Nashua, NH are:
What zip code has the Highest Percentage of Population Employed in Legal Services & Support in Nashua, NH?
03060 has the Highest Percentage of Population Employed in Legal Services & Support in Nashua, NH with 1.1%.
What is the Percentage of Population Employed in Legal Services & Support in Nashua, NH?
Percentage of Population Employed in Legal Services & Support in Nashua is 0.90%.
What is the Percentage of Population Employed in Legal Services & Support in New Hampshire?
Percentage of Population Employed in Legal Services & Support in New Hampshire is 0.83%.
What is the Percentage of Population Employed in Legal Services & Support in the United States?
Percentage of Population Employed in Legal Services & Support in the United States is 1.2%.