Zip Codes with the Highest Percentage of Population Employed in Health Diagnosing & Treating in Nashua, NH
RELATED REPORTS & OPTIONS
Health Diagnosing & Treating
Nashua
Compare Zip Codes
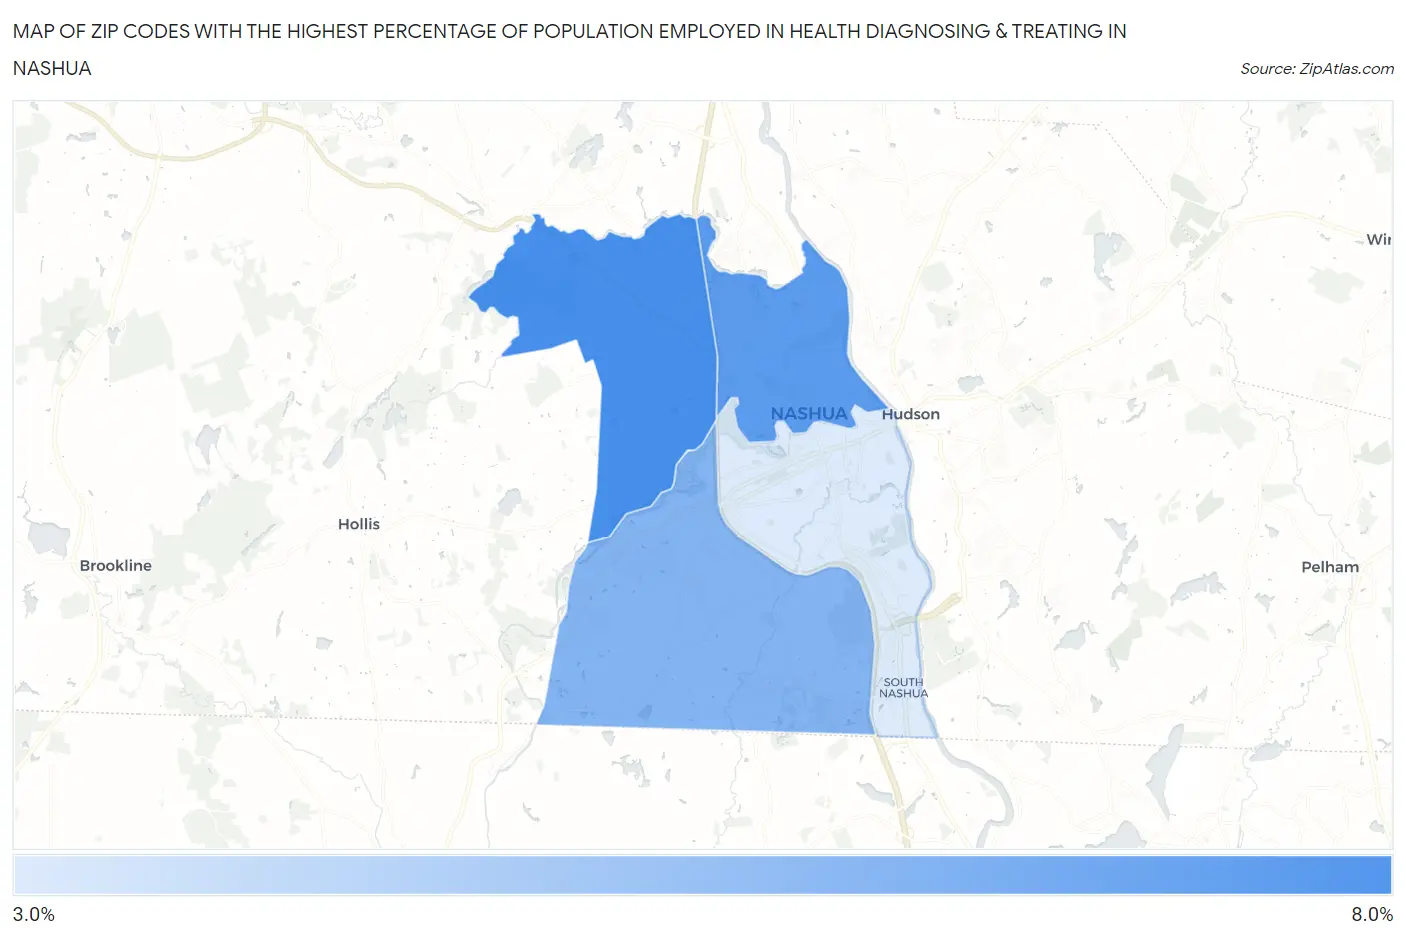
Map of Zip Codes with the Highest Percentage of Population Employed in Health Diagnosing & Treating in Nashua
3.9%
6.9%
Zip Codes with the Highest Percentage of Population Employed in Health Diagnosing & Treating in Nashua, NH
| Zip Code | % Employed | vs State | vs National | |
| 1. | 03063 | 6.9% | 6.7%(+0.215)#96 | 6.2%(+0.700)#10,531 |
| 2. | 03064 | 6.5% | 6.7%(-0.203)#106 | 6.2%(+0.283)#11,923 |
| 3. | 03062 | 5.7% | 6.7%(-1.00)#139 | 6.2%(-0.519)#14,888 |
| 4. | 03060 | 3.9% | 6.7%(-2.86)#201 | 6.2%(-2.37)#21,764 |
1
Common Questions
What are the Top 3 Zip Codes with the Highest Percentage of Population Employed in Health Diagnosing & Treating in Nashua, NH?
Top 3 Zip Codes with the Highest Percentage of Population Employed in Health Diagnosing & Treating in Nashua, NH are:
What zip code has the Highest Percentage of Population Employed in Health Diagnosing & Treating in Nashua, NH?
03063 has the Highest Percentage of Population Employed in Health Diagnosing & Treating in Nashua, NH with 6.9%.
What is the Percentage of Population Employed in Health Diagnosing & Treating in Nashua, NH?
Percentage of Population Employed in Health Diagnosing & Treating in Nashua is 5.4%.
What is the Percentage of Population Employed in Health Diagnosing & Treating in New Hampshire?
Percentage of Population Employed in Health Diagnosing & Treating in New Hampshire is 6.7%.
What is the Percentage of Population Employed in Health Diagnosing & Treating in the United States?
Percentage of Population Employed in Health Diagnosing & Treating in the United States is 6.2%.