Zip Codes with the Highest Percentage of Population Taking Taxi / Cab to Work in Nashua, NH
RELATED REPORTS & OPTIONS
Taxi / Cab
Nashua
Compare Zip Codes
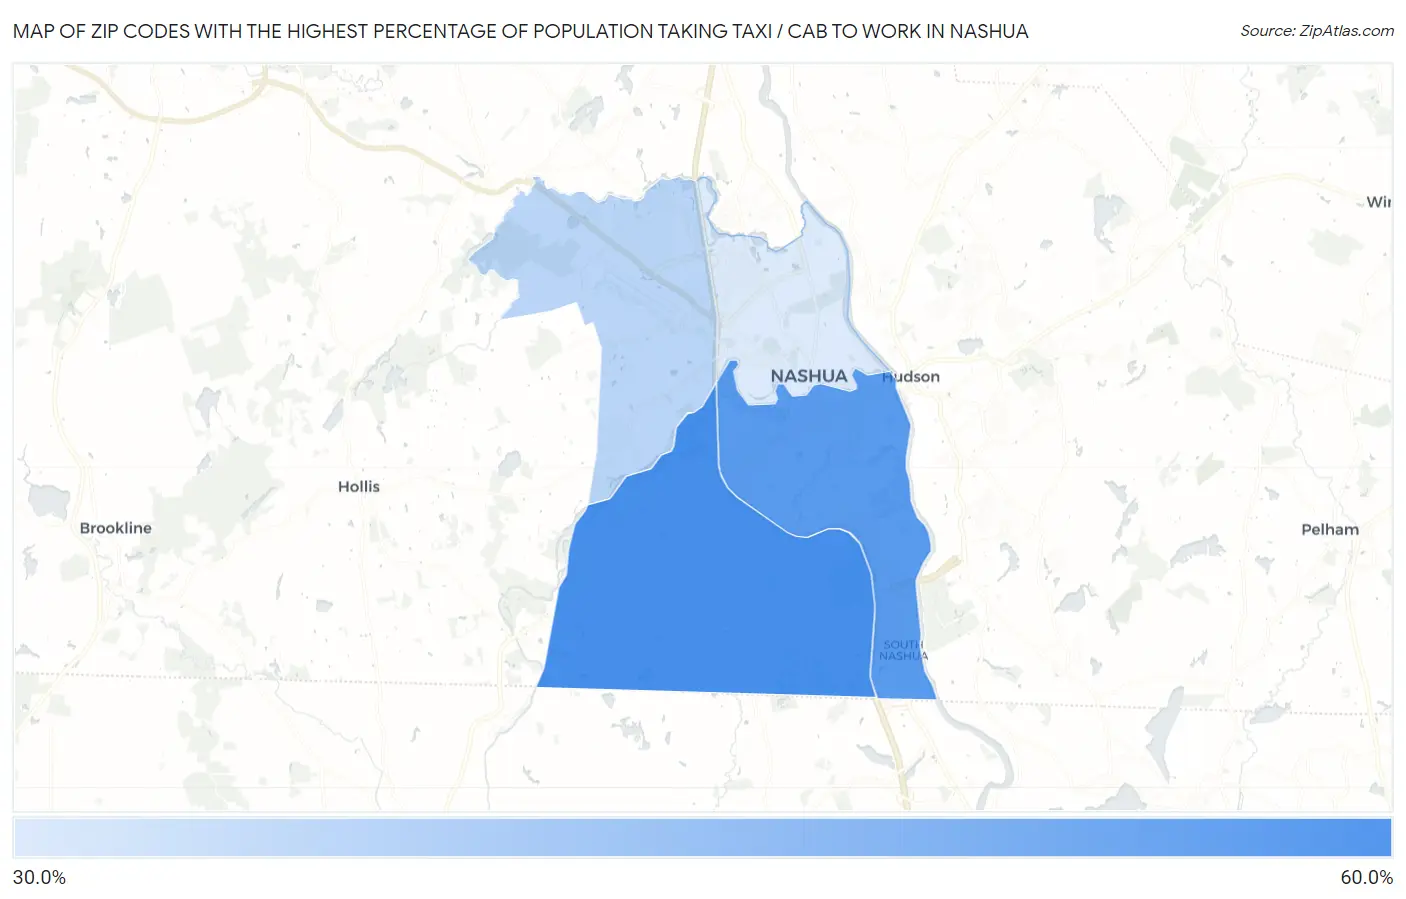
Map of Zip Codes with the Highest Percentage of Population Taking Taxi / Cab to Work in Nashua
38.2%
59.0%
Zip Codes with the Highest Percentage of Population Taking Taxi / Cab to Work in Nashua, NH
| Zip Code | % Take Taxi / Cab | vs State | vs National | |
| 1. | 03062 | 59.0% | 40.1%(+18.9)#8 | 38.2%(+20.8)#835 |
| 2. | 03060 | 56.7% | 40.1%(+16.6)#14 | 38.2%(+18.5)#1,207 |
| 3. | 03063 | 42.6% | 40.1%(+2.50)#34 | 38.2%(+4.40)#5,488 |
| 4. | 03064 | 38.2% | 40.1%(-1.90)#45 | 38.2%(=0.000)#7,410 |
1
Common Questions
What are the Top 3 Zip Codes with the Highest Percentage of Population Taking Taxi / Cab to Work in Nashua, NH?
Top 3 Zip Codes with the Highest Percentage of Population Taking Taxi / Cab to Work in Nashua, NH are:
What zip code has the Highest Percentage of Population Taking Taxi / Cab to Work in Nashua, NH?
03062 has the Highest Percentage of Population Taking Taxi / Cab to Work in Nashua, NH with 59.0%.
What is the Percentage of Population Taking Taxi / Cab to Work in Nashua, NH?
Percentage of Population Taking Taxi / Cab to Work in Nashua is 47.1%.
What is the Percentage of Population Taking Taxi / Cab to Work in New Hampshire?
Percentage of Population Taking Taxi / Cab to Work in New Hampshire is 40.1%.
What is the Percentage of Population Taking Taxi / Cab to Work in the United States?
Percentage of Population Taking Taxi / Cab to Work in the United States is 38.2%.