Waynesville, NC Map & Demographics
Waynesville Map
Waynesville Overview
$34,653
PER CAPITA INCOME
$78,016
AVG FAMILY INCOME
$44,920
AVG HOUSEHOLD INCOME
28.4%
WAGE / INCOME GAP [ % ]
71.6¢/ $1
WAGE / INCOME GAP [ $ ]
0.48
INEQUALITY / GINI INDEX
10,307
TOTAL POPULATION
5,017
MALE POPULATION
5,290
FEMALE POPULATION
94.84
MALES / 100 FEMALES
105.44
FEMALES / 100 MALES
47.3
MEDIAN AGE
2.7
AVG FAMILY SIZE
2.1
AVG HOUSEHOLD SIZE
4,824
LABOR FORCE [ PEOPLE ]
56.4%
PERCENT IN LABOR FORCE
2.3%
UNEMPLOYMENT RATE
Waynesville Area Codes
Income in Waynesville
Income Overview in Waynesville
Per Capita Income in Waynesville is $34,653, while median incomes of families and households are $78,016 and $44,920 respectively.
| Characteristic | Number | Measure |
| Per Capita Income | 10,307 | $34,653 |
| Median Family Income | 2,724 | $78,016 |
| Mean Family Income | 2,724 | $91,157 |
| Median Household Income | 4,803 | $44,920 |
| Mean Household Income | 4,803 | $71,254 |
| Income Deficit | 2,724 | $0 |
| Wage / Income Gap (%) | 10,307 | 28.39% |
| Wage / Income Gap ($) | 10,307 | 71.61¢ per $1 |
| Gini / Inequality Index | 10,307 | 0.48 |
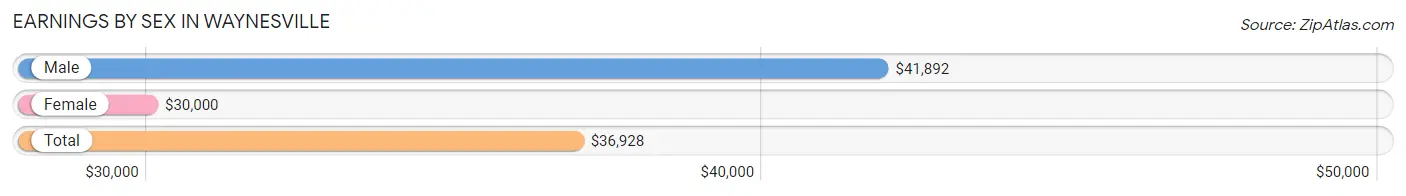
Earnings by Sex in Waynesville
Average Earnings in Waynesville are $36,928, $41,892 for men and $30,000 for women, a difference of 28.4%.
| Sex | Number | Average Earnings |
| Male | 2,439 (48.4%) | $41,892 |
| Female | 2,600 (51.6%) | $30,000 |
| Total | 5,039 (100.0%) | $36,928 |
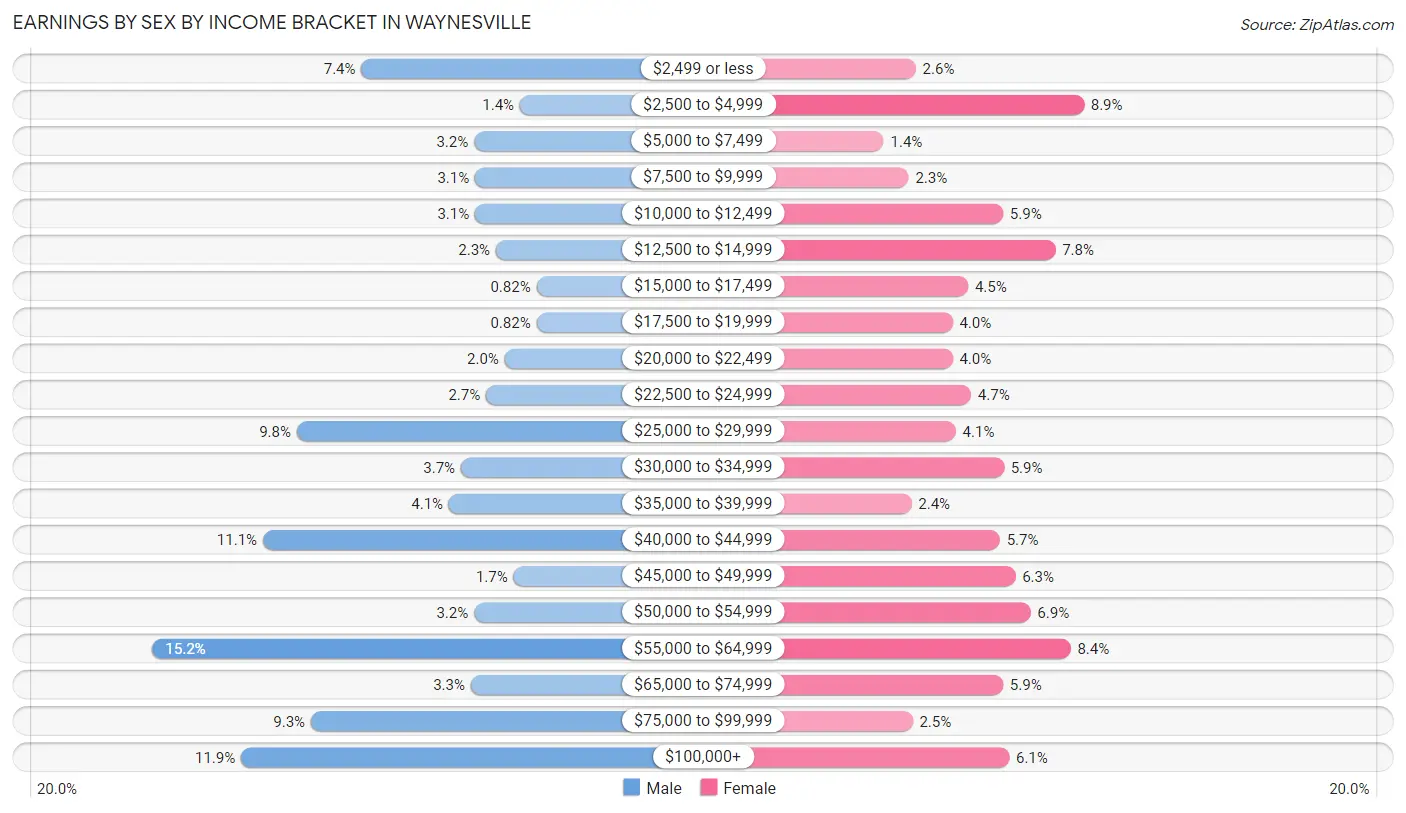
Earnings by Sex by Income Bracket in Waynesville
The most common earnings brackets in Waynesville are $55,000 to $64,999 for men (371 | 15.2%) and $2,500 to $4,999 for women (231 | 8.9%).
| Income | Male | Female |
| $2,499 or less | 180 (7.4%) | 67 (2.6%) |
| $2,500 to $4,999 | 35 (1.4%) | 231 (8.9%) |
| $5,000 to $7,499 | 77 (3.2%) | 36 (1.4%) |
| $7,500 to $9,999 | 76 (3.1%) | 60 (2.3%) |
| $10,000 to $12,499 | 76 (3.1%) | 152 (5.9%) |
| $12,500 to $14,999 | 57 (2.3%) | 203 (7.8%) |
| $15,000 to $17,499 | 20 (0.8%) | 118 (4.5%) |
| $17,500 to $19,999 | 20 (0.8%) | 103 (4.0%) |
| $20,000 to $22,499 | 49 (2.0%) | 103 (4.0%) |
| $22,500 to $24,999 | 66 (2.7%) | 121 (4.6%) |
| $25,000 to $29,999 | 239 (9.8%) | 106 (4.1%) |
| $30,000 to $34,999 | 89 (3.6%) | 153 (5.9%) |
| $35,000 to $39,999 | 100 (4.1%) | 63 (2.4%) |
| $40,000 to $44,999 | 270 (11.1%) | 149 (5.7%) |
| $45,000 to $49,999 | 41 (1.7%) | 164 (6.3%) |
| $50,000 to $54,999 | 77 (3.2%) | 179 (6.9%) |
| $55,000 to $64,999 | 371 (15.2%) | 218 (8.4%) |
| $65,000 to $74,999 | 80 (3.3%) | 152 (5.9%) |
| $75,000 to $99,999 | 226 (9.3%) | 64 (2.5%) |
| $100,000+ | 290 (11.9%) | 158 (6.1%) |
| Total | 2,439 (100.0%) | 2,600 (100.0%) |
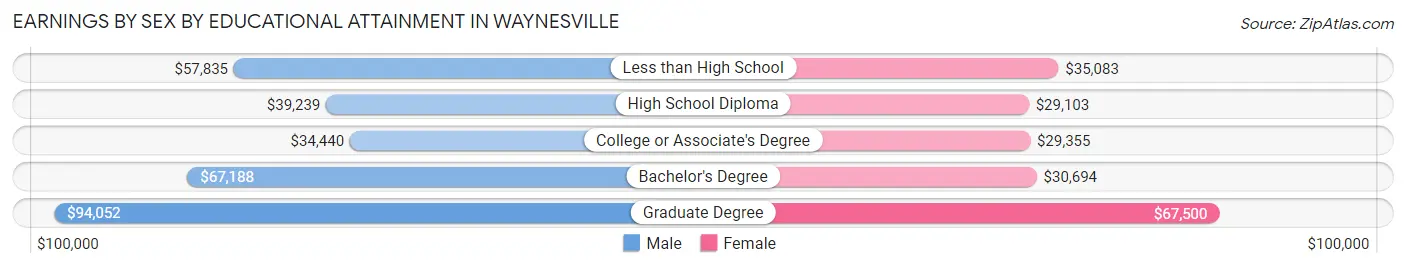
Earnings by Sex by Educational Attainment in Waynesville
Average earnings in Waynesville are $46,176 for men and $34,149 for women, a difference of 26.1%. Men with an educational attainment of graduate degree enjoy the highest average annual earnings of $94,052, while those with college or associate's degree education earn the least with $34,440. Women with an educational attainment of graduate degree earn the most with the average annual earnings of $67,500, while those with high school diploma education have the smallest earnings of $29,103.
| Educational Attainment | Male Income | Female Income |
| Less than High School | $57,835 | $35,083 |
| High School Diploma | $39,239 | $29,103 |
| College or Associate's Degree | $34,440 | $29,355 |
| Bachelor's Degree | $67,188 | $30,694 |
| Graduate Degree | $94,052 | $67,500 |
| Total | $46,176 | $34,149 |
Family Income in Waynesville
Family Income Brackets in Waynesville
According to the Waynesville family income data, there are 624 families falling into the $100,000 to $149,999 income range, which is the most common income bracket and makes up 22.9% of all families. Conversely, the less than $10,000 income bracket is the least frequent group with only 44 families (1.6%) belonging to this category.
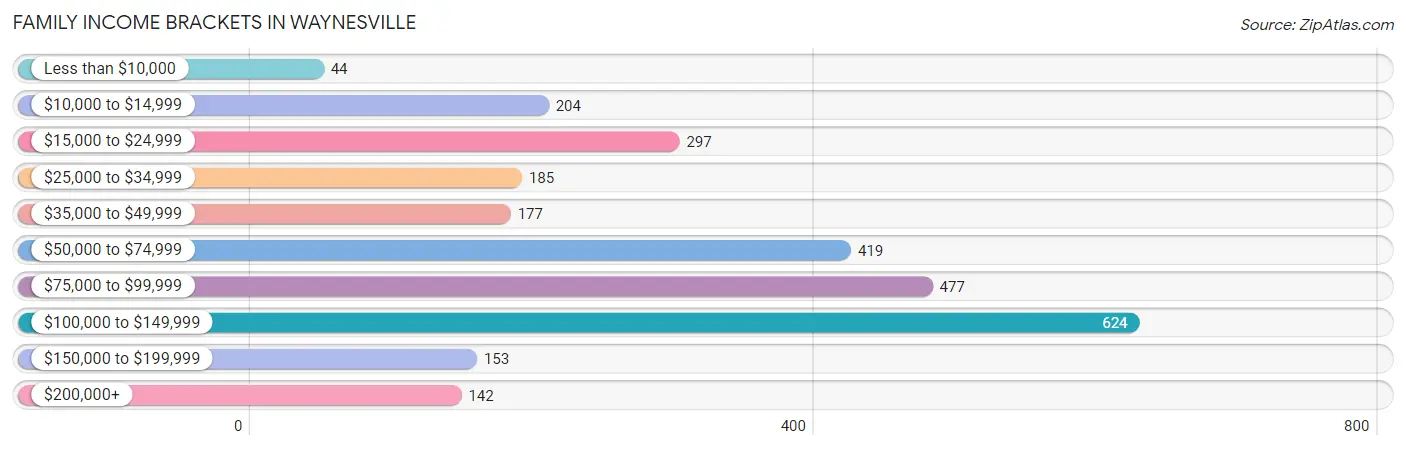
| Income Bracket | # Families | % Families |
| Less than $10,000 | 44 | 1.6% |
| $10,000 to $14,999 | 204 | 7.5% |
| $15,000 to $24,999 | 297 | 10.9% |
| $25,000 to $34,999 | 185 | 6.8% |
| $35,000 to $49,999 | 177 | 6.5% |
| $50,000 to $74,999 | 419 | 15.4% |
| $75,000 to $99,999 | 477 | 17.5% |
| $100,000 to $149,999 | 624 | 22.9% |
| $150,000 to $199,999 | 153 | 5.6% |
| $200,000+ | 142 | 5.2% |
Family Income by Famaliy Size in Waynesville
4-person families (285 | 10.5%) account for the highest median family income in Waynesville with $108,039 per family, while 2-person families (1,638 | 60.1%) have the highest median income of $36,092 per family member.
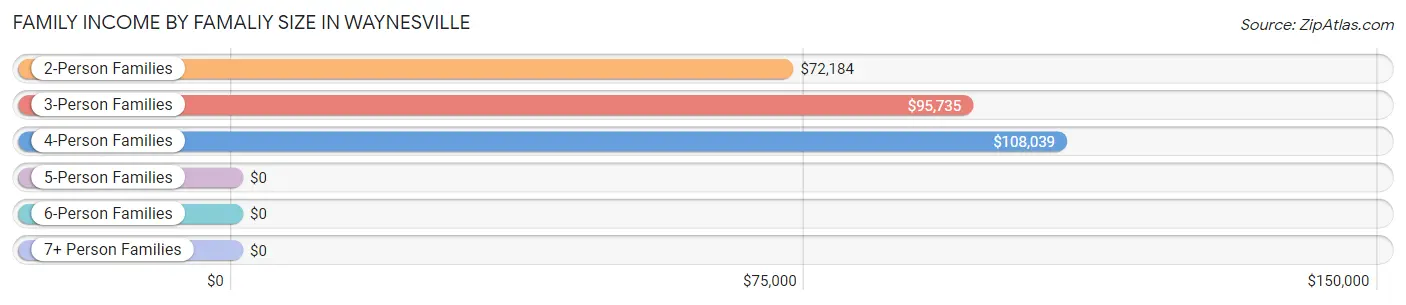
| Income Bracket | # Families | Median Income |
| 2-Person Families | 1,638 (60.1%) | $72,184 |
| 3-Person Families | 610 (22.4%) | $95,735 |
| 4-Person Families | 285 (10.5%) | $108,039 |
| 5-Person Families | 164 (6.0%) | $0 |
| 6-Person Families | 27 (1.0%) | $0 |
| 7+ Person Families | 0 (0.0%) | $0 |
| Total | 2,724 (100.0%) | $78,016 |
Family Income by Number of Earners in Waynesville
The median family income in Waynesville is $78,016, with families comprising 3+ earners (131) having the highest median family income of $121,971, while families with no earners (587) have the lowest median family income of $33,542, accounting for 4.8% and 21.5% of families, respectively.
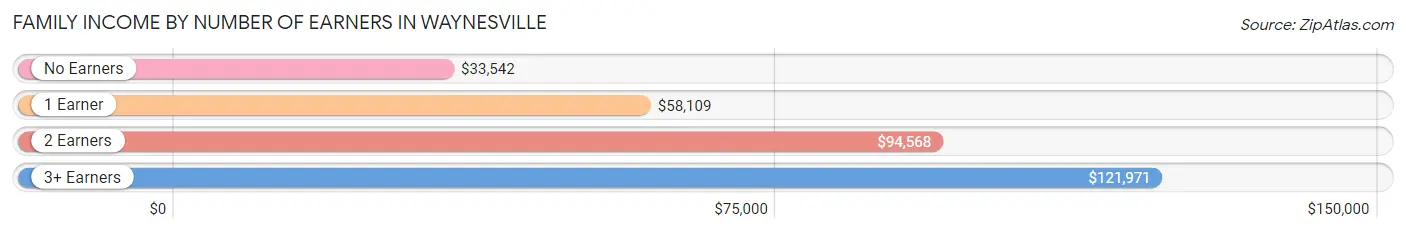
| Number of Earners | # Families | Median Income |
| No Earners | 587 (21.5%) | $33,542 |
| 1 Earner | 999 (36.7%) | $58,109 |
| 2 Earners | 1,007 (37.0%) | $94,568 |
| 3+ Earners | 131 (4.8%) | $121,971 |
| Total | 2,724 (100.0%) | $78,016 |
Household Income in Waynesville
Household Income Brackets in Waynesville
With 817 households falling in the category, the $15,000 to $24,999 income range is the most frequent in Waynesville, accounting for 17.0% of all households. In contrast, only 158 households (3.3%) fall into the less than $10,000 income bracket, making it the least populous group.
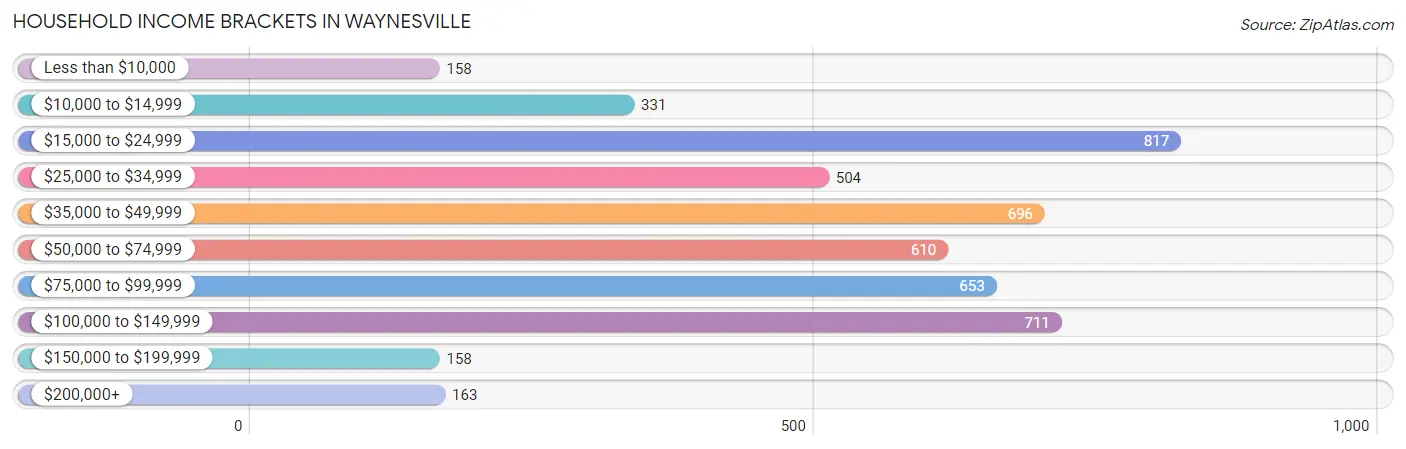
| Income Bracket | # Households | % Households |
| Less than $10,000 | 158 | 3.3% |
| $10,000 to $14,999 | 331 | 6.9% |
| $15,000 to $24,999 | 817 | 17.0% |
| $25,000 to $34,999 | 504 | 10.5% |
| $35,000 to $49,999 | 696 | 14.5% |
| $50,000 to $74,999 | 610 | 12.7% |
| $75,000 to $99,999 | 653 | 13.6% |
| $100,000 to $149,999 | 711 | 14.8% |
| $150,000 to $199,999 | 158 | 3.3% |
| $200,000+ | 163 | 3.4% |
Household Income by Householder Age in Waynesville
The median household income in Waynesville is $44,920, with the highest median household income of $66,417 found in the 45 to 64 years age bracket for the primary householder. A total of 1,485 households (30.9%) fall into this category. Meanwhile, the 15 to 24 years age bracket for the primary householder has the lowest median household income of $28,179, with 297 households (6.2%) in this group.
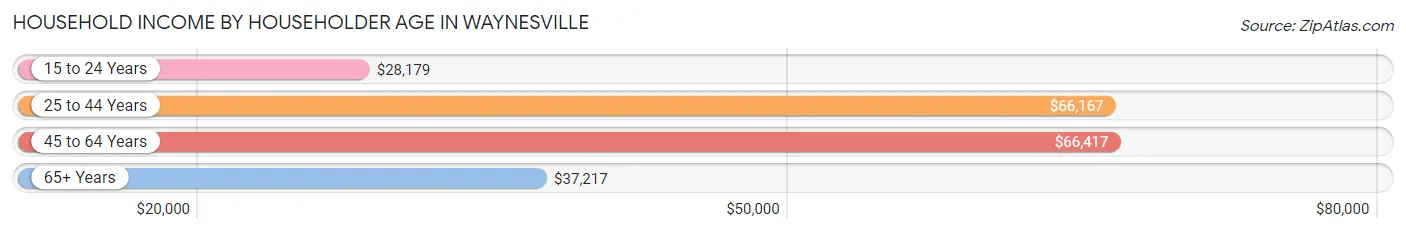
| Income Bracket | # Households | Median Income |
| 15 to 24 Years | 297 (6.2%) | $28,179 |
| 25 to 44 Years | 1,270 (26.4%) | $66,167 |
| 45 to 64 Years | 1,485 (30.9%) | $66,417 |
| 65+ Years | 1,751 (36.5%) | $37,217 |
| Total | 4,803 (100.0%) | $44,920 |
Poverty in Waynesville
Income Below Poverty by Sex and Age in Waynesville
With 15.1% poverty level for males and 20.9% for females among the residents of Waynesville, under 5 year old males and 6 to 11 year old females are the most vulnerable to poverty, with 176 males (78.2%) and 295 females (73.0%) in their respective age groups living below the poverty level.
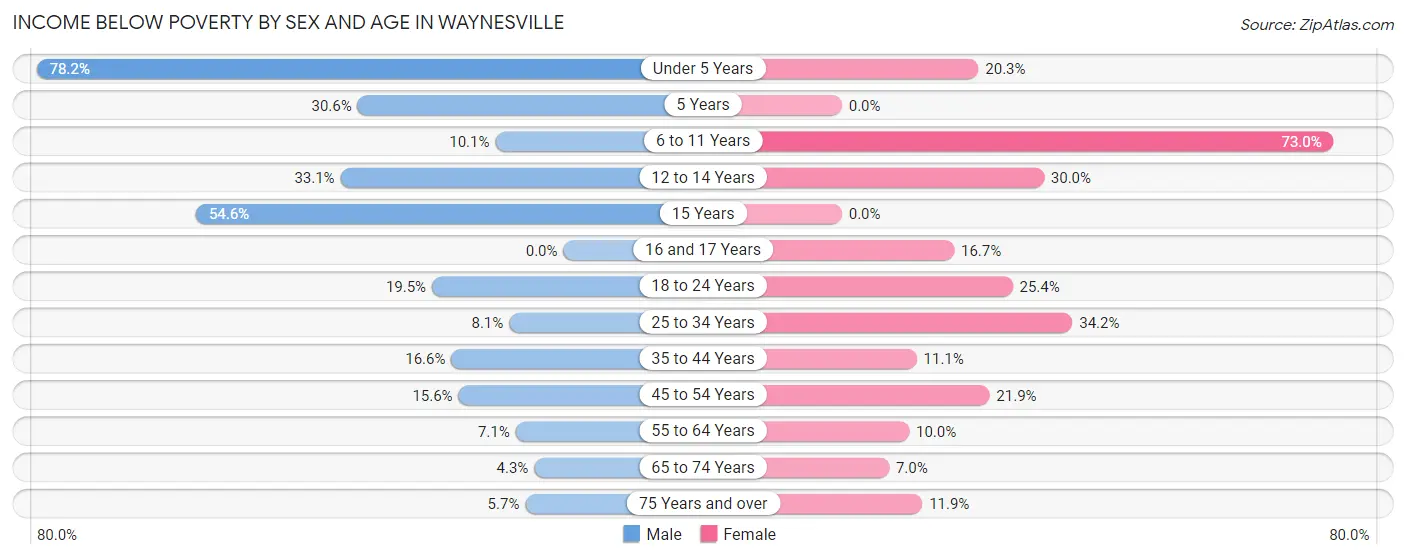
| Age Bracket | Male | Female |
| Under 5 Years | 176 (78.2%) | 44 (20.3%) |
| 5 Years | 33 (30.6%) | 0 (0.0%) |
| 6 to 11 Years | 38 (10.1%) | 295 (73.0%) |
| 12 to 14 Years | 48 (33.1%) | 21 (30.0%) |
| 15 Years | 36 (54.5%) | 0 (0.0%) |
| 16 and 17 Years | 0 (0.0%) | 11 (16.7%) |
| 18 to 24 Years | 64 (19.5%) | 90 (25.4%) |
| 25 to 34 Years | 45 (8.1%) | 204 (34.2%) |
| 35 to 44 Years | 104 (16.6%) | 63 (11.1%) |
| 45 to 54 Years | 91 (15.6%) | 146 (21.9%) |
| 55 to 64 Years | 39 (7.1%) | 82 (10.0%) |
| 65 to 74 Years | 29 (4.3%) | 50 (7.0%) |
| 75 Years and over | 33 (5.7%) | 72 (11.9%) |
| Total | 736 (15.1%) | 1,078 (20.9%) |
Income Above Poverty by Sex and Age in Waynesville
According to the poverty statistics in Waynesville, males aged 16 and 17 years and females aged 5 years are the age groups that are most secure financially, with 100.0% of males and 100.0% of females in these age groups living above the poverty line.
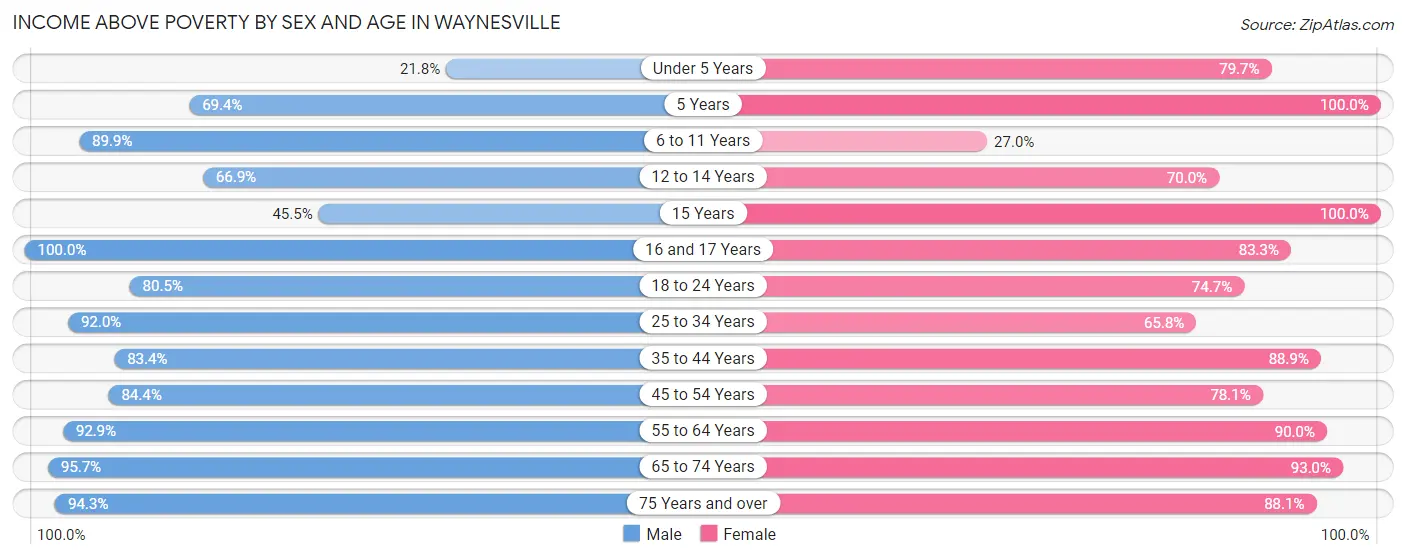
| Age Bracket | Male | Female |
| Under 5 Years | 49 (21.8%) | 173 (79.7%) |
| 5 Years | 75 (69.4%) | 29 (100.0%) |
| 6 to 11 Years | 338 (89.9%) | 109 (27.0%) |
| 12 to 14 Years | 97 (66.9%) | 49 (70.0%) |
| 15 Years | 30 (45.5%) | 51 (100.0%) |
| 16 and 17 Years | 53 (100.0%) | 55 (83.3%) |
| 18 to 24 Years | 264 (80.5%) | 265 (74.7%) |
| 25 to 34 Years | 514 (91.9%) | 392 (65.8%) |
| 35 to 44 Years | 521 (83.4%) | 504 (88.9%) |
| 45 to 54 Years | 493 (84.4%) | 520 (78.1%) |
| 55 to 64 Years | 510 (92.9%) | 739 (90.0%) |
| 65 to 74 Years | 641 (95.7%) | 664 (93.0%) |
| 75 Years and over | 550 (94.3%) | 531 (88.1%) |
| Total | 4,135 (84.9%) | 4,081 (79.1%) |
Income Below Poverty Among Married-Couple Families in Waynesville
The poverty statistics for married-couple families in Waynesville show that 9.4% or 185 of the total 1,969 families live below the poverty line. Families with 1 or 2 children have the highest poverty rate of 21.8%, comprising of 127 families. On the other hand, families with 3 or 4 children have the lowest poverty rate of 0.0%, which includes 0 families.
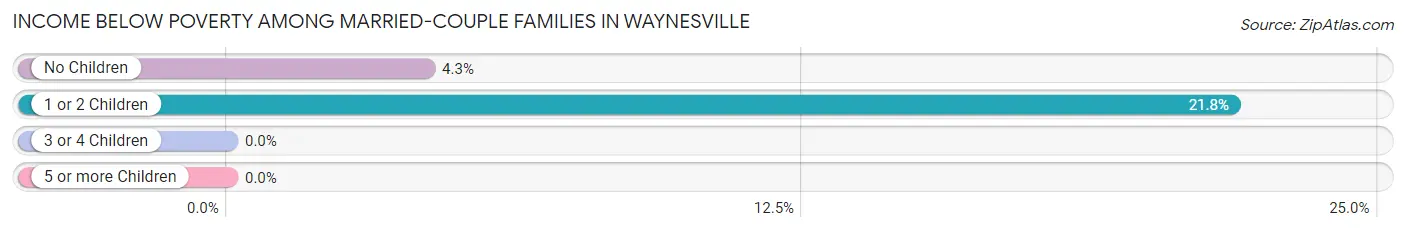
| Children | Above Poverty | Below Poverty |
| No Children | 1,293 (95.7%) | 58 (4.3%) |
| 1 or 2 Children | 455 (78.2%) | 127 (21.8%) |
| 3 or 4 Children | 36 (100.0%) | 0 (0.0%) |
| 5 or more Children | 0 (0.0%) | 0 (0.0%) |
| Total | 1,784 (90.6%) | 185 (9.4%) |
Income Below Poverty Among Single-Parent Households in Waynesville
According to the poverty data in Waynesville, 21.8% or 19 single-father households and 26.5% or 177 single-mother households are living below the poverty line. Among single-father households, those with 1 or 2 children have the highest poverty rate, with 19 households (25.7%) experiencing poverty. Likewise, among single-mother households, those with 3 or 4 children have the highest poverty rate, with 110 households (100.0%) falling below the poverty line.
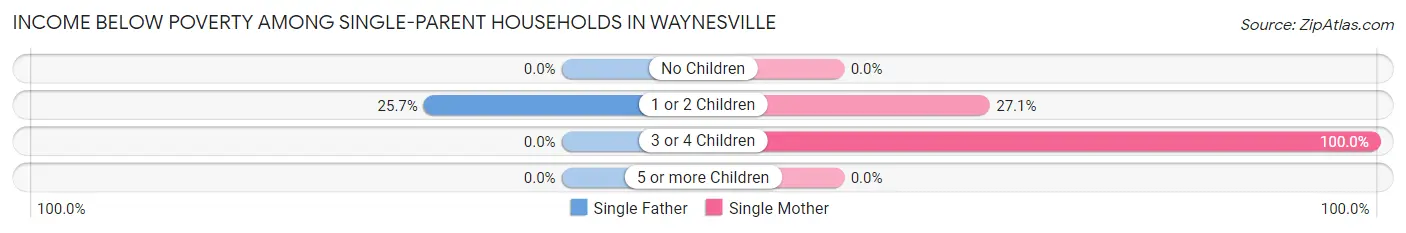
| Children | Single Father | Single Mother |
| No Children | 0 (0.0%) | 0 (0.0%) |
| 1 or 2 Children | 19 (25.7%) | 67 (27.1%) |
| 3 or 4 Children | 0 (0.0%) | 110 (100.0%) |
| 5 or more Children | 0 (0.0%) | 0 (0.0%) |
| Total | 19 (21.8%) | 177 (26.5%) |
Income Below Poverty Among Married-Couple vs Single-Parent Households in Waynesville
The poverty data for Waynesville shows that 185 of the married-couple family households (9.4%) and 196 of the single-parent households (26.0%) are living below the poverty level. Within the married-couple family households, those with 1 or 2 children have the highest poverty rate, with 127 households (21.8%) falling below the poverty line. Among the single-parent households, those with 3 or 4 children have the highest poverty rate, with 110 household (100.0%) living below poverty.
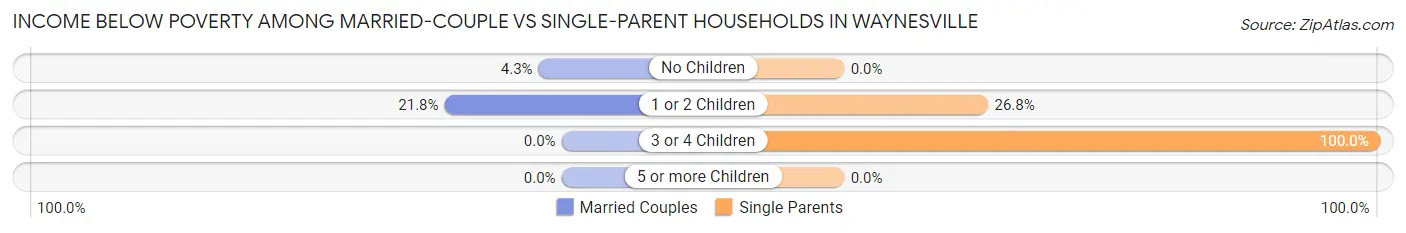
| Children | Married-Couple Families | Single-Parent Households |
| No Children | 58 (4.3%) | 0 (0.0%) |
| 1 or 2 Children | 127 (21.8%) | 86 (26.8%) |
| 3 or 4 Children | 0 (0.0%) | 110 (100.0%) |
| 5 or more Children | 0 (0.0%) | 0 (0.0%) |
| Total | 185 (9.4%) | 196 (26.0%) |
Race in Waynesville
The most populous races in Waynesville are White / Caucasian (9,429 | 91.5%), Two or more Races (562 | 5.4%), and Hispanic or Latino (452 | 4.4%).
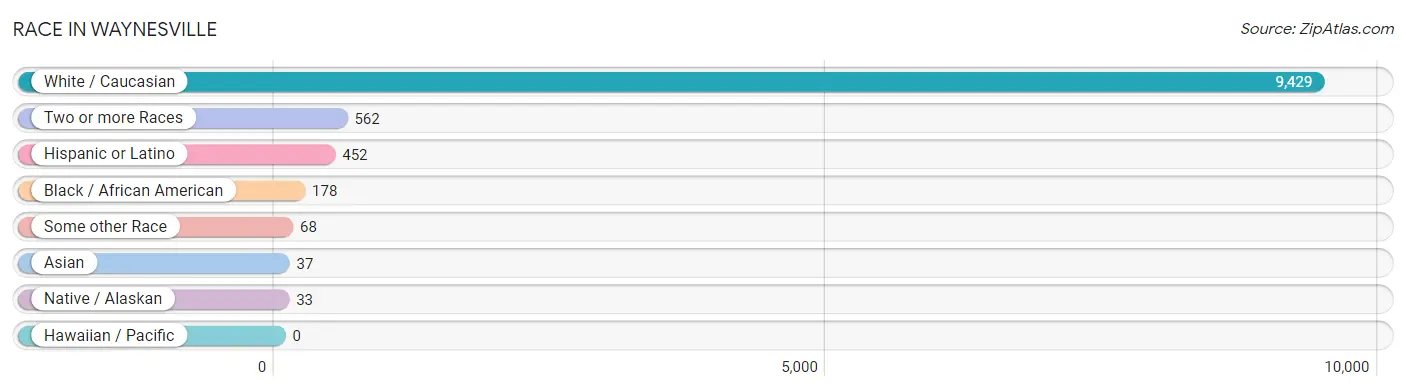
| Race | # Population | % Population |
| Asian | 37 | 0.4% |
| Black / African American | 178 | 1.7% |
| Hawaiian / Pacific | 0 | 0.0% |
| Hispanic or Latino | 452 | 4.4% |
| Native / Alaskan | 33 | 0.3% |
| White / Caucasian | 9,429 | 91.5% |
| Two or more Races | 562 | 5.4% |
| Some other Race | 68 | 0.7% |
| Total | 10,307 | 100.0% |
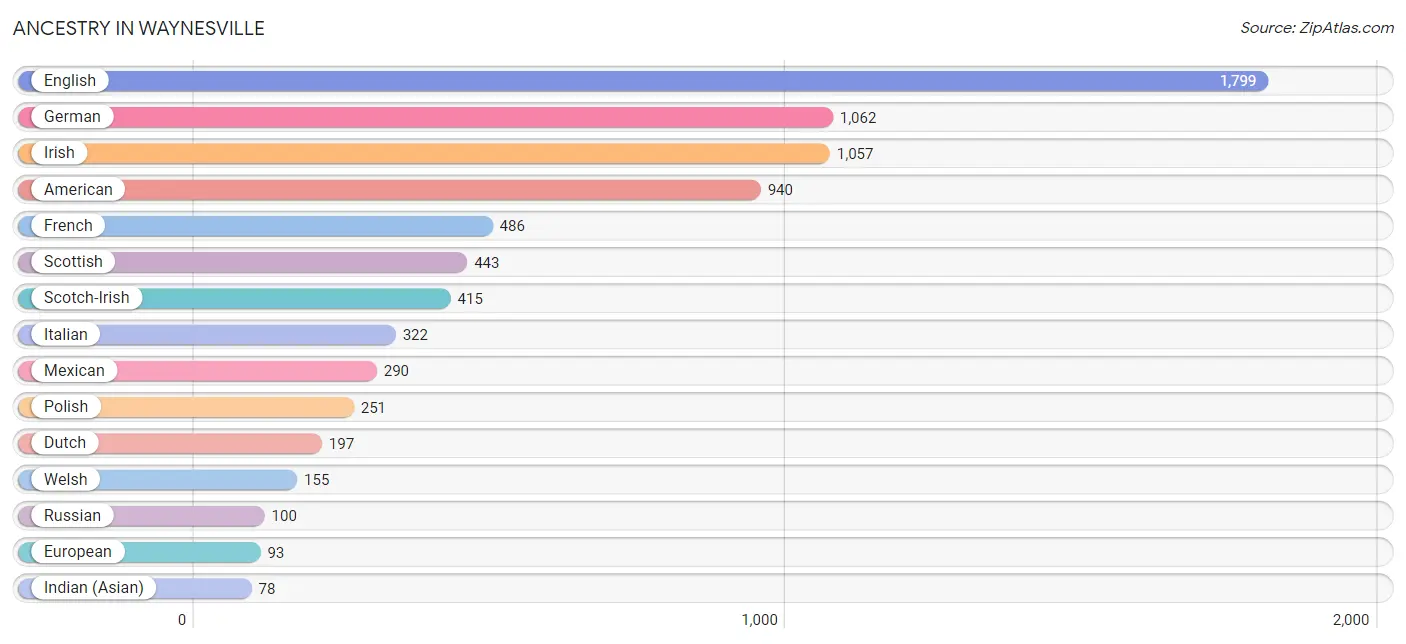
Ancestry in Waynesville
The most populous ancestries reported in Waynesville are English (1,799 | 17.4%), German (1,062 | 10.3%), Irish (1,057 | 10.3%), American (940 | 9.1%), and French (486 | 4.7%), together accounting for 51.8% of all Waynesville residents.
| Ancestry | # Population | % Population |
| American | 940 | 9.1% |
| Arab | 38 | 0.4% |
| Australian | 9 | 0.1% |
| Belgian | 32 | 0.3% |
| Bhutanese | 6 | 0.1% |
| British | 48 | 0.5% |
| Canadian | 21 | 0.2% |
| Central American | 15 | 0.2% |
| Cherokee | 77 | 0.7% |
| Colombian | 46 | 0.4% |
| Cuban | 10 | 0.1% |
| Danish | 14 | 0.1% |
| Dominican | 9 | 0.1% |
| Dutch | 197 | 1.9% |
| Dutch West Indian | 6 | 0.1% |
| English | 1,799 | 17.4% |
| European | 93 | 0.9% |
| French | 486 | 4.7% |
| French Canadian | 7 | 0.1% |
| German | 1,062 | 10.3% |
| Greek | 9 | 0.1% |
| Hungarian | 47 | 0.5% |
| Indian (Asian) | 78 | 0.8% |
| Irish | 1,057 | 10.3% |
| Iroquois | 22 | 0.2% |
| Italian | 322 | 3.1% |
| Korean | 36 | 0.4% |
| Latvian | 24 | 0.2% |
| Lebanese | 7 | 0.1% |
| Mexican | 290 | 2.8% |
| Mongolian | 2 | 0.0% |
| Moroccan | 23 | 0.2% |
| Native Hawaiian | 32 | 0.3% |
| Northern European | 12 | 0.1% |
| Norwegian | 17 | 0.2% |
| Pakistani | 4 | 0.0% |
| Polish | 251 | 2.4% |
| Portuguese | 8 | 0.1% |
| Puerto Rican | 19 | 0.2% |
| Russian | 100 | 1.0% |
| Salvadoran | 15 | 0.2% |
| Scandinavian | 40 | 0.4% |
| Scotch-Irish | 415 | 4.0% |
| Scottish | 443 | 4.3% |
| South American | 65 | 0.6% |
| Spanish | 40 | 0.4% |
| Sri Lankan | 12 | 0.1% |
| Swedish | 47 | 0.5% |
| Swiss | 6 | 0.1% |
| Thai | 4 | 0.0% |
| Venezuelan | 19 | 0.2% |
| Welsh | 155 | 1.5% |
| Yugoslavian | 2 | 0.0% | View All 53 Rows |
Immigrants in Waynesville
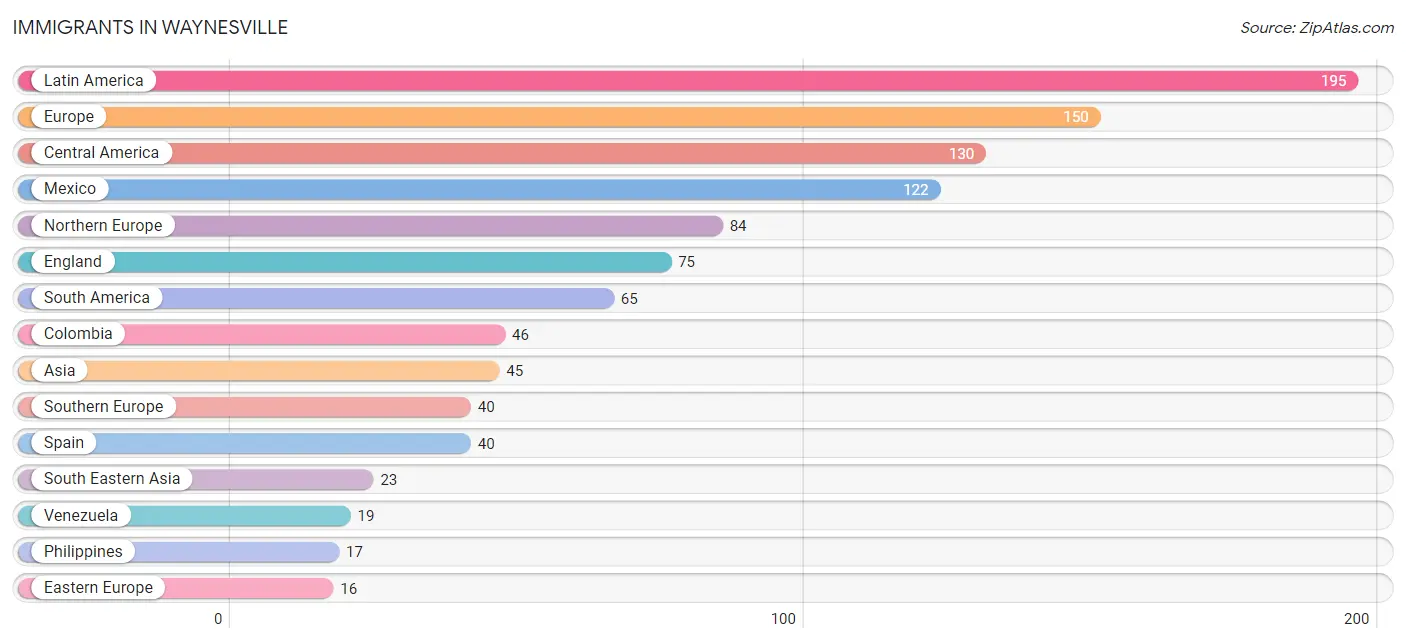
The most numerous immigrant groups reported in Waynesville came from Latin America (195 | 1.9%), Europe (150 | 1.5%), Central America (130 | 1.3%), Mexico (122 | 1.2%), and Northern Europe (84 | 0.8%), together accounting for 6.6% of all Waynesville residents.
| Immigration Origin | # Population | % Population |
| Asia | 45 | 0.4% |
| Central America | 130 | 1.3% |
| China | 11 | 0.1% |
| Colombia | 46 | 0.4% |
| Eastern Asia | 11 | 0.1% |
| Eastern Europe | 16 | 0.2% |
| El Salvador | 8 | 0.1% |
| England | 75 | 0.7% |
| Europe | 150 | 1.5% |
| Germany | 10 | 0.1% |
| India | 4 | 0.0% |
| Latin America | 195 | 1.9% |
| Latvia | 16 | 0.2% |
| Malaysia | 2 | 0.0% |
| Mexico | 122 | 1.2% |
| Northern Europe | 84 | 0.8% |
| Philippines | 17 | 0.2% |
| South America | 65 | 0.6% |
| South Central Asia | 11 | 0.1% |
| South Eastern Asia | 23 | 0.2% |
| Southern Europe | 40 | 0.4% |
| Spain | 40 | 0.4% |
| Sri Lanka | 7 | 0.1% |
| Sweden | 9 | 0.1% |
| Thailand | 4 | 0.0% |
| Venezuela | 19 | 0.2% |
| Western Europe | 10 | 0.1% | View All 27 Rows |
Sex and Age in Waynesville
Sex and Age in Waynesville
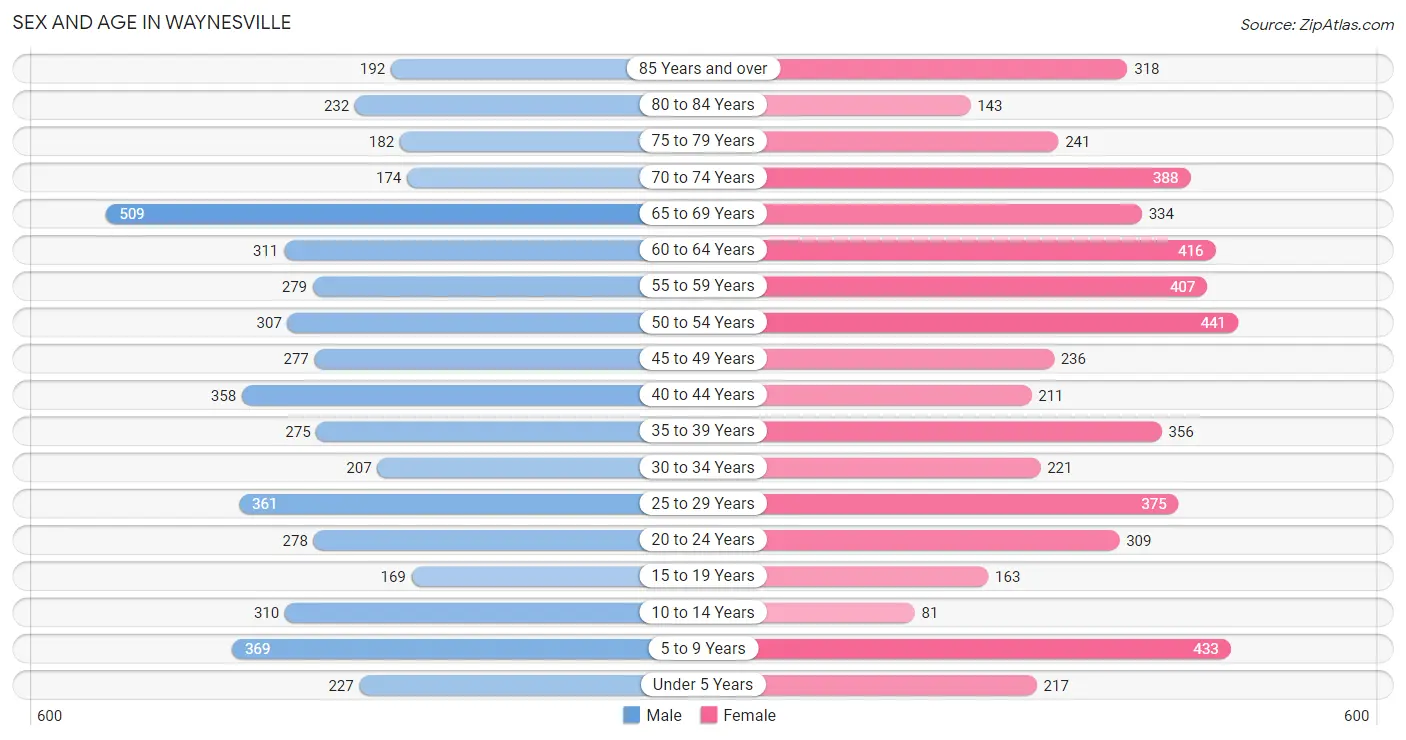
The most populous age groups in Waynesville are 65 to 69 Years (509 | 10.2%) for men and 50 to 54 Years (441 | 8.3%) for women.
| Age Bracket | Male | Female |
| Under 5 Years | 227 (4.5%) | 217 (4.1%) |
| 5 to 9 Years | 369 (7.3%) | 433 (8.2%) |
| 10 to 14 Years | 310 (6.2%) | 81 (1.5%) |
| 15 to 19 Years | 169 (3.4%) | 163 (3.1%) |
| 20 to 24 Years | 278 (5.5%) | 309 (5.8%) |
| 25 to 29 Years | 361 (7.2%) | 375 (7.1%) |
| 30 to 34 Years | 207 (4.1%) | 221 (4.2%) |
| 35 to 39 Years | 275 (5.5%) | 356 (6.7%) |
| 40 to 44 Years | 358 (7.1%) | 211 (4.0%) |
| 45 to 49 Years | 277 (5.5%) | 236 (4.5%) |
| 50 to 54 Years | 307 (6.1%) | 441 (8.3%) |
| 55 to 59 Years | 279 (5.6%) | 407 (7.7%) |
| 60 to 64 Years | 311 (6.2%) | 416 (7.9%) |
| 65 to 69 Years | 509 (10.2%) | 334 (6.3%) |
| 70 to 74 Years | 174 (3.5%) | 388 (7.3%) |
| 75 to 79 Years | 182 (3.6%) | 241 (4.6%) |
| 80 to 84 Years | 232 (4.6%) | 143 (2.7%) |
| 85 Years and over | 192 (3.8%) | 318 (6.0%) |
| Total | 5,017 (100.0%) | 5,290 (100.0%) |
Families and Households in Waynesville
Median Family Size in Waynesville
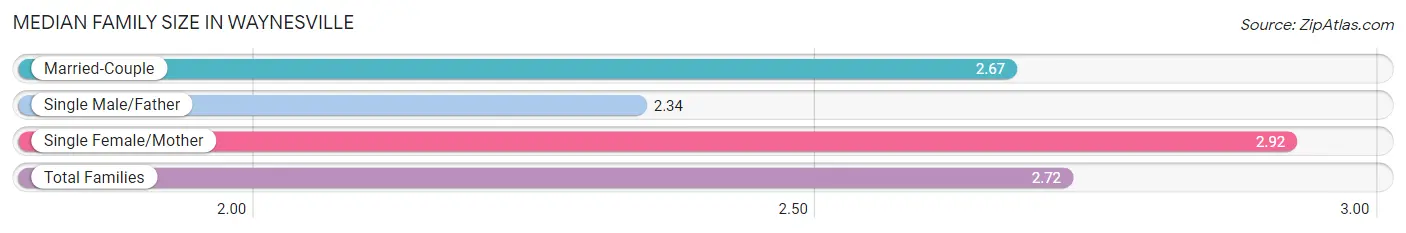
The median family size in Waynesville is 2.72 persons per family, with single female/mother families (668 | 24.5%) accounting for the largest median family size of 2.92 persons per family. On the other hand, single male/father families (87 | 3.2%) represent the smallest median family size with 2.34 persons per family.
| Family Type | # Families | Family Size |
| Married-Couple | 1,969 (72.3%) | 2.67 |
| Single Male/Father | 87 (3.2%) | 2.34 |
| Single Female/Mother | 668 (24.5%) | 2.92 |
| Total Families | 2,724 (100.0%) | 2.72 |
Median Household Size in Waynesville
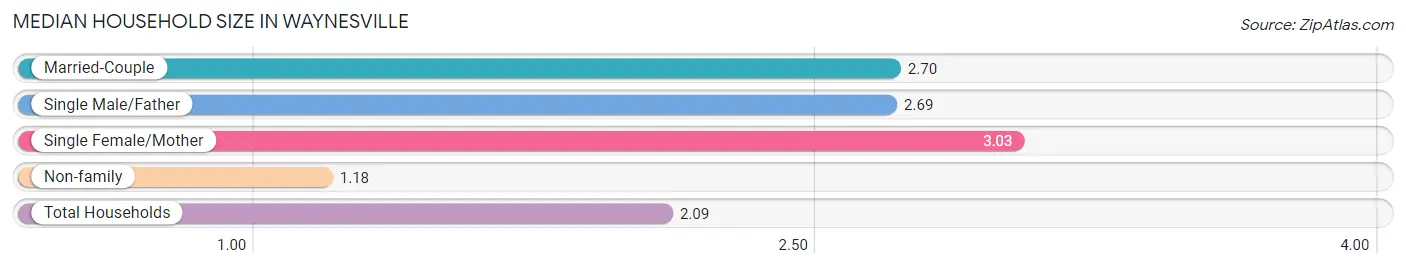
The median household size in Waynesville is 2.09 persons per household, with single female/mother households (668 | 13.9%) accounting for the largest median household size of 3.03 persons per household. non-family households (2,079 | 43.3%) represent the smallest median household size with 1.18 persons per household.
| Household Type | # Households | Household Size |
| Married-Couple | 1,969 (41.0%) | 2.70 |
| Single Male/Father | 87 (1.8%) | 2.69 |
| Single Female/Mother | 668 (13.9%) | 3.03 |
| Non-family | 2,079 (43.3%) | 1.18 |
| Total Households | 4,803 (100.0%) | 2.09 |
Household Size by Marriage Status in Waynesville
Out of a total of 4,803 households in Waynesville, 2,724 (56.7%) are family households, while 2,079 (43.3%) are nonfamily households. The most numerous type of family households are 2-person households, comprising 1,553, and the most common type of nonfamily households are 1-person households, comprising 1,826.
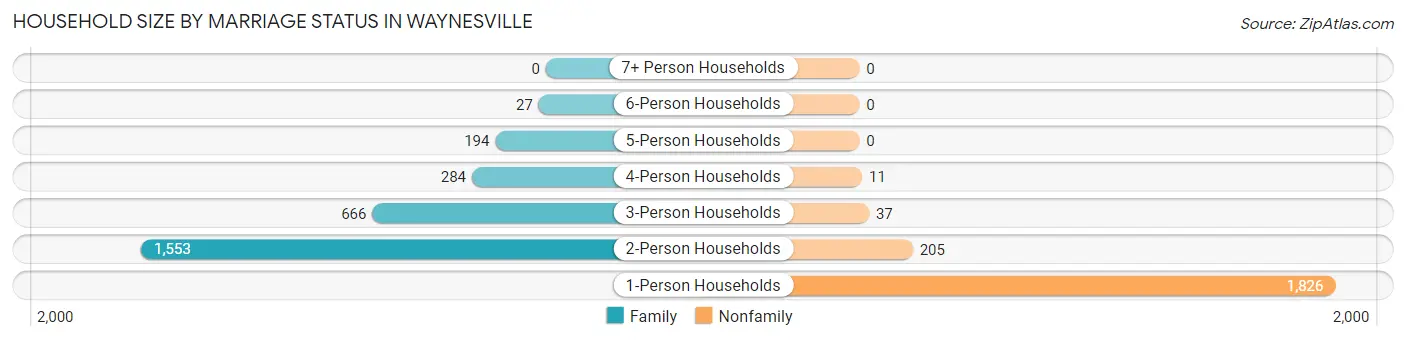
| Household Size | Family Households | Nonfamily Households |
| 1-Person Households | - | 1,826 (38.0%) |
| 2-Person Households | 1,553 (32.3%) | 205 (4.3%) |
| 3-Person Households | 666 (13.9%) | 37 (0.8%) |
| 4-Person Households | 284 (5.9%) | 11 (0.2%) |
| 5-Person Households | 194 (4.0%) | 0 (0.0%) |
| 6-Person Households | 27 (0.6%) | 0 (0.0%) |
| 7+ Person Households | 0 (0.0%) | 0 (0.0%) |
| Total | 2,724 (56.7%) | 2,079 (43.3%) |
Female Fertility in Waynesville
Fertility by Age in Waynesville
Average fertility rate in Waynesville is 23.0 births per 1,000 women. Women in the age bracket of 35 to 50 years have the highest fertility rate with 36.0 births per 1,000 women. Women in the age bracket of 35 to 50 years acount for 68.2% of all women with births.

| Age Bracket | Women with Births | Births / 1,000 Women |
| 15 to 19 years | 0 (0.0%) | 0.0 |
| 20 to 34 years | 14 (31.8%) | 15.0 |
| 35 to 50 years | 30 (68.2%) | 36.0 |
| Total | 44 (100.0%) | 23.0 |
Fertility by Age by Marriage Status in Waynesville
75.0% of women with births (44) in Waynesville are married. The highest percentage of unmarried women with births falls into 20 to 34 years age bracket with 78.6% of them unmarried at the time of birth, while the lowest percentage of unmarried women with births belong to 35 to 50 years age bracket with 0.0% of them unmarried.
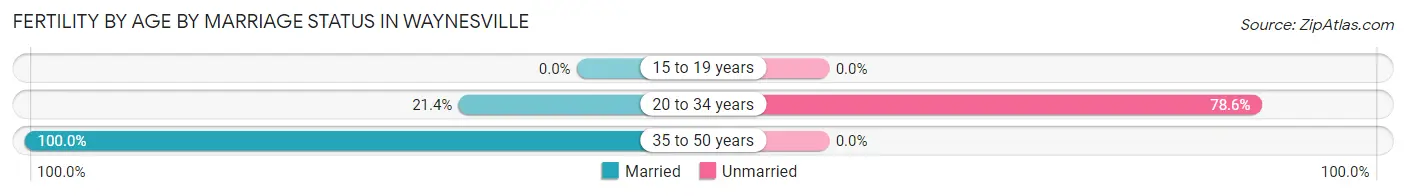
| Age Bracket | Married | Unmarried |
| 15 to 19 years | 0 (0.0%) | 0 (0.0%) |
| 20 to 34 years | 3 (21.4%) | 11 (78.6%) |
| 35 to 50 years | 30 (100.0%) | 0 (0.0%) |
| Total | 33 (75.0%) | 11 (25.0%) |
Fertility by Education in Waynesville
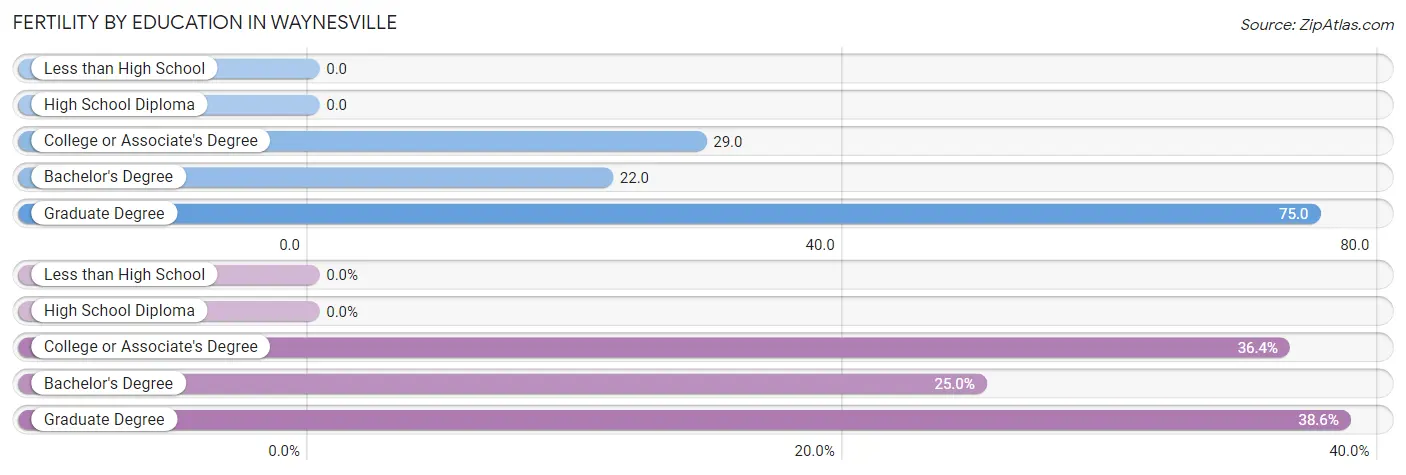
| Educational Attainment | Women with Births | Births / 1,000 Women |
| Less than High School | 0 (0.0%) | 0.0 |
| High School Diploma | 0 (0.0%) | 0.0 |
| College or Associate's Degree | 16 (36.4%) | 29.0 |
| Bachelor's Degree | 11 (25.0%) | 22.0 |
| Graduate Degree | 17 (38.6%) | 75.0 |
| Total | 44 (100.0%) | 23.0 |
Fertility by Education by Marriage Status in Waynesville
25.0% of women with births in Waynesville are unmarried. Women with the educational attainment of bachelor's degree are most likely to be married with 100.0% of them married at childbirth, while women with the educational attainment of college or associate's degree are least likely to be married with 68.8% of them unmarried at childbirth.
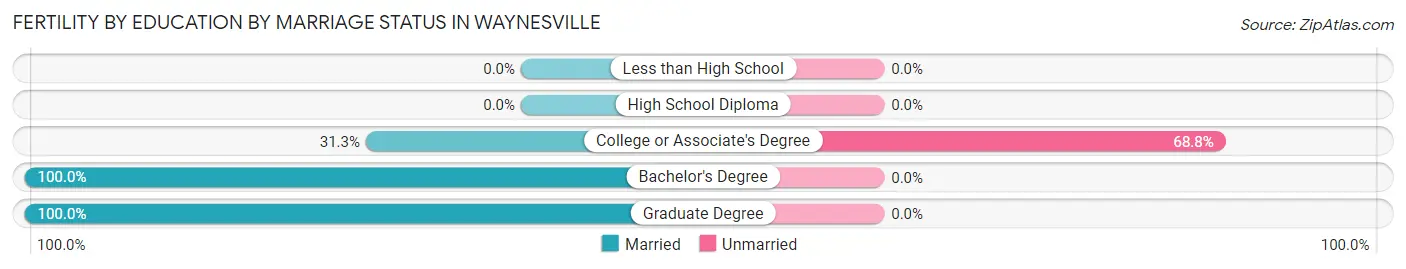
| Educational Attainment | Married | Unmarried |
| Less than High School | 0 (0.0%) | 0 (0.0%) |
| High School Diploma | 0 (0.0%) | 0 (0.0%) |
| College or Associate's Degree | 5 (31.2%) | 11 (68.8%) |
| Bachelor's Degree | 11 (100.0%) | 0 (0.0%) |
| Graduate Degree | 17 (100.0%) | 0 (0.0%) |
| Total | 33 (75.0%) | 11 (25.0%) |
Employment Characteristics in Waynesville
Employment by Class of Employer in Waynesville
Among the 4,475 employed individuals in Waynesville, private company employees (2,625 | 58.7%), local government employees (448 | 10.0%), and self-employed (not incorporated) (410 | 9.2%) make up the most common classes of employment.
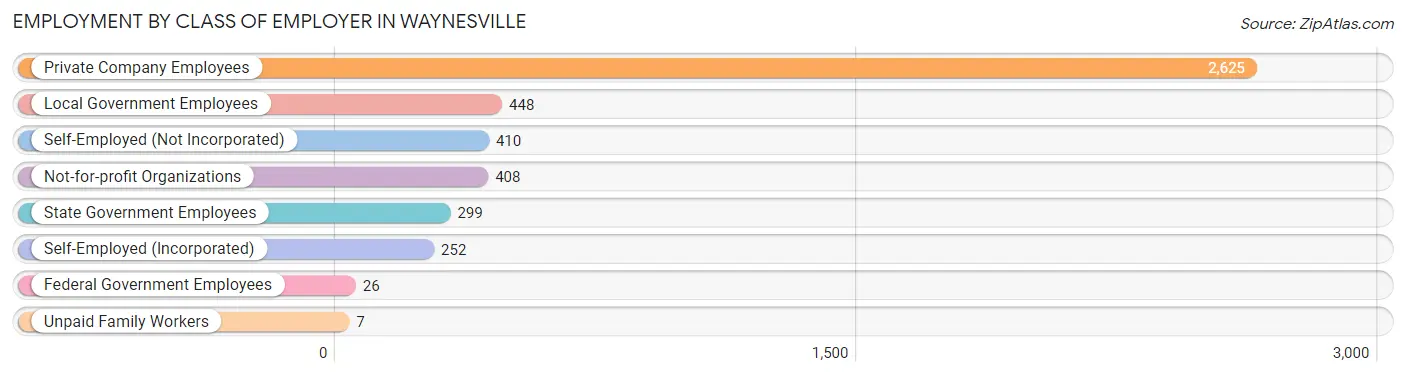
| Employer Class | # Employees | % Employees |
| Private Company Employees | 2,625 | 58.7% |
| Self-Employed (Incorporated) | 252 | 5.6% |
| Self-Employed (Not Incorporated) | 410 | 9.2% |
| Not-for-profit Organizations | 408 | 9.1% |
| Local Government Employees | 448 | 10.0% |
| State Government Employees | 299 | 6.7% |
| Federal Government Employees | 26 | 0.6% |
| Unpaid Family Workers | 7 | 0.2% |
| Total | 4,475 | 100.0% |
Employment Status by Age in Waynesville
According to the labor force statistics for Waynesville, out of the total population over 16 years of age (8,553), 56.4% or 4,824 individuals are in the labor force, with 2.3% or 111 of them unemployed. The age group with the highest labor force participation rate is 25 to 29 years, with 94.8% or 698 individuals in the labor force. Within the labor force, the 20 to 24 years age range has the highest percentage of unemployed individuals, with 6.2% or 29 of them being unemployed.
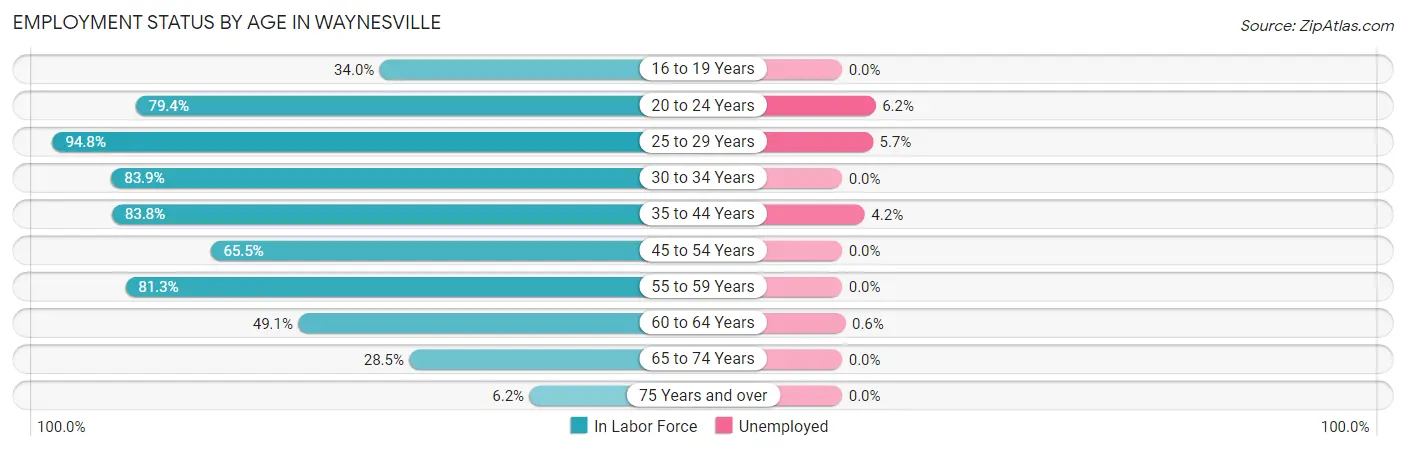
| Age Bracket | In Labor Force | Unemployed |
| 16 to 19 Years | 73 (34.0%) | 0 (0.0%) |
| 20 to 24 Years | 466 (79.4%) | 29 (6.2%) |
| 25 to 29 Years | 698 (94.8%) | 40 (5.7%) |
| 30 to 34 Years | 359 (83.9%) | 0 (0.0%) |
| 35 to 44 Years | 1,006 (83.8%) | 42 (4.2%) |
| 45 to 54 Years | 826 (65.5%) | 0 (0.0%) |
| 55 to 59 Years | 558 (81.3%) | 0 (0.0%) |
| 60 to 64 Years | 357 (49.1%) | 2 (0.6%) |
| 65 to 74 Years | 400 (28.5%) | 0 (0.0%) |
| 75 Years and over | 81 (6.2%) | 0 (0.0%) |
| Total | 4,824 (56.4%) | 111 (2.3%) |
Employment Status by Educational Attainment in Waynesville
According to labor force statistics for Waynesville, 75.5% of individuals (3,804) out of the total population between 25 and 64 years of age (5,038) are in the labor force, with 2.2% or 84 of them being unemployed. The group with the highest labor force participation rate are those with the educational attainment of bachelor's degree or higher, with 81.9% or 1,357 individuals in the labor force. Within the labor force, individuals with high school diploma education have the highest percentage of unemployment, with 7.4% or 55 of them being unemployed.
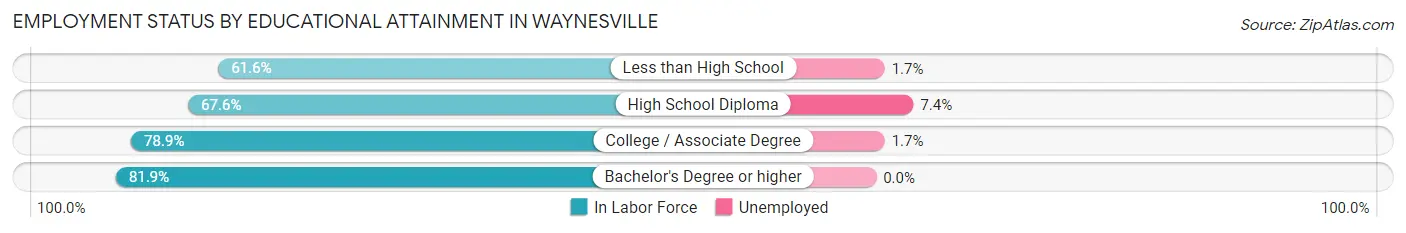
| Educational Attainment | In Labor Force | Unemployed |
| Less than High School | 344 (61.6%) | 9 (1.7%) |
| High School Diploma | 748 (67.6%) | 82 (7.4%) |
| College / Associate Degree | 1,355 (78.9%) | 29 (1.7%) |
| Bachelor's Degree or higher | 1,357 (81.9%) | 0 (0.0%) |
| Total | 3,804 (75.5%) | 111 (2.2%) |
Employment Occupations by Sex in Waynesville
Management, Business, Science and Arts Occupations
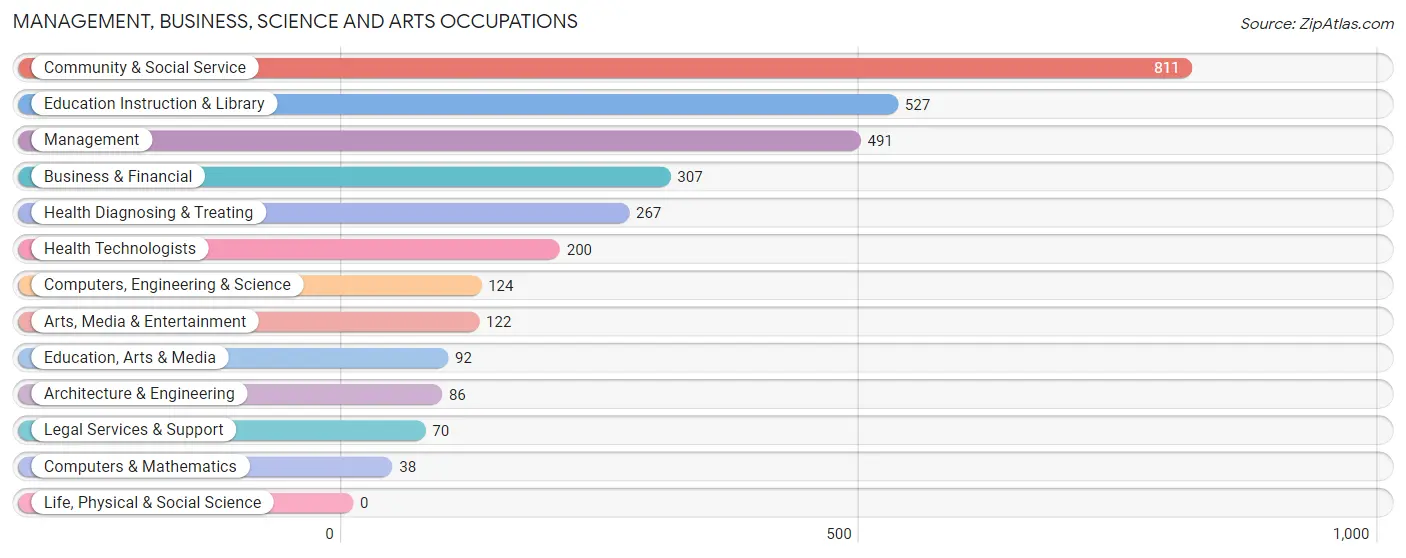
The most common Management, Business, Science and Arts occupations in Waynesville are Community & Social Service (811 | 17.2%), Education Instruction & Library (527 | 11.2%), Management (491 | 10.4%), Business & Financial (307 | 6.5%), and Health Diagnosing & Treating (267 | 5.7%).
Management, Business, Science and Arts Occupations by Sex
Within the Management, Business, Science and Arts occupations in Waynesville, the most male-oriented occupations are Architecture & Engineering (100.0%), Computers, Engineering & Science (88.7%), and Management (66.2%), while the most female-oriented occupations are Education, Arts & Media (100.0%), Education Instruction & Library (84.1%), and Community & Social Service (79.4%).
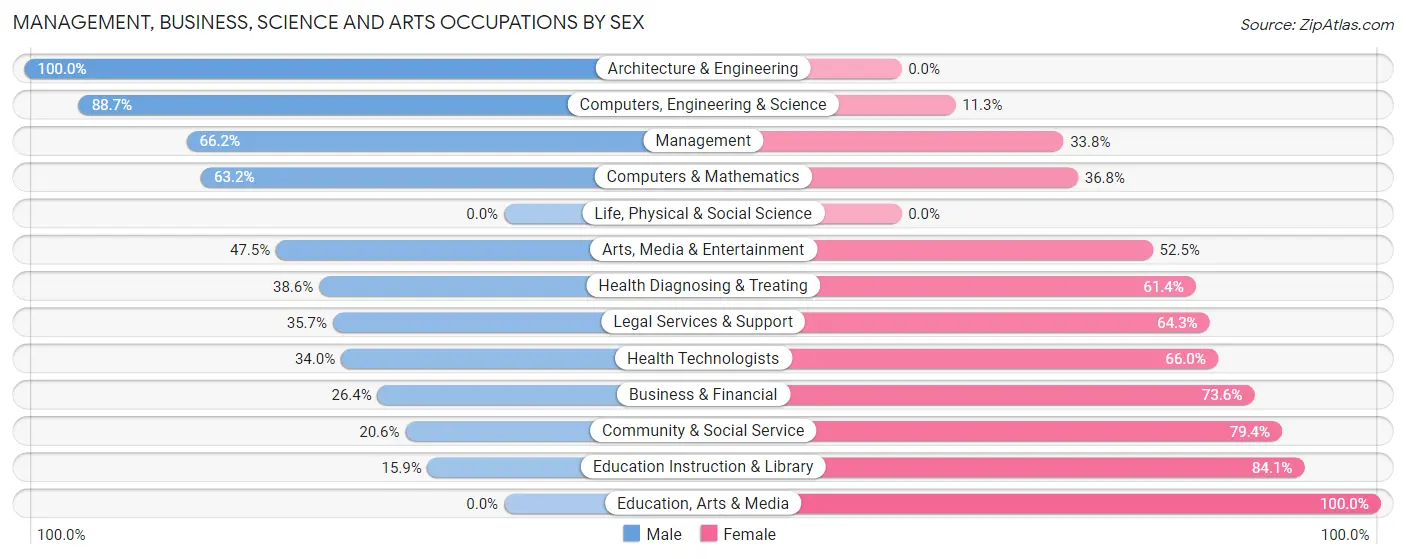
| Occupation | Male | Female |
| Management | 325 (66.2%) | 166 (33.8%) |
| Business & Financial | 81 (26.4%) | 226 (73.6%) |
| Computers, Engineering & Science | 110 (88.7%) | 14 (11.3%) |
| Computers & Mathematics | 24 (63.2%) | 14 (36.8%) |
| Architecture & Engineering | 86 (100.0%) | 0 (0.0%) |
| Life, Physical & Social Science | 0 (0.0%) | 0 (0.0%) |
| Community & Social Service | 167 (20.6%) | 644 (79.4%) |
| Education, Arts & Media | 0 (0.0%) | 92 (100.0%) |
| Legal Services & Support | 25 (35.7%) | 45 (64.3%) |
| Education Instruction & Library | 84 (15.9%) | 443 (84.1%) |
| Arts, Media & Entertainment | 58 (47.5%) | 64 (52.5%) |
| Health Diagnosing & Treating | 103 (38.6%) | 164 (61.4%) |
| Health Technologists | 68 (34.0%) | 132 (66.0%) |
| Total (Category) | 786 (39.3%) | 1,214 (60.7%) |
| Total (Overall) | 2,266 (48.1%) | 2,445 (51.9%) |
Services Occupations
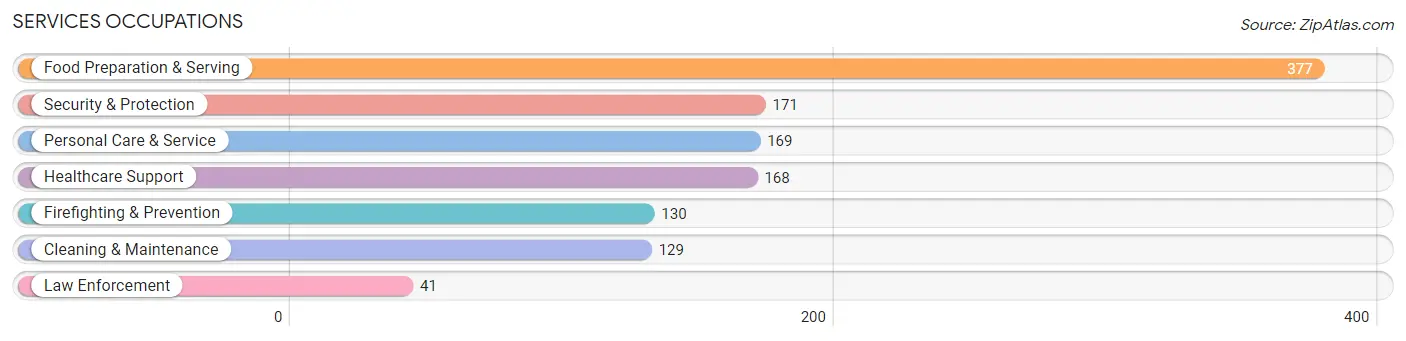
The most common Services occupations in Waynesville are Food Preparation & Serving (377 | 8.0%), Security & Protection (171 | 3.6%), Personal Care & Service (169 | 3.6%), Healthcare Support (168 | 3.6%), and Firefighting & Prevention (130 | 2.8%).
Services Occupations by Sex
Within the Services occupations in Waynesville, the most male-oriented occupations are Law Enforcement (100.0%), Cleaning & Maintenance (52.7%), and Food Preparation & Serving (47.5%), while the most female-oriented occupations are Healthcare Support (86.9%), Firefighting & Prevention (84.6%), and Personal Care & Service (71.6%).
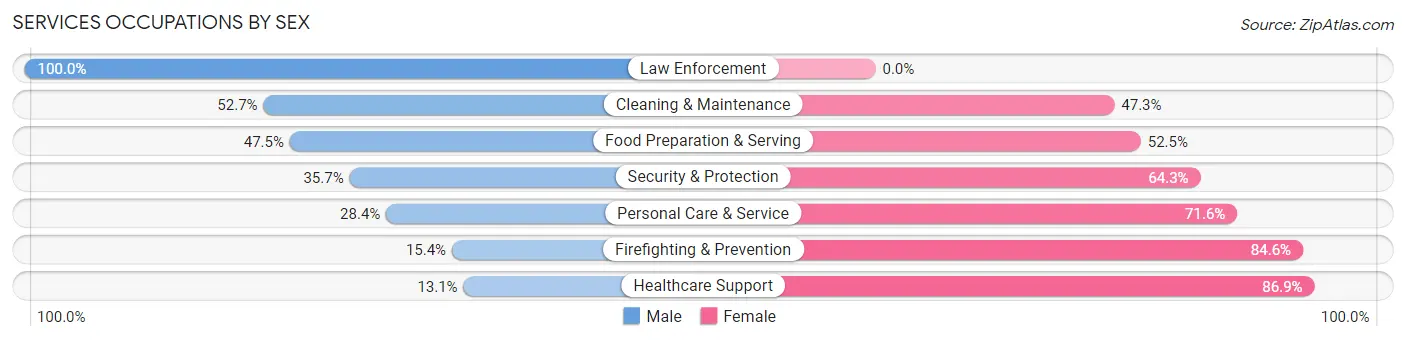
| Occupation | Male | Female |
| Healthcare Support | 22 (13.1%) | 146 (86.9%) |
| Security & Protection | 61 (35.7%) | 110 (64.3%) |
| Firefighting & Prevention | 20 (15.4%) | 110 (84.6%) |
| Law Enforcement | 41 (100.0%) | 0 (0.0%) |
| Food Preparation & Serving | 179 (47.5%) | 198 (52.5%) |
| Cleaning & Maintenance | 68 (52.7%) | 61 (47.3%) |
| Personal Care & Service | 48 (28.4%) | 121 (71.6%) |
| Total (Category) | 378 (37.3%) | 636 (62.7%) |
| Total (Overall) | 2,266 (48.1%) | 2,445 (51.9%) |
Sales and Office Occupations
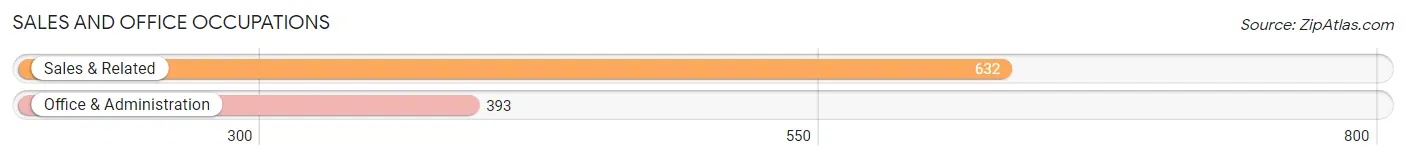
The most common Sales and Office occupations in Waynesville are Sales & Related (632 | 13.4%), and Office & Administration (393 | 8.3%).
Sales and Office Occupations by Sex
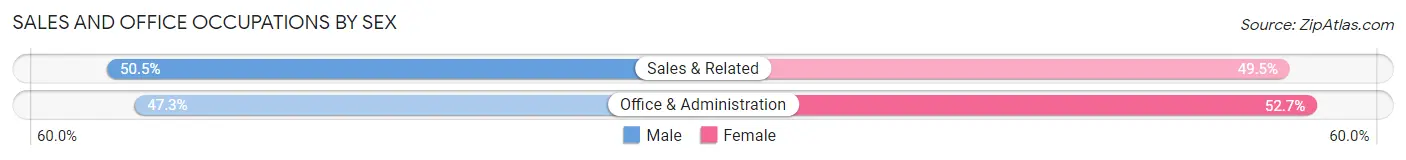
| Occupation | Male | Female |
| Sales & Related | 319 (50.5%) | 313 (49.5%) |
| Office & Administration | 186 (47.3%) | 207 (52.7%) |
| Total (Category) | 505 (49.3%) | 520 (50.7%) |
| Total (Overall) | 2,266 (48.1%) | 2,445 (51.9%) |
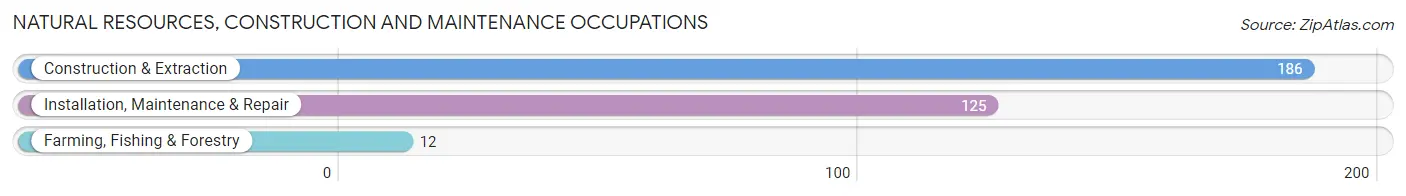
Natural Resources, Construction and Maintenance Occupations
The most common Natural Resources, Construction and Maintenance occupations in Waynesville are Construction & Extraction (186 | 4.0%), Installation, Maintenance & Repair (125 | 2.6%), and Farming, Fishing & Forestry (12 | 0.3%).
Natural Resources, Construction and Maintenance Occupations by Sex
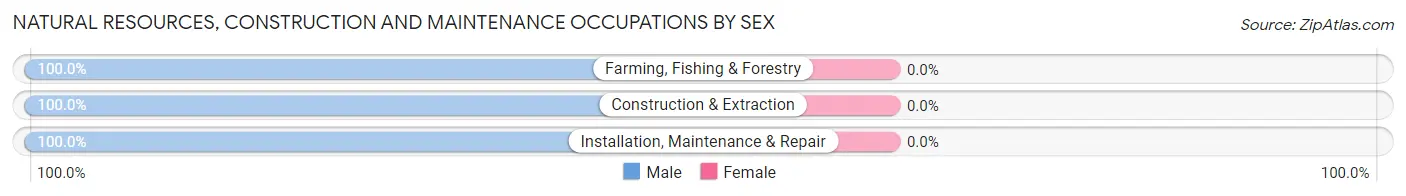
| Occupation | Male | Female |
| Farming, Fishing & Forestry | 12 (100.0%) | 0 (0.0%) |
| Construction & Extraction | 186 (100.0%) | 0 (0.0%) |
| Installation, Maintenance & Repair | 125 (100.0%) | 0 (0.0%) |
| Total (Category) | 323 (100.0%) | 0 (0.0%) |
| Total (Overall) | 2,266 (48.1%) | 2,445 (51.9%) |
Production, Transportation and Moving Occupations
The most common Production, Transportation and Moving occupations in Waynesville are Production (208 | 4.4%), Transportation (75 | 1.6%), and Material Moving (66 | 1.4%).
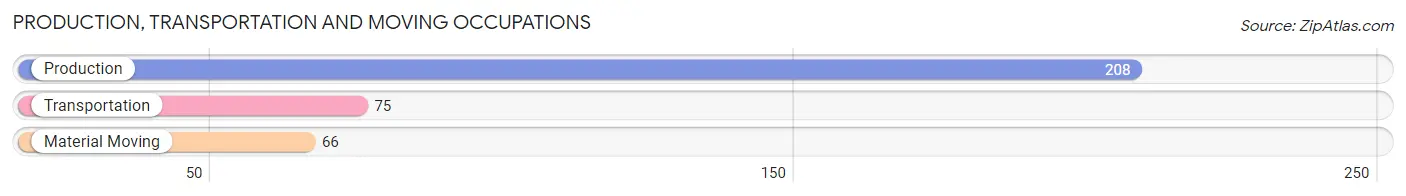
Production, Transportation and Moving Occupations by Sex
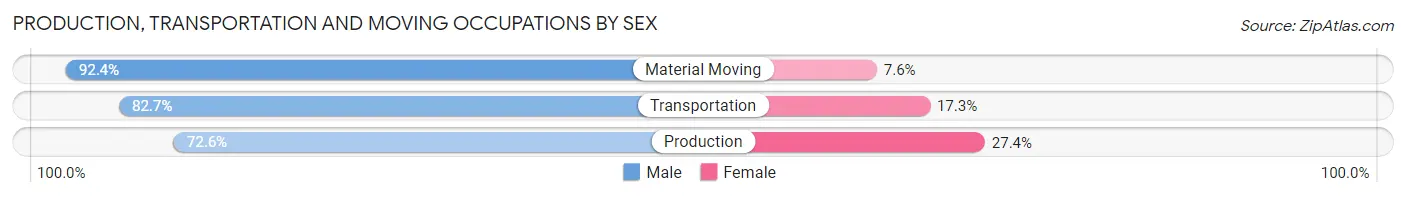
| Occupation | Male | Female |
| Production | 151 (72.6%) | 57 (27.4%) |
| Transportation | 62 (82.7%) | 13 (17.3%) |
| Material Moving | 61 (92.4%) | 5 (7.6%) |
| Total (Category) | 274 (78.5%) | 75 (21.5%) |
| Total (Overall) | 2,266 (48.1%) | 2,445 (51.9%) |
Employment Industries by Sex in Waynesville
Employment Industries in Waynesville
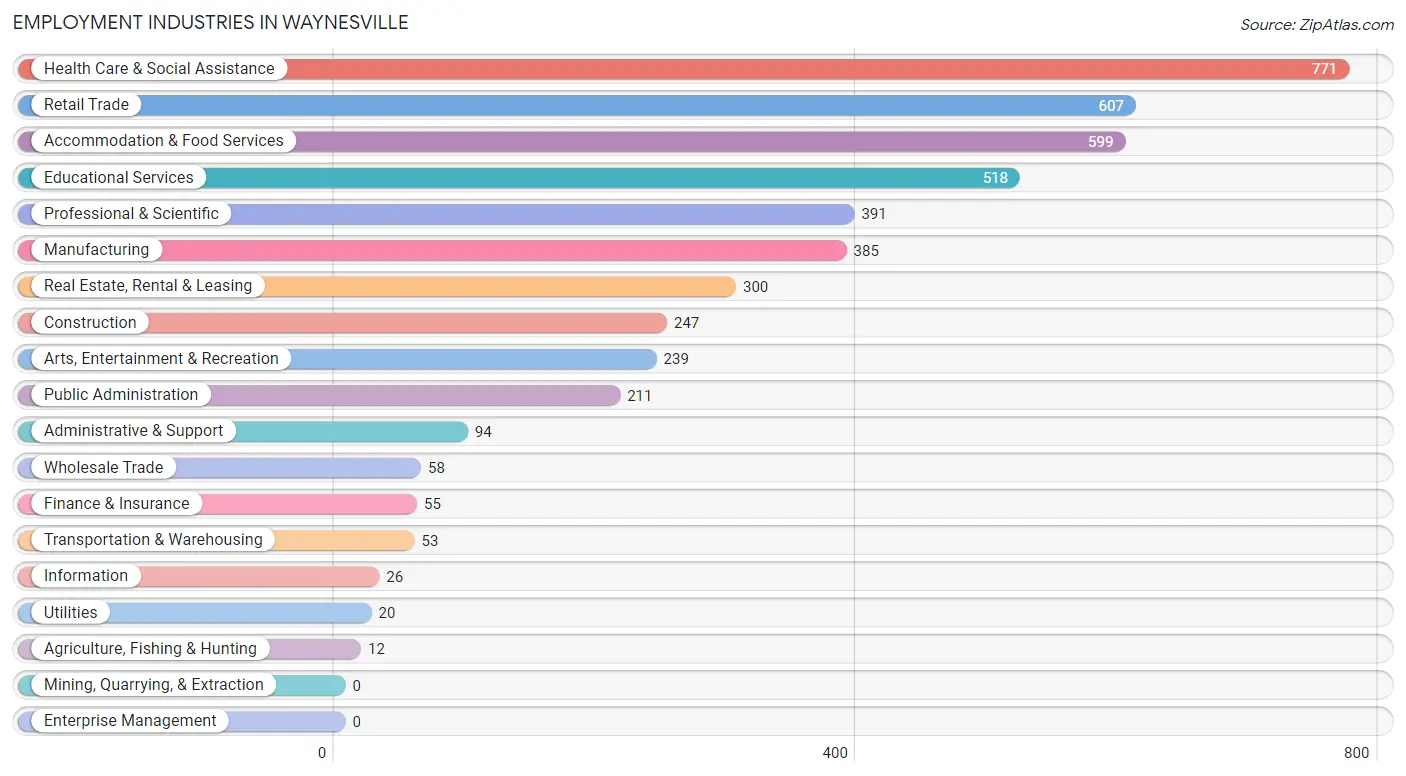
The major employment industries in Waynesville include Health Care & Social Assistance (771 | 16.4%), Retail Trade (607 | 12.9%), Accommodation & Food Services (599 | 12.7%), Educational Services (518 | 11.0%), and Professional & Scientific (391 | 8.3%).
Employment Industries by Sex in Waynesville
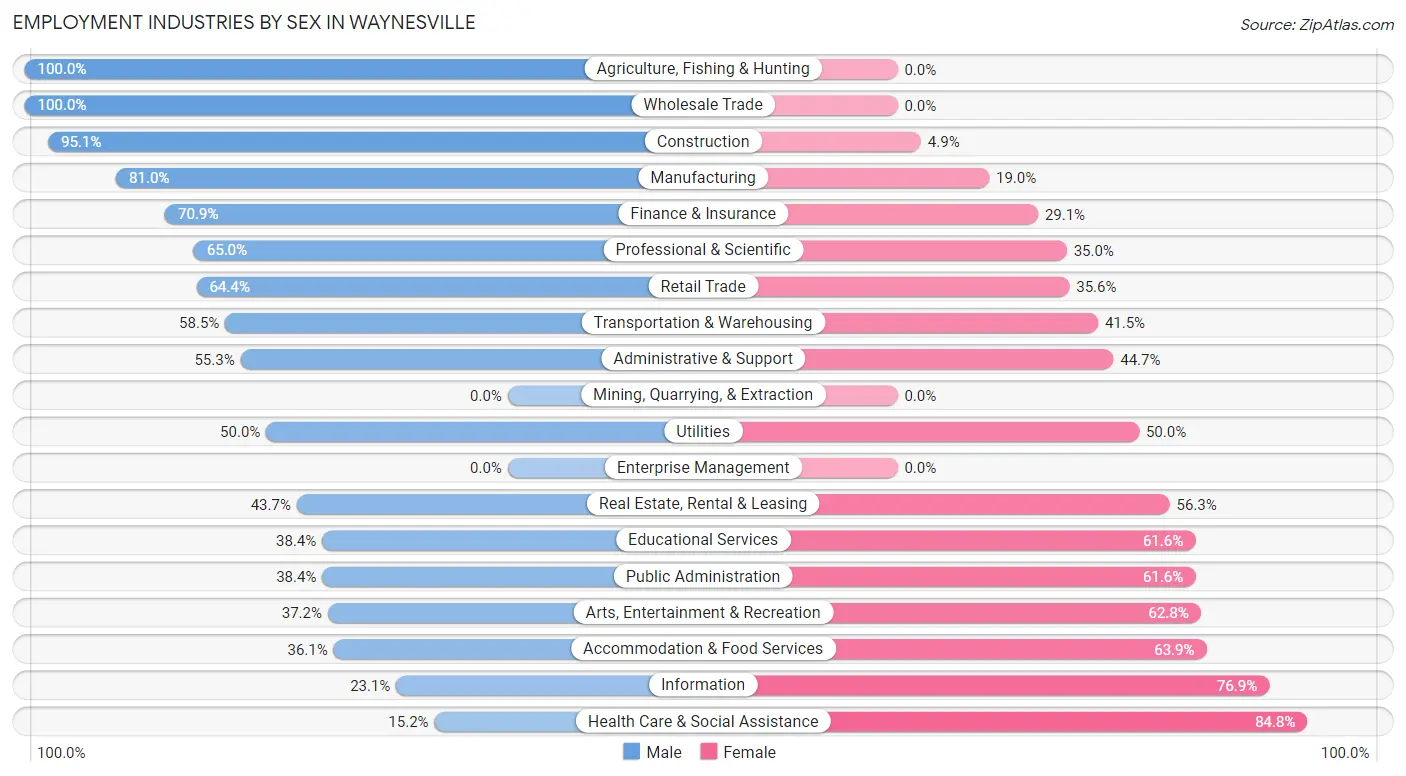
The Waynesville industries that see more men than women are Agriculture, Fishing & Hunting (100.0%), Wholesale Trade (100.0%), and Construction (95.1%), whereas the industries that tend to have a higher number of women are Health Care & Social Assistance (84.8%), Information (76.9%), and Accommodation & Food Services (63.9%).
| Industry | Male | Female |
| Agriculture, Fishing & Hunting | 12 (100.0%) | 0 (0.0%) |
| Mining, Quarrying, & Extraction | 0 (0.0%) | 0 (0.0%) |
| Construction | 235 (95.1%) | 12 (4.9%) |
| Manufacturing | 312 (81.0%) | 73 (19.0%) |
| Wholesale Trade | 58 (100.0%) | 0 (0.0%) |
| Retail Trade | 391 (64.4%) | 216 (35.6%) |
| Transportation & Warehousing | 31 (58.5%) | 22 (41.5%) |
| Utilities | 10 (50.0%) | 10 (50.0%) |
| Information | 6 (23.1%) | 20 (76.9%) |
| Finance & Insurance | 39 (70.9%) | 16 (29.1%) |
| Real Estate, Rental & Leasing | 131 (43.7%) | 169 (56.3%) |
| Professional & Scientific | 254 (65.0%) | 137 (35.0%) |
| Enterprise Management | 0 (0.0%) | 0 (0.0%) |
| Administrative & Support | 52 (55.3%) | 42 (44.7%) |
| Educational Services | 199 (38.4%) | 319 (61.6%) |
| Health Care & Social Assistance | 117 (15.2%) | 654 (84.8%) |
| Arts, Entertainment & Recreation | 89 (37.2%) | 150 (62.8%) |
| Accommodation & Food Services | 216 (36.1%) | 383 (63.9%) |
| Public Administration | 81 (38.4%) | 130 (61.6%) |
| Total | 2,266 (48.1%) | 2,445 (51.9%) |
Education in Waynesville
School Enrollment in Waynesville
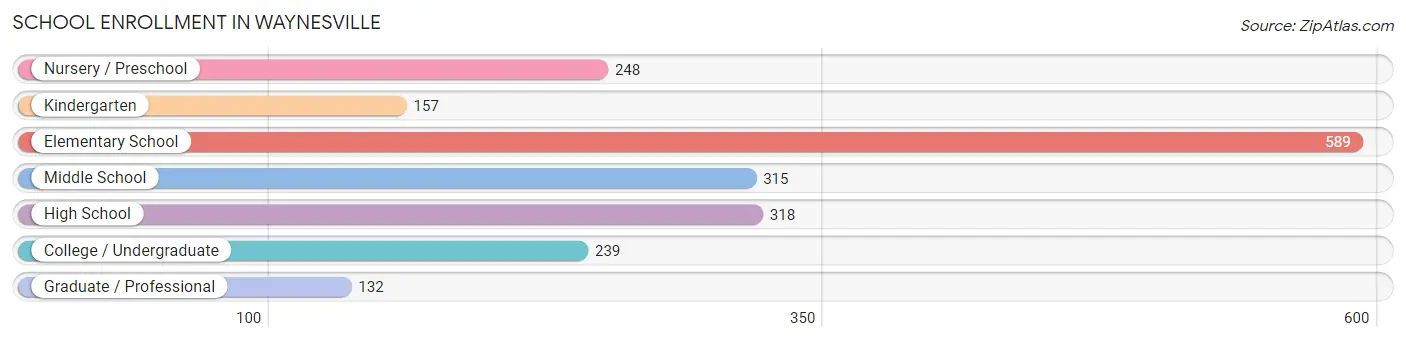
The most common levels of schooling among the 1,998 students in Waynesville are elementary school (589 | 29.5%), high school (318 | 15.9%), and middle school (315 | 15.8%).
| School Level | # Students | % Students |
| Nursery / Preschool | 248 | 12.4% |
| Kindergarten | 157 | 7.9% |
| Elementary School | 589 | 29.5% |
| Middle School | 315 | 15.8% |
| High School | 318 | 15.9% |
| College / Undergraduate | 239 | 12.0% |
| Graduate / Professional | 132 | 6.6% |
| Total | 1,998 | 100.0% |
School Enrollment by Age by Funding Source in Waynesville
Out of a total of 1,998 students who are enrolled in schools in Waynesville, 378 (18.9%) attend a private institution, while the remaining 1,620 (81.1%) are enrolled in public schools. The age group of 3 to 4 year olds has the highest likelihood of being enrolled in private schools, with 138 (67.6% in the age bracket) enrolled. Conversely, the age group of 18 to 19 year olds has the lowest likelihood of being enrolled in a private school, with 50 (100.0% in the age bracket) attending a public institution.
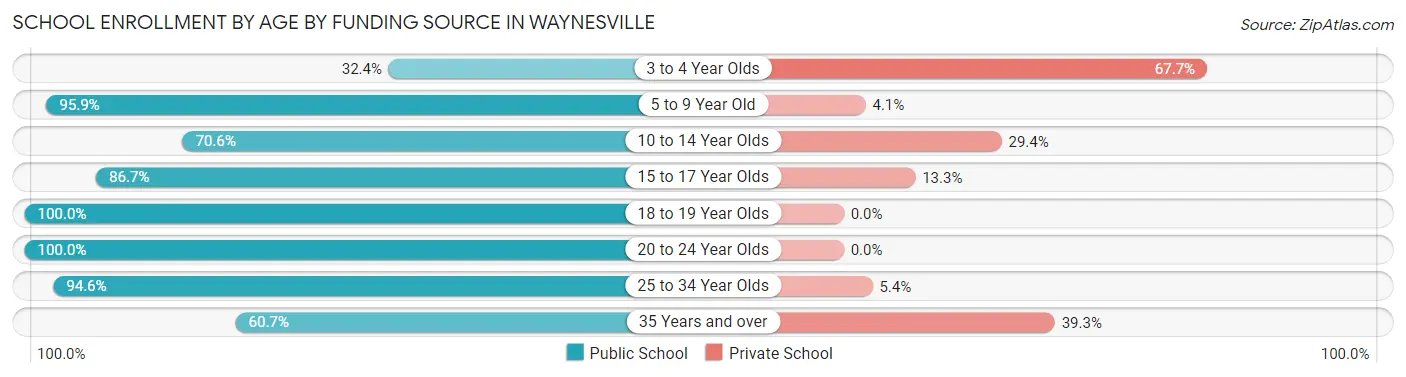
| Age Bracket | Public School | Private School |
| 3 to 4 Year Olds | 66 (32.4%) | 138 (67.6%) |
| 5 to 9 Year Old | 730 (95.9%) | 31 (4.1%) |
| 10 to 14 Year Olds | 276 (70.6%) | 115 (29.4%) |
| 15 to 17 Year Olds | 195 (86.7%) | 30 (13.3%) |
| 18 to 19 Year Olds | 50 (100.0%) | 0 (0.0%) |
| 20 to 24 Year Olds | 110 (100.0%) | 0 (0.0%) |
| 25 to 34 Year Olds | 106 (94.6%) | 6 (5.4%) |
| 35 Years and over | 88 (60.7%) | 57 (39.3%) |
| Total | 1,620 (81.1%) | 378 (18.9%) |
Educational Attainment by Field of Study in Waynesville
Business (605 | 21.6%), education (540 | 19.3%), science & technology (272 | 9.7%), social sciences (211 | 7.5%), and liberal arts & history (195 | 7.0%) are the most common fields of study among 2,805 individuals in Waynesville who have obtained a bachelor's degree or higher.
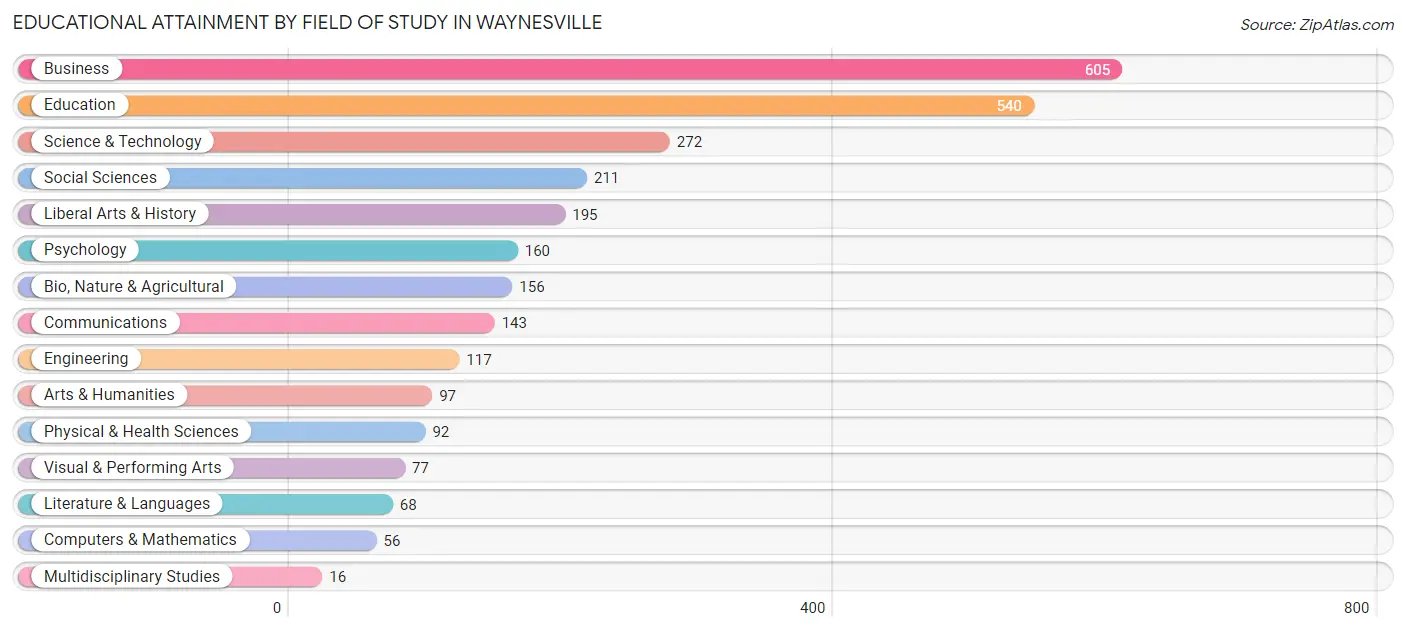
| Field of Study | # Graduates | % Graduates |
| Computers & Mathematics | 56 | 2.0% |
| Bio, Nature & Agricultural | 156 | 5.6% |
| Physical & Health Sciences | 92 | 3.3% |
| Psychology | 160 | 5.7% |
| Social Sciences | 211 | 7.5% |
| Engineering | 117 | 4.2% |
| Multidisciplinary Studies | 16 | 0.6% |
| Science & Technology | 272 | 9.7% |
| Business | 605 | 21.6% |
| Education | 540 | 19.3% |
| Literature & Languages | 68 | 2.4% |
| Liberal Arts & History | 195 | 7.0% |
| Visual & Performing Arts | 77 | 2.8% |
| Communications | 143 | 5.1% |
| Arts & Humanities | 97 | 3.5% |
| Total | 2,805 | 100.0% |
Transportation & Commute in Waynesville
Vehicle Availability by Sex in Waynesville
The most prevalent vehicle ownership categories in Waynesville are males with 2 vehicles (953, accounting for 45.3%) and females with 2 vehicles (876, making up 40.4%).
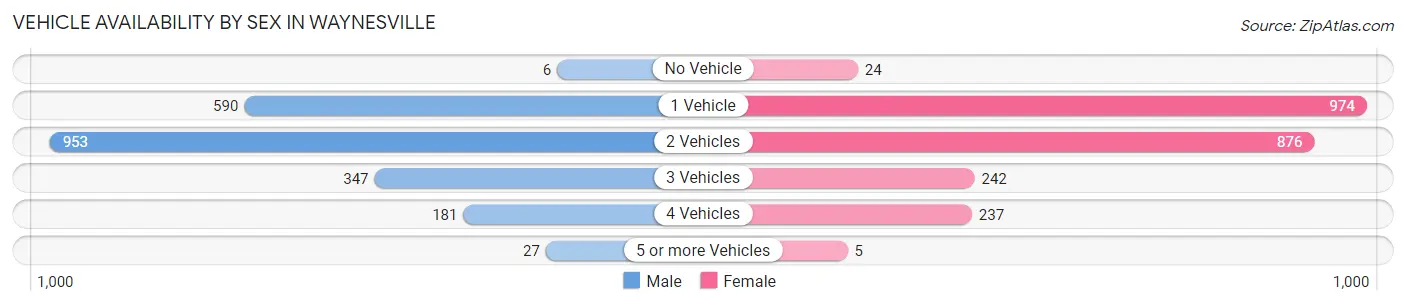
| Vehicles Available | Male | Female |
| No Vehicle | 6 (0.3%) | 24 (1.0%) |
| 1 Vehicle | 590 (28.0%) | 974 (41.3%) |
| 2 Vehicles | 953 (45.3%) | 876 (37.1%) |
| 3 Vehicles | 347 (16.5%) | 242 (10.3%) |
| 4 Vehicles | 181 (8.6%) | 237 (10.1%) |
| 5 or more Vehicles | 27 (1.3%) | 5 (0.2%) |
| Total | 2,104 (100.0%) | 2,358 (100.0%) |
Commute Time in Waynesville
The most frequently occuring commute durations in Waynesville are 10 to 14 minutes (886 commuters, 22.0%), 5 to 9 minutes (813 commuters, 20.2%), and 30 to 34 minutes (614 commuters, 15.2%).
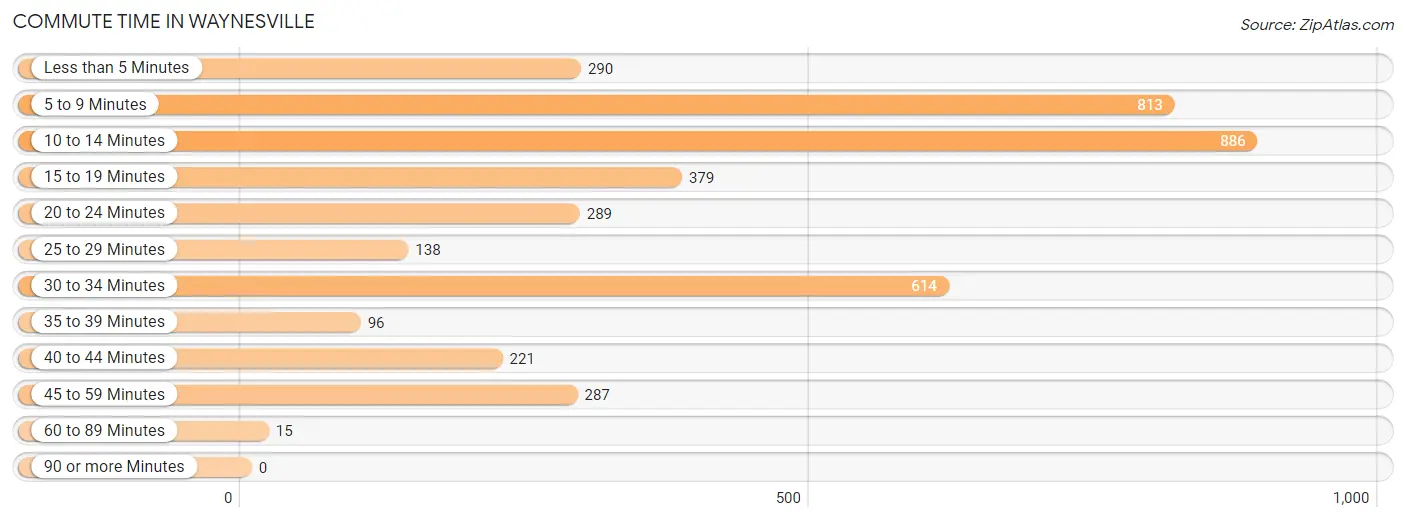
| Commute Time | # Commuters | % Commuters |
| Less than 5 Minutes | 290 | 7.2% |
| 5 to 9 Minutes | 813 | 20.2% |
| 10 to 14 Minutes | 886 | 22.0% |
| 15 to 19 Minutes | 379 | 9.4% |
| 20 to 24 Minutes | 289 | 7.2% |
| 25 to 29 Minutes | 138 | 3.4% |
| 30 to 34 Minutes | 614 | 15.2% |
| 35 to 39 Minutes | 96 | 2.4% |
| 40 to 44 Minutes | 221 | 5.5% |
| 45 to 59 Minutes | 287 | 7.1% |
| 60 to 89 Minutes | 15 | 0.4% |
| 90 or more Minutes | 0 | 0.0% |
Commute Time by Sex in Waynesville
The most common commute times in Waynesville are 30 to 34 minutes (370 commuters, 20.6%) for males and 5 to 9 minutes (548 commuters, 24.5%) for females.
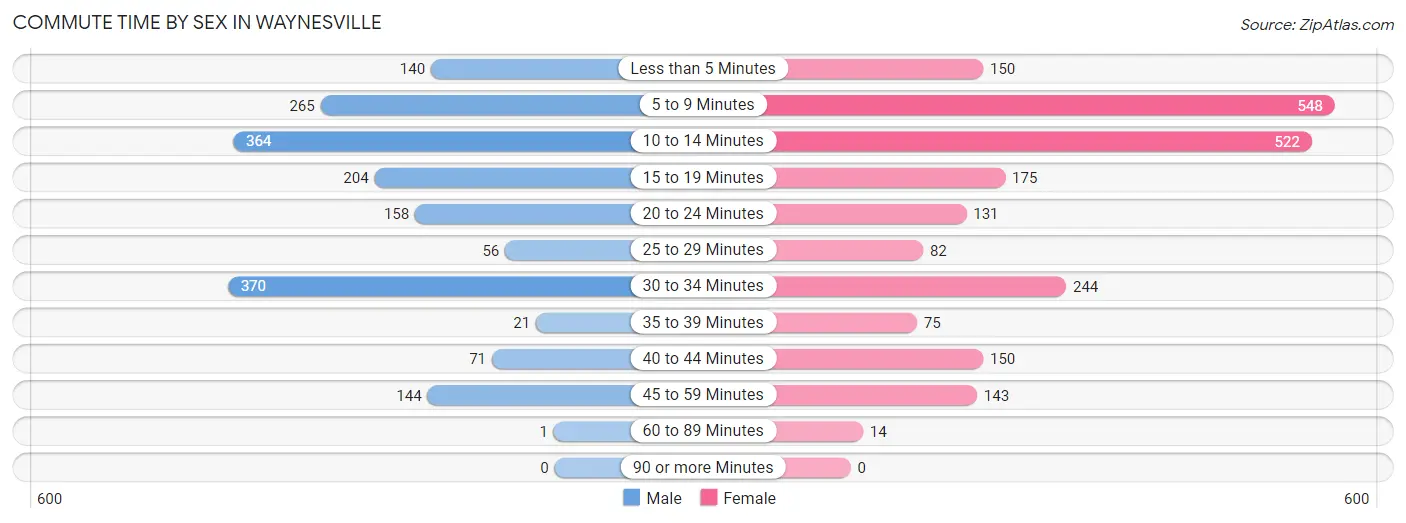
| Commute Time | Male | Female |
| Less than 5 Minutes | 140 (7.8%) | 150 (6.7%) |
| 5 to 9 Minutes | 265 (14.8%) | 548 (24.5%) |
| 10 to 14 Minutes | 364 (20.3%) | 522 (23.4%) |
| 15 to 19 Minutes | 204 (11.4%) | 175 (7.8%) |
| 20 to 24 Minutes | 158 (8.8%) | 131 (5.9%) |
| 25 to 29 Minutes | 56 (3.1%) | 82 (3.7%) |
| 30 to 34 Minutes | 370 (20.6%) | 244 (10.9%) |
| 35 to 39 Minutes | 21 (1.2%) | 75 (3.4%) |
| 40 to 44 Minutes | 71 (4.0%) | 150 (6.7%) |
| 45 to 59 Minutes | 144 (8.0%) | 143 (6.4%) |
| 60 to 89 Minutes | 1 (0.1%) | 14 (0.6%) |
| 90 or more Minutes | 0 (0.0%) | 0 (0.0%) |
Time of Departure to Work by Sex in Waynesville
The most frequent times of departure to work in Waynesville are 7:00 AM to 7:29 AM (313, 17.4%) for males and 7:30 AM to 7:59 AM (564, 25.3%) for females.
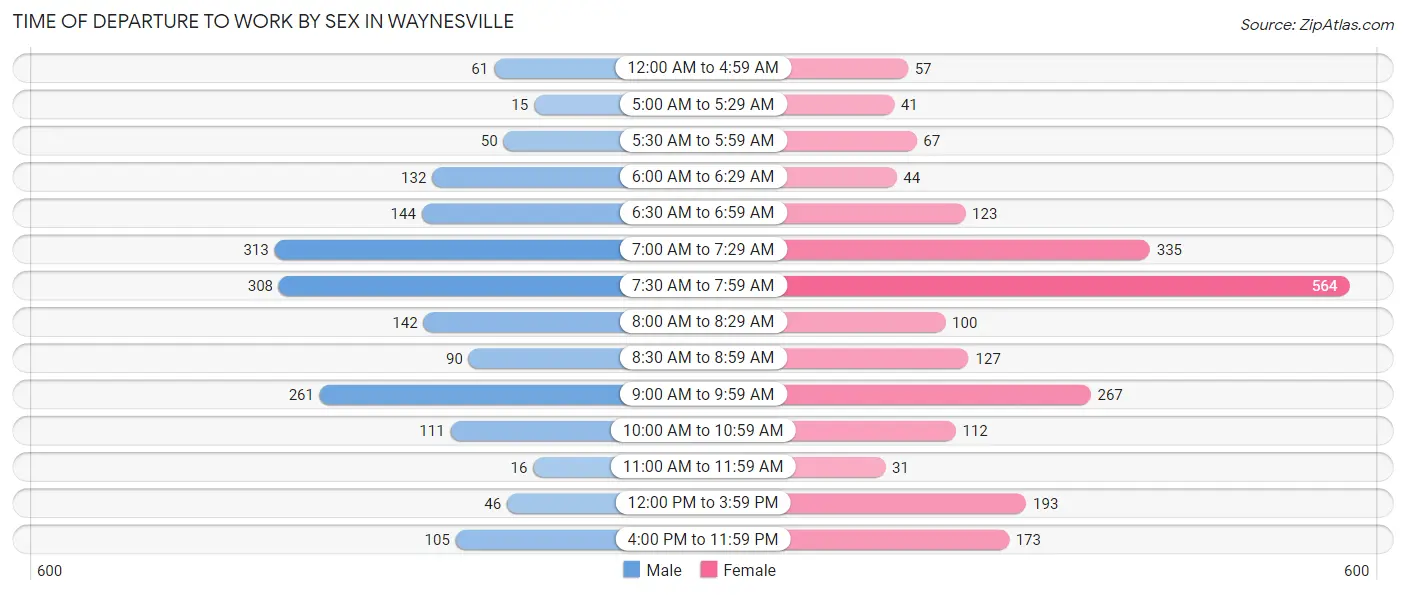
| Time of Departure | Male | Female |
| 12:00 AM to 4:59 AM | 61 (3.4%) | 57 (2.5%) |
| 5:00 AM to 5:29 AM | 15 (0.8%) | 41 (1.8%) |
| 5:30 AM to 5:59 AM | 50 (2.8%) | 67 (3.0%) |
| 6:00 AM to 6:29 AM | 132 (7.4%) | 44 (2.0%) |
| 6:30 AM to 6:59 AM | 144 (8.0%) | 123 (5.5%) |
| 7:00 AM to 7:29 AM | 313 (17.4%) | 335 (15.0%) |
| 7:30 AM to 7:59 AM | 308 (17.2%) | 564 (25.3%) |
| 8:00 AM to 8:29 AM | 142 (7.9%) | 100 (4.5%) |
| 8:30 AM to 8:59 AM | 90 (5.0%) | 127 (5.7%) |
| 9:00 AM to 9:59 AM | 261 (14.5%) | 267 (11.9%) |
| 10:00 AM to 10:59 AM | 111 (6.2%) | 112 (5.0%) |
| 11:00 AM to 11:59 AM | 16 (0.9%) | 31 (1.4%) |
| 12:00 PM to 3:59 PM | 46 (2.6%) | 193 (8.6%) |
| 4:00 PM to 11:59 PM | 105 (5.9%) | 173 (7.7%) |
| Total | 1,794 (100.0%) | 2,234 (100.0%) |
Housing Occupancy in Waynesville
Occupancy by Ownership in Waynesville
Of the total 4,803 dwellings in Waynesville, owner-occupied units account for 2,789 (58.1%), while renter-occupied units make up 2,014 (41.9%).
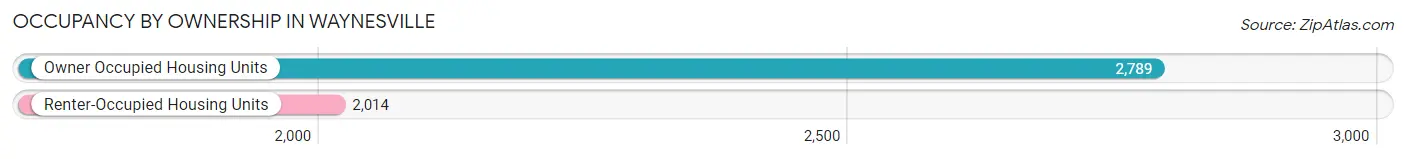
| Occupancy | # Housing Units | % Housing Units |
| Owner Occupied Housing Units | 2,789 | 58.1% |
| Renter-Occupied Housing Units | 2,014 | 41.9% |
| Total Occupied Housing Units | 4,803 | 100.0% |
Occupancy by Household Size in Waynesville
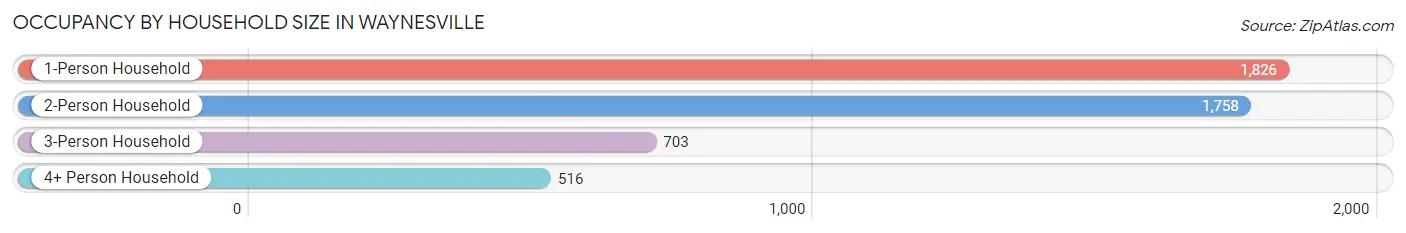
| Household Size | # Housing Units | % Housing Units |
| 1-Person Household | 1,826 | 38.0% |
| 2-Person Household | 1,758 | 36.6% |
| 3-Person Household | 703 | 14.6% |
| 4+ Person Household | 516 | 10.7% |
| Total Housing Units | 4,803 | 100.0% |
Occupancy by Ownership by Household Size in Waynesville
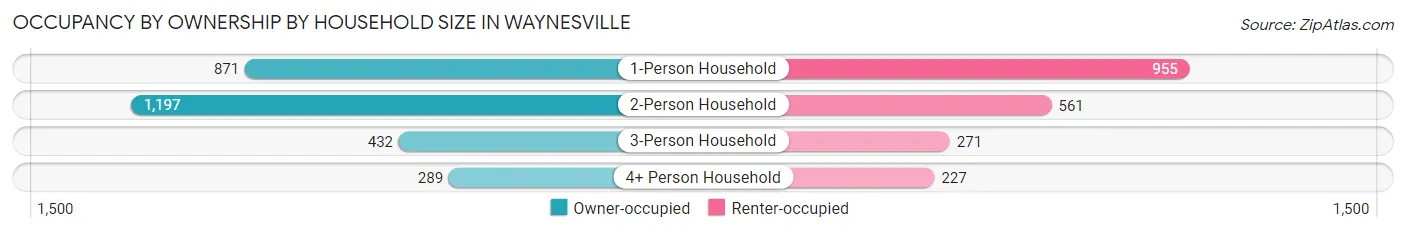
| Household Size | Owner-occupied | Renter-occupied |
| 1-Person Household | 871 (47.7%) | 955 (52.3%) |
| 2-Person Household | 1,197 (68.1%) | 561 (31.9%) |
| 3-Person Household | 432 (61.5%) | 271 (38.6%) |
| 4+ Person Household | 289 (56.0%) | 227 (44.0%) |
| Total Housing Units | 2,789 (58.1%) | 2,014 (41.9%) |
Occupancy by Educational Attainment in Waynesville
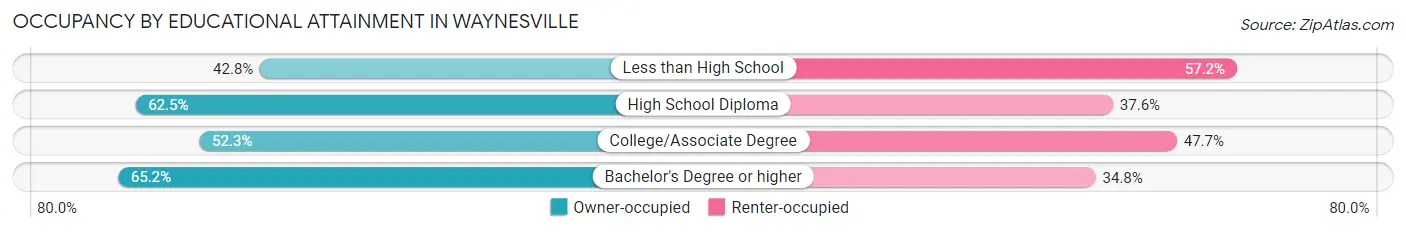
| Household Size | Owner-occupied | Renter-occupied |
| Less than High School | 220 (42.8%) | 294 (57.2%) |
| High School Diploma | 632 (62.5%) | 380 (37.6%) |
| College/Associate Degree | 811 (52.3%) | 739 (47.7%) |
| Bachelor's Degree or higher | 1,126 (65.2%) | 601 (34.8%) |
Occupancy by Age of Householder in Waynesville
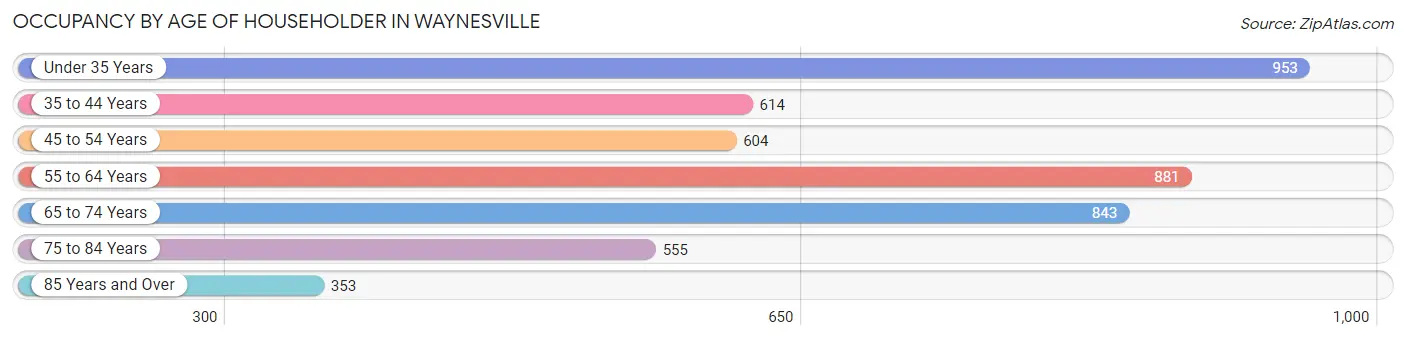
| Age Bracket | # Households | % Households |
| Under 35 Years | 953 | 19.8% |
| 35 to 44 Years | 614 | 12.8% |
| 45 to 54 Years | 604 | 12.6% |
| 55 to 64 Years | 881 | 18.3% |
| 65 to 74 Years | 843 | 17.5% |
| 75 to 84 Years | 555 | 11.6% |
| 85 Years and Over | 353 | 7.3% |
| Total | 4,803 | 100.0% |
Housing Finances in Waynesville
Median Income by Occupancy in Waynesville
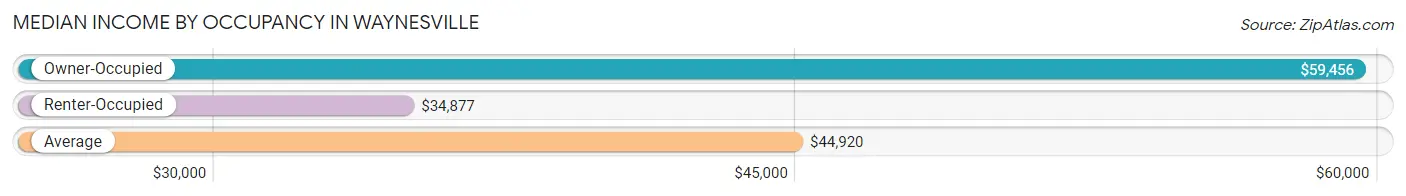
| Occupancy Type | # Households | Median Income |
| Owner-Occupied | 2,789 (58.1%) | $59,456 |
| Renter-Occupied | 2,014 (41.9%) | $34,877 |
| Average | 4,803 (100.0%) | $44,920 |
Occupancy by Householder Income Bracket in Waynesville
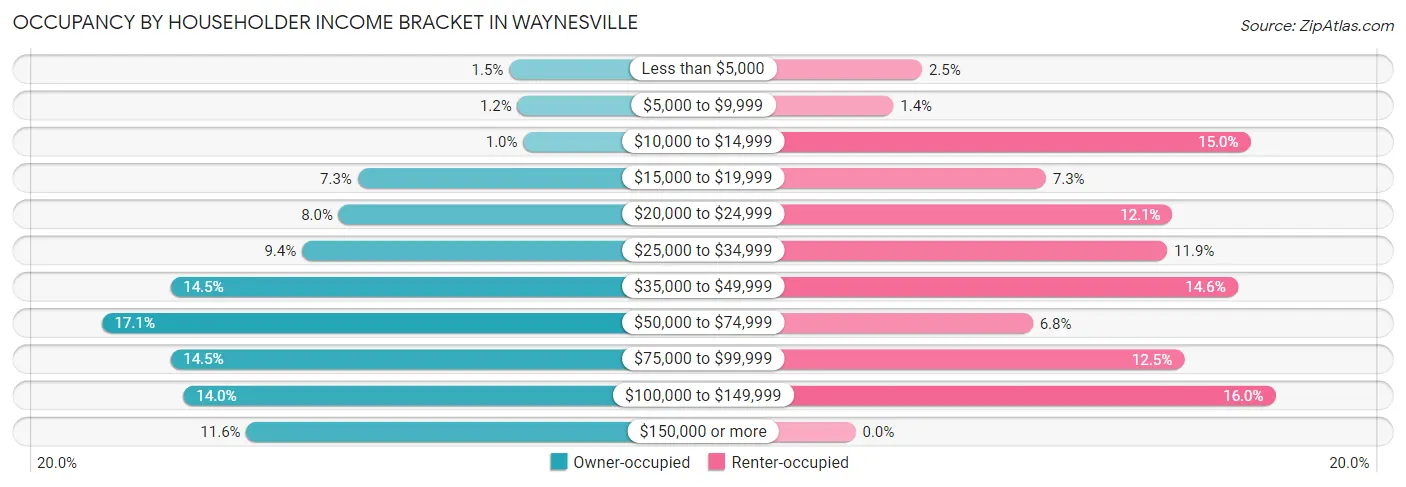
| Income Bracket | Owner-occupied | Renter-occupied |
| Less than $5,000 | 43 (1.5%) | 51 (2.5%) |
| $5,000 to $9,999 | 34 (1.2%) | 29 (1.4%) |
| $10,000 to $14,999 | 28 (1.0%) | 303 (15.0%) |
| $15,000 to $19,999 | 204 (7.3%) | 146 (7.2%) |
| $20,000 to $24,999 | 224 (8.0%) | 243 (12.1%) |
| $25,000 to $34,999 | 263 (9.4%) | 239 (11.9%) |
| $35,000 to $49,999 | 403 (14.4%) | 293 (14.5%) |
| $50,000 to $74,999 | 476 (17.1%) | 136 (6.8%) |
| $75,000 to $99,999 | 403 (14.4%) | 252 (12.5%) |
| $100,000 to $149,999 | 389 (14.0%) | 322 (16.0%) |
| $150,000 or more | 322 (11.6%) | 0 (0.0%) |
| Total | 2,789 (100.0%) | 2,014 (100.0%) |
Monthly Housing Cost Tiers in Waynesville
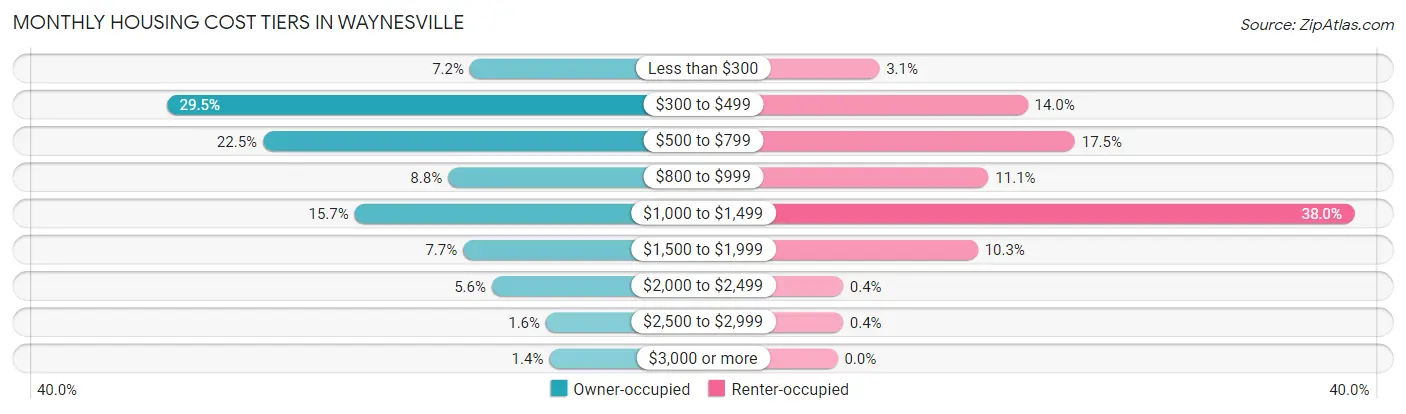
| Monthly Cost | Owner-occupied | Renter-occupied |
| Less than $300 | 201 (7.2%) | 62 (3.1%) |
| $300 to $499 | 824 (29.5%) | 282 (14.0%) |
| $500 to $799 | 626 (22.5%) | 352 (17.5%) |
| $800 to $999 | 246 (8.8%) | 224 (11.1%) |
| $1,000 to $1,499 | 438 (15.7%) | 766 (38.0%) |
| $1,500 to $1,999 | 215 (7.7%) | 208 (10.3%) |
| $2,000 to $2,499 | 156 (5.6%) | 8 (0.4%) |
| $2,500 to $2,999 | 45 (1.6%) | 8 (0.4%) |
| $3,000 or more | 38 (1.4%) | 0 (0.0%) |
| Total | 2,789 (100.0%) | 2,014 (100.0%) |
Physical Housing Characteristics in Waynesville
Housing Structures in Waynesville
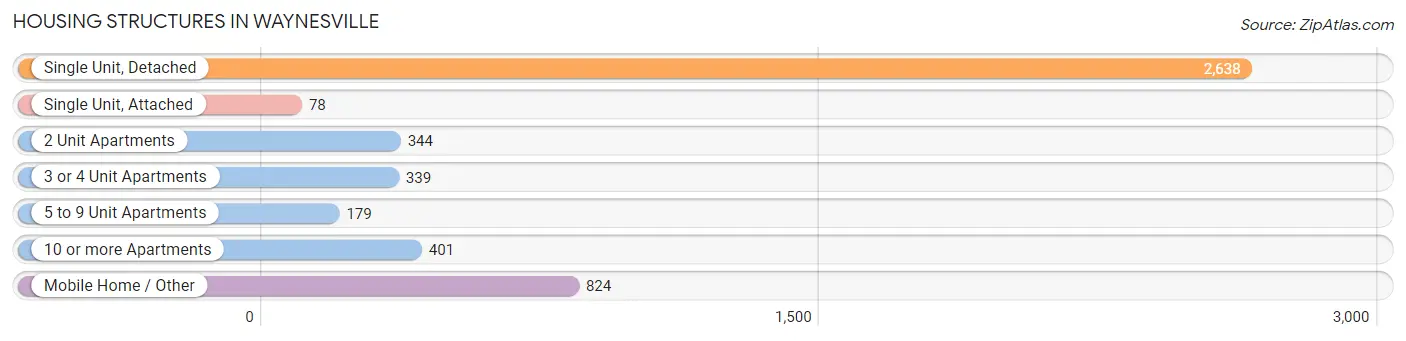
| Structure Type | # Housing Units | % Housing Units |
| Single Unit, Detached | 2,638 | 54.9% |
| Single Unit, Attached | 78 | 1.6% |
| 2 Unit Apartments | 344 | 7.2% |
| 3 or 4 Unit Apartments | 339 | 7.1% |
| 5 to 9 Unit Apartments | 179 | 3.7% |
| 10 or more Apartments | 401 | 8.4% |
| Mobile Home / Other | 824 | 17.2% |
| Total | 4,803 | 100.0% |
Housing Structures by Occupancy in Waynesville
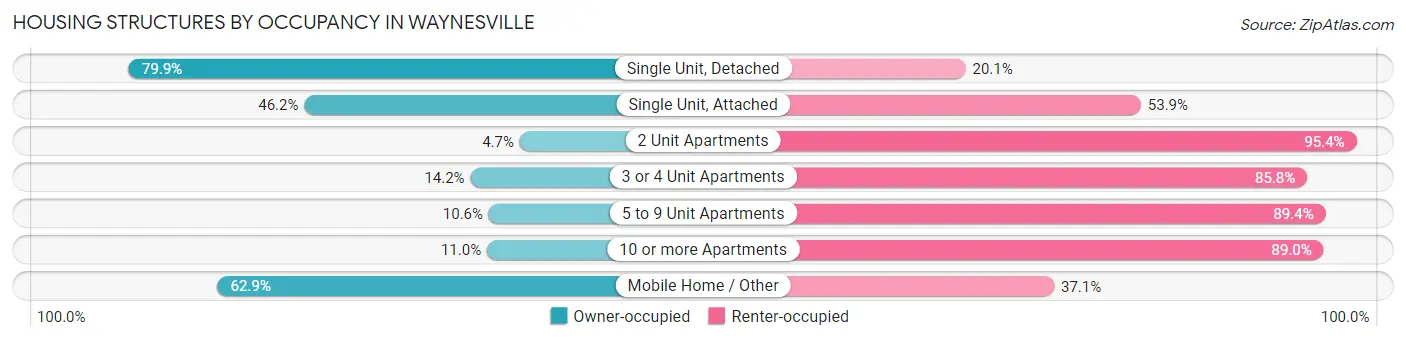
| Structure Type | Owner-occupied | Renter-occupied |
| Single Unit, Detached | 2,108 (79.9%) | 530 (20.1%) |
| Single Unit, Attached | 36 (46.2%) | 42 (53.8%) |
| 2 Unit Apartments | 16 (4.6%) | 328 (95.4%) |
| 3 or 4 Unit Apartments | 48 (14.2%) | 291 (85.8%) |
| 5 to 9 Unit Apartments | 19 (10.6%) | 160 (89.4%) |
| 10 or more Apartments | 44 (11.0%) | 357 (89.0%) |
| Mobile Home / Other | 518 (62.9%) | 306 (37.1%) |
| Total | 2,789 (58.1%) | 2,014 (41.9%) |
Housing Structures by Number of Rooms in Waynesville
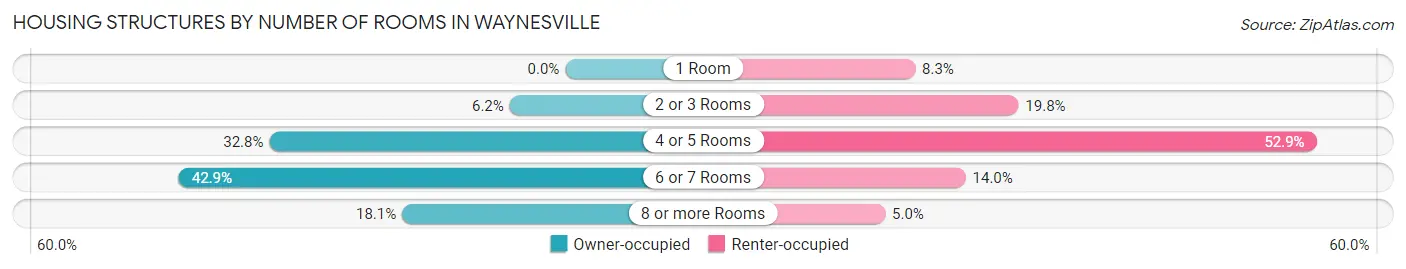
| Number of Rooms | Owner-occupied | Renter-occupied |
| 1 Room | 0 (0.0%) | 168 (8.3%) |
| 2 or 3 Rooms | 172 (6.2%) | 399 (19.8%) |
| 4 or 5 Rooms | 916 (32.8%) | 1,065 (52.9%) |
| 6 or 7 Rooms | 1,196 (42.9%) | 281 (14.0%) |
| 8 or more Rooms | 505 (18.1%) | 101 (5.0%) |
| Total | 2,789 (100.0%) | 2,014 (100.0%) |
Housing Structure by Heating Type in Waynesville
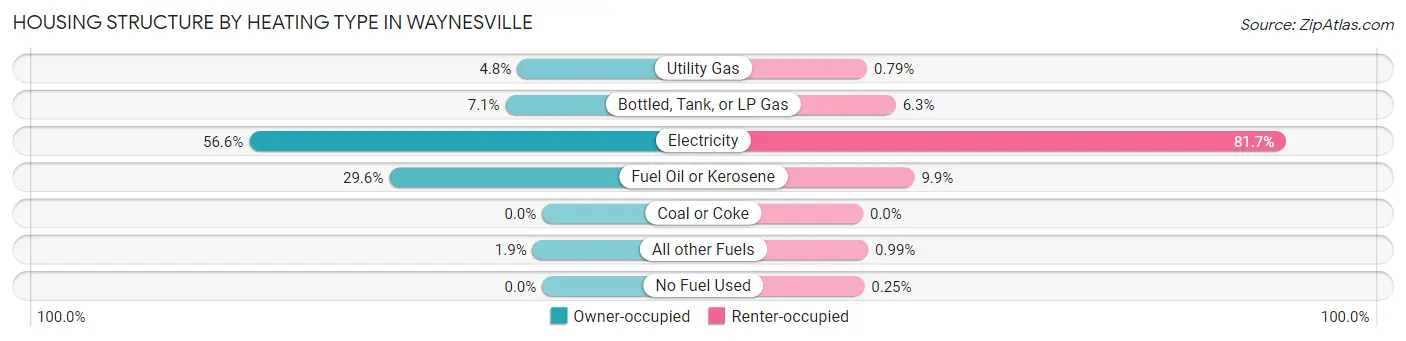
| Heating Type | Owner-occupied | Renter-occupied |
| Utility Gas | 135 (4.8%) | 16 (0.8%) |
| Bottled, Tank, or LP Gas | 198 (7.1%) | 127 (6.3%) |
| Electricity | 1,579 (56.6%) | 1,646 (81.7%) |
| Fuel Oil or Kerosene | 825 (29.6%) | 200 (9.9%) |
| Coal or Coke | 0 (0.0%) | 0 (0.0%) |
| All other Fuels | 52 (1.9%) | 20 (1.0%) |
| No Fuel Used | 0 (0.0%) | 5 (0.3%) |
| Total | 2,789 (100.0%) | 2,014 (100.0%) |
Household Vehicle Usage in Waynesville
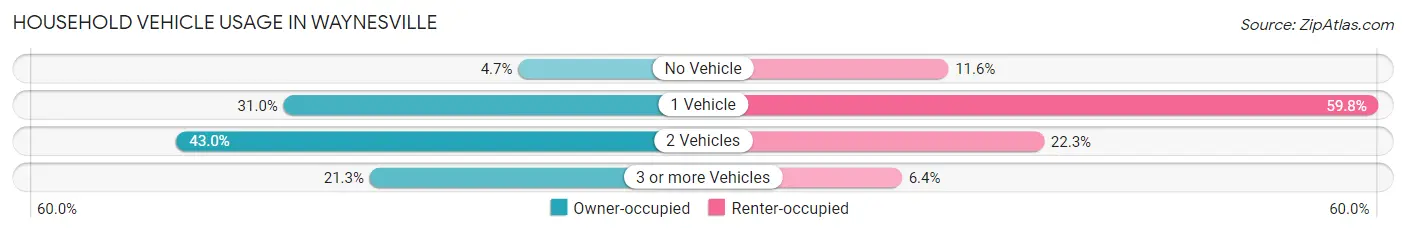
| Vehicles per Household | Owner-occupied | Renter-occupied |
| No Vehicle | 131 (4.7%) | 233 (11.6%) |
| 1 Vehicle | 864 (31.0%) | 1,204 (59.8%) |
| 2 Vehicles | 1,199 (43.0%) | 449 (22.3%) |
| 3 or more Vehicles | 595 (21.3%) | 128 (6.4%) |
| Total | 2,789 (100.0%) | 2,014 (100.0%) |
Real Estate & Mortgages in Waynesville
Real Estate and Mortgage Overview in Waynesville
| Characteristic | Without Mortgage | With Mortgage |
| Housing Units | 1,703 | 1,086 |
| Median Property Value | $193,600 | $256,900 |
| Median Household Income | $44,264 | $130 |
| Monthly Housing Costs | $471 | $38 |
| Real Estate Taxes | $1,452 | $8 |
Property Value by Mortgage Status in Waynesville
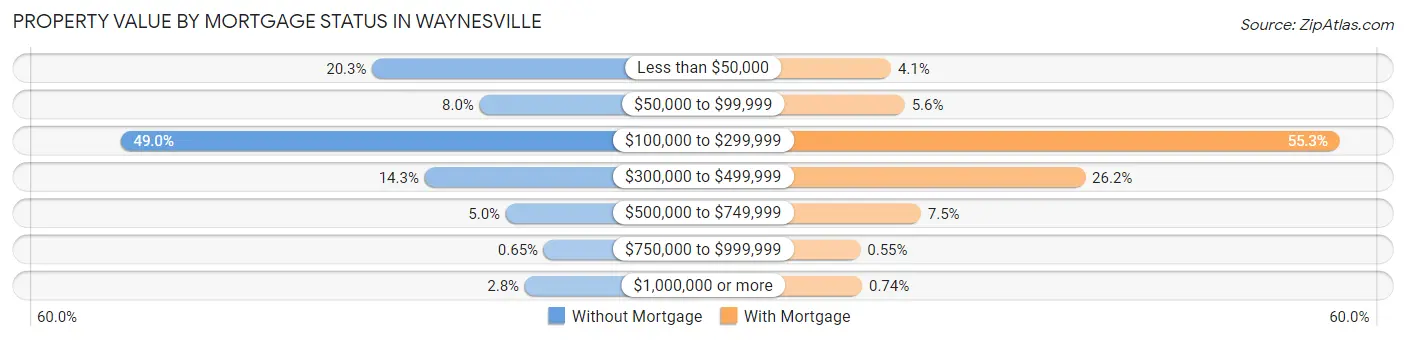
| Property Value | Without Mortgage | With Mortgage |
| Less than $50,000 | 345 (20.3%) | 44 (4.1%) |
| $50,000 to $99,999 | 136 (8.0%) | 61 (5.6%) |
| $100,000 to $299,999 | 835 (49.0%) | 601 (55.3%) |
| $300,000 to $499,999 | 243 (14.3%) | 285 (26.2%) |
| $500,000 to $749,999 | 85 (5.0%) | 81 (7.5%) |
| $750,000 to $999,999 | 11 (0.6%) | 6 (0.5%) |
| $1,000,000 or more | 48 (2.8%) | 8 (0.7%) |
| Total | 1,703 (100.0%) | 1,086 (100.0%) |
Household Income by Mortgage Status in Waynesville
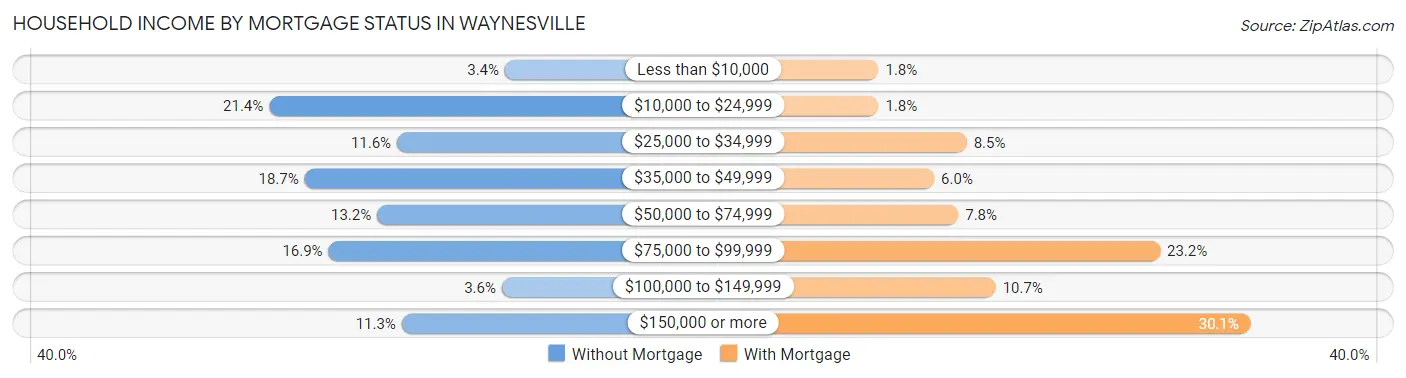
| Household Income | Without Mortgage | With Mortgage |
| Less than $10,000 | 58 (3.4%) | 19 (1.8%) |
| $10,000 to $24,999 | 364 (21.4%) | 19 (1.8%) |
| $25,000 to $34,999 | 198 (11.6%) | 92 (8.5%) |
| $35,000 to $49,999 | 318 (18.7%) | 65 (6.0%) |
| $50,000 to $74,999 | 224 (13.2%) | 85 (7.8%) |
| $75,000 to $99,999 | 287 (16.9%) | 252 (23.2%) |
| $100,000 to $149,999 | 62 (3.6%) | 116 (10.7%) |
| $150,000 or more | 192 (11.3%) | 327 (30.1%) |
| Total | 1,703 (100.0%) | 1,086 (100.0%) |
Property Value to Household Income Ratio in Waynesville
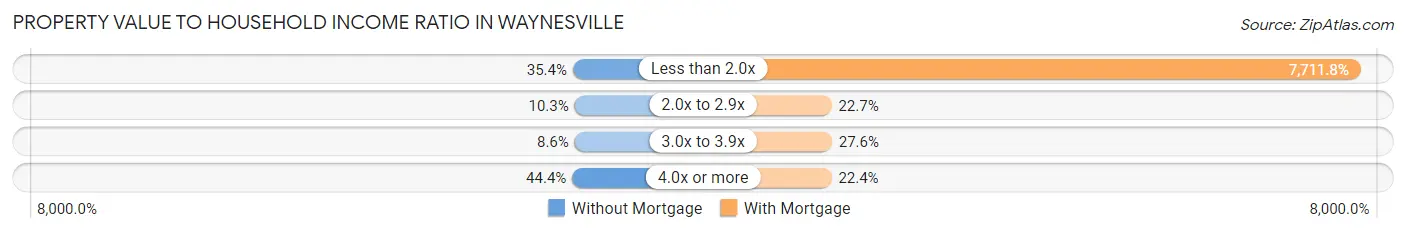
| Value-to-Income Ratio | Without Mortgage | With Mortgage |
| Less than 2.0x | 602 (35.3%) | 83,750 (7,711.8%) |
| 2.0x to 2.9x | 176 (10.3%) | 247 (22.7%) |
| 3.0x to 3.9x | 147 (8.6%) | 300 (27.6%) |
| 4.0x or more | 756 (44.4%) | 243 (22.4%) |
| Total | 1,703 (100.0%) | 1,086 (100.0%) |
Real Estate Taxes by Mortgage Status in Waynesville
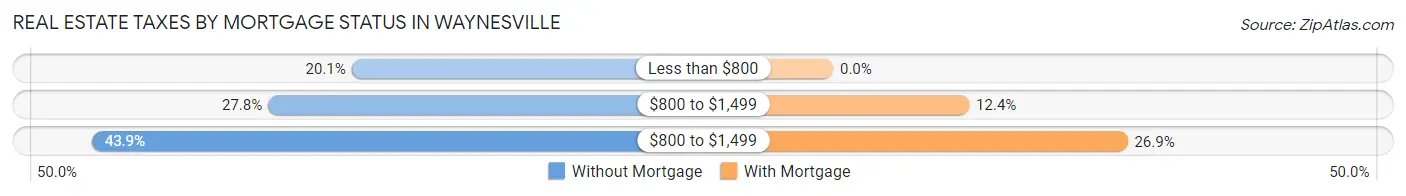
| Property Taxes | Without Mortgage | With Mortgage |
| Less than $800 | 343 (20.1%) | 0 (0.0%) |
| $800 to $1,499 | 473 (27.8%) | 135 (12.4%) |
| $800 to $1,499 | 747 (43.9%) | 292 (26.9%) |
| Total | 1,703 (100.0%) | 1,086 (100.0%) |
Health & Disability in Waynesville
Health Insurance Coverage by Age in Waynesville
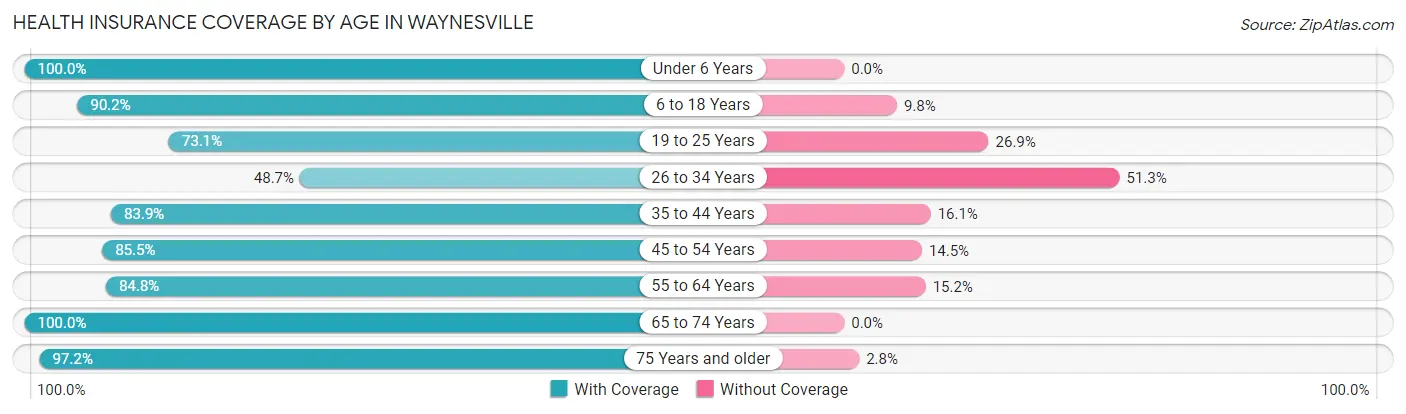
| Age Bracket | With Coverage | Without Coverage |
| Under 6 Years | 581 (100.0%) | 0 (0.0%) |
| 6 to 18 Years | 1,165 (90.2%) | 127 (9.8%) |
| 19 to 25 Years | 573 (73.1%) | 211 (26.9%) |
| 26 to 34 Years | 513 (48.7%) | 541 (51.3%) |
| 35 to 44 Years | 1,000 (83.9%) | 192 (16.1%) |
| 45 to 54 Years | 1,069 (85.5%) | 181 (14.5%) |
| 55 to 64 Years | 1,162 (84.8%) | 208 (15.2%) |
| 65 to 74 Years | 1,384 (100.0%) | 0 (0.0%) |
| 75 Years and older | 1,153 (97.2%) | 33 (2.8%) |
| Total | 8,600 (85.2%) | 1,493 (14.8%) |
Health Insurance Coverage by Citizenship Status in Waynesville
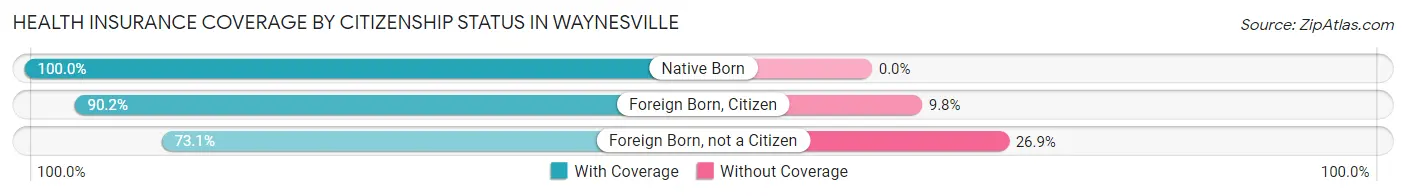
| Citizenship Status | With Coverage | Without Coverage |
| Native Born | 581 (100.0%) | 0 (0.0%) |
| Foreign Born, Citizen | 1,165 (90.2%) | 127 (9.8%) |
| Foreign Born, not a Citizen | 573 (73.1%) | 211 (26.9%) |
Health Insurance Coverage by Household Income in Waynesville
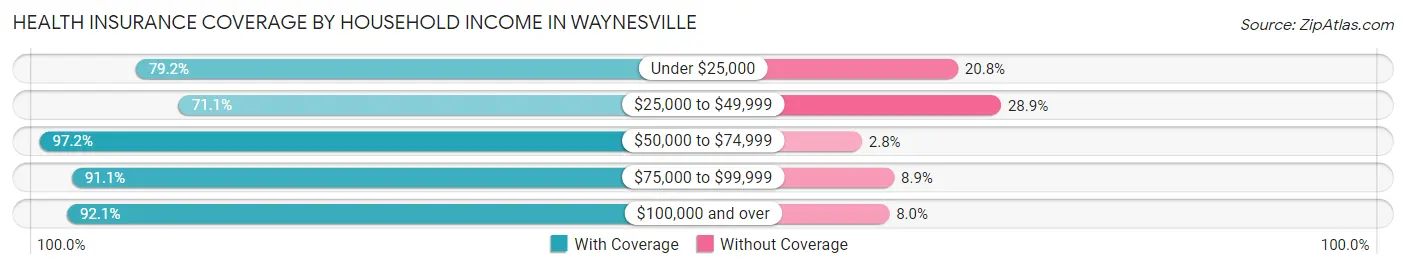
| Household Income | With Coverage | Without Coverage |
| Under $25,000 | 1,901 (79.2%) | 500 (20.8%) |
| $25,000 to $49,999 | 1,445 (71.1%) | 587 (28.9%) |
| $50,000 to $74,999 | 1,173 (97.2%) | 34 (2.8%) |
| $75,000 to $99,999 | 1,315 (91.1%) | 128 (8.9%) |
| $100,000 and over | 2,711 (92.0%) | 234 (8.0%) |
Public vs Private Health Insurance Coverage by Age in Waynesville
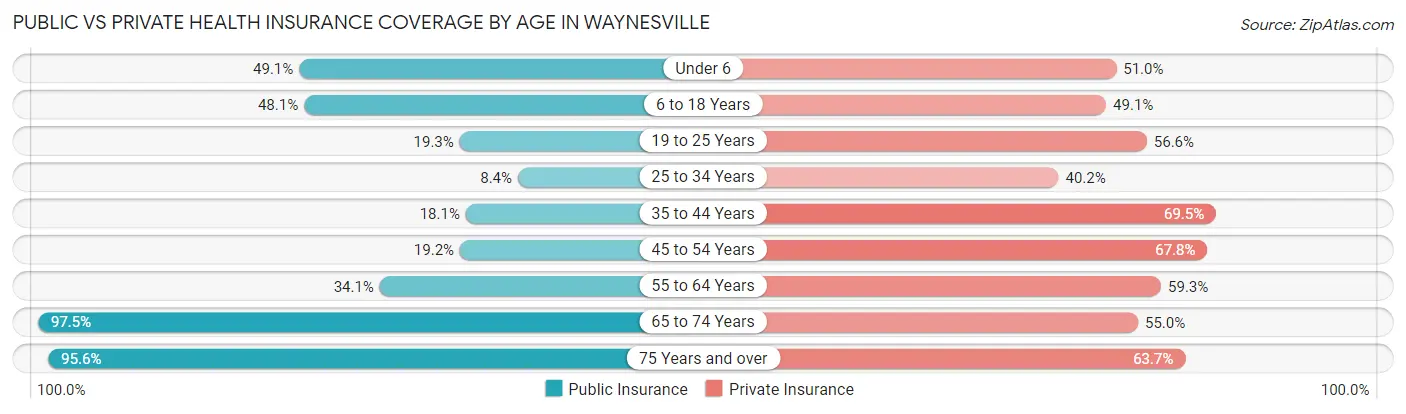
| Age Bracket | Public Insurance | Private Insurance |
| Under 6 | 285 (49.0%) | 296 (50.9%) |
| 6 to 18 Years | 622 (48.1%) | 634 (49.1%) |
| 19 to 25 Years | 151 (19.3%) | 444 (56.6%) |
| 25 to 34 Years | 89 (8.4%) | 424 (40.2%) |
| 35 to 44 Years | 216 (18.1%) | 828 (69.5%) |
| 45 to 54 Years | 240 (19.2%) | 848 (67.8%) |
| 55 to 64 Years | 467 (34.1%) | 812 (59.3%) |
| 65 to 74 Years | 1,350 (97.5%) | 761 (55.0%) |
| 75 Years and over | 1,134 (95.6%) | 756 (63.7%) |
| Total | 4,554 (45.1%) | 5,803 (57.5%) |
Disability Status by Sex by Age in Waynesville
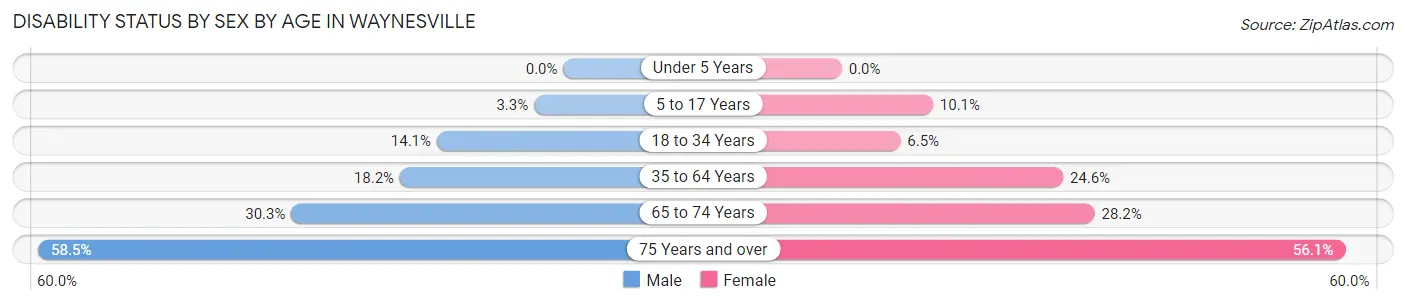
| Age Bracket | Male | Female |
| Under 5 Years | 0 (0.0%) | 0 (0.0%) |
| 5 to 17 Years | 26 (3.3%) | 64 (10.1%) |
| 18 to 34 Years | 125 (14.1%) | 62 (6.5%) |
| 35 to 64 Years | 320 (18.2%) | 506 (24.6%) |
| 65 to 74 Years | 203 (30.3%) | 201 (28.1%) |
| 75 Years and over | 341 (58.5%) | 338 (56.0%) |
Disability Class by Sex by Age in Waynesville
Disability Class: Hearing Difficulty
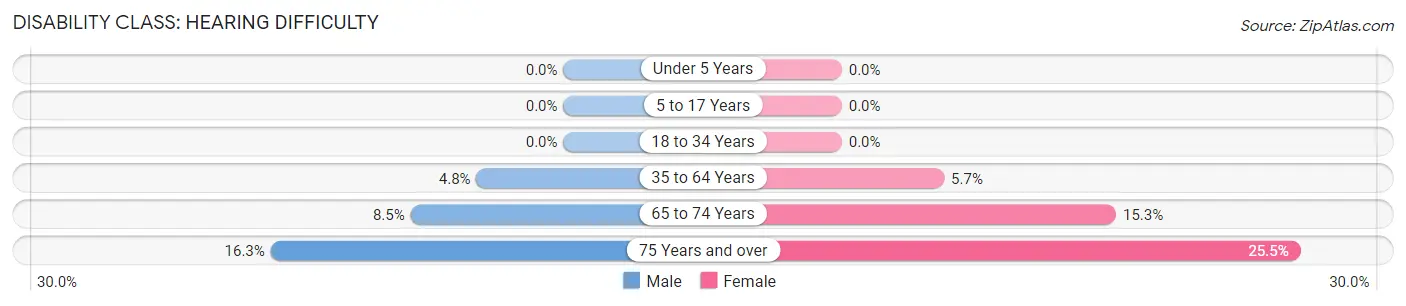
| Age Bracket | Male | Female |
| Under 5 Years | 0 (0.0%) | 0 (0.0%) |
| 5 to 17 Years | 0 (0.0%) | 0 (0.0%) |
| 18 to 34 Years | 0 (0.0%) | 0 (0.0%) |
| 35 to 64 Years | 85 (4.8%) | 117 (5.7%) |
| 65 to 74 Years | 57 (8.5%) | 109 (15.3%) |
| 75 Years and over | 95 (16.3%) | 154 (25.5%) |
Disability Class: Vision Difficulty
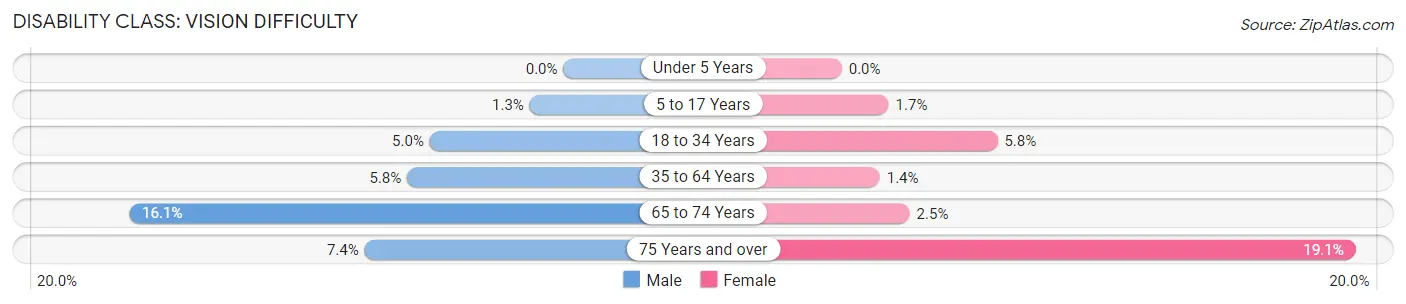
| Age Bracket | Male | Female |
| Under 5 Years | 0 (0.0%) | 0 (0.0%) |
| 5 to 17 Years | 10 (1.3%) | 11 (1.7%) |
| 18 to 34 Years | 44 (5.0%) | 55 (5.8%) |
| 35 to 64 Years | 102 (5.8%) | 29 (1.4%) |
| 65 to 74 Years | 108 (16.1%) | 18 (2.5%) |
| 75 Years and over | 43 (7.4%) | 115 (19.1%) |
Disability Class: Cognitive Difficulty
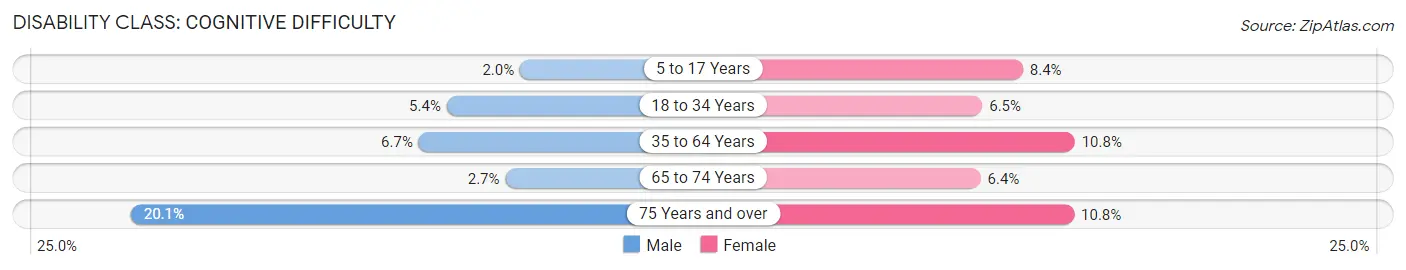
| Age Bracket | Male | Female |
| 5 to 17 Years | 16 (2.0%) | 53 (8.4%) |
| 18 to 34 Years | 48 (5.4%) | 62 (6.5%) |
| 35 to 64 Years | 118 (6.7%) | 222 (10.8%) |
| 65 to 74 Years | 18 (2.7%) | 46 (6.4%) |
| 75 Years and over | 117 (20.1%) | 65 (10.8%) |
Disability Class: Ambulatory Difficulty
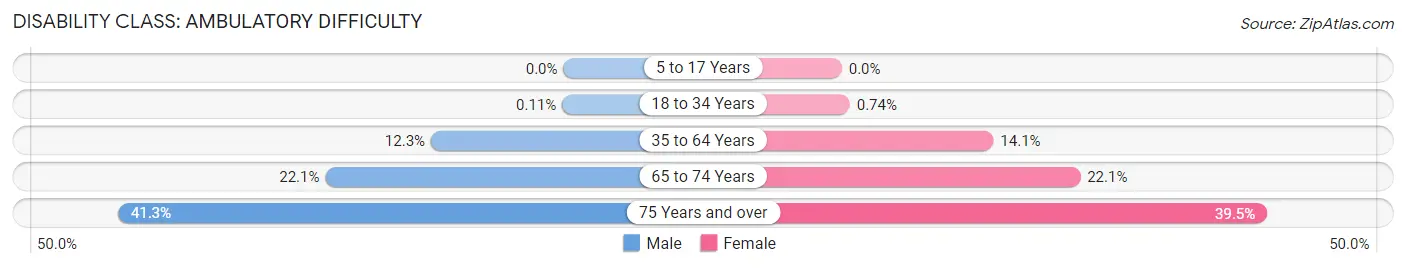
| Age Bracket | Male | Female |
| 5 to 17 Years | 0 (0.0%) | 0 (0.0%) |
| 18 to 34 Years | 1 (0.1%) | 7 (0.7%) |
| 35 to 64 Years | 216 (12.3%) | 289 (14.1%) |
| 65 to 74 Years | 148 (22.1%) | 158 (22.1%) |
| 75 Years and over | 241 (41.3%) | 238 (39.5%) |
Disability Class: Self-Care Difficulty
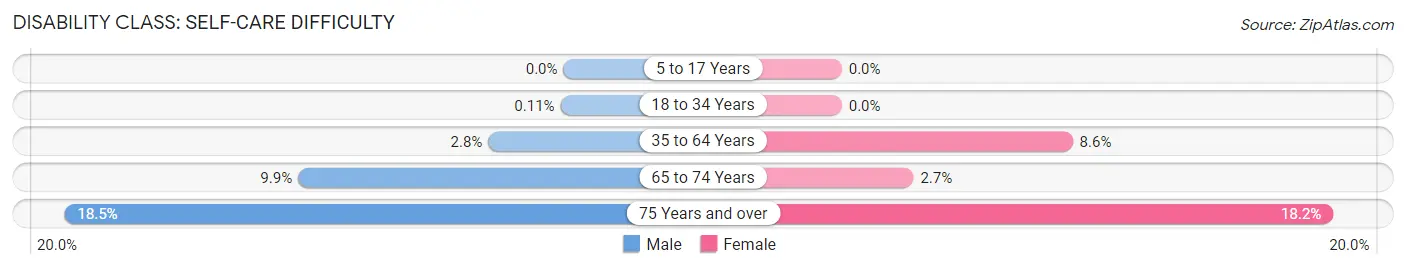
| Age Bracket | Male | Female |
| 5 to 17 Years | 0 (0.0%) | 0 (0.0%) |
| 18 to 34 Years | 1 (0.1%) | 0 (0.0%) |
| 35 to 64 Years | 49 (2.8%) | 176 (8.6%) |
| 65 to 74 Years | 66 (9.9%) | 19 (2.7%) |
| 75 Years and over | 108 (18.5%) | 110 (18.2%) |
Technology Access in Waynesville
Computing Device Access in Waynesville
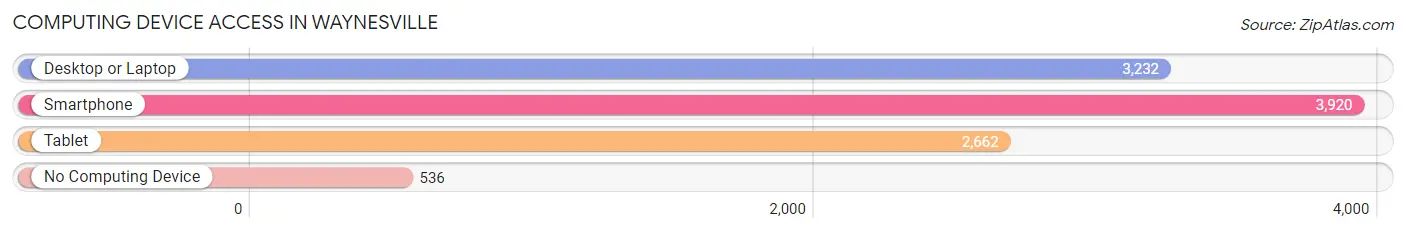
| Device Type | # Households | % Households |
| Desktop or Laptop | 3,232 | 67.3% |
| Smartphone | 3,920 | 81.6% |
| Tablet | 2,662 | 55.4% |
| No Computing Device | 536 | 11.2% |
| Total | 4,803 | 100.0% |
Internet Access in Waynesville
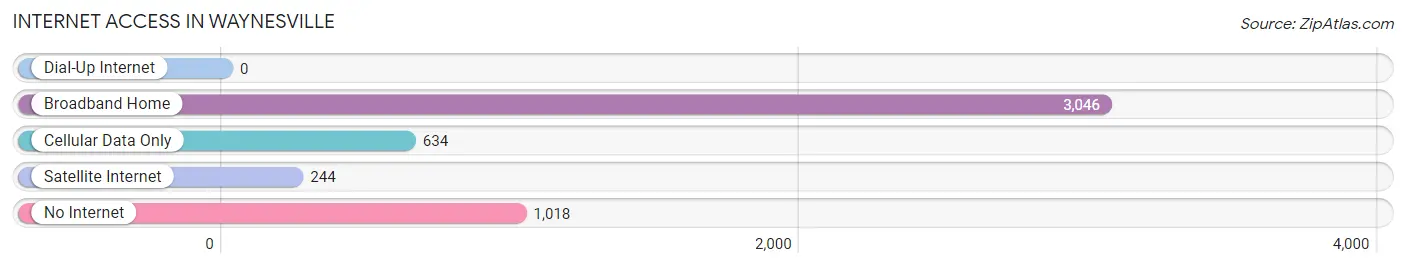
| Internet Type | # Households | % Households |
| Dial-Up Internet | 0 | 0.0% |
| Broadband Home | 3,046 | 63.4% |
| Cellular Data Only | 634 | 13.2% |
| Satellite Internet | 244 | 5.1% |
| No Internet | 1,018 | 21.2% |
| Total | 4,803 | 100.0% |
Waynesville Summary
Waynesville, NC is a small town located in the western part of North Carolina in the Appalachian Mountains. It is the county seat of Haywood County and is situated at the junction of US Highway 19 and 23. The town has a population of approximately 10,000 people and is the largest town in the county.
History
Waynesville was founded in 1810 by Colonel Robert Love, a Revolutionary War veteran. The town was named after General “Mad” Anthony Wayne, who was a hero of the Revolutionary War. The town was originally a trading post and was the first county seat of Haywood County. In 1828, the town was incorporated and the first post office was established.
In the late 19th century, Waynesville became a popular tourist destination due to its proximity to the Great Smoky Mountains National Park. The town was also known for its mineral springs, which were believed to have healing properties. In the early 20th century, the town experienced a period of growth and development, with the construction of several hotels and other businesses.
Geography
Waynesville is located in the Appalachian Mountains of western North Carolina. The town is situated at the junction of US Highway 19 and 23, and is surrounded by the Great Smoky Mountains National Park. The town is located at an elevation of 2,000 feet and has a humid subtropical climate. The average annual temperature is around 60 degrees Fahrenheit, with the warmest months being July and August.
Economy
Waynesville’s economy is largely based on tourism, with the town being a popular destination for visitors to the Great Smoky Mountains National Park. The town is also home to several manufacturing companies, including a furniture factory and a paper mill. The town also has a vibrant arts and crafts scene, with several galleries and shops.
Demographics
As of the 2010 census, the population of Waynesville was 9,232. The racial makeup of the town was 90.3% White, 6.2% African American, 0.7% Native American, 0.5% Asian, 0.1% Pacific Islander, and 1.2% from other races. The median household income was $35,945, and the median family income was $45,945. The per capita income was $20,945.
Conclusion
Waynesville, NC is a small town located in the western part of North Carolina in the Appalachian Mountains. It is the county seat of Haywood County and is situated at the junction of US Highway 19 and 23. The town has a population of approximately 10,000 people and is the largest town in the county. Waynesville’s economy is largely based on tourism, with the town being a popular destination for visitors to the Great Smoky Mountains National Park. The town also has a vibrant arts and crafts scene, with several galleries and shops. The racial makeup of the town was 90.3% White, 6.2% African American, 0.7% Native American, 0.5% Asian, 0.1% Pacific Islander, and 1.2% from other races. The median household income was $35,945, and the median family income was $45,945. The per capita income was $20,945.
Common Questions
What is Per Capita Income in Waynesville?
Per Capita income in Waynesville is $34,653.
What is the Median Family Income in Waynesville?
Median Family Income in Waynesville is $78,016.
What is the Median Household income in Waynesville?
Median Household Income in Waynesville is $44,920.
What is Income or Wage Gap in Waynesville?
Income or Wage Gap in Waynesville is 28.4%.
Women in Waynesville earn 71.6 cents for every dollar earned by a man.
What is Inequality or Gini Index in Waynesville?
Inequality or Gini Index in Waynesville is 0.48.
What is the Total Population of Waynesville?
Total Population of Waynesville is 10,307.
What is the Total Male Population of Waynesville?
Total Male Population of Waynesville is 5,017.
What is the Total Female Population of Waynesville?
Total Female Population of Waynesville is 5,290.
What is the Ratio of Males per 100 Females in Waynesville?
There are 94.84 Males per 100 Females in Waynesville.
What is the Ratio of Females per 100 Males in Waynesville?
There are 105.44 Females per 100 Males in Waynesville.
What is the Median Population Age in Waynesville?
Median Population Age in Waynesville is 47.3 Years.
What is the Average Family Size in Waynesville
Average Family Size in Waynesville is 2.7 People.
What is the Average Household Size in Waynesville
Average Household Size in Waynesville is 2.1 People.
How Large is the Labor Force in Waynesville?
There are 4,824 People in the Labor Forcein in Waynesville.
What is the Percentage of People in the Labor Force in Waynesville?
56.4% of People are in the Labor Force in Waynesville.
What is the Unemployment Rate in Waynesville?
Unemployment Rate in Waynesville is 2.3%.