Tryon, NC Map & Demographics
Tryon Map
Tryon Overview
$35,732
PER CAPITA INCOME
$66,000
AVG FAMILY INCOME
$50,398
AVG HOUSEHOLD INCOME
47.7%
WAGE / INCOME GAP [ % ]
52.3¢/ $1
WAGE / INCOME GAP [ $ ]
0.42
INEQUALITY / GINI INDEX
1,516
TOTAL POPULATION
625
MALE POPULATION
891
FEMALE POPULATION
70.15
MALES / 100 FEMALES
142.56
FEMALES / 100 MALES
61.9
MEDIAN AGE
2.4
AVG FAMILY SIZE
1.7
AVG HOUSEHOLD SIZE
643
LABOR FORCE [ PEOPLE ]
44.7%
PERCENT IN LABOR FORCE
2.0%
UNEMPLOYMENT RATE
Tryon Zip Codes
Tryon Area Codes
Income in Tryon
Income Overview in Tryon
Per Capita Income in Tryon is $35,732, while median incomes of families and households are $66,000 and $50,398 respectively.
| Characteristic | Number | Measure |
| Per Capita Income | 1,516 | $35,732 |
| Median Family Income | 336 | $66,000 |
| Mean Family Income | 336 | $80,706 |
| Median Household Income | 855 | $50,398 |
| Mean Household Income | 855 | $61,253 |
| Income Deficit | 336 | $0 |
| Wage / Income Gap (%) | 1,516 | 47.66% |
| Wage / Income Gap ($) | 1,516 | 52.34¢ per $1 |
| Gini / Inequality Index | 1,516 | 0.42 |
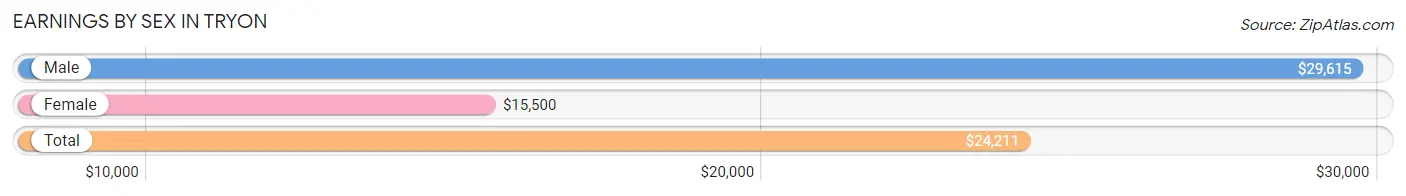
Earnings by Sex in Tryon
Average Earnings in Tryon are $24,211, $29,615 for men and $15,500 for women, a difference of 47.7%.
| Sex | Number | Average Earnings |
| Male | 326 (49.1%) | $29,615 |
| Female | 338 (50.9%) | $15,500 |
| Total | 664 (100.0%) | $24,211 |
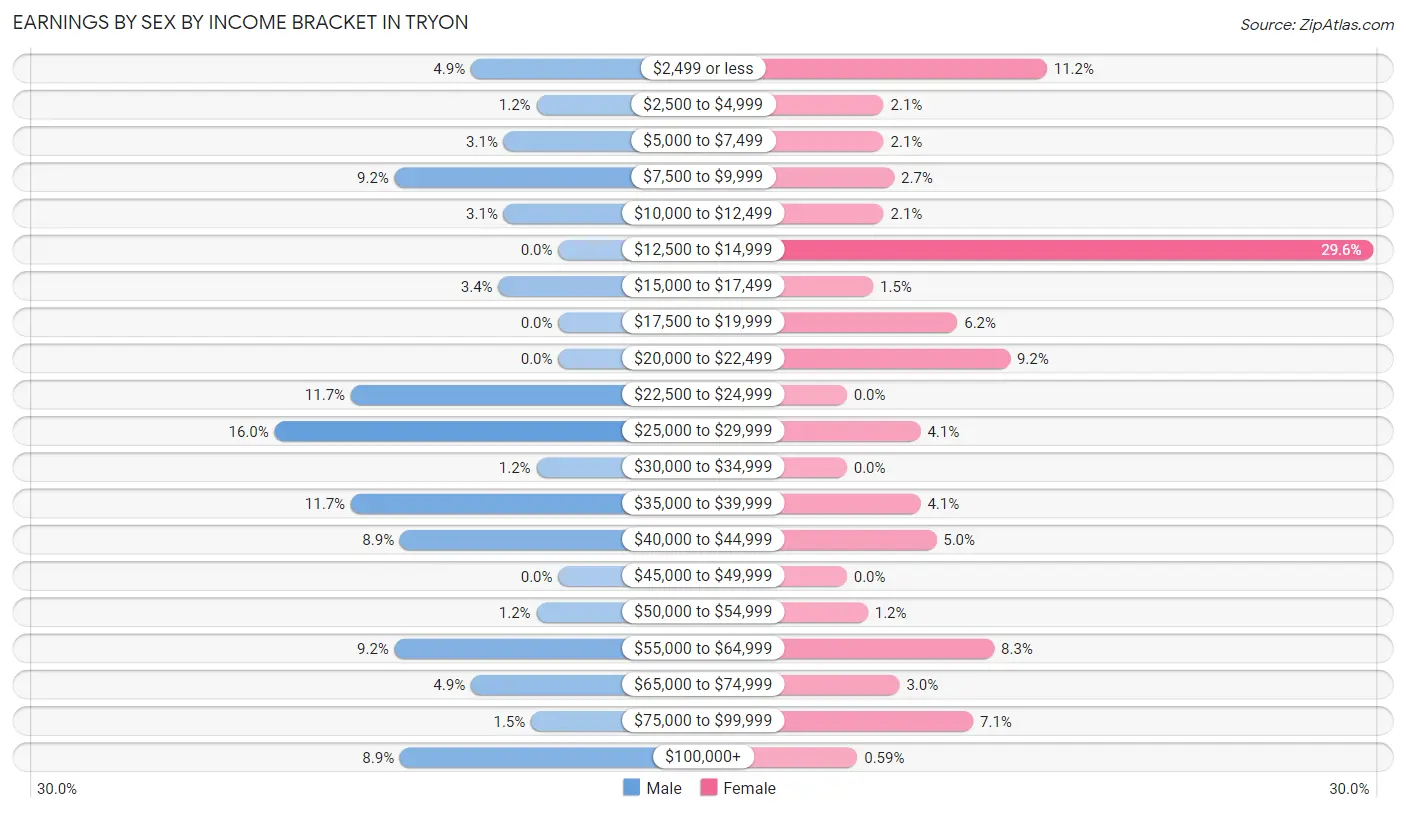
Earnings by Sex by Income Bracket in Tryon
The most common earnings brackets in Tryon are $25,000 to $29,999 for men (52 | 16.0%) and $12,500 to $14,999 for women (100 | 29.6%).
| Income | Male | Female |
| $2,499 or less | 16 (4.9%) | 38 (11.2%) |
| $2,500 to $4,999 | 4 (1.2%) | 7 (2.1%) |
| $5,000 to $7,499 | 10 (3.1%) | 7 (2.1%) |
| $7,500 to $9,999 | 30 (9.2%) | 9 (2.7%) |
| $10,000 to $12,499 | 10 (3.1%) | 7 (2.1%) |
| $12,500 to $14,999 | 0 (0.0%) | 100 (29.6%) |
| $15,000 to $17,499 | 11 (3.4%) | 5 (1.5%) |
| $17,500 to $19,999 | 0 (0.0%) | 21 (6.2%) |
| $20,000 to $22,499 | 0 (0.0%) | 31 (9.2%) |
| $22,500 to $24,999 | 38 (11.7%) | 0 (0.0%) |
| $25,000 to $29,999 | 52 (16.0%) | 14 (4.1%) |
| $30,000 to $34,999 | 4 (1.2%) | 0 (0.0%) |
| $35,000 to $39,999 | 38 (11.7%) | 14 (4.1%) |
| $40,000 to $44,999 | 29 (8.9%) | 17 (5.0%) |
| $45,000 to $49,999 | 0 (0.0%) | 0 (0.0%) |
| $50,000 to $54,999 | 4 (1.2%) | 4 (1.2%) |
| $55,000 to $64,999 | 30 (9.2%) | 28 (8.3%) |
| $65,000 to $74,999 | 16 (4.9%) | 10 (3.0%) |
| $75,000 to $99,999 | 5 (1.5%) | 24 (7.1%) |
| $100,000+ | 29 (8.9%) | 2 (0.6%) |
| Total | 326 (100.0%) | 338 (100.0%) |
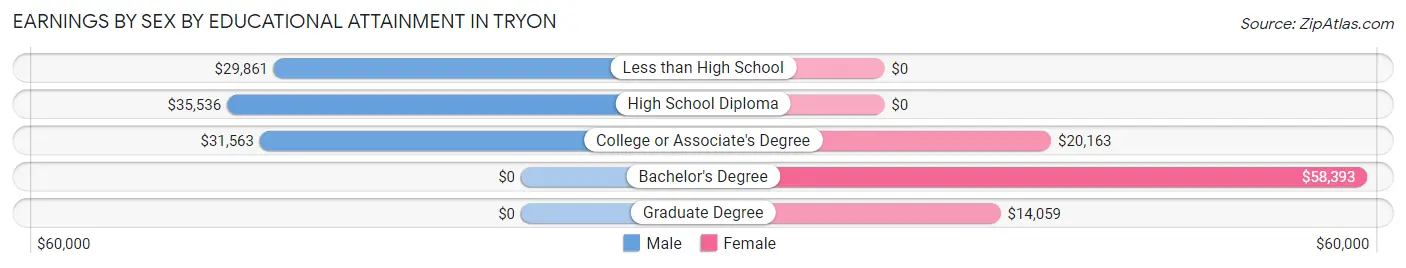
Earnings by Sex by Educational Attainment in Tryon
Average earnings in Tryon are $31,563 for men and $17,976 for women, a difference of 43.0%. Men with an educational attainment of high school diploma enjoy the highest average annual earnings of $35,536, while those with less than high school education earn the least with $29,861. Women with an educational attainment of bachelor's degree earn the most with the average annual earnings of $58,393, while those with graduate degree education have the smallest earnings of $14,059.
| Educational Attainment | Male Income | Female Income |
| Less than High School | $29,861 | $0 |
| High School Diploma | $35,536 | $0 |
| College or Associate's Degree | $31,563 | $20,163 |
| Bachelor's Degree | - | - |
| Graduate Degree | - | - |
| Total | $31,563 | $17,976 |
Family Income in Tryon
Family Income Brackets in Tryon
According to the Tryon family income data, there are 94 families falling into the $50,000 to $74,999 income range, which is the most common income bracket and makes up 28.0% of all families.
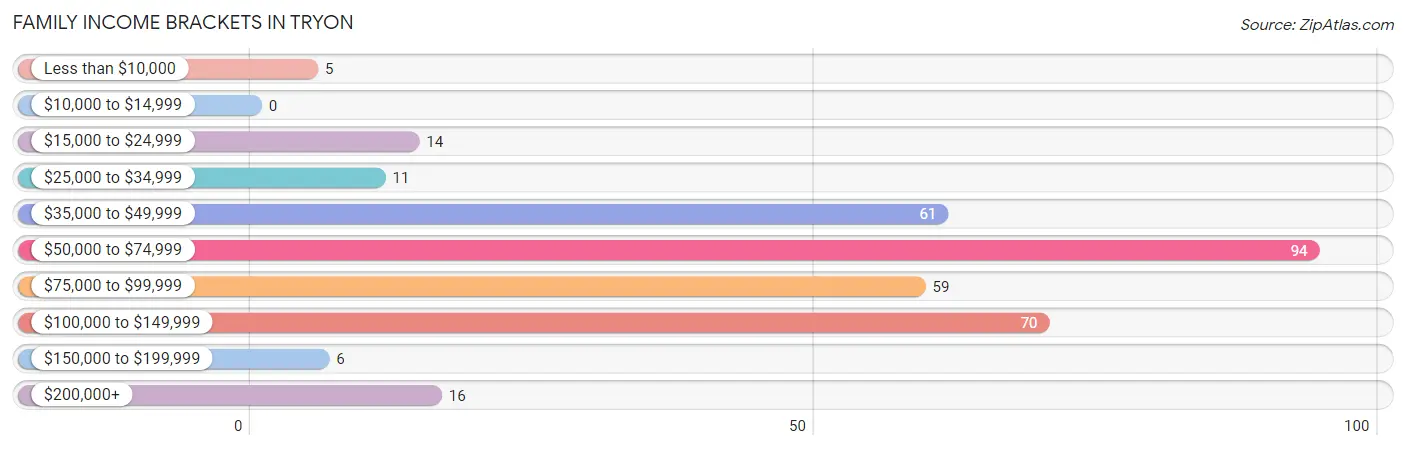
| Income Bracket | # Families | % Families |
| Less than $10,000 | 5 | 1.5% |
| $10,000 to $14,999 | 0 | 0.0% |
| $15,000 to $24,999 | 14 | 4.2% |
| $25,000 to $34,999 | 11 | 3.3% |
| $35,000 to $49,999 | 61 | 18.2% |
| $50,000 to $74,999 | 94 | 28.0% |
| $75,000 to $99,999 | 59 | 17.6% |
| $100,000 to $149,999 | 70 | 20.8% |
| $150,000 to $199,999 | 6 | 1.8% |
| $200,000+ | 16 | 4.8% |
Family Income by Famaliy Size in Tryon
3-person families (30 | 8.9%) account for the highest median family income in Tryon with $86,250 per family, while 2-person families (279 | 83.0%) have the highest median income of $33,625 per family member.
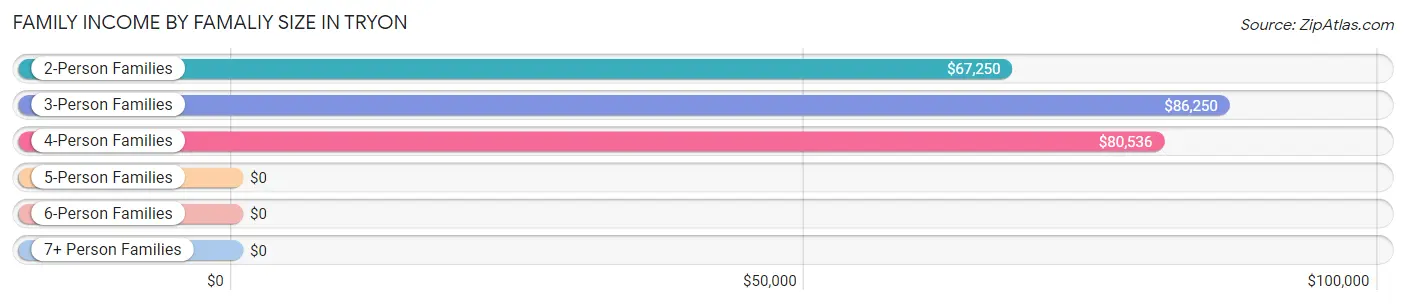
| Income Bracket | # Families | Median Income |
| 2-Person Families | 279 (83.0%) | $67,250 |
| 3-Person Families | 30 (8.9%) | $86,250 |
| 4-Person Families | 19 (5.7%) | $80,536 |
| 5-Person Families | 0 (0.0%) | $0 |
| 6-Person Families | 0 (0.0%) | $0 |
| 7+ Person Families | 8 (2.4%) | $0 |
| Total | 336 (100.0%) | $66,000 |
Family Income by Number of Earners in Tryon
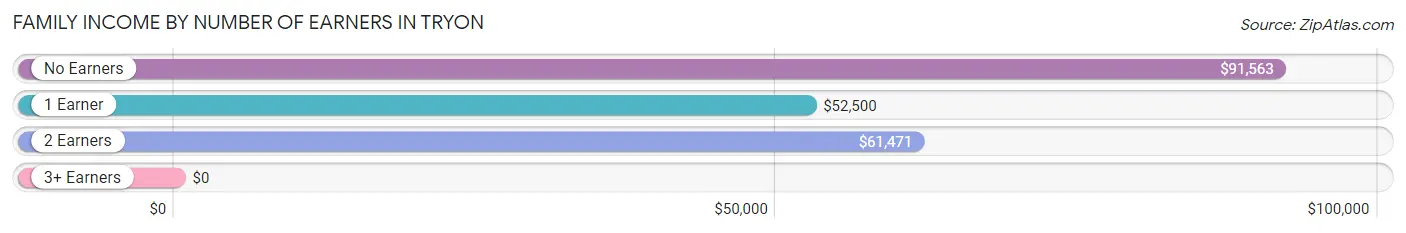
| Number of Earners | # Families | Median Income |
| No Earners | 151 (44.9%) | $91,563 |
| 1 Earner | 82 (24.4%) | $52,500 |
| 2 Earners | 88 (26.2%) | $61,471 |
| 3+ Earners | 15 (4.5%) | $0 |
| Total | 336 (100.0%) | $66,000 |
Household Income in Tryon
Household Income Brackets in Tryon
With 185 households falling in the category, the $50,000 to $74,999 income range is the most frequent in Tryon, accounting for 21.6% of all households. In contrast, only 15 households (1.8%) fall into the $150,000 to $199,999 income bracket, making it the least populous group.
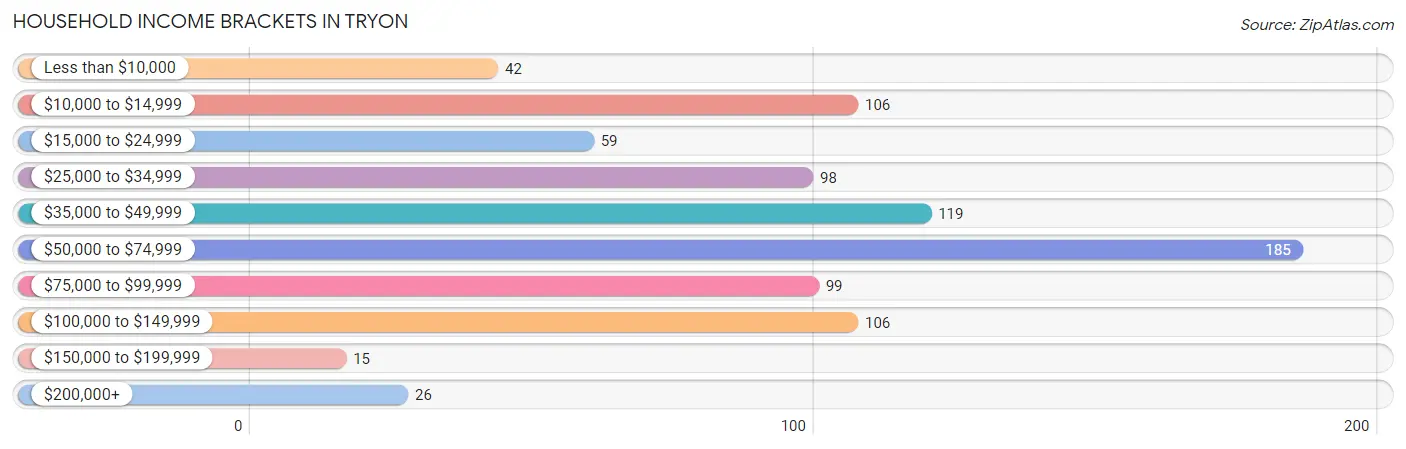
| Income Bracket | # Households | % Households |
| Less than $10,000 | 42 | 4.9% |
| $10,000 to $14,999 | 106 | 12.4% |
| $15,000 to $24,999 | 59 | 6.9% |
| $25,000 to $34,999 | 98 | 11.5% |
| $35,000 to $49,999 | 119 | 13.9% |
| $50,000 to $74,999 | 185 | 21.6% |
| $75,000 to $99,999 | 99 | 11.6% |
| $100,000 to $149,999 | 106 | 12.4% |
| $150,000 to $199,999 | 15 | 1.8% |
| $200,000+ | 26 | 3.0% |
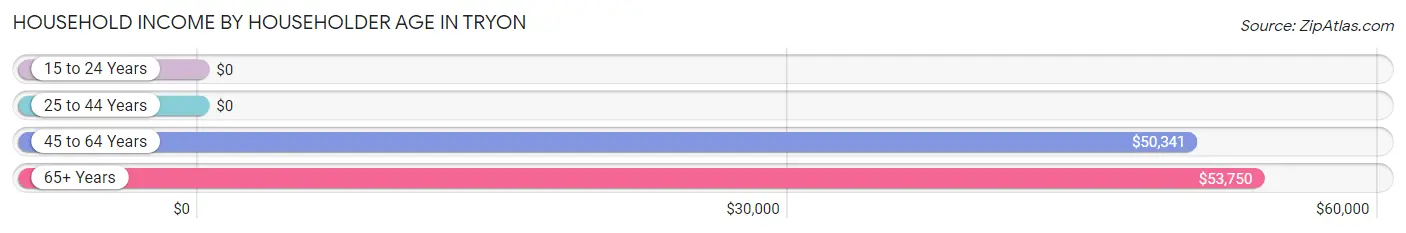
Household Income by Householder Age in Tryon
The median household income in Tryon is $50,398, with the highest median household income of $53,750 found in the 65+ years age bracket for the primary householder. A total of 433 households (50.6%) fall into this category.
| Income Bracket | # Households | Median Income |
| 15 to 24 Years | 0 (0.0%) | $0 |
| 25 to 44 Years | 149 (17.4%) | $0 |
| 45 to 64 Years | 273 (31.9%) | $50,341 |
| 65+ Years | 433 (50.6%) | $53,750 |
| Total | 855 (100.0%) | $50,398 |
Poverty in Tryon
Income Below Poverty by Sex and Age in Tryon
With 17.6% poverty level for males and 18.4% for females among the residents of Tryon, under 5 year old males and 25 to 34 year old females are the most vulnerable to poverty, with 7 males (100.0%) and 81 females (70.4%) in their respective age groups living below the poverty level.
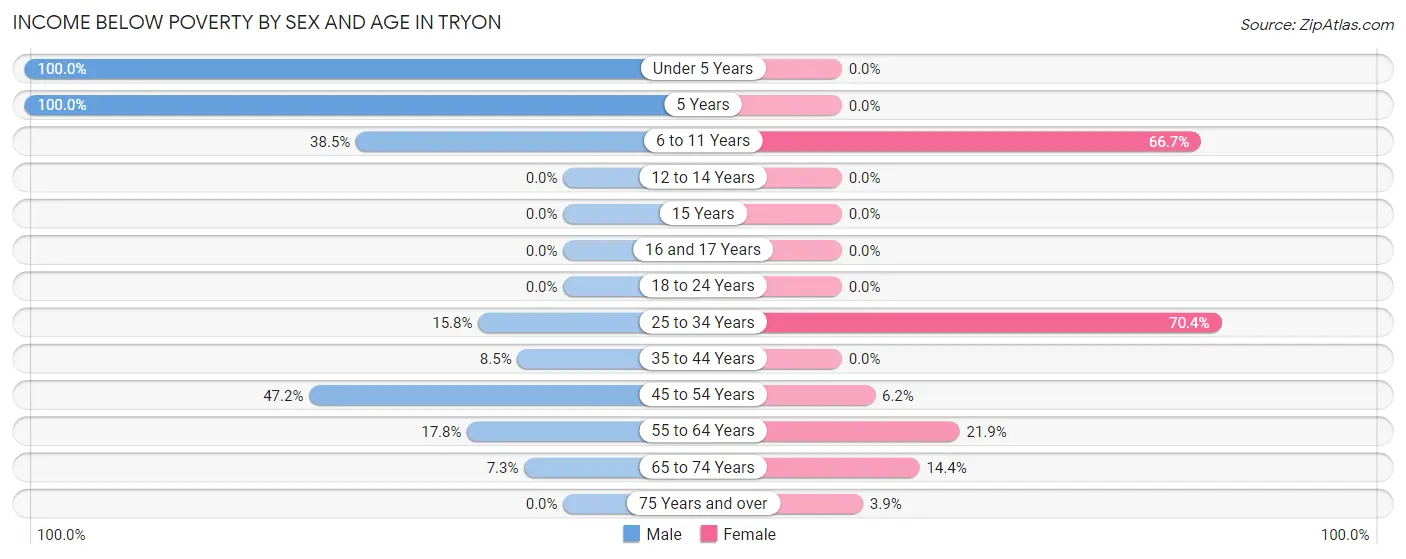
| Age Bracket | Male | Female |
| Under 5 Years | 7 (100.0%) | 0 (0.0%) |
| 5 Years | 6 (100.0%) | 0 (0.0%) |
| 6 to 11 Years | 5 (38.5%) | 14 (66.7%) |
| 12 to 14 Years | 0 (0.0%) | 0 (0.0%) |
| 15 Years | 0 (0.0%) | 0 (0.0%) |
| 16 and 17 Years | 0 (0.0%) | 0 (0.0%) |
| 18 to 24 Years | 0 (0.0%) | 0 (0.0%) |
| 25 to 34 Years | 6 (15.8%) | 81 (70.4%) |
| 35 to 44 Years | 4 (8.5%) | 0 (0.0%) |
| 45 to 54 Years | 50 (47.2%) | 5 (6.2%) |
| 55 to 64 Years | 23 (17.8%) | 26 (21.8%) |
| 65 to 74 Years | 5 (7.2%) | 15 (14.4%) |
| 75 Years and over | 0 (0.0%) | 12 (3.9%) |
| Total | 106 (17.6%) | 153 (18.4%) |
Income Above Poverty by Sex and Age in Tryon
According to the poverty statistics in Tryon, males aged 12 to 14 years and females aged under 5 years are the age groups that are most secure financially, with 100.0% of males and 100.0% of females in these age groups living above the poverty line.
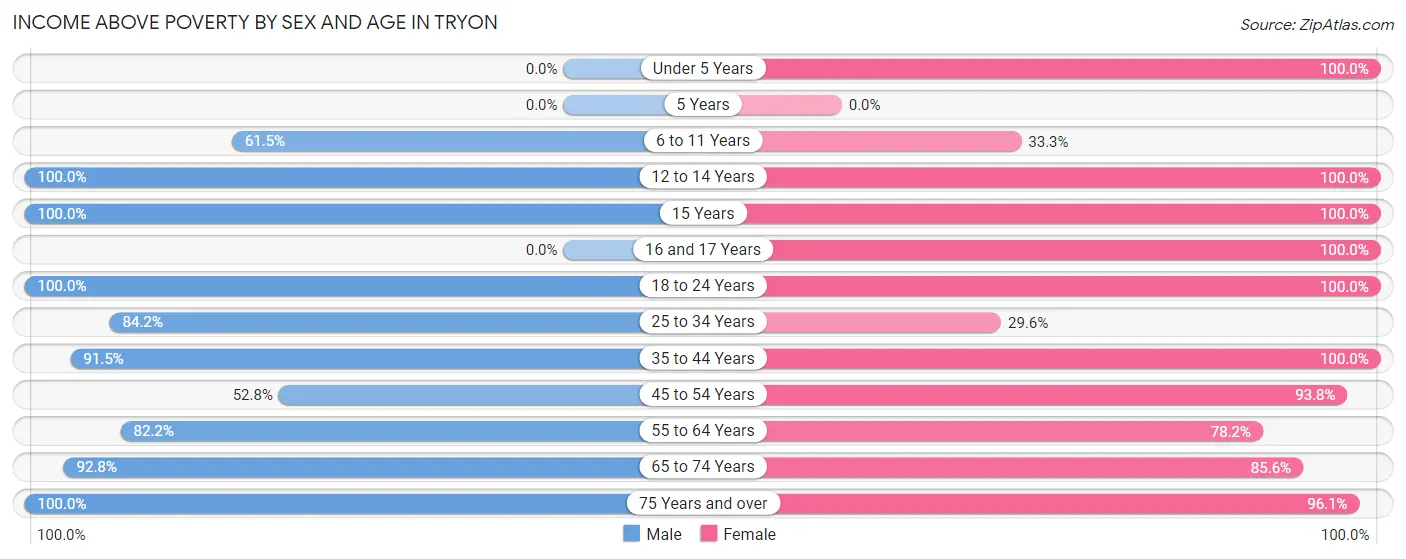
| Age Bracket | Male | Female |
| Under 5 Years | 0 (0.0%) | 8 (100.0%) |
| 5 Years | 0 (0.0%) | 0 (0.0%) |
| 6 to 11 Years | 8 (61.5%) | 7 (33.3%) |
| 12 to 14 Years | 3 (100.0%) | 4 (100.0%) |
| 15 Years | 7 (100.0%) | 9 (100.0%) |
| 16 and 17 Years | 0 (0.0%) | 9 (100.0%) |
| 18 to 24 Years | 21 (100.0%) | 7 (100.0%) |
| 25 to 34 Years | 32 (84.2%) | 34 (29.6%) |
| 35 to 44 Years | 43 (91.5%) | 49 (100.0%) |
| 45 to 54 Years | 56 (52.8%) | 76 (93.8%) |
| 55 to 64 Years | 106 (82.2%) | 93 (78.1%) |
| 65 to 74 Years | 64 (92.7%) | 89 (85.6%) |
| 75 Years and over | 157 (100.0%) | 294 (96.1%) |
| Total | 497 (82.4%) | 679 (81.6%) |
Income Below Poverty Among Married-Couple Families in Tryon
The poverty statistics for married-couple families in Tryon show that 5.4% or 13 of the total 240 families live below the poverty line. Families with 5 or more children have the highest poverty rate of 100.0%, comprising of 8 families. On the other hand, families with 1 or 2 children have the lowest poverty rate of 0.0%, which includes 0 families.
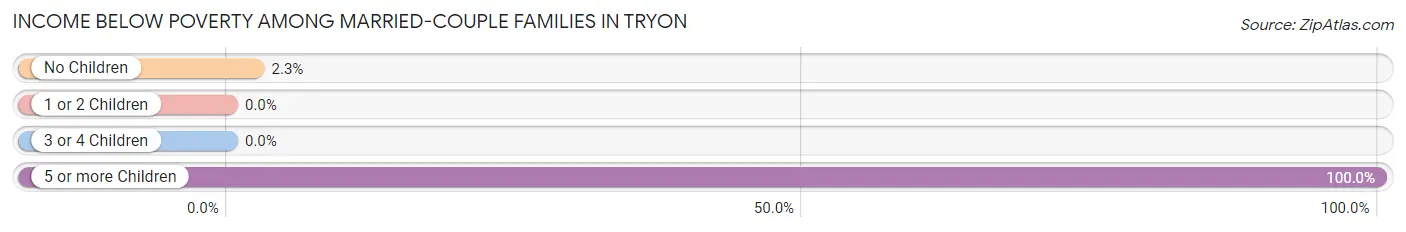
| Children | Above Poverty | Below Poverty |
| No Children | 211 (97.7%) | 5 (2.3%) |
| 1 or 2 Children | 16 (100.0%) | 0 (0.0%) |
| 3 or 4 Children | 0 (0.0%) | 0 (0.0%) |
| 5 or more Children | 0 (0.0%) | 8 (100.0%) |
| Total | 227 (94.6%) | 13 (5.4%) |
Income Below Poverty Among Single-Parent Households in Tryon
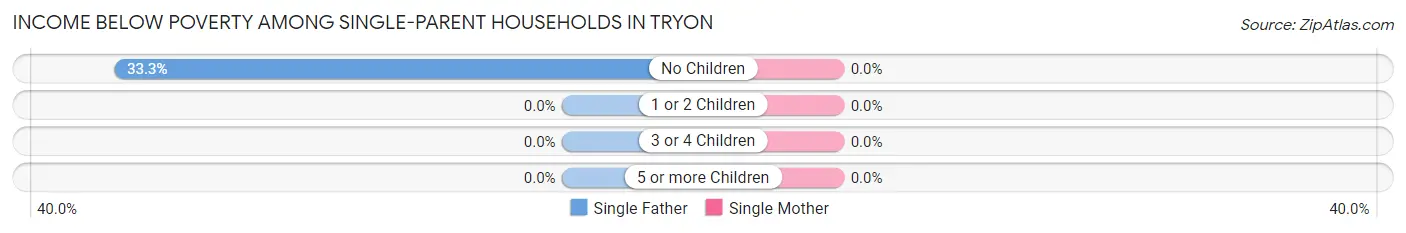
| Children | Single Father | Single Mother |
| No Children | 8 (33.3%) | 0 (0.0%) |
| 1 or 2 Children | 0 (0.0%) | 0 (0.0%) |
| 3 or 4 Children | 0 (0.0%) | 0 (0.0%) |
| 5 or more Children | 0 (0.0%) | 0 (0.0%) |
| Total | 8 (33.3%) | 0 (0.0%) |
Income Below Poverty Among Married-Couple vs Single-Parent Households in Tryon
The poverty data for Tryon shows that 13 of the married-couple family households (5.4%) and 8 of the single-parent households (8.3%) are living below the poverty level. Within the married-couple family households, those with 5 or more children have the highest poverty rate, with 8 households (100.0%) falling below the poverty line. Among the single-parent households, those with no children have the highest poverty rate, with 8 household (10.5%) living below poverty.
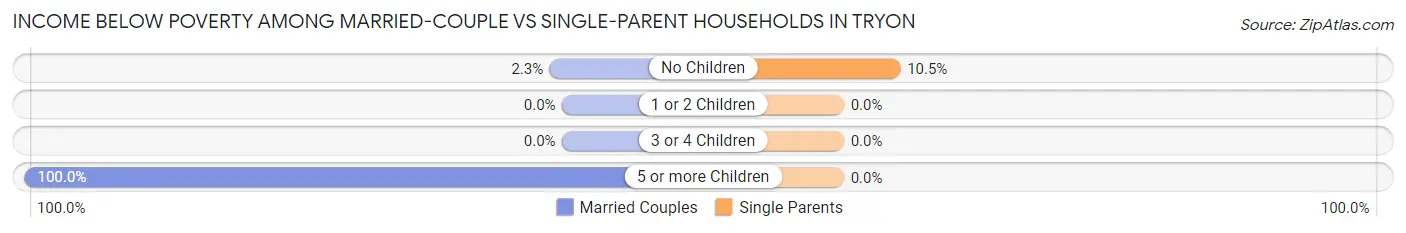
| Children | Married-Couple Families | Single-Parent Households |
| No Children | 5 (2.3%) | 8 (10.5%) |
| 1 or 2 Children | 0 (0.0%) | 0 (0.0%) |
| 3 or 4 Children | 0 (0.0%) | 0 (0.0%) |
| 5 or more Children | 8 (100.0%) | 0 (0.0%) |
| Total | 13 (5.4%) | 8 (8.3%) |
Race in Tryon
The most populous races in Tryon are White / Caucasian (1,265 | 83.4%), Black / African American (171 | 11.3%), and Two or more Races (61 | 4.0%).
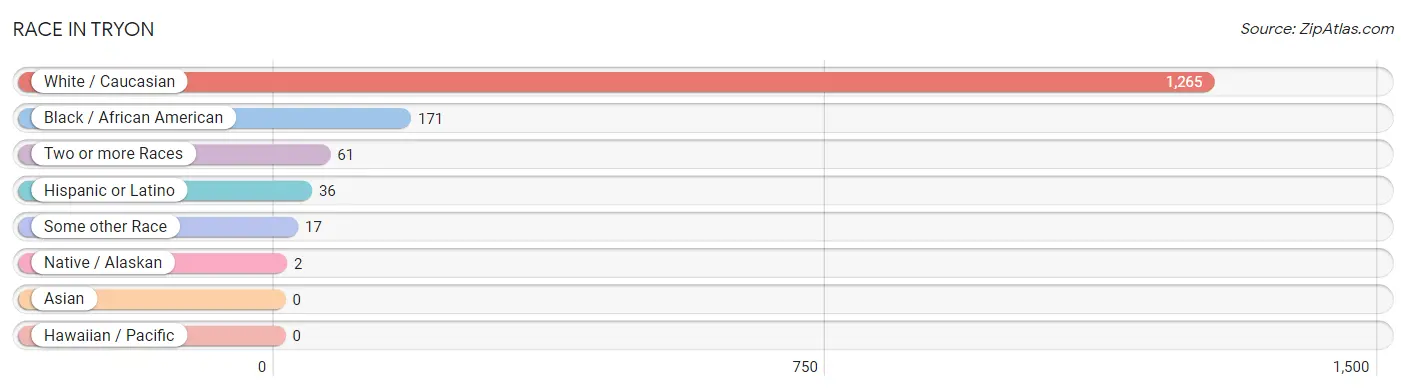
| Race | # Population | % Population |
| Asian | 0 | 0.0% |
| Black / African American | 171 | 11.3% |
| Hawaiian / Pacific | 0 | 0.0% |
| Hispanic or Latino | 36 | 2.4% |
| Native / Alaskan | 2 | 0.1% |
| White / Caucasian | 1,265 | 83.4% |
| Two or more Races | 61 | 4.0% |
| Some other Race | 17 | 1.1% |
| Total | 1,516 | 100.0% |
Ancestry in Tryon
The most populous ancestries reported in Tryon are English (229 | 15.1%), Irish (187 | 12.3%), British (136 | 9.0%), German (128 | 8.4%), and American (117 | 7.7%), together accounting for 52.6% of all Tryon residents.
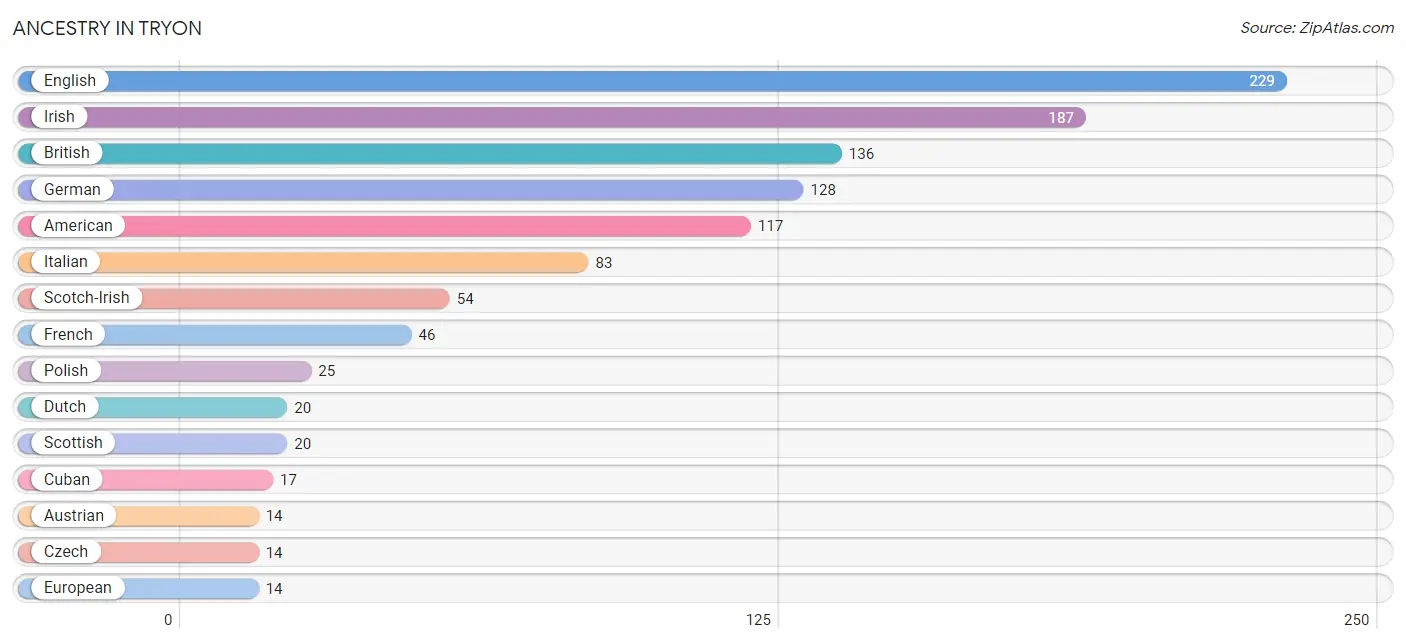
| Ancestry | # Population | % Population |
| American | 117 | 7.7% |
| Argentinean | 6 | 0.4% |
| Austrian | 14 | 0.9% |
| Belgian | 5 | 0.3% |
| British | 136 | 9.0% |
| Canadian | 10 | 0.7% |
| Cuban | 17 | 1.1% |
| Czech | 14 | 0.9% |
| Danish | 6 | 0.4% |
| Dutch | 20 | 1.3% |
| English | 229 | 15.1% |
| European | 14 | 0.9% |
| Finnish | 4 | 0.3% |
| French | 46 | 3.0% |
| French Canadian | 5 | 0.3% |
| German | 128 | 8.4% |
| Greek | 4 | 0.3% |
| Hungarian | 4 | 0.3% |
| Irish | 187 | 12.3% |
| Italian | 83 | 5.5% |
| Norwegian | 9 | 0.6% |
| Pennsylvania German | 10 | 0.7% |
| Polish | 25 | 1.7% |
| Puerto Rican | 13 | 0.9% |
| Russian | 4 | 0.3% |
| Scotch-Irish | 54 | 3.6% |
| Scottish | 20 | 1.3% |
| South American | 6 | 0.4% |
| Swiss | 7 | 0.5% |
| Ukrainian | 3 | 0.2% |
| Welsh | 5 | 0.3% | View All 31 Rows |
Immigrants in Tryon
The most numerous immigrant groups reported in Tryon came from Canada (23 | 1.5%), Europe (19 | 1.3%), Caribbean (17 | 1.1%), Cuba (17 | 1.1%), and Latin America (17 | 1.1%), together accounting for 6.1% of all Tryon residents.
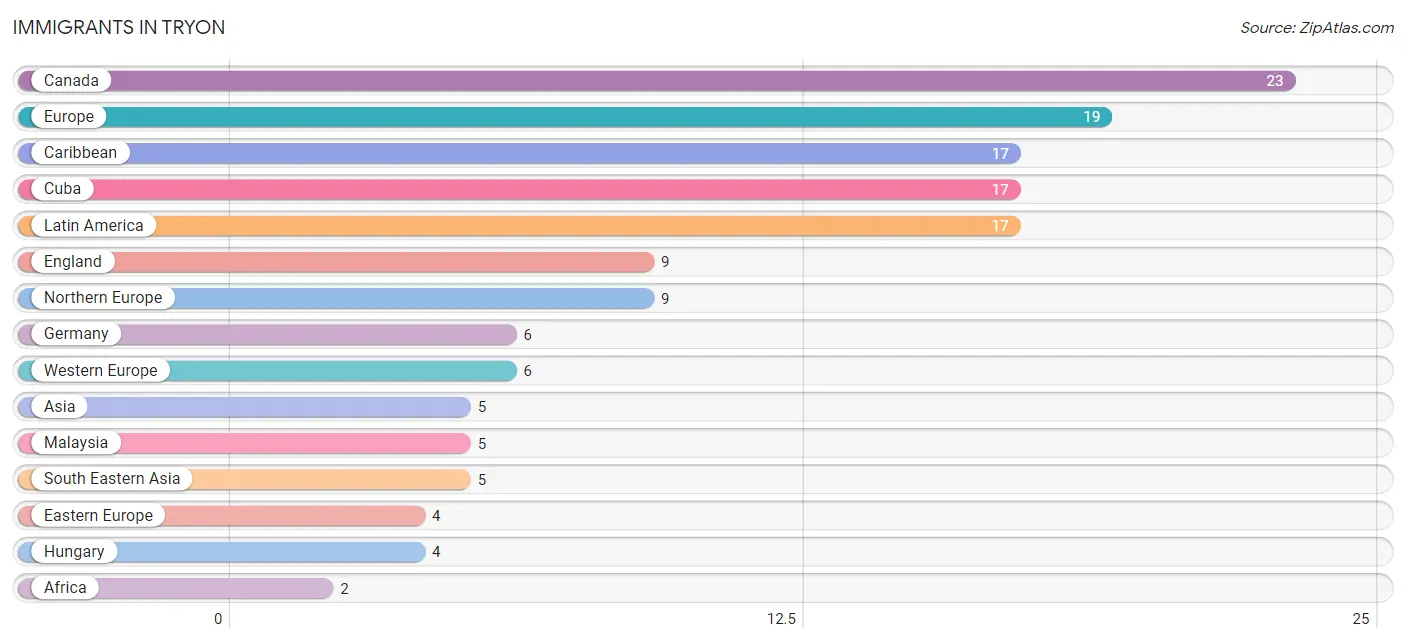
| Immigration Origin | # Population | % Population |
| Africa | 2 | 0.1% |
| Asia | 5 | 0.3% |
| Canada | 23 | 1.5% |
| Caribbean | 17 | 1.1% |
| Cuba | 17 | 1.1% |
| Eastern Europe | 4 | 0.3% |
| England | 9 | 0.6% |
| Europe | 19 | 1.3% |
| Germany | 6 | 0.4% |
| Hungary | 4 | 0.3% |
| Latin America | 17 | 1.1% |
| Malaysia | 5 | 0.3% |
| Northern Europe | 9 | 0.6% |
| South Africa | 2 | 0.1% |
| South Eastern Asia | 5 | 0.3% |
| Western Europe | 6 | 0.4% | View All 16 Rows |
Sex and Age in Tryon
Sex and Age in Tryon
The most populous age groups in Tryon are 55 to 59 Years (89 | 14.2%) for men and 85 Years and over (182 | 20.4%) for women.
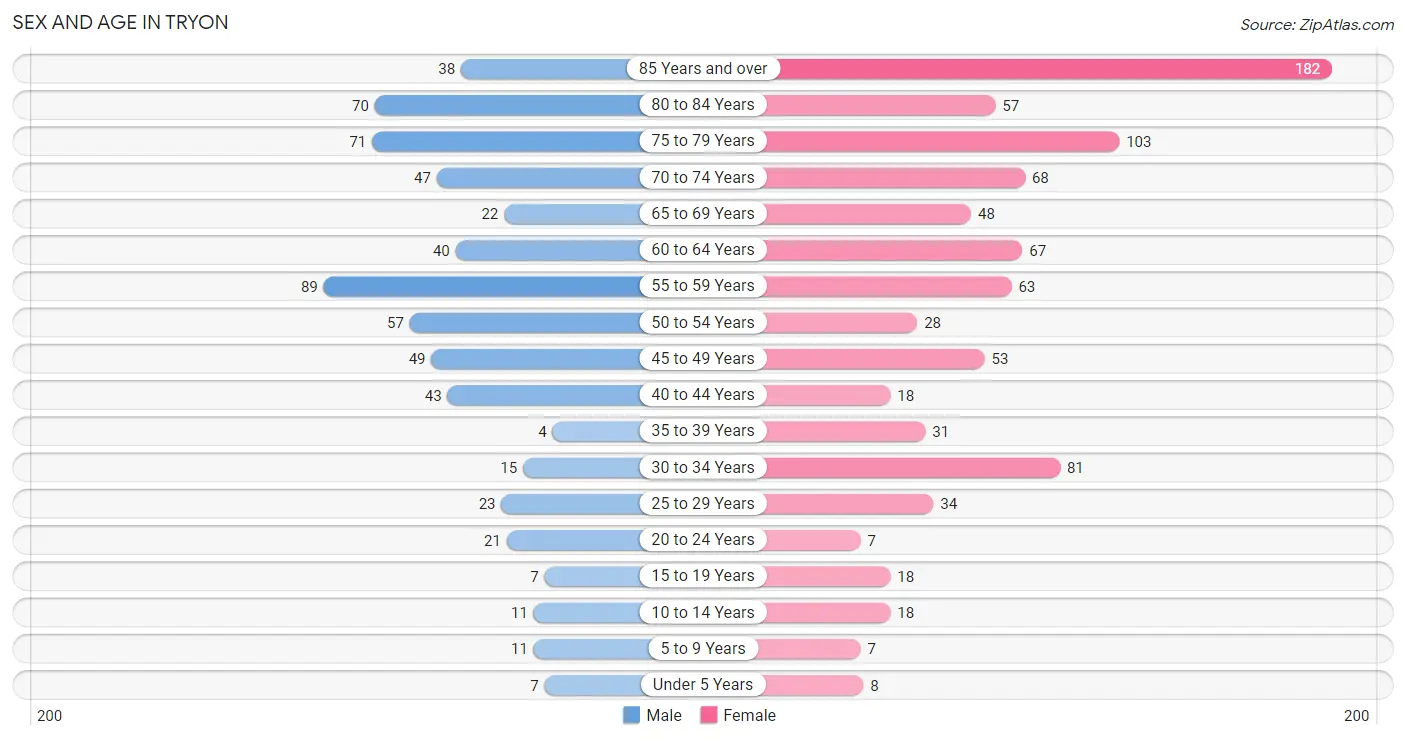
| Age Bracket | Male | Female |
| Under 5 Years | 7 (1.1%) | 8 (0.9%) |
| 5 to 9 Years | 11 (1.8%) | 7 (0.8%) |
| 10 to 14 Years | 11 (1.8%) | 18 (2.0%) |
| 15 to 19 Years | 7 (1.1%) | 18 (2.0%) |
| 20 to 24 Years | 21 (3.4%) | 7 (0.8%) |
| 25 to 29 Years | 23 (3.7%) | 34 (3.8%) |
| 30 to 34 Years | 15 (2.4%) | 81 (9.1%) |
| 35 to 39 Years | 4 (0.6%) | 31 (3.5%) |
| 40 to 44 Years | 43 (6.9%) | 18 (2.0%) |
| 45 to 49 Years | 49 (7.8%) | 53 (5.9%) |
| 50 to 54 Years | 57 (9.1%) | 28 (3.1%) |
| 55 to 59 Years | 89 (14.2%) | 63 (7.1%) |
| 60 to 64 Years | 40 (6.4%) | 67 (7.5%) |
| 65 to 69 Years | 22 (3.5%) | 48 (5.4%) |
| 70 to 74 Years | 47 (7.5%) | 68 (7.6%) |
| 75 to 79 Years | 71 (11.4%) | 103 (11.6%) |
| 80 to 84 Years | 70 (11.2%) | 57 (6.4%) |
| 85 Years and over | 38 (6.1%) | 182 (20.4%) |
| Total | 625 (100.0%) | 891 (100.0%) |
Families and Households in Tryon
Median Family Size in Tryon
The median family size in Tryon is 2.44 persons per family, with single female/mother families (72 | 21.4%) accounting for the largest median family size of 2.63 persons per family. On the other hand, single male/father families (24 | 7.1%) represent the smallest median family size with 2.00 persons per family.
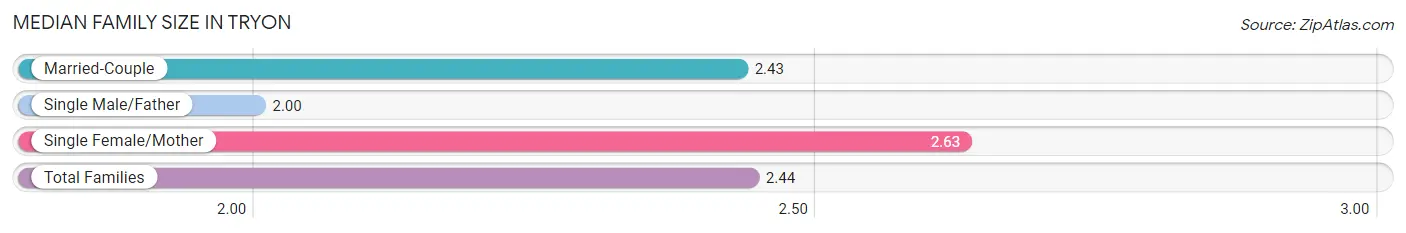
| Family Type | # Families | Family Size |
| Married-Couple | 240 (71.4%) | 2.43 |
| Single Male/Father | 24 (7.1%) | 2.00 |
| Single Female/Mother | 72 (21.4%) | 2.63 |
| Total Families | 336 (100.0%) | 2.44 |
Median Household Size in Tryon
The median household size in Tryon is 1.68 persons per household, with single female/mother households (72 | 8.4%) accounting for the largest median household size of 3.42 persons per household. non-family households (519 | 60.7%) represent the smallest median household size with 1.07 persons per household.
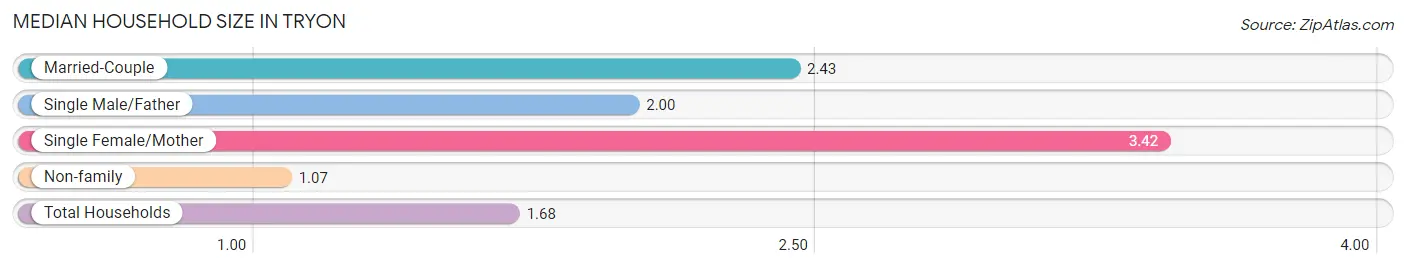
| Household Type | # Households | Household Size |
| Married-Couple | 240 (28.1%) | 2.43 |
| Single Male/Father | 24 (2.8%) | 2.00 |
| Single Female/Mother | 72 (8.4%) | 3.42 |
| Non-family | 519 (60.7%) | 1.07 |
| Total Households | 855 (100.0%) | 1.68 |
Household Size by Marriage Status in Tryon
Out of a total of 855 households in Tryon, 336 (39.3%) are family households, while 519 (60.7%) are nonfamily households. The most numerous type of family households are 2-person households, comprising 248, and the most common type of nonfamily households are 1-person households, comprising 475.
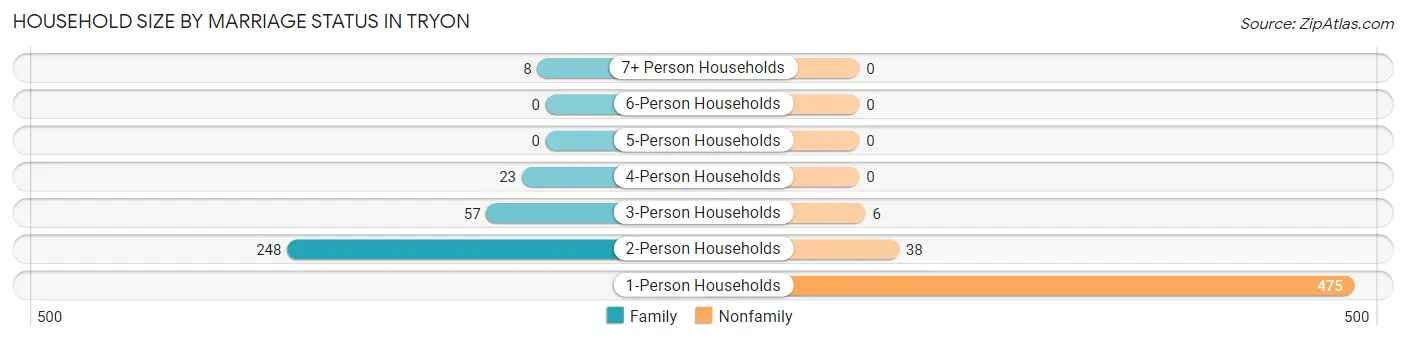
| Household Size | Family Households | Nonfamily Households |
| 1-Person Households | - | 475 (55.6%) |
| 2-Person Households | 248 (29.0%) | 38 (4.4%) |
| 3-Person Households | 57 (6.7%) | 6 (0.7%) |
| 4-Person Households | 23 (2.7%) | 0 (0.0%) |
| 5-Person Households | 0 (0.0%) | 0 (0.0%) |
| 6-Person Households | 0 (0.0%) | 0 (0.0%) |
| 7+ Person Households | 8 (0.9%) | 0 (0.0%) |
| Total | 336 (39.3%) | 519 (60.7%) |
Female Fertility in Tryon
Fertility by Age in Tryon
| Age Bracket | Women with Births | Births / 1,000 Women |
| 15 to 19 years | 0 (0.0%) | 0.0 |
| 20 to 34 years | 0 (0.0%) | 0.0 |
| 35 to 50 years | 0 (0.0%) | 0.0 |
| Total | 0 (0.0%) | 0.0 |
Fertility by Age by Marriage Status in Tryon
| Age Bracket | Married | Unmarried |
| 15 to 19 years | 0 (0.0%) | 0 (0.0%) |
| 20 to 34 years | 0 (0.0%) | 0 (0.0%) |
| 35 to 50 years | 0 (0.0%) | 0 (0.0%) |
| Total | 0 (0.0%) | 0 (0.0%) |
Fertility by Education in Tryon
| Educational Attainment | Women with Births | Births / 1,000 Women |
| Less than High School | 0 (0.0%) | 0.0 |
| High School Diploma | 0 (0.0%) | 0.0 |
| College or Associate's Degree | 0 (0.0%) | 0.0 |
| Bachelor's Degree | 0 (0.0%) | 0.0 |
| Graduate Degree | 0 (0.0%) | 0.0 |
| Total | 0 (0.0%) | 0.0 |
Fertility by Education by Marriage Status in Tryon
| Educational Attainment | Married | Unmarried |
| Less than High School | 0 (0.0%) | 0 (0.0%) |
| High School Diploma | 0 (0.0%) | 0 (0.0%) |
| College or Associate's Degree | 0 (0.0%) | 0 (0.0%) |
| Bachelor's Degree | 0 (0.0%) | 0 (0.0%) |
| Graduate Degree | 0 (0.0%) | 0 (0.0%) |
| Total | 0 (0.0%) | 0 (0.0%) |
Employment Characteristics in Tryon
Employment by Class of Employer in Tryon
Among the 630 employed individuals in Tryon, private company employees (362 | 57.5%), self-employed (not incorporated) (92 | 14.6%), and self-employed (incorporated) (87 | 13.8%) make up the most common classes of employment.
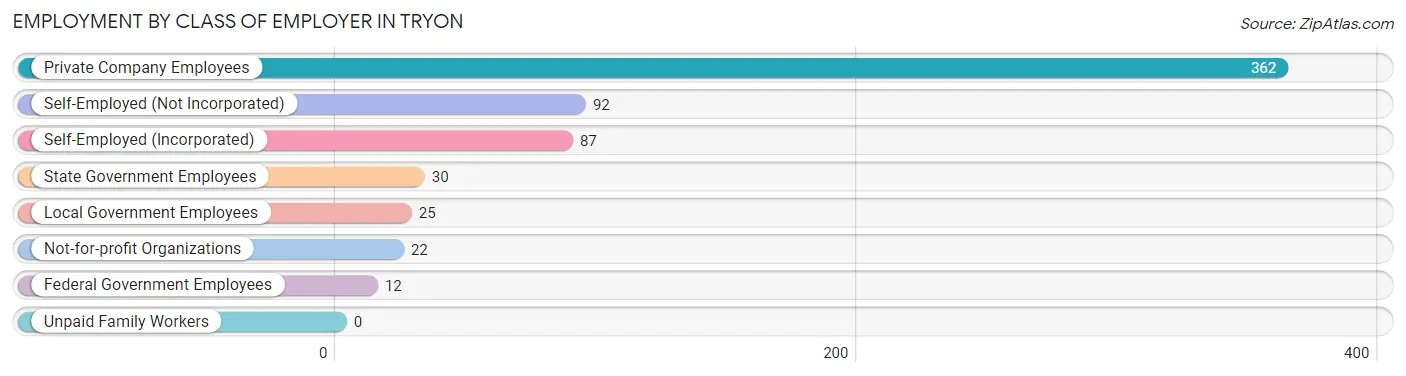
| Employer Class | # Employees | % Employees |
| Private Company Employees | 362 | 57.5% |
| Self-Employed (Incorporated) | 87 | 13.8% |
| Self-Employed (Not Incorporated) | 92 | 14.6% |
| Not-for-profit Organizations | 22 | 3.5% |
| Local Government Employees | 25 | 4.0% |
| State Government Employees | 30 | 4.8% |
| Federal Government Employees | 12 | 1.9% |
| Unpaid Family Workers | 0 | 0.0% |
| Total | 630 | 100.0% |
Employment Status by Age in Tryon
According to the labor force statistics for Tryon, out of the total population over 16 years of age (1,438), 44.7% or 643 individuals are in the labor force, with 2.0% or 13 of them unemployed. The age group with the highest labor force participation rate is 16 to 19 years, with 100.0% or 9 individuals in the labor force. Within the labor force, the 45 to 54 years age range has the highest percentage of unemployed individuals, with 9.3% or 13 of them being unemployed.
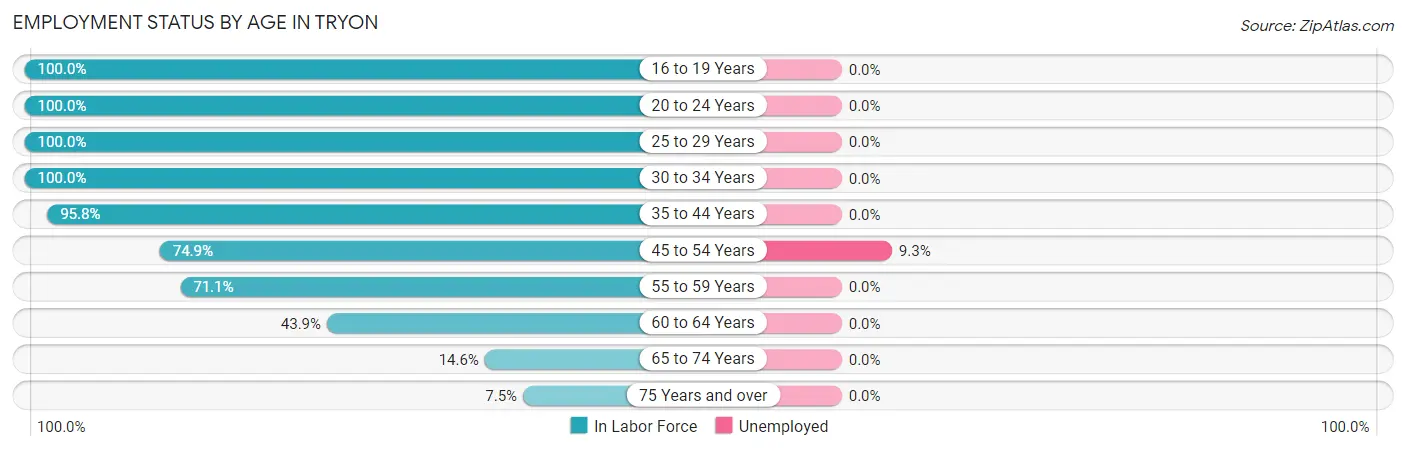
| Age Bracket | In Labor Force | Unemployed |
| 16 to 19 Years | 9 (100.0%) | 0 (0.0%) |
| 20 to 24 Years | 28 (100.0%) | 0 (0.0%) |
| 25 to 29 Years | 57 (100.0%) | 0 (0.0%) |
| 30 to 34 Years | 96 (100.0%) | 0 (0.0%) |
| 35 to 44 Years | 92 (95.8%) | 0 (0.0%) |
| 45 to 54 Years | 140 (74.9%) | 13 (9.3%) |
| 55 to 59 Years | 108 (71.1%) | 0 (0.0%) |
| 60 to 64 Years | 47 (43.9%) | 0 (0.0%) |
| 65 to 74 Years | 27 (14.6%) | 0 (0.0%) |
| 75 Years and over | 39 (7.5%) | 0 (0.0%) |
| Total | 643 (44.7%) | 13 (2.0%) |
Employment Status by Educational Attainment in Tryon
According to labor force statistics for Tryon, 77.7% of individuals (540) out of the total population between 25 and 64 years of age (695) are in the labor force, with 2.4% or 13 of them being unemployed. The group with the highest labor force participation rate are those with the educational attainment of college / associate degree, with 84.7% or 171 individuals in the labor force. Within the labor force, individuals with bachelor's degree or higher education have the highest percentage of unemployment, with 5.3% or 13 of them being unemployed.
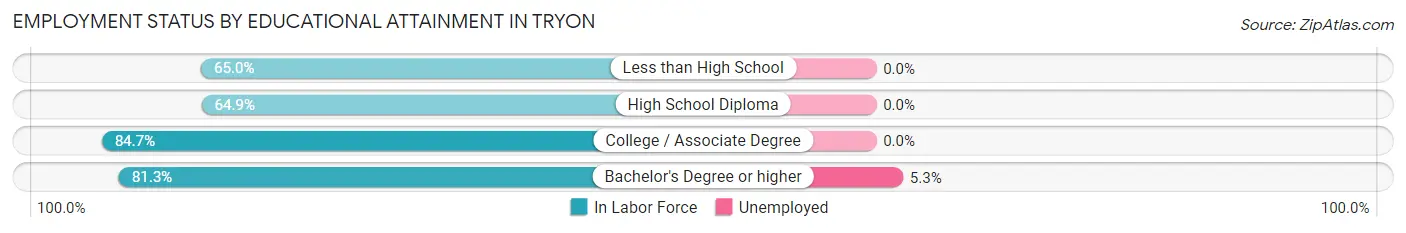
| Educational Attainment | In Labor Force | Unemployed |
| Less than High School | 26 (65.0%) | 0 (0.0%) |
| High School Diploma | 100 (64.9%) | 0 (0.0%) |
| College / Associate Degree | 171 (84.7%) | 0 (0.0%) |
| Bachelor's Degree or higher | 243 (81.3%) | 16 (5.3%) |
| Total | 540 (77.7%) | 17 (2.4%) |
Employment Occupations by Sex in Tryon
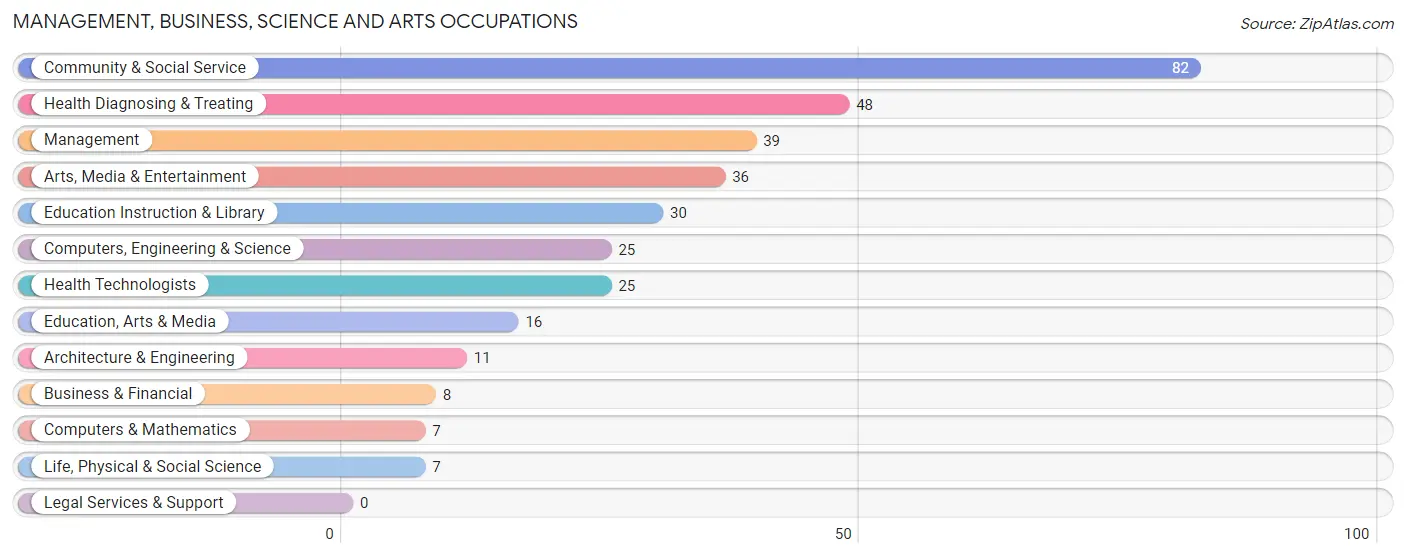
Management, Business, Science and Arts Occupations
The most common Management, Business, Science and Arts occupations in Tryon are Community & Social Service (82 | 13.0%), Health Diagnosing & Treating (48 | 7.6%), Management (39 | 6.2%), Arts, Media & Entertainment (36 | 5.7%), and Education Instruction & Library (30 | 4.8%).
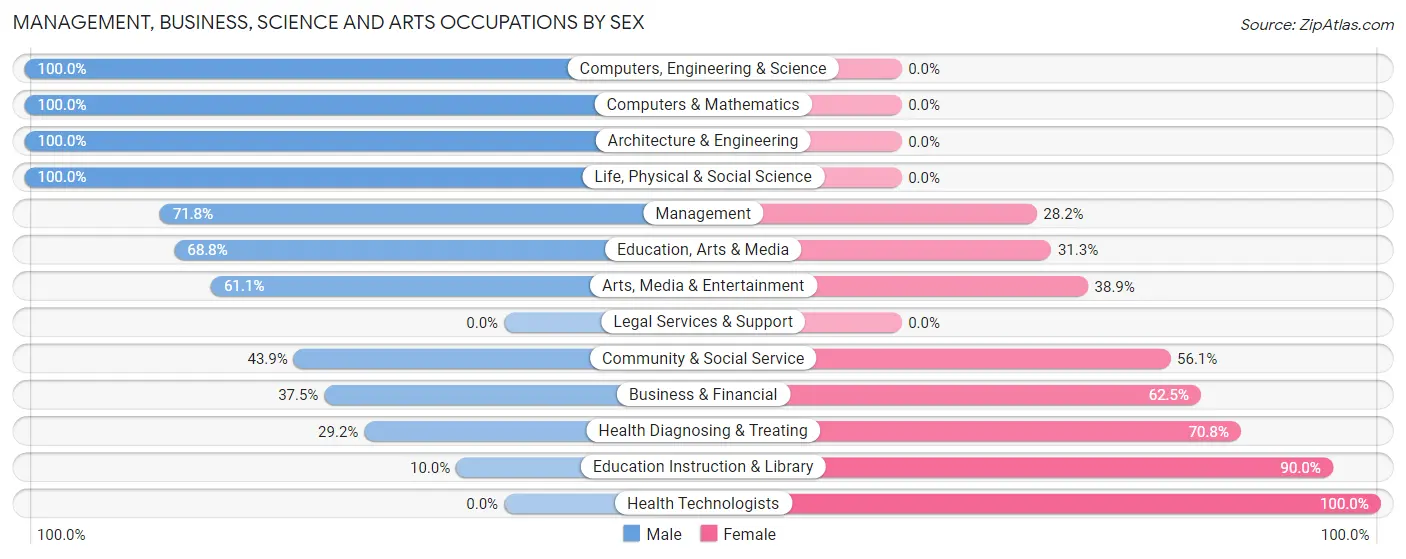
Management, Business, Science and Arts Occupations by Sex
Within the Management, Business, Science and Arts occupations in Tryon, the most male-oriented occupations are Computers, Engineering & Science (100.0%), Computers & Mathematics (100.0%), and Architecture & Engineering (100.0%), while the most female-oriented occupations are Health Technologists (100.0%), Education Instruction & Library (90.0%), and Health Diagnosing & Treating (70.8%).
| Occupation | Male | Female |
| Management | 28 (71.8%) | 11 (28.2%) |
| Business & Financial | 3 (37.5%) | 5 (62.5%) |
| Computers, Engineering & Science | 25 (100.0%) | 0 (0.0%) |
| Computers & Mathematics | 7 (100.0%) | 0 (0.0%) |
| Architecture & Engineering | 11 (100.0%) | 0 (0.0%) |
| Life, Physical & Social Science | 7 (100.0%) | 0 (0.0%) |
| Community & Social Service | 36 (43.9%) | 46 (56.1%) |
| Education, Arts & Media | 11 (68.8%) | 5 (31.2%) |
| Legal Services & Support | 0 (0.0%) | 0 (0.0%) |
| Education Instruction & Library | 3 (10.0%) | 27 (90.0%) |
| Arts, Media & Entertainment | 22 (61.1%) | 14 (38.9%) |
| Health Diagnosing & Treating | 14 (29.2%) | 34 (70.8%) |
| Health Technologists | 0 (0.0%) | 25 (100.0%) |
| Total (Category) | 106 (52.5%) | 96 (47.5%) |
| Total (Overall) | 300 (47.6%) | 330 (52.4%) |
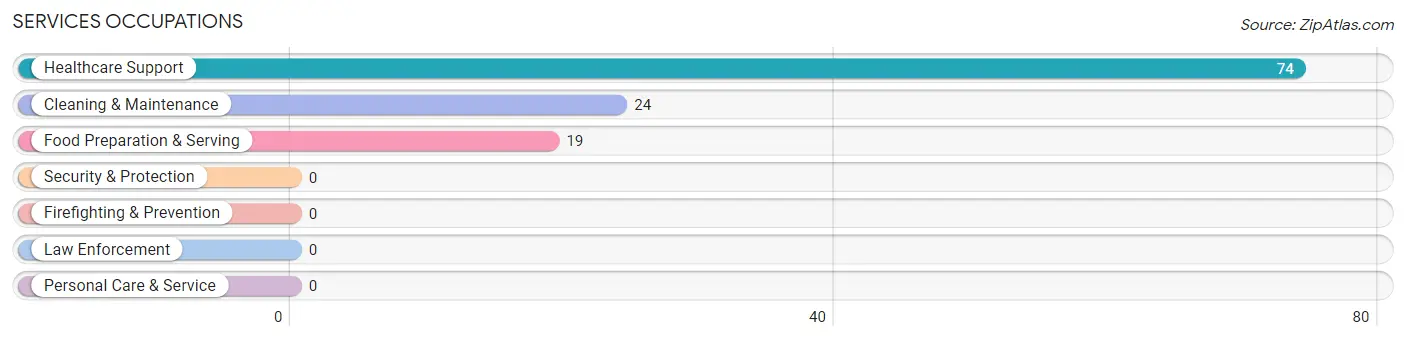
Services Occupations
The most common Services occupations in Tryon are Healthcare Support (74 | 11.7%), Cleaning & Maintenance (24 | 3.8%), and Food Preparation & Serving (19 | 3.0%).
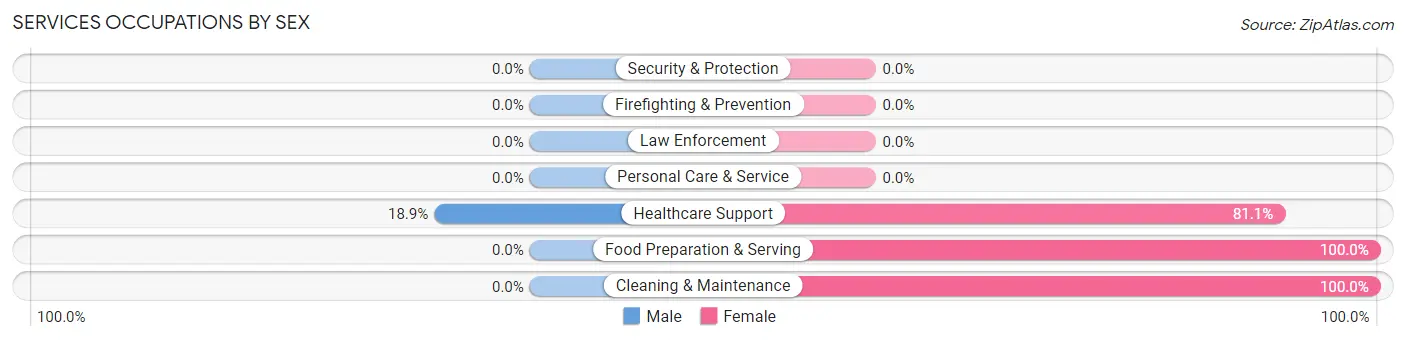
Services Occupations by Sex
| Occupation | Male | Female |
| Healthcare Support | 14 (18.9%) | 60 (81.1%) |
| Security & Protection | 0 (0.0%) | 0 (0.0%) |
| Firefighting & Prevention | 0 (0.0%) | 0 (0.0%) |
| Law Enforcement | 0 (0.0%) | 0 (0.0%) |
| Food Preparation & Serving | 0 (0.0%) | 19 (100.0%) |
| Cleaning & Maintenance | 0 (0.0%) | 24 (100.0%) |
| Personal Care & Service | 0 (0.0%) | 0 (0.0%) |
| Total (Category) | 14 (12.0%) | 103 (88.0%) |
| Total (Overall) | 300 (47.6%) | 330 (52.4%) |
Sales and Office Occupations
The most common Sales and Office occupations in Tryon are Sales & Related (63 | 10.0%), and Office & Administration (33 | 5.2%).
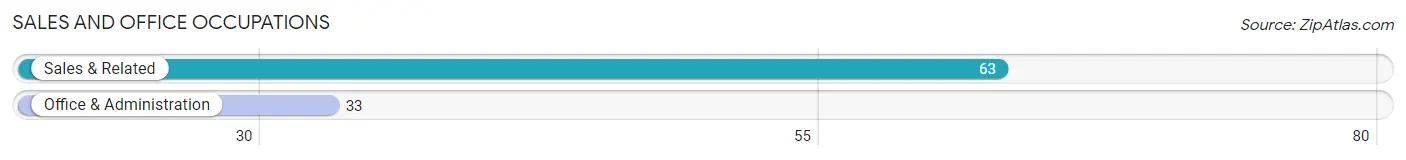
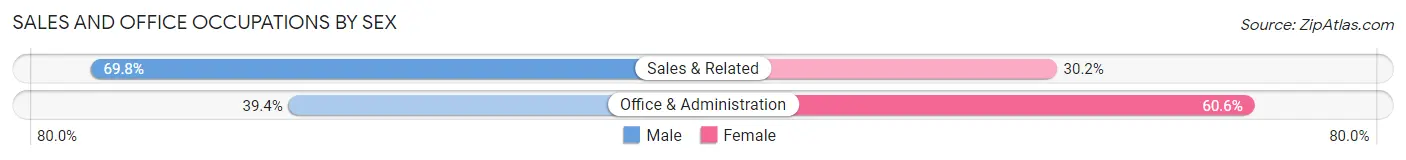
Sales and Office Occupations by Sex
| Occupation | Male | Female |
| Sales & Related | 44 (69.8%) | 19 (30.2%) |
| Office & Administration | 13 (39.4%) | 20 (60.6%) |
| Total (Category) | 57 (59.4%) | 39 (40.6%) |
| Total (Overall) | 300 (47.6%) | 330 (52.4%) |
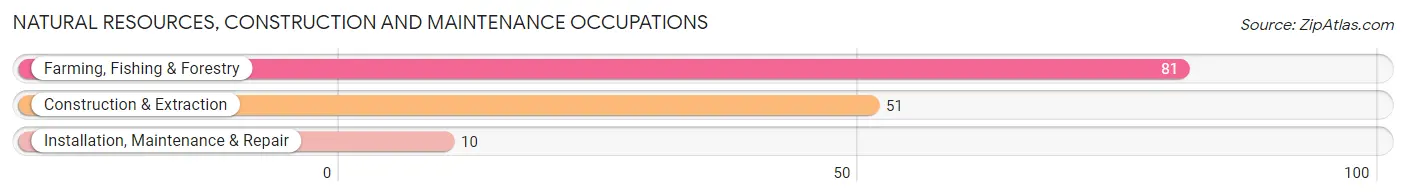
Natural Resources, Construction and Maintenance Occupations
The most common Natural Resources, Construction and Maintenance occupations in Tryon are Farming, Fishing & Forestry (81 | 12.9%), Construction & Extraction (51 | 8.1%), and Installation, Maintenance & Repair (10 | 1.6%).
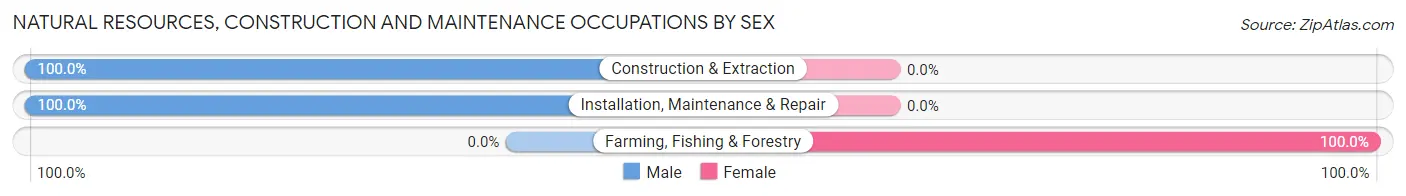
Natural Resources, Construction and Maintenance Occupations by Sex
| Occupation | Male | Female |
| Farming, Fishing & Forestry | 0 (0.0%) | 81 (100.0%) |
| Construction & Extraction | 51 (100.0%) | 0 (0.0%) |
| Installation, Maintenance & Repair | 10 (100.0%) | 0 (0.0%) |
| Total (Category) | 61 (43.0%) | 81 (57.0%) |
| Total (Overall) | 300 (47.6%) | 330 (52.4%) |
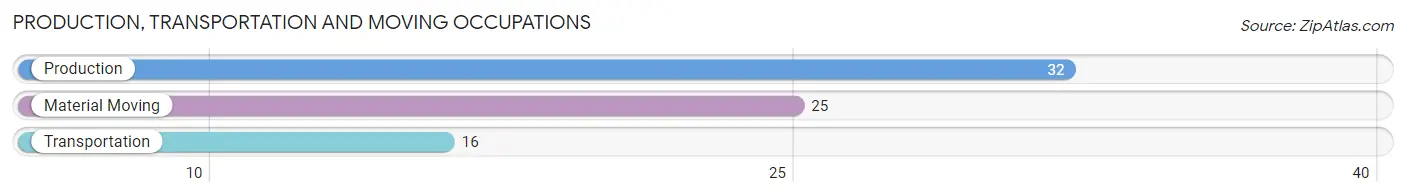
Production, Transportation and Moving Occupations
The most common Production, Transportation and Moving occupations in Tryon are Production (32 | 5.1%), Material Moving (25 | 4.0%), and Transportation (16 | 2.5%).
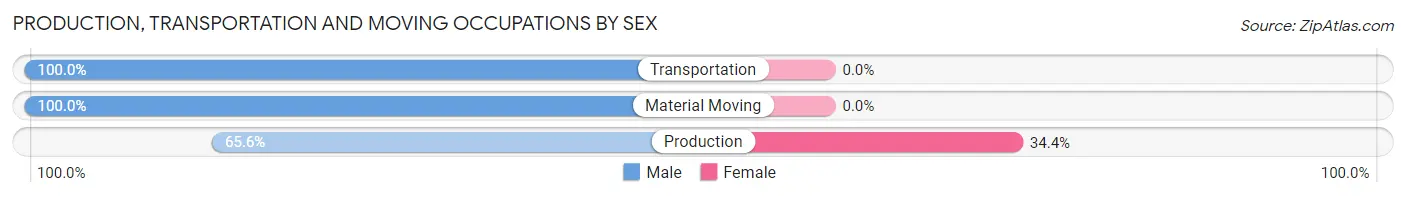
Production, Transportation and Moving Occupations by Sex
| Occupation | Male | Female |
| Production | 21 (65.6%) | 11 (34.4%) |
| Transportation | 16 (100.0%) | 0 (0.0%) |
| Material Moving | 25 (100.0%) | 0 (0.0%) |
| Total (Category) | 62 (84.9%) | 11 (15.1%) |
| Total (Overall) | 300 (47.6%) | 330 (52.4%) |
Employment Industries by Sex in Tryon
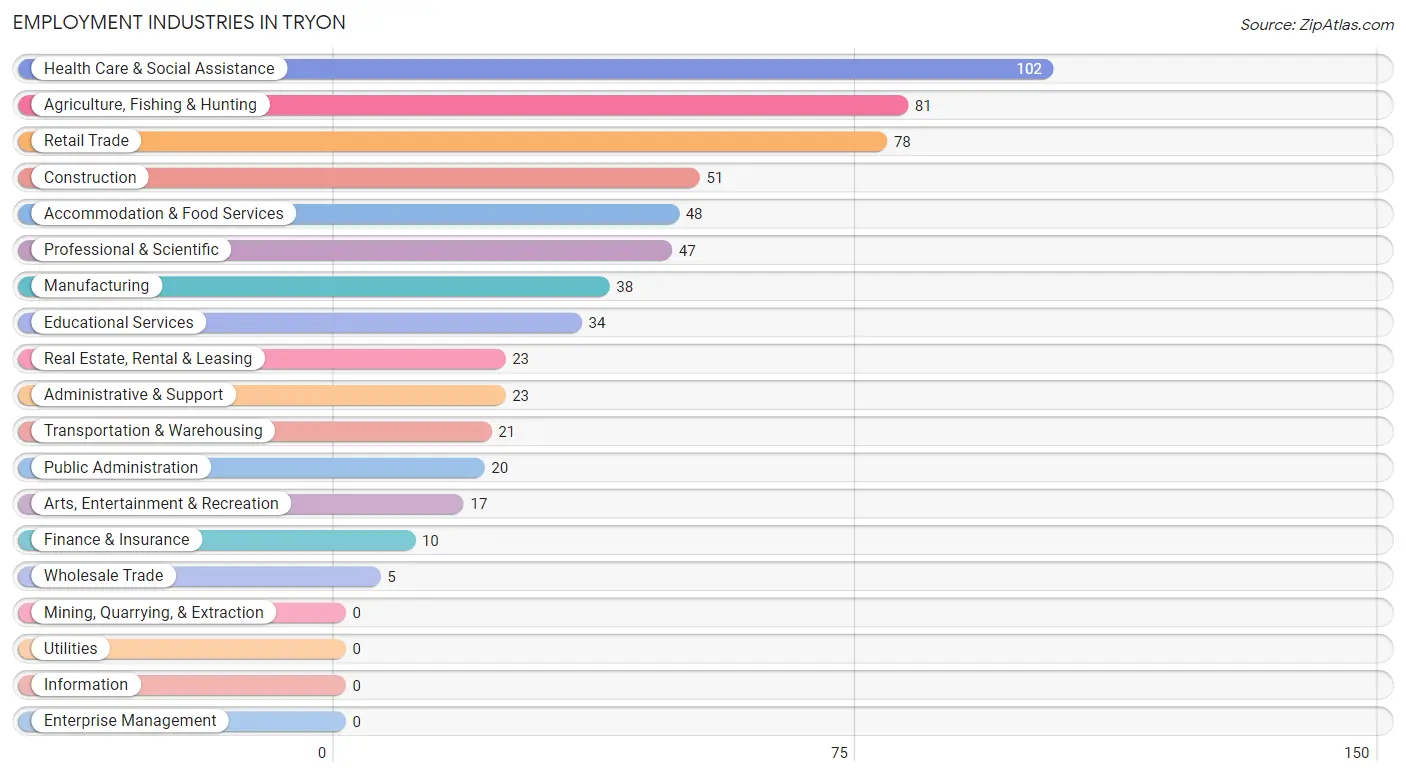
Employment Industries in Tryon
The major employment industries in Tryon include Health Care & Social Assistance (102 | 16.2%), Agriculture, Fishing & Hunting (81 | 12.9%), Retail Trade (78 | 12.4%), Construction (51 | 8.1%), and Accommodation & Food Services (48 | 7.6%).
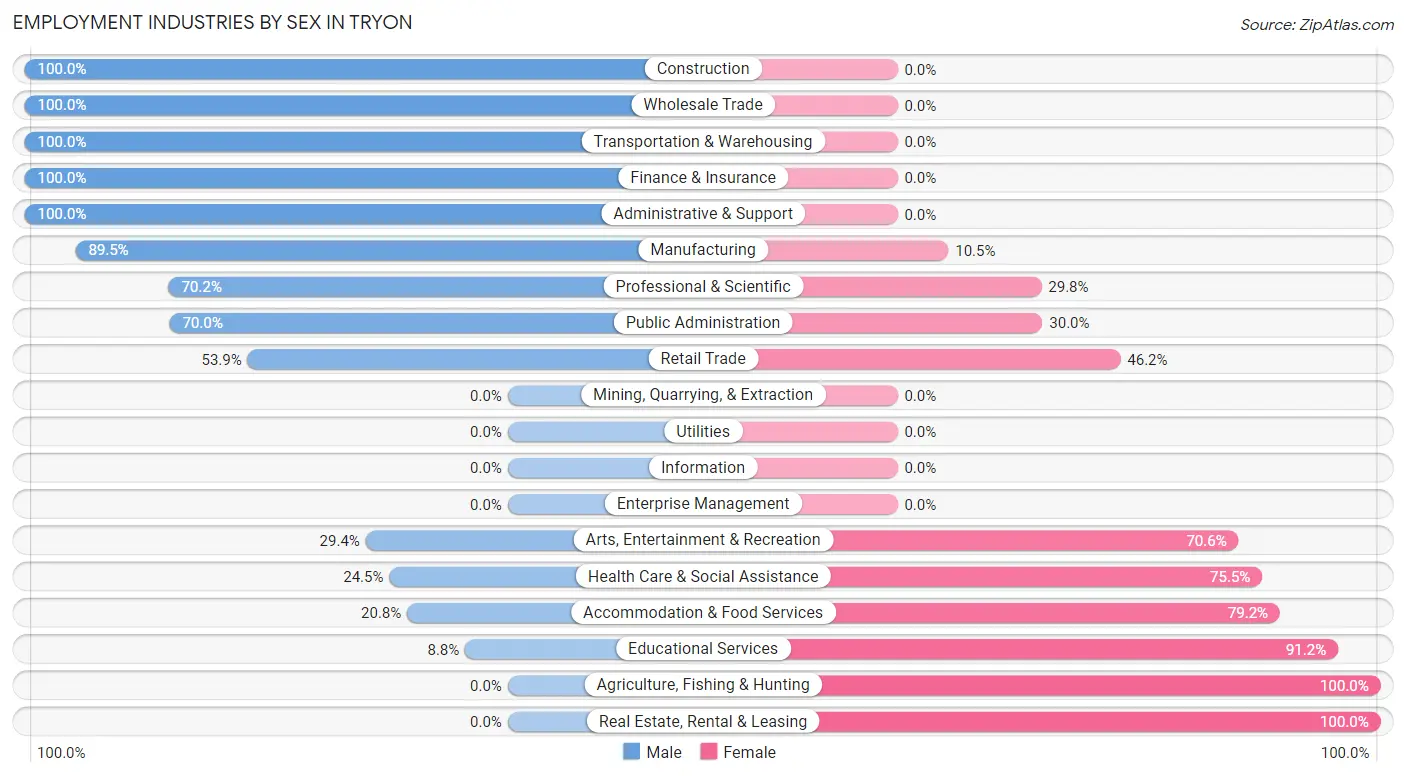
Employment Industries by Sex in Tryon
The Tryon industries that see more men than women are Construction (100.0%), Wholesale Trade (100.0%), and Transportation & Warehousing (100.0%), whereas the industries that tend to have a higher number of women are Agriculture, Fishing & Hunting (100.0%), Real Estate, Rental & Leasing (100.0%), and Educational Services (91.2%).
| Industry | Male | Female |
| Agriculture, Fishing & Hunting | 0 (0.0%) | 81 (100.0%) |
| Mining, Quarrying, & Extraction | 0 (0.0%) | 0 (0.0%) |
| Construction | 51 (100.0%) | 0 (0.0%) |
| Manufacturing | 34 (89.5%) | 4 (10.5%) |
| Wholesale Trade | 5 (100.0%) | 0 (0.0%) |
| Retail Trade | 42 (53.8%) | 36 (46.2%) |
| Transportation & Warehousing | 21 (100.0%) | 0 (0.0%) |
| Utilities | 0 (0.0%) | 0 (0.0%) |
| Information | 0 (0.0%) | 0 (0.0%) |
| Finance & Insurance | 10 (100.0%) | 0 (0.0%) |
| Real Estate, Rental & Leasing | 0 (0.0%) | 23 (100.0%) |
| Professional & Scientific | 33 (70.2%) | 14 (29.8%) |
| Enterprise Management | 0 (0.0%) | 0 (0.0%) |
| Administrative & Support | 23 (100.0%) | 0 (0.0%) |
| Educational Services | 3 (8.8%) | 31 (91.2%) |
| Health Care & Social Assistance | 25 (24.5%) | 77 (75.5%) |
| Arts, Entertainment & Recreation | 5 (29.4%) | 12 (70.6%) |
| Accommodation & Food Services | 10 (20.8%) | 38 (79.2%) |
| Public Administration | 14 (70.0%) | 6 (30.0%) |
| Total | 300 (47.6%) | 330 (52.4%) |
Education in Tryon
School Enrollment in Tryon
The most common levels of schooling among the 105 students in Tryon are college / undergraduate (38 | 36.2%), middle school (29 | 27.6%), and elementary school (19 | 18.1%).
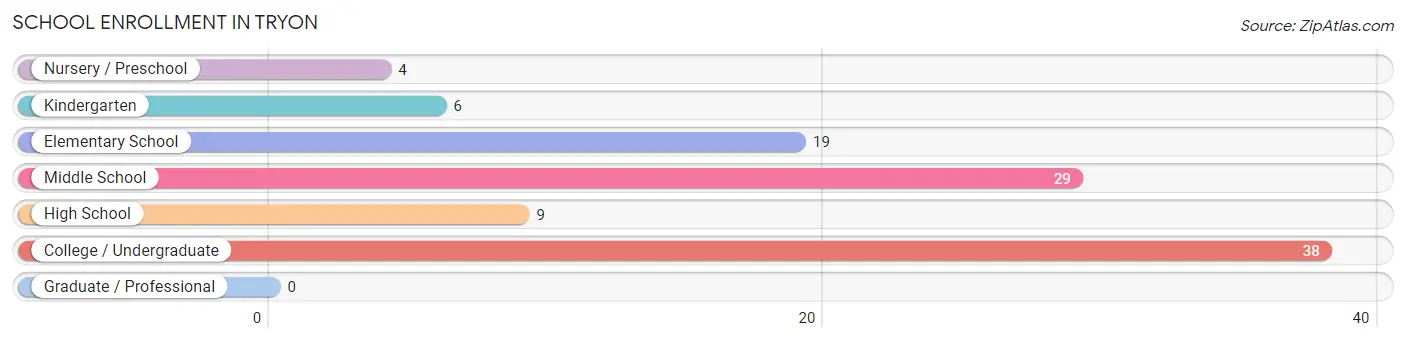
| School Level | # Students | % Students |
| Nursery / Preschool | 4 | 3.8% |
| Kindergarten | 6 | 5.7% |
| Elementary School | 19 | 18.1% |
| Middle School | 29 | 27.6% |
| High School | 9 | 8.6% |
| College / Undergraduate | 38 | 36.2% |
| Graduate / Professional | 0 | 0.0% |
| Total | 105 | 100.0% |
School Enrollment by Age by Funding Source in Tryon
Out of a total of 105 students who are enrolled in schools in Tryon, 21 (20.0%) attend a private institution, while the remaining 84 (80.0%) are enrolled in public schools. The age group of 3 to 4 year olds has the highest likelihood of being enrolled in private schools, with 4 (100.0% in the age bracket) enrolled. Conversely, the age group of 5 to 9 year old has the lowest likelihood of being enrolled in a private school, with 18 (100.0% in the age bracket) attending a public institution.
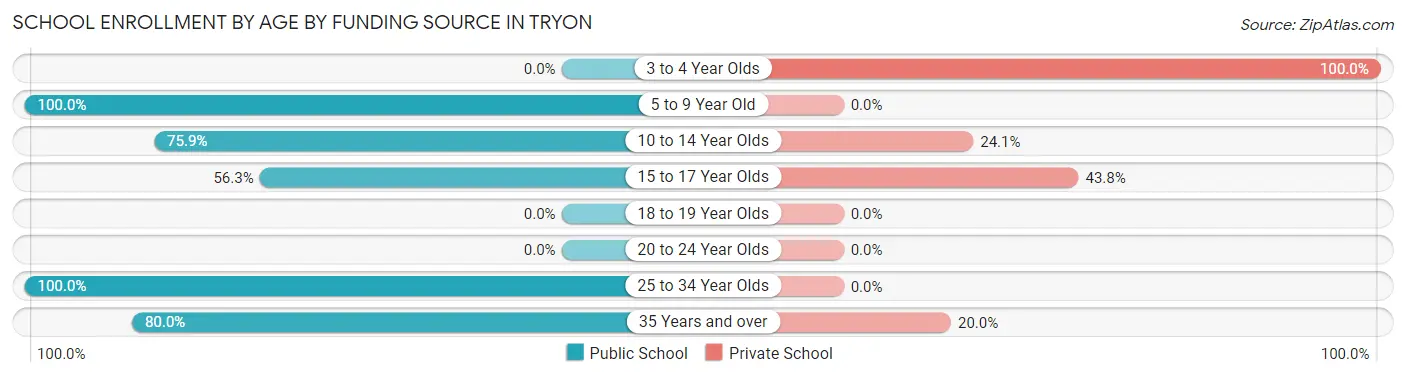
| Age Bracket | Public School | Private School |
| 3 to 4 Year Olds | 0 (0.0%) | 4 (100.0%) |
| 5 to 9 Year Old | 18 (100.0%) | 0 (0.0%) |
| 10 to 14 Year Olds | 22 (75.9%) | 7 (24.1%) |
| 15 to 17 Year Olds | 9 (56.2%) | 7 (43.8%) |
| 18 to 19 Year Olds | 0 (0.0%) | 0 (0.0%) |
| 20 to 24 Year Olds | 0 (0.0%) | 0 (0.0%) |
| 25 to 34 Year Olds | 23 (100.0%) | 0 (0.0%) |
| 35 Years and over | 12 (80.0%) | 3 (20.0%) |
| Total | 84 (80.0%) | 21 (20.0%) |
Educational Attainment by Field of Study in Tryon
Visual & performing arts (170 | 20.7%), social sciences (133 | 16.2%), literature & languages (118 | 14.3%), education (85 | 10.3%), and business (74 | 9.0%) are the most common fields of study among 823 individuals in Tryon who have obtained a bachelor's degree or higher.
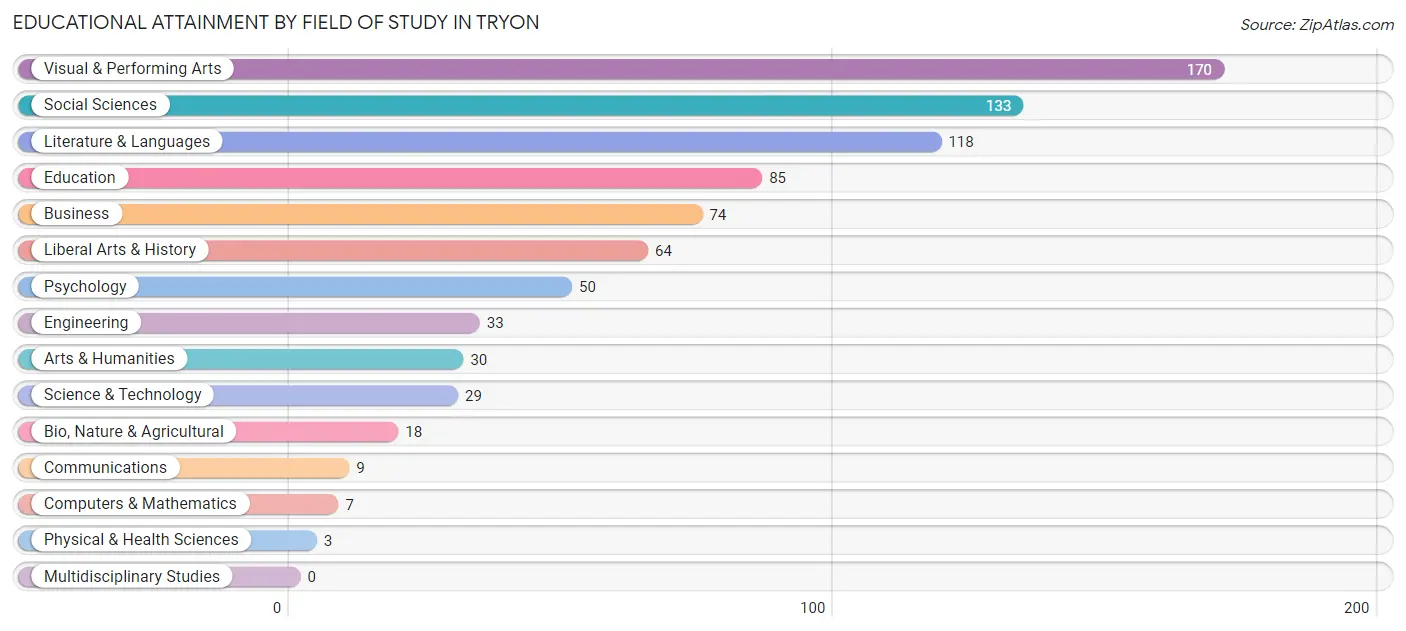
| Field of Study | # Graduates | % Graduates |
| Computers & Mathematics | 7 | 0.9% |
| Bio, Nature & Agricultural | 18 | 2.2% |
| Physical & Health Sciences | 3 | 0.4% |
| Psychology | 50 | 6.1% |
| Social Sciences | 133 | 16.2% |
| Engineering | 33 | 4.0% |
| Multidisciplinary Studies | 0 | 0.0% |
| Science & Technology | 29 | 3.5% |
| Business | 74 | 9.0% |
| Education | 85 | 10.3% |
| Literature & Languages | 118 | 14.3% |
| Liberal Arts & History | 64 | 7.8% |
| Visual & Performing Arts | 170 | 20.7% |
| Communications | 9 | 1.1% |
| Arts & Humanities | 30 | 3.6% |
| Total | 823 | 100.0% |
Transportation & Commute in Tryon
Vehicle Availability by Sex in Tryon
The most prevalent vehicle ownership categories in Tryon are males with 2 vehicles (140, accounting for 46.7%) and females with 2 vehicles (91, making up 42.4%).
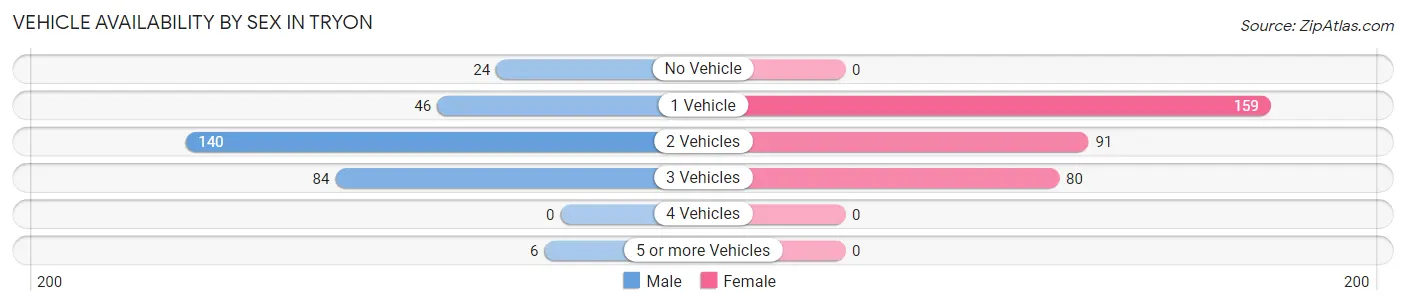
| Vehicles Available | Male | Female |
| No Vehicle | 24 (8.0%) | 0 (0.0%) |
| 1 Vehicle | 46 (15.3%) | 159 (48.2%) |
| 2 Vehicles | 140 (46.7%) | 91 (27.6%) |
| 3 Vehicles | 84 (28.0%) | 80 (24.2%) |
| 4 Vehicles | 0 (0.0%) | 0 (0.0%) |
| 5 or more Vehicles | 6 (2.0%) | 0 (0.0%) |
| Total | 300 (100.0%) | 330 (100.0%) |
Commute Time in Tryon
The most frequently occuring commute durations in Tryon are 10 to 14 minutes (176 commuters, 34.4%), 5 to 9 minutes (71 commuters, 13.9%), and less than 5 minutes (60 commuters, 11.7%).
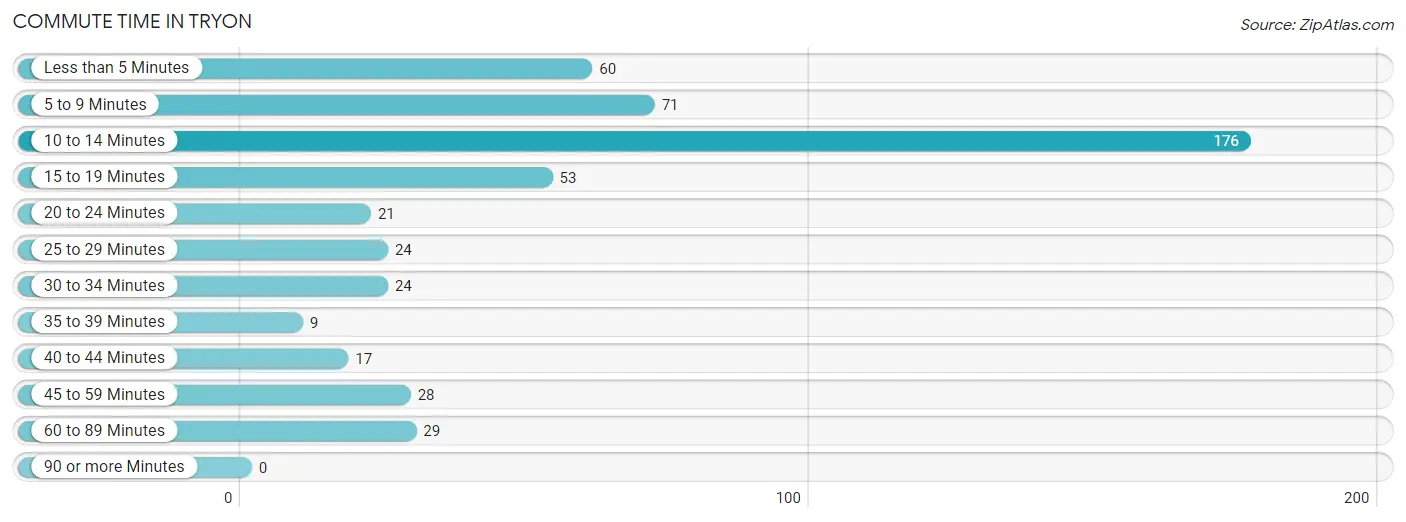
| Commute Time | # Commuters | % Commuters |
| Less than 5 Minutes | 60 | 11.7% |
| 5 to 9 Minutes | 71 | 13.9% |
| 10 to 14 Minutes | 176 | 34.4% |
| 15 to 19 Minutes | 53 | 10.3% |
| 20 to 24 Minutes | 21 | 4.1% |
| 25 to 29 Minutes | 24 | 4.7% |
| 30 to 34 Minutes | 24 | 4.7% |
| 35 to 39 Minutes | 9 | 1.8% |
| 40 to 44 Minutes | 17 | 3.3% |
| 45 to 59 Minutes | 28 | 5.5% |
| 60 to 89 Minutes | 29 | 5.7% |
| 90 or more Minutes | 0 | 0.0% |
Commute Time by Sex in Tryon
The most common commute times in Tryon are 15 to 19 minutes (48 commuters, 20.7%) for males and 10 to 14 minutes (129 commuters, 46.1%) for females.
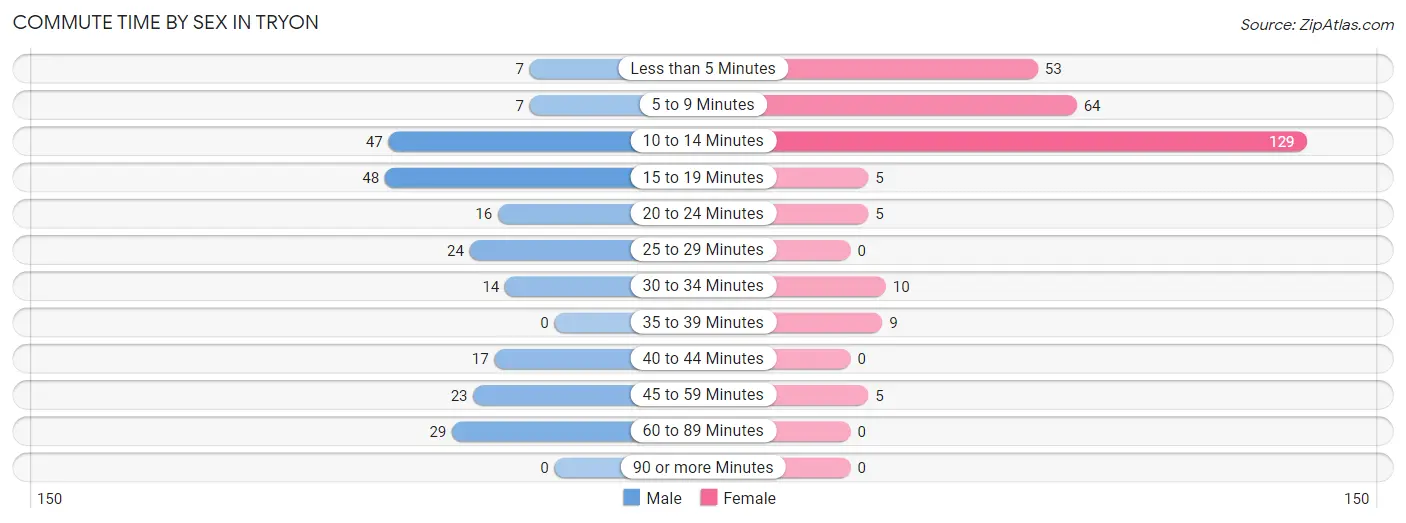
| Commute Time | Male | Female |
| Less than 5 Minutes | 7 (3.0%) | 53 (18.9%) |
| 5 to 9 Minutes | 7 (3.0%) | 64 (22.9%) |
| 10 to 14 Minutes | 47 (20.3%) | 129 (46.1%) |
| 15 to 19 Minutes | 48 (20.7%) | 5 (1.8%) |
| 20 to 24 Minutes | 16 (6.9%) | 5 (1.8%) |
| 25 to 29 Minutes | 24 (10.3%) | 0 (0.0%) |
| 30 to 34 Minutes | 14 (6.0%) | 10 (3.6%) |
| 35 to 39 Minutes | 0 (0.0%) | 9 (3.2%) |
| 40 to 44 Minutes | 17 (7.3%) | 0 (0.0%) |
| 45 to 59 Minutes | 23 (9.9%) | 5 (1.8%) |
| 60 to 89 Minutes | 29 (12.5%) | 0 (0.0%) |
| 90 or more Minutes | 0 (0.0%) | 0 (0.0%) |
Time of Departure to Work by Sex in Tryon
The most frequent times of departure to work in Tryon are 7:30 AM to 7:59 AM (53, 22.8%) for males and 8:00 AM to 8:29 AM (98, 35.0%) for females.
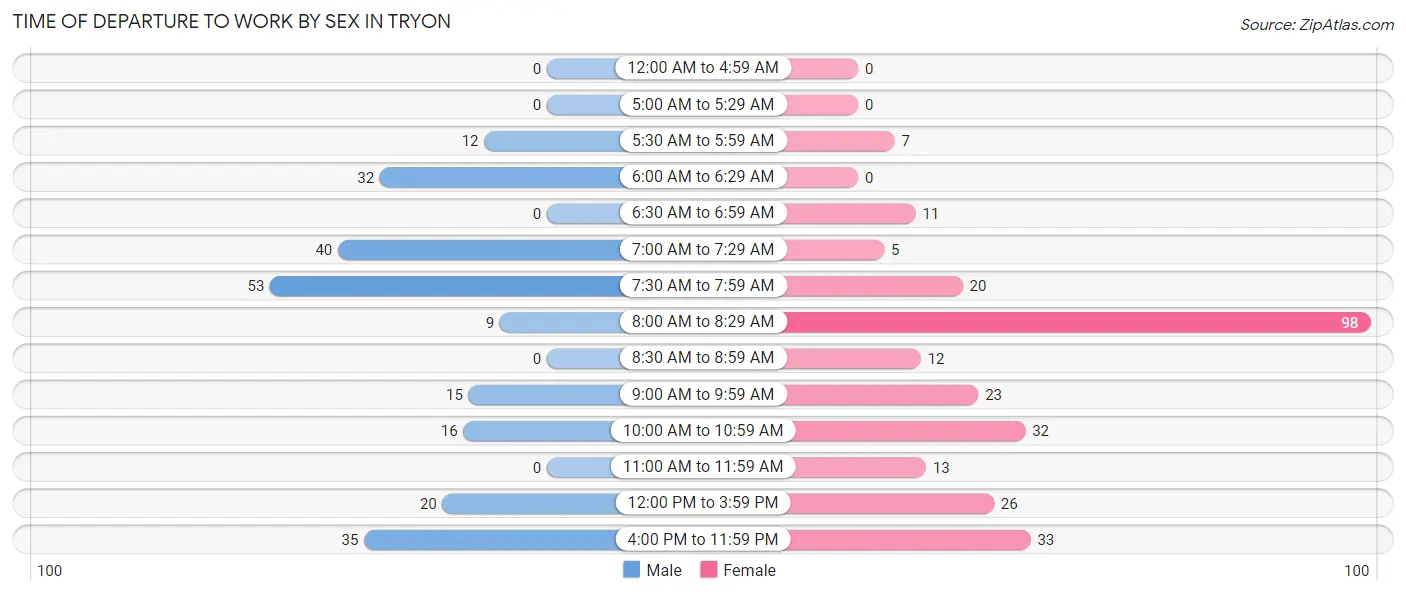
| Time of Departure | Male | Female |
| 12:00 AM to 4:59 AM | 0 (0.0%) | 0 (0.0%) |
| 5:00 AM to 5:29 AM | 0 (0.0%) | 0 (0.0%) |
| 5:30 AM to 5:59 AM | 12 (5.2%) | 7 (2.5%) |
| 6:00 AM to 6:29 AM | 32 (13.8%) | 0 (0.0%) |
| 6:30 AM to 6:59 AM | 0 (0.0%) | 11 (3.9%) |
| 7:00 AM to 7:29 AM | 40 (17.2%) | 5 (1.8%) |
| 7:30 AM to 7:59 AM | 53 (22.8%) | 20 (7.1%) |
| 8:00 AM to 8:29 AM | 9 (3.9%) | 98 (35.0%) |
| 8:30 AM to 8:59 AM | 0 (0.0%) | 12 (4.3%) |
| 9:00 AM to 9:59 AM | 15 (6.5%) | 23 (8.2%) |
| 10:00 AM to 10:59 AM | 16 (6.9%) | 32 (11.4%) |
| 11:00 AM to 11:59 AM | 0 (0.0%) | 13 (4.6%) |
| 12:00 PM to 3:59 PM | 20 (8.6%) | 26 (9.3%) |
| 4:00 PM to 11:59 PM | 35 (15.1%) | 33 (11.8%) |
| Total | 232 (100.0%) | 280 (100.0%) |
Housing Occupancy in Tryon
Occupancy by Ownership in Tryon
Of the total 855 dwellings in Tryon, owner-occupied units account for 497 (58.1%), while renter-occupied units make up 358 (41.9%).
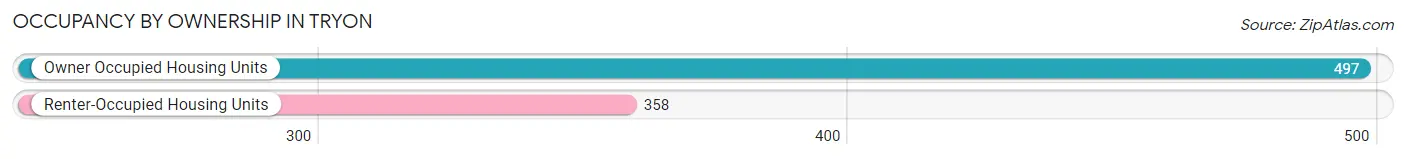
| Occupancy | # Housing Units | % Housing Units |
| Owner Occupied Housing Units | 497 | 58.1% |
| Renter-Occupied Housing Units | 358 | 41.9% |
| Total Occupied Housing Units | 855 | 100.0% |
Occupancy by Household Size in Tryon
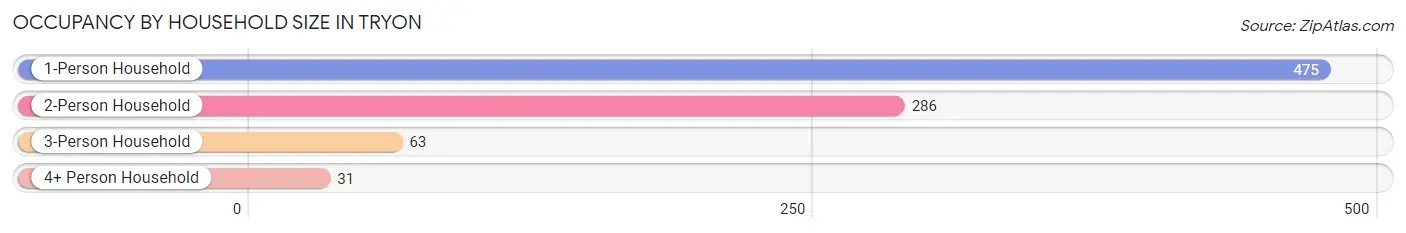
| Household Size | # Housing Units | % Housing Units |
| 1-Person Household | 475 | 55.6% |
| 2-Person Household | 286 | 33.5% |
| 3-Person Household | 63 | 7.4% |
| 4+ Person Household | 31 | 3.6% |
| Total Housing Units | 855 | 100.0% |
Occupancy by Ownership by Household Size in Tryon
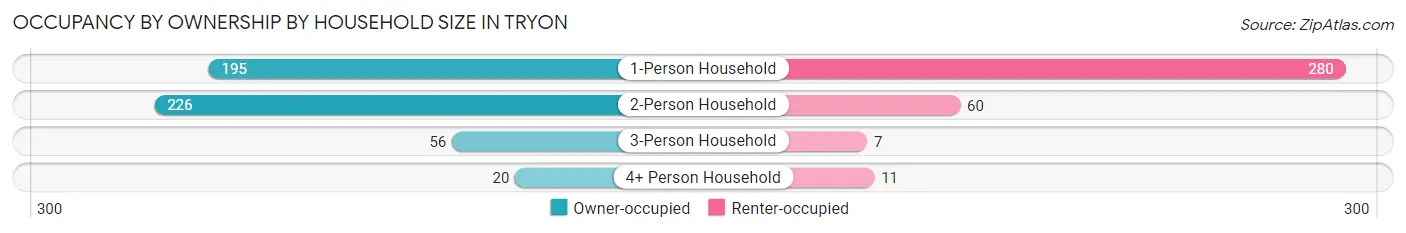
| Household Size | Owner-occupied | Renter-occupied |
| 1-Person Household | 195 (41.0%) | 280 (59.0%) |
| 2-Person Household | 226 (79.0%) | 60 (21.0%) |
| 3-Person Household | 56 (88.9%) | 7 (11.1%) |
| 4+ Person Household | 20 (64.5%) | 11 (35.5%) |
| Total Housing Units | 497 (58.1%) | 358 (41.9%) |
Occupancy by Educational Attainment in Tryon
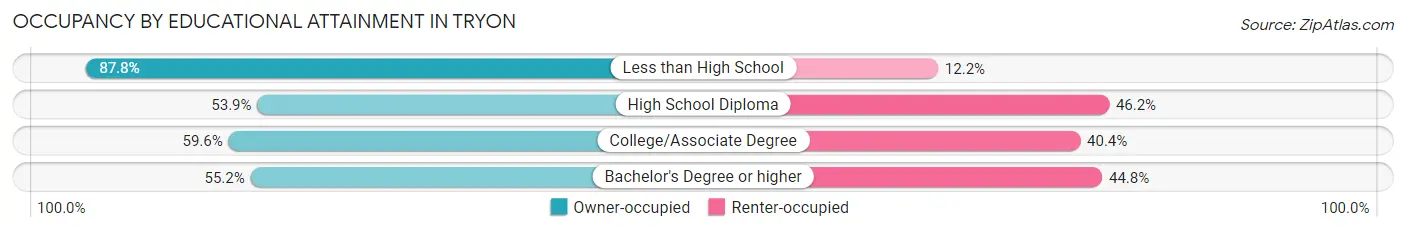
| Household Size | Owner-occupied | Renter-occupied |
| Less than High School | 43 (87.8%) | 6 (12.2%) |
| High School Diploma | 49 (53.8%) | 42 (46.2%) |
| College/Associate Degree | 140 (59.6%) | 95 (40.4%) |
| Bachelor's Degree or higher | 265 (55.2%) | 215 (44.8%) |
Occupancy by Age of Householder in Tryon
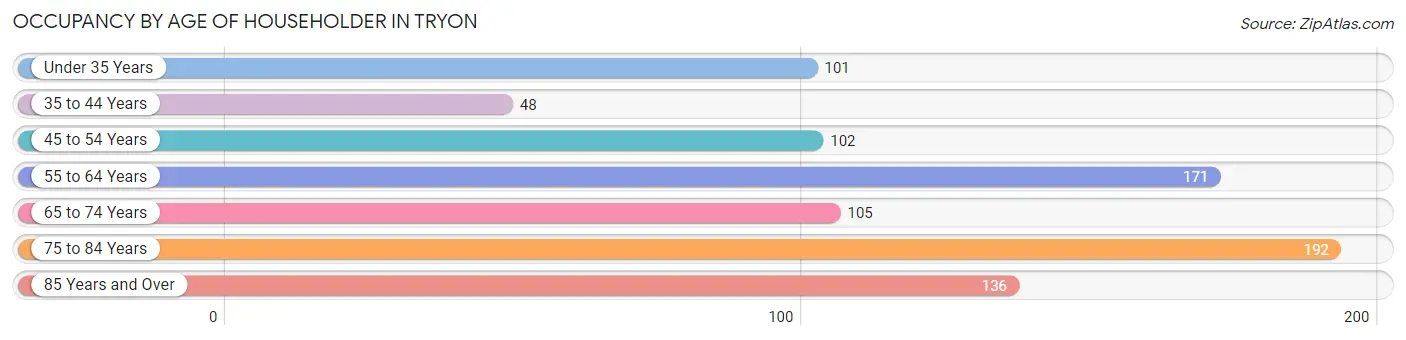
| Age Bracket | # Households | % Households |
| Under 35 Years | 101 | 11.8% |
| 35 to 44 Years | 48 | 5.6% |
| 45 to 54 Years | 102 | 11.9% |
| 55 to 64 Years | 171 | 20.0% |
| 65 to 74 Years | 105 | 12.3% |
| 75 to 84 Years | 192 | 22.5% |
| 85 Years and Over | 136 | 15.9% |
| Total | 855 | 100.0% |
Housing Finances in Tryon
Median Income by Occupancy in Tryon
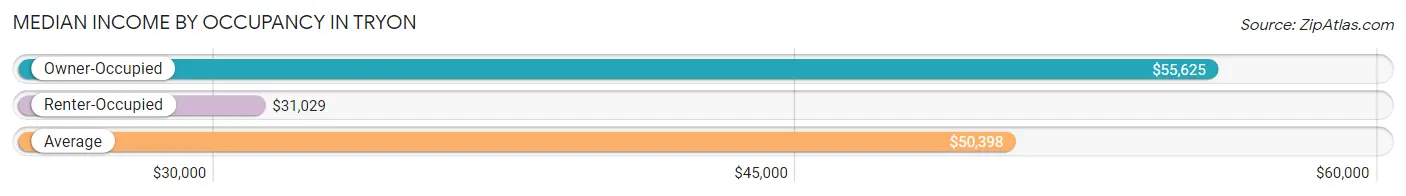
| Occupancy Type | # Households | Median Income |
| Owner-Occupied | 497 (58.1%) | $55,625 |
| Renter-Occupied | 358 (41.9%) | $31,029 |
| Average | 855 (100.0%) | $50,398 |
Occupancy by Householder Income Bracket in Tryon
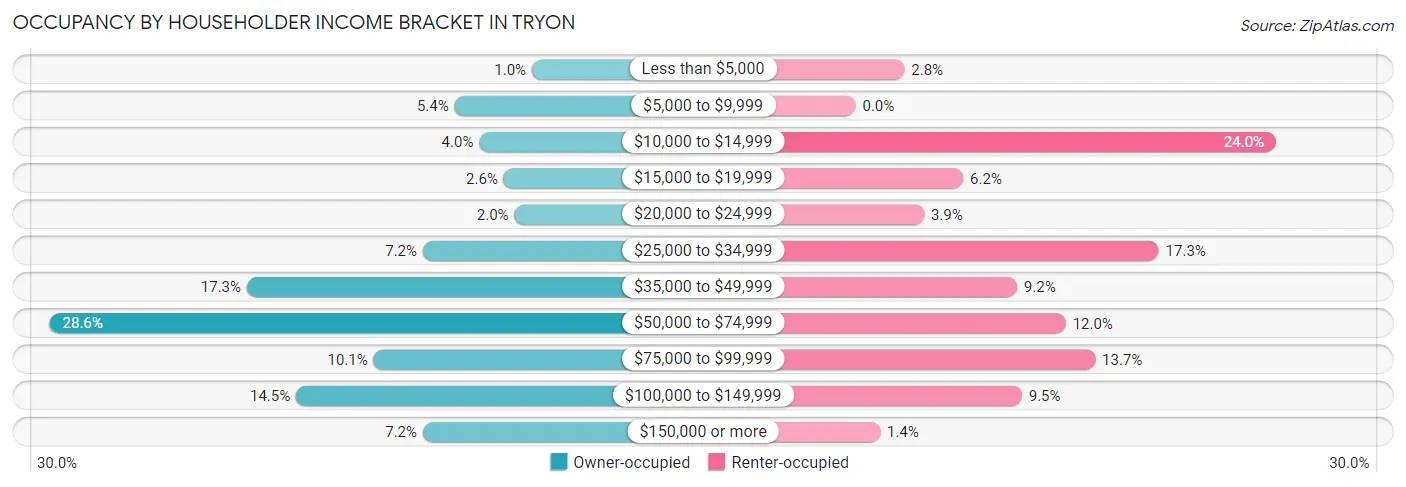
| Income Bracket | Owner-occupied | Renter-occupied |
| Less than $5,000 | 5 (1.0%) | 10 (2.8%) |
| $5,000 to $9,999 | 27 (5.4%) | 0 (0.0%) |
| $10,000 to $14,999 | 20 (4.0%) | 86 (24.0%) |
| $15,000 to $19,999 | 13 (2.6%) | 22 (6.1%) |
| $20,000 to $24,999 | 10 (2.0%) | 14 (3.9%) |
| $25,000 to $34,999 | 36 (7.2%) | 62 (17.3%) |
| $35,000 to $49,999 | 86 (17.3%) | 33 (9.2%) |
| $50,000 to $74,999 | 142 (28.6%) | 43 (12.0%) |
| $75,000 to $99,999 | 50 (10.1%) | 49 (13.7%) |
| $100,000 to $149,999 | 72 (14.5%) | 34 (9.5%) |
| $150,000 or more | 36 (7.2%) | 5 (1.4%) |
| Total | 497 (100.0%) | 358 (100.0%) |
Monthly Housing Cost Tiers in Tryon
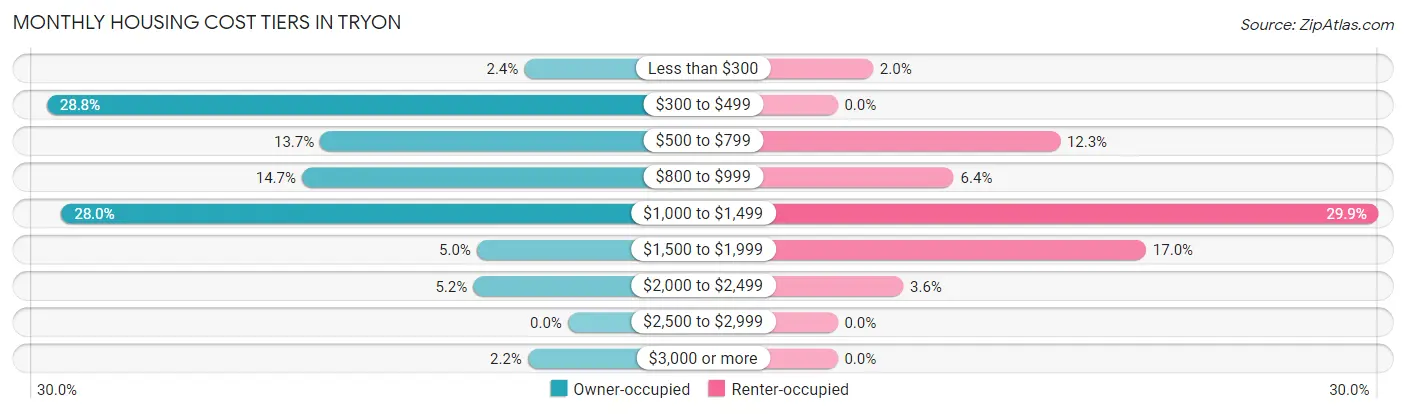
| Monthly Cost | Owner-occupied | Renter-occupied |
| Less than $300 | 12 (2.4%) | 7 (2.0%) |
| $300 to $499 | 143 (28.8%) | 0 (0.0%) |
| $500 to $799 | 68 (13.7%) | 44 (12.3%) |
| $800 to $999 | 73 (14.7%) | 23 (6.4%) |
| $1,000 to $1,499 | 139 (28.0%) | 107 (29.9%) |
| $1,500 to $1,999 | 25 (5.0%) | 61 (17.0%) |
| $2,000 to $2,499 | 26 (5.2%) | 13 (3.6%) |
| $2,500 to $2,999 | 0 (0.0%) | 0 (0.0%) |
| $3,000 or more | 11 (2.2%) | 0 (0.0%) |
| Total | 497 (100.0%) | 358 (100.0%) |
Physical Housing Characteristics in Tryon
Housing Structures in Tryon
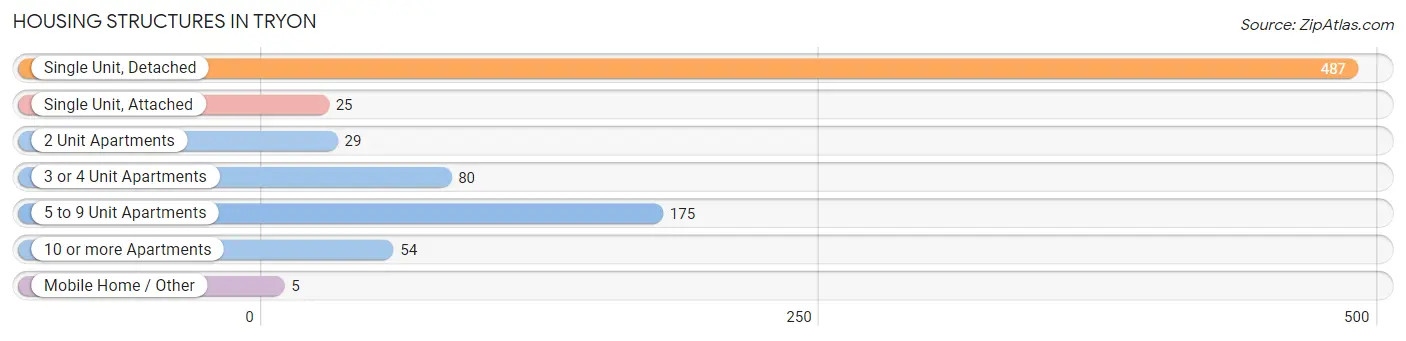
| Structure Type | # Housing Units | % Housing Units |
| Single Unit, Detached | 487 | 57.0% |
| Single Unit, Attached | 25 | 2.9% |
| 2 Unit Apartments | 29 | 3.4% |
| 3 or 4 Unit Apartments | 80 | 9.4% |
| 5 to 9 Unit Apartments | 175 | 20.5% |
| 10 or more Apartments | 54 | 6.3% |
| Mobile Home / Other | 5 | 0.6% |
| Total | 855 | 100.0% |
Housing Structures by Occupancy in Tryon
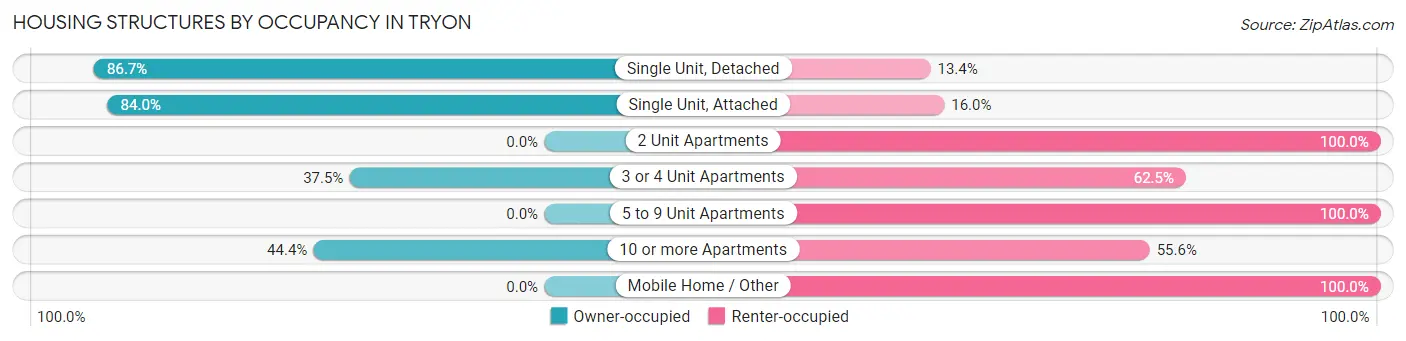
| Structure Type | Owner-occupied | Renter-occupied |
| Single Unit, Detached | 422 (86.7%) | 65 (13.4%) |
| Single Unit, Attached | 21 (84.0%) | 4 (16.0%) |
| 2 Unit Apartments | 0 (0.0%) | 29 (100.0%) |
| 3 or 4 Unit Apartments | 30 (37.5%) | 50 (62.5%) |
| 5 to 9 Unit Apartments | 0 (0.0%) | 175 (100.0%) |
| 10 or more Apartments | 24 (44.4%) | 30 (55.6%) |
| Mobile Home / Other | 0 (0.0%) | 5 (100.0%) |
| Total | 497 (58.1%) | 358 (41.9%) |
Housing Structures by Number of Rooms in Tryon
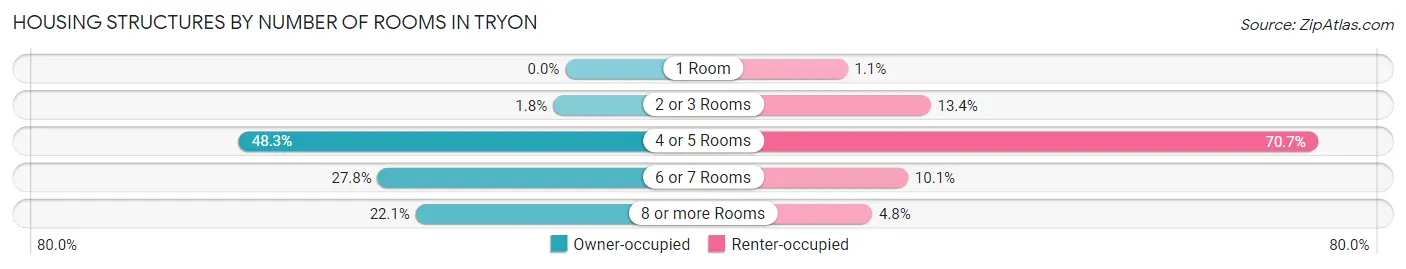
| Number of Rooms | Owner-occupied | Renter-occupied |
| 1 Room | 0 (0.0%) | 4 (1.1%) |
| 2 or 3 Rooms | 9 (1.8%) | 48 (13.4%) |
| 4 or 5 Rooms | 240 (48.3%) | 253 (70.7%) |
| 6 or 7 Rooms | 138 (27.8%) | 36 (10.1%) |
| 8 or more Rooms | 110 (22.1%) | 17 (4.8%) |
| Total | 497 (100.0%) | 358 (100.0%) |
Housing Structure by Heating Type in Tryon
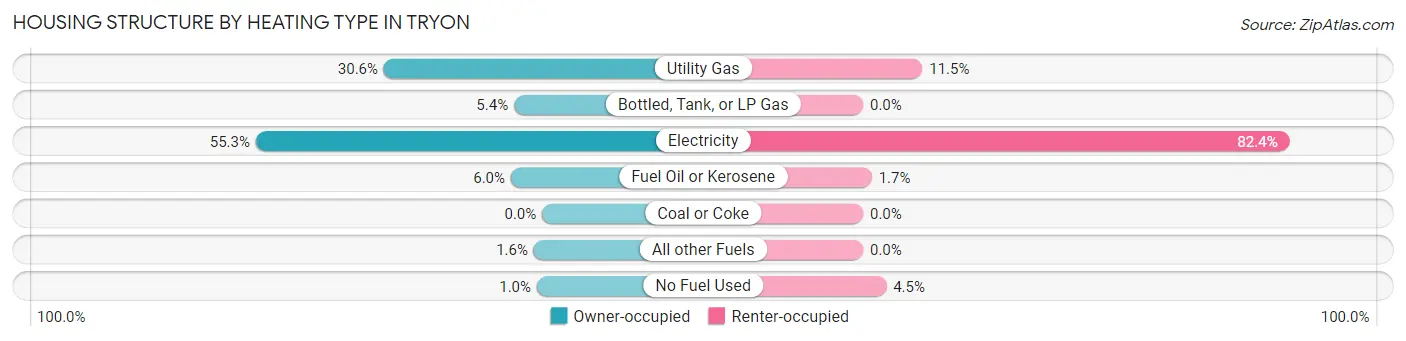
| Heating Type | Owner-occupied | Renter-occupied |
| Utility Gas | 152 (30.6%) | 41 (11.5%) |
| Bottled, Tank, or LP Gas | 27 (5.4%) | 0 (0.0%) |
| Electricity | 275 (55.3%) | 295 (82.4%) |
| Fuel Oil or Kerosene | 30 (6.0%) | 6 (1.7%) |
| Coal or Coke | 0 (0.0%) | 0 (0.0%) |
| All other Fuels | 8 (1.6%) | 0 (0.0%) |
| No Fuel Used | 5 (1.0%) | 16 (4.5%) |
| Total | 497 (100.0%) | 358 (100.0%) |
Household Vehicle Usage in Tryon
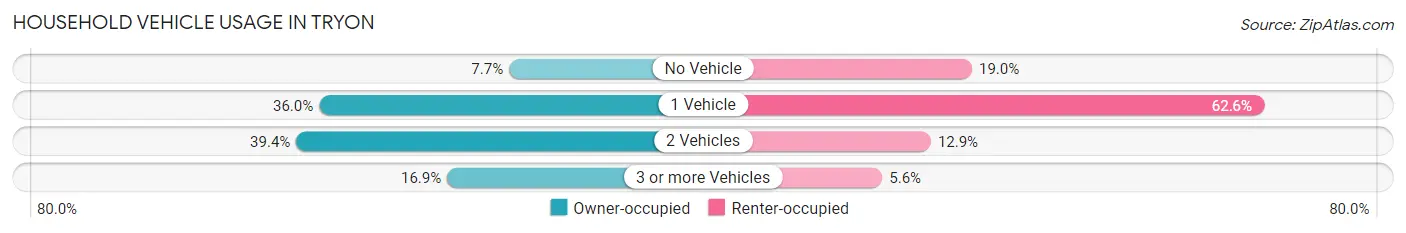
| Vehicles per Household | Owner-occupied | Renter-occupied |
| No Vehicle | 38 (7.6%) | 68 (19.0%) |
| 1 Vehicle | 179 (36.0%) | 224 (62.6%) |
| 2 Vehicles | 196 (39.4%) | 46 (12.9%) |
| 3 or more Vehicles | 84 (16.9%) | 20 (5.6%) |
| Total | 497 (100.0%) | 358 (100.0%) |
Real Estate & Mortgages in Tryon
Real Estate and Mortgage Overview in Tryon
| Characteristic | Without Mortgage | With Mortgage |
| Housing Units | 221 | 276 |
| Median Property Value | $277,700 | $205,900 |
| Median Household Income | $53,403 | $36 |
| Monthly Housing Costs | $457 | $11 |
| Real Estate Taxes | $1,904 | $0 |
Property Value by Mortgage Status in Tryon
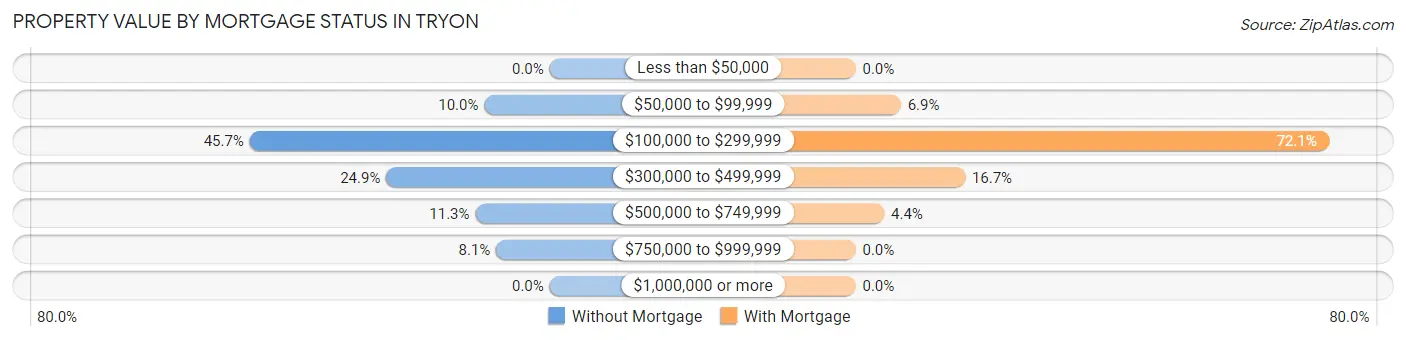
| Property Value | Without Mortgage | With Mortgage |
| Less than $50,000 | 0 (0.0%) | 0 (0.0%) |
| $50,000 to $99,999 | 22 (10.0%) | 19 (6.9%) |
| $100,000 to $299,999 | 101 (45.7%) | 199 (72.1%) |
| $300,000 to $499,999 | 55 (24.9%) | 46 (16.7%) |
| $500,000 to $749,999 | 25 (11.3%) | 12 (4.3%) |
| $750,000 to $999,999 | 18 (8.1%) | 0 (0.0%) |
| $1,000,000 or more | 0 (0.0%) | 0 (0.0%) |
| Total | 221 (100.0%) | 276 (100.0%) |
Household Income by Mortgage Status in Tryon
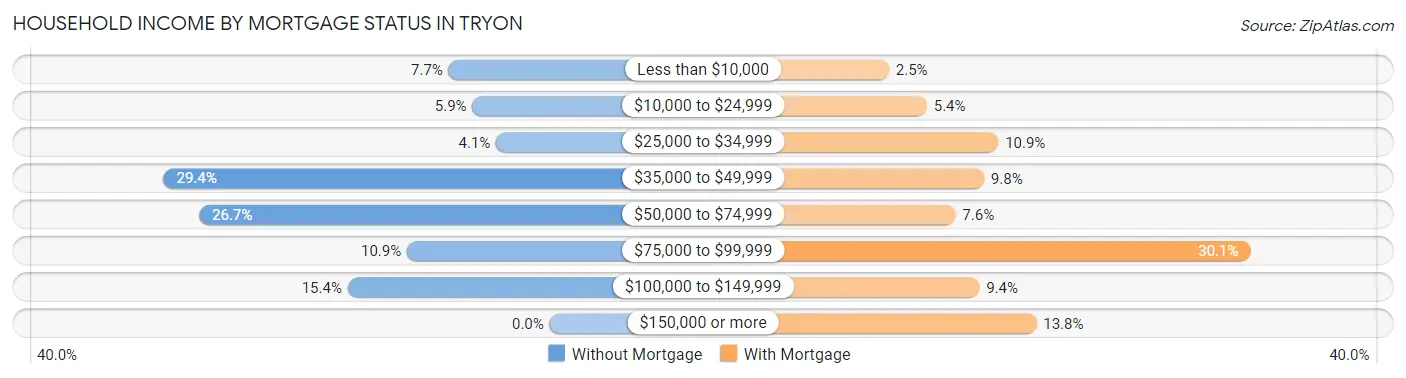
| Household Income | Without Mortgage | With Mortgage |
| Less than $10,000 | 17 (7.7%) | 7 (2.5%) |
| $10,000 to $24,999 | 13 (5.9%) | 15 (5.4%) |
| $25,000 to $34,999 | 9 (4.1%) | 30 (10.9%) |
| $35,000 to $49,999 | 65 (29.4%) | 27 (9.8%) |
| $50,000 to $74,999 | 59 (26.7%) | 21 (7.6%) |
| $75,000 to $99,999 | 24 (10.9%) | 83 (30.1%) |
| $100,000 to $149,999 | 34 (15.4%) | 26 (9.4%) |
| $150,000 or more | 0 (0.0%) | 38 (13.8%) |
| Total | 221 (100.0%) | 276 (100.0%) |
Property Value to Household Income Ratio in Tryon
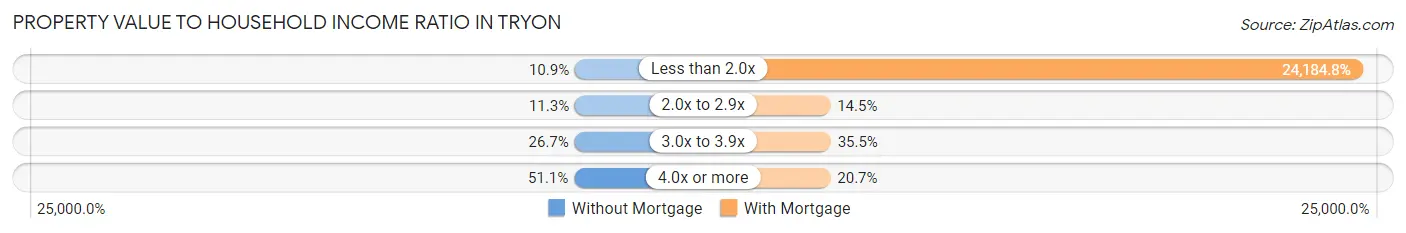
| Value-to-Income Ratio | Without Mortgage | With Mortgage |
| Less than 2.0x | 24 (10.9%) | 66,750 (24,184.8%) |
| 2.0x to 2.9x | 25 (11.3%) | 40 (14.5%) |
| 3.0x to 3.9x | 59 (26.7%) | 98 (35.5%) |
| 4.0x or more | 113 (51.1%) | 57 (20.6%) |
| Total | 221 (100.0%) | 276 (100.0%) |
Real Estate Taxes by Mortgage Status in Tryon
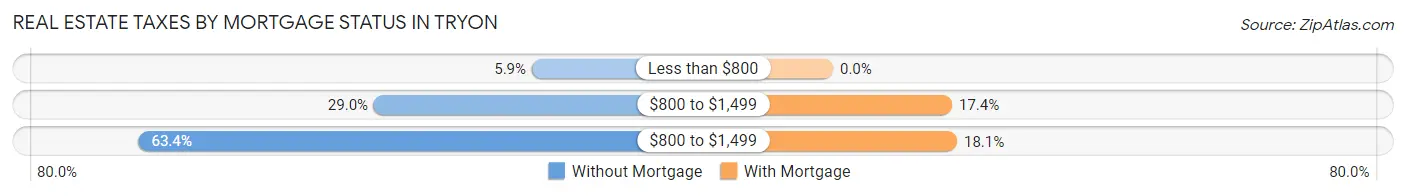
| Property Taxes | Without Mortgage | With Mortgage |
| Less than $800 | 13 (5.9%) | 0 (0.0%) |
| $800 to $1,499 | 64 (29.0%) | 48 (17.4%) |
| $800 to $1,499 | 140 (63.3%) | 50 (18.1%) |
| Total | 221 (100.0%) | 276 (100.0%) |
Health & Disability in Tryon
Health Insurance Coverage by Age in Tryon
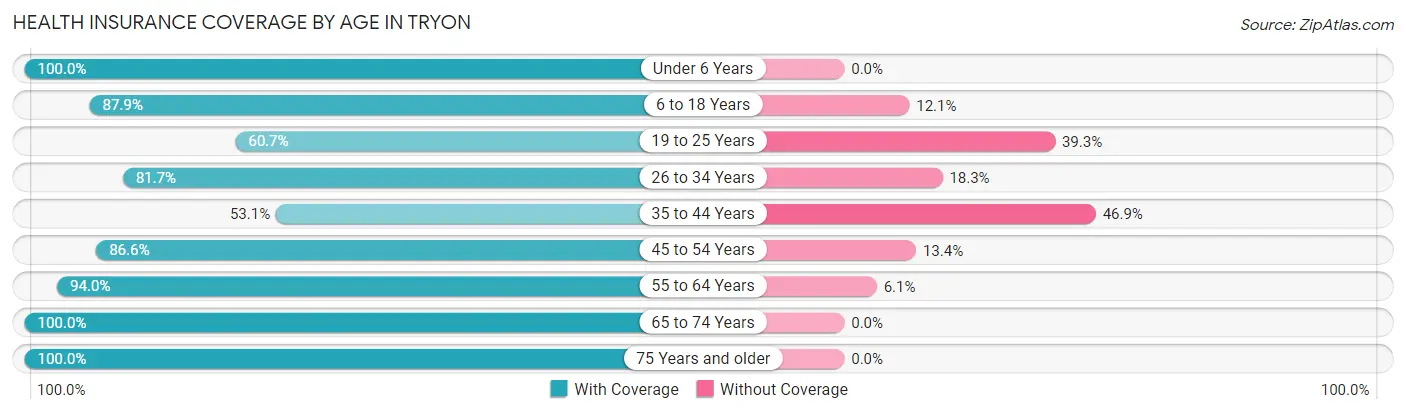
| Age Bracket | With Coverage | Without Coverage |
| Under 6 Years | 21 (100.0%) | 0 (0.0%) |
| 6 to 18 Years | 58 (87.9%) | 8 (12.1%) |
| 19 to 25 Years | 17 (60.7%) | 11 (39.3%) |
| 26 to 34 Years | 125 (81.7%) | 28 (18.3%) |
| 35 to 44 Years | 51 (53.1%) | 45 (46.9%) |
| 45 to 54 Years | 162 (86.6%) | 25 (13.4%) |
| 55 to 64 Years | 233 (94.0%) | 15 (6.0%) |
| 65 to 74 Years | 173 (100.0%) | 0 (0.0%) |
| 75 Years and older | 463 (100.0%) | 0 (0.0%) |
| Total | 1,303 (90.8%) | 132 (9.2%) |
Health Insurance Coverage by Citizenship Status in Tryon
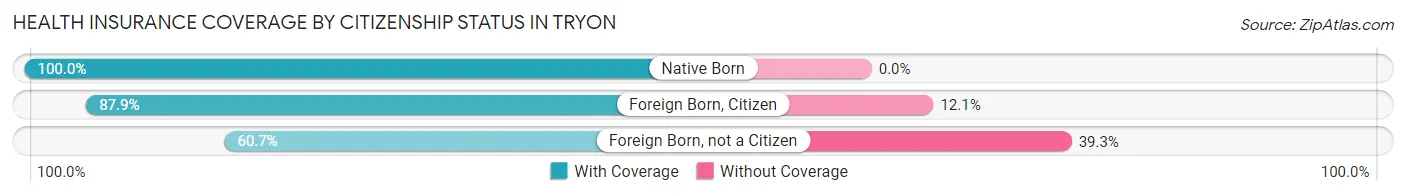
| Citizenship Status | With Coverage | Without Coverage |
| Native Born | 21 (100.0%) | 0 (0.0%) |
| Foreign Born, Citizen | 58 (87.9%) | 8 (12.1%) |
| Foreign Born, not a Citizen | 17 (60.7%) | 11 (39.3%) |
Health Insurance Coverage by Household Income in Tryon
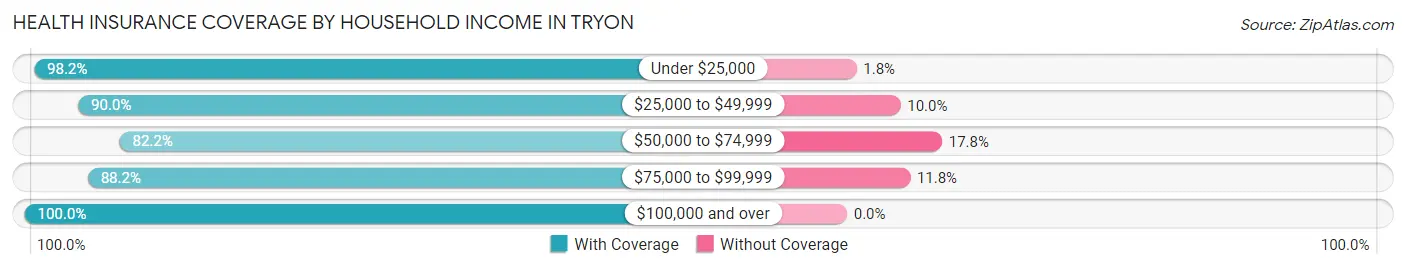
| Household Income | With Coverage | Without Coverage |
| Under $25,000 | 219 (98.2%) | 4 (1.8%) |
| $25,000 to $49,999 | 296 (90.0%) | 33 (10.0%) |
| $50,000 to $74,999 | 337 (82.2%) | 73 (17.8%) |
| $75,000 to $99,999 | 164 (88.2%) | 22 (11.8%) |
| $100,000 and over | 287 (100.0%) | 0 (0.0%) |
Public vs Private Health Insurance Coverage by Age in Tryon
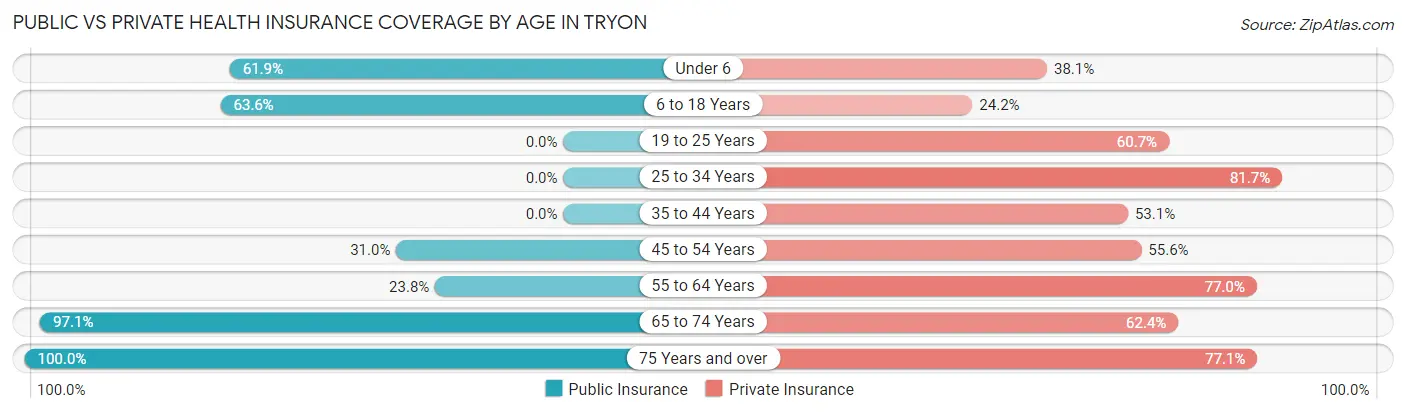
| Age Bracket | Public Insurance | Private Insurance |
| Under 6 | 13 (61.9%) | 8 (38.1%) |
| 6 to 18 Years | 42 (63.6%) | 16 (24.2%) |
| 19 to 25 Years | 0 (0.0%) | 17 (60.7%) |
| 25 to 34 Years | 0 (0.0%) | 125 (81.7%) |
| 35 to 44 Years | 0 (0.0%) | 51 (53.1%) |
| 45 to 54 Years | 58 (31.0%) | 104 (55.6%) |
| 55 to 64 Years | 59 (23.8%) | 191 (77.0%) |
| 65 to 74 Years | 168 (97.1%) | 108 (62.4%) |
| 75 Years and over | 463 (100.0%) | 357 (77.1%) |
| Total | 803 (56.0%) | 977 (68.1%) |
Disability Status by Sex by Age in Tryon
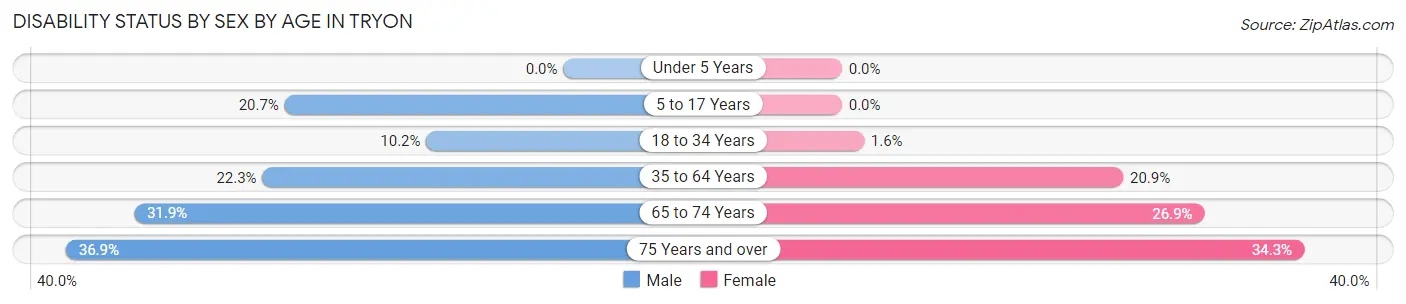
| Age Bracket | Male | Female |
| Under 5 Years | 0 (0.0%) | 0 (0.0%) |
| 5 to 17 Years | 6 (20.7%) | 0 (0.0%) |
| 18 to 34 Years | 6 (10.2%) | 2 (1.6%) |
| 35 to 64 Years | 63 (22.3%) | 52 (20.9%) |
| 65 to 74 Years | 22 (31.9%) | 28 (26.9%) |
| 75 Years and over | 58 (36.9%) | 105 (34.3%) |
Disability Class by Sex by Age in Tryon
Disability Class: Hearing Difficulty
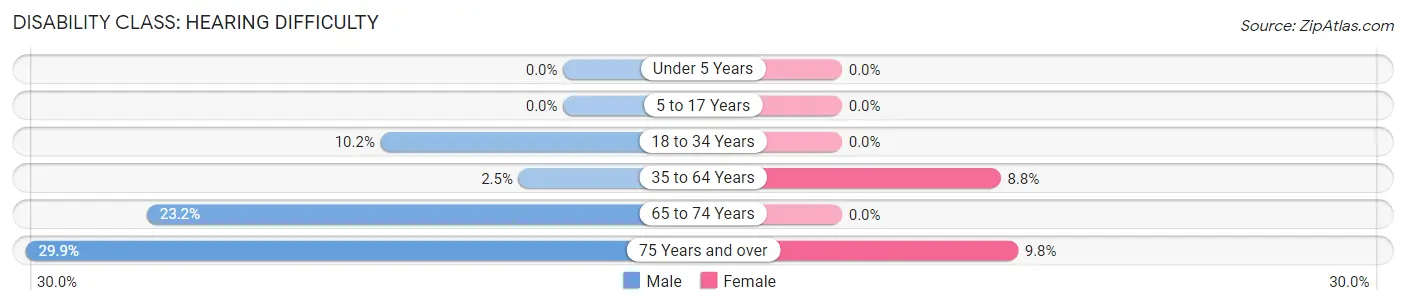
| Age Bracket | Male | Female |
| Under 5 Years | 0 (0.0%) | 0 (0.0%) |
| 5 to 17 Years | 0 (0.0%) | 0 (0.0%) |
| 18 to 34 Years | 6 (10.2%) | 0 (0.0%) |
| 35 to 64 Years | 7 (2.5%) | 22 (8.8%) |
| 65 to 74 Years | 16 (23.2%) | 0 (0.0%) |
| 75 Years and over | 47 (29.9%) | 30 (9.8%) |
Disability Class: Vision Difficulty
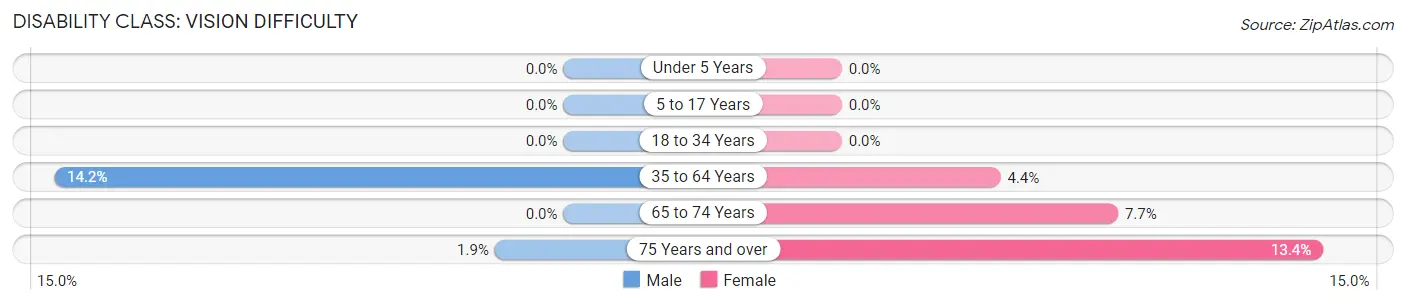
| Age Bracket | Male | Female |
| Under 5 Years | 0 (0.0%) | 0 (0.0%) |
| 5 to 17 Years | 0 (0.0%) | 0 (0.0%) |
| 18 to 34 Years | 0 (0.0%) | 0 (0.0%) |
| 35 to 64 Years | 40 (14.2%) | 11 (4.4%) |
| 65 to 74 Years | 0 (0.0%) | 8 (7.7%) |
| 75 Years and over | 3 (1.9%) | 41 (13.4%) |
Disability Class: Cognitive Difficulty
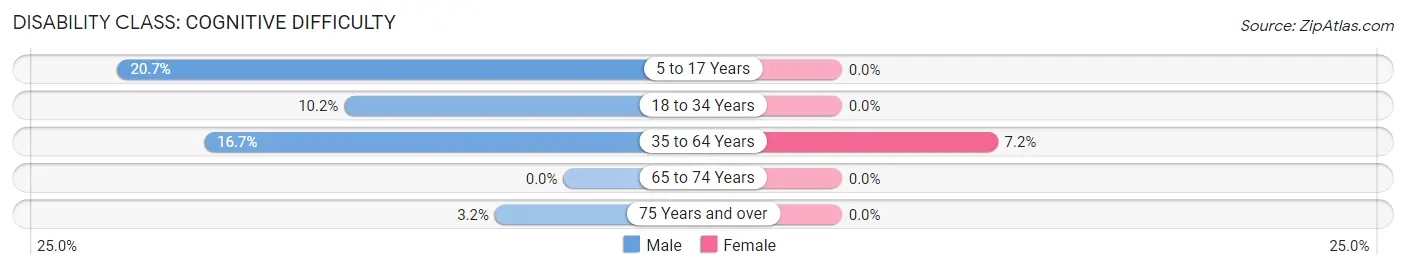
| Age Bracket | Male | Female |
| 5 to 17 Years | 6 (20.7%) | 0 (0.0%) |
| 18 to 34 Years | 6 (10.2%) | 0 (0.0%) |
| 35 to 64 Years | 47 (16.7%) | 18 (7.2%) |
| 65 to 74 Years | 0 (0.0%) | 0 (0.0%) |
| 75 Years and over | 5 (3.2%) | 0 (0.0%) |
Disability Class: Ambulatory Difficulty
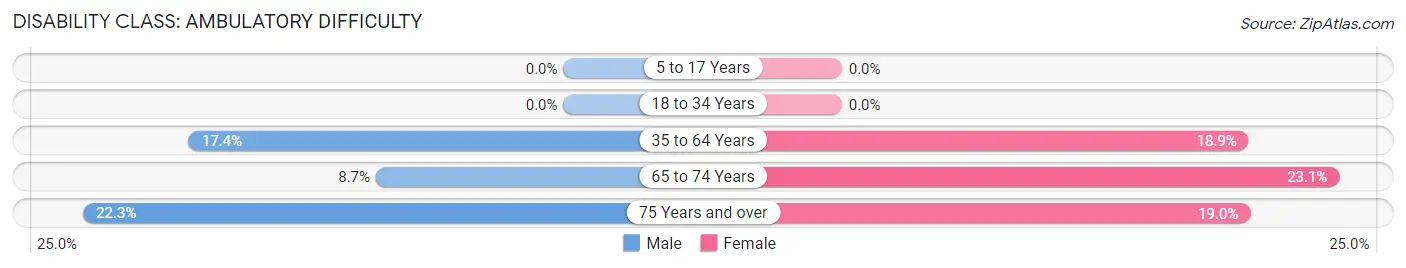
| Age Bracket | Male | Female |
| 5 to 17 Years | 0 (0.0%) | 0 (0.0%) |
| 18 to 34 Years | 0 (0.0%) | 0 (0.0%) |
| 35 to 64 Years | 49 (17.4%) | 47 (18.9%) |
| 65 to 74 Years | 6 (8.7%) | 24 (23.1%) |
| 75 Years and over | 35 (22.3%) | 58 (19.0%) |
Disability Class: Self-Care Difficulty
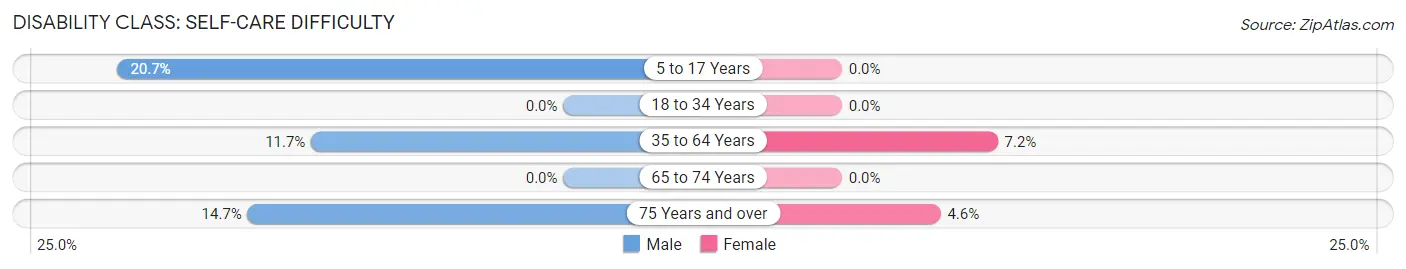
| Age Bracket | Male | Female |
| 5 to 17 Years | 6 (20.7%) | 0 (0.0%) |
| 18 to 34 Years | 0 (0.0%) | 0 (0.0%) |
| 35 to 64 Years | 33 (11.7%) | 18 (7.2%) |
| 65 to 74 Years | 0 (0.0%) | 0 (0.0%) |
| 75 Years and over | 23 (14.6%) | 14 (4.6%) |
Technology Access in Tryon
Computing Device Access in Tryon

| Device Type | # Households | % Households |
| Desktop or Laptop | 633 | 74.0% |
| Smartphone | 645 | 75.4% |
| Tablet | 404 | 47.2% |
| No Computing Device | 126 | 14.7% |
| Total | 855 | 100.0% |
Internet Access in Tryon
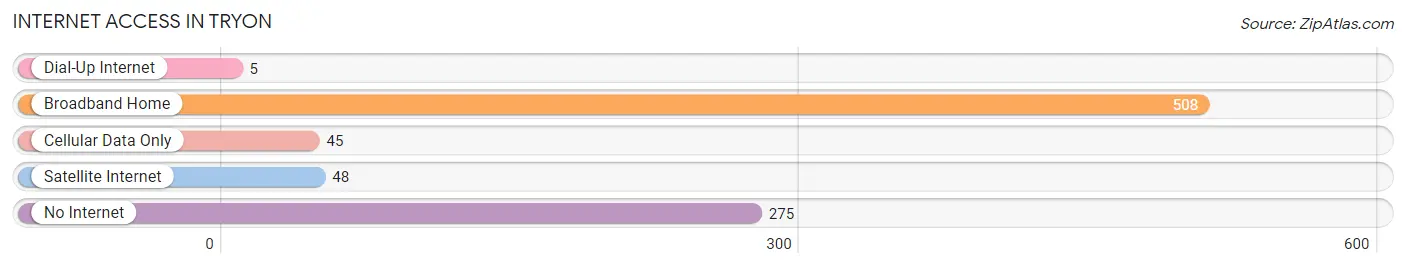
| Internet Type | # Households | % Households |
| Dial-Up Internet | 5 | 0.6% |
| Broadband Home | 508 | 59.4% |
| Cellular Data Only | 45 | 5.3% |
| Satellite Internet | 48 | 5.6% |
| No Internet | 275 | 32.2% |
| Total | 855 | 100.0% |
Tryon Summary
Tryon is a small town located in Polk County, North Carolina. It is situated in the foothills of the Blue Ridge Mountains, and is part of the greater Asheville metropolitan area. The town has a population of 1,611 as of the 2010 census, and is the county seat of Polk County.
History
Tryon was founded in 1855 by William Tryon, a former governor of North Carolina. The town was named after him, and was originally intended to be a resort town. The town was incorporated in 1875, and the first post office was established in 1876.
The town was a popular destination for wealthy tourists in the late 19th and early 20th centuries. The Tryon Inn, built in 1887, was a popular destination for visitors. The town also had a number of other attractions, including a golf course, a racetrack, and a movie theater.
In the early 20th century, the town began to decline in popularity as a tourist destination. The Great Depression and World War II had a significant impact on the town, and many of the businesses and attractions closed. The town began to recover in the 1950s, and the Tryon Inn was restored in the 1970s.
Geography
Tryon is located in the foothills of the Blue Ridge Mountains, and is part of the greater Asheville metropolitan area. The town is situated at an elevation of 1,890 feet (576 m) above sea level. The town is located at the intersection of US Highway 176 and NC Highway 108.
The town is located in a temperate climate, with hot summers and mild winters. The average annual temperature is 61°F (16°C), and the average annual precipitation is 44 inches (112 cm).
Economy
The economy of Tryon is largely based on tourism and retail. The town is home to a number of antique stores, art galleries, and specialty shops. The town is also home to a number of restaurants, cafes, and bars.
The town is also home to a number of manufacturing companies, including a furniture factory and a textile mill. The town is also home to a number of small businesses, including a winery, a brewery, and a distillery.
Demographics
As of the 2010 census, the population of Tryon was 1,611. The racial makeup of the town was 94.3% White, 2.3% African American, 0.4% Native American, 0.7% Asian, 0.1% Pacific Islander, 0.7% from other races, and 1.5% from two or more races. Hispanic or Latino of any race were 2.3% of the population.
The median income for a household in the town was $37,917, and the median income for a family was $45,625. The per capita income for the town was $20,945. About 11.3% of families and 14.2% of the population were below the poverty line, including 19.2% of those under age 18 and 8.3% of those age 65 or over.
Common Questions
What is Per Capita Income in Tryon?
Per Capita income in Tryon is $35,732.
What is the Median Family Income in Tryon?
Median Family Income in Tryon is $66,000.
What is the Median Household income in Tryon?
Median Household Income in Tryon is $50,398.
What is Income or Wage Gap in Tryon?
Income or Wage Gap in Tryon is 47.7%.
Women in Tryon earn 52.3 cents for every dollar earned by a man.
What is Inequality or Gini Index in Tryon?
Inequality or Gini Index in Tryon is 0.42.
What is the Total Population of Tryon?
Total Population of Tryon is 1,516.
What is the Total Male Population of Tryon?
Total Male Population of Tryon is 625.
What is the Total Female Population of Tryon?
Total Female Population of Tryon is 891.
What is the Ratio of Males per 100 Females in Tryon?
There are 70.15 Males per 100 Females in Tryon.
What is the Ratio of Females per 100 Males in Tryon?
There are 142.56 Females per 100 Males in Tryon.
What is the Median Population Age in Tryon?
Median Population Age in Tryon is 61.9 Years.
What is the Average Family Size in Tryon
Average Family Size in Tryon is 2.4 People.
What is the Average Household Size in Tryon
Average Household Size in Tryon is 1.7 People.
How Large is the Labor Force in Tryon?
There are 643 People in the Labor Forcein in Tryon.
What is the Percentage of People in the Labor Force in Tryon?
44.7% of People are in the Labor Force in Tryon.
What is the Unemployment Rate in Tryon?
Unemployment Rate in Tryon is 2.0%.