Sunset Beach, NC Map & Demographics
Sunset Beach Map
Sunset Beach Overview
$54,410
PER CAPITA INCOME
$96,498
AVG FAMILY INCOME
$82,261
AVG HOUSEHOLD INCOME
24.9%
WAGE / INCOME GAP [ % ]
75.1¢/ $1
WAGE / INCOME GAP [ $ ]
$8,203
FAMILY INCOME DEFICIT
0.44
INEQUALITY / GINI INDEX
4,189
TOTAL POPULATION
1,691
MALE POPULATION
2,498
FEMALE POPULATION
67.69
MALES / 100 FEMALES
147.72
FEMALES / 100 MALES
66.8
MEDIAN AGE
2.3
AVG FAMILY SIZE
1.8
AVG HOUSEHOLD SIZE
1,466
LABOR FORCE [ PEOPLE ]
35.8%
PERCENT IN LABOR FORCE
4.0%
UNEMPLOYMENT RATE
Sunset Beach Zip Codes
Sunset Beach Area Codes
Income in Sunset Beach
Income Overview in Sunset Beach
Per Capita Income in Sunset Beach is $54,410, while median incomes of families and households are $96,498 and $82,261 respectively.
| Characteristic | Number | Measure |
| Per Capita Income | 4,189 | $54,410 |
| Median Family Income | 1,371 | $96,498 |
| Mean Family Income | 1,371 | $125,271 |
| Median Household Income | 2,289 | $82,261 |
| Mean Household Income | 2,289 | $94,713 |
| Income Deficit | 1,371 | $8,203 |
| Wage / Income Gap (%) | 4,189 | 24.85% |
| Wage / Income Gap ($) | 4,189 | 75.15¢ per $1 |
| Gini / Inequality Index | 4,189 | 0.44 |
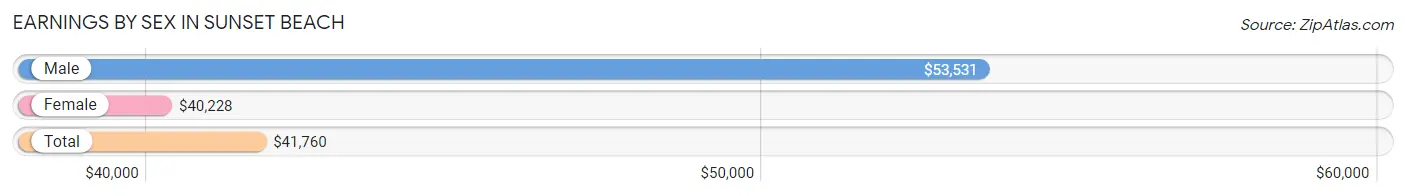
Earnings by Sex in Sunset Beach
Average Earnings in Sunset Beach are $41,760, $53,531 for men and $40,228 for women, a difference of 24.8%.
| Sex | Number | Average Earnings |
| Male | 831 (49.5%) | $53,531 |
| Female | 848 (50.5%) | $40,228 |
| Total | 1,679 (100.0%) | $41,760 |
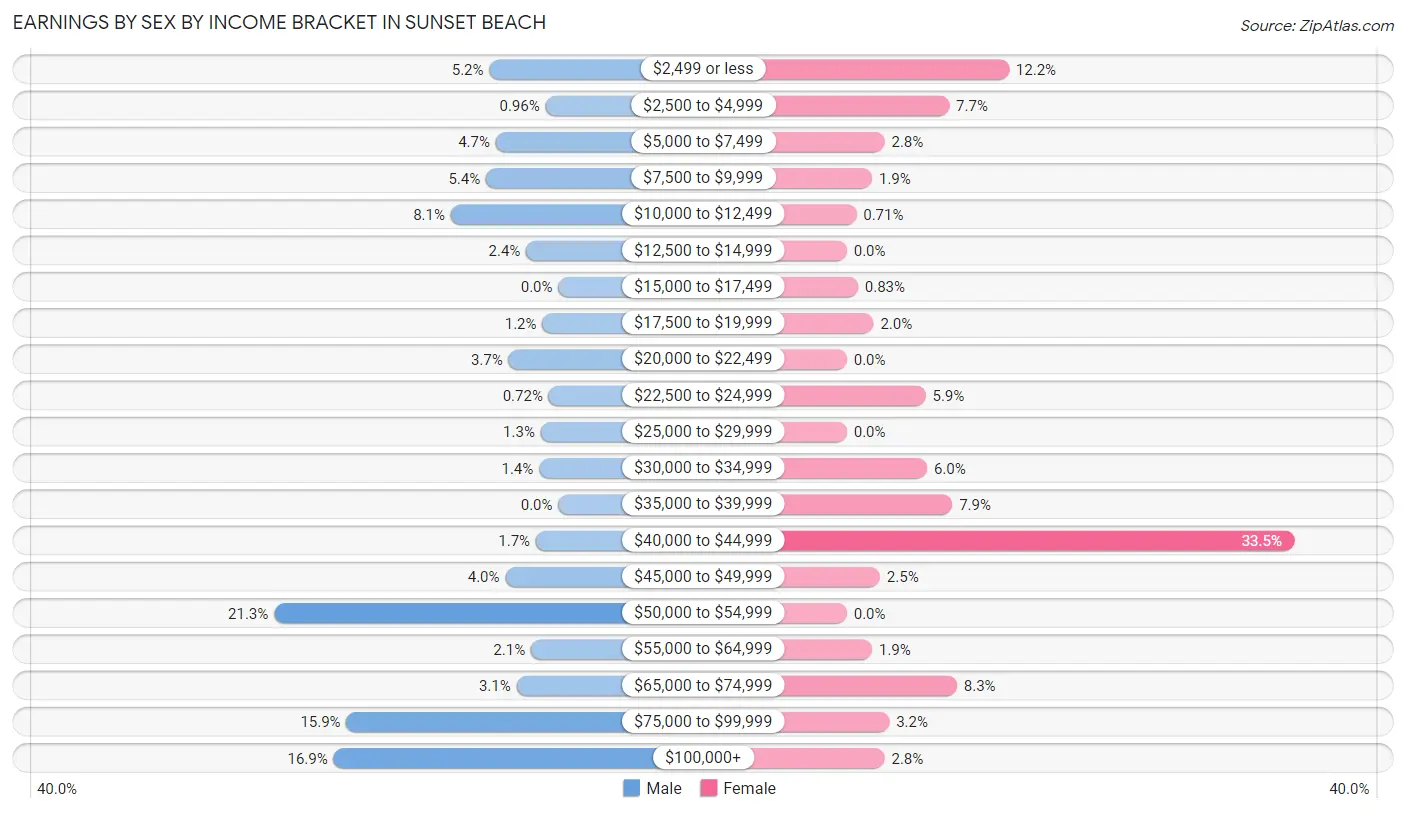
Earnings by Sex by Income Bracket in Sunset Beach
The most common earnings brackets in Sunset Beach are $50,000 to $54,999 for men (177 | 21.3%) and $40,000 to $44,999 for women (284 | 33.5%).
| Income | Male | Female |
| $2,499 or less | 43 (5.2%) | 103 (12.1%) |
| $2,500 to $4,999 | 8 (1.0%) | 65 (7.7%) |
| $5,000 to $7,499 | 39 (4.7%) | 24 (2.8%) |
| $7,500 to $9,999 | 45 (5.4%) | 16 (1.9%) |
| $10,000 to $12,499 | 67 (8.1%) | 6 (0.7%) |
| $12,500 to $14,999 | 20 (2.4%) | 0 (0.0%) |
| $15,000 to $17,499 | 0 (0.0%) | 7 (0.8%) |
| $17,500 to $19,999 | 10 (1.2%) | 17 (2.0%) |
| $20,000 to $22,499 | 31 (3.7%) | 0 (0.0%) |
| $22,500 to $24,999 | 6 (0.7%) | 50 (5.9%) |
| $25,000 to $29,999 | 11 (1.3%) | 0 (0.0%) |
| $30,000 to $34,999 | 12 (1.4%) | 51 (6.0%) |
| $35,000 to $39,999 | 0 (0.0%) | 67 (7.9%) |
| $40,000 to $44,999 | 14 (1.7%) | 284 (33.5%) |
| $45,000 to $49,999 | 33 (4.0%) | 21 (2.5%) |
| $50,000 to $54,999 | 177 (21.3%) | 0 (0.0%) |
| $55,000 to $64,999 | 17 (2.1%) | 16 (1.9%) |
| $65,000 to $74,999 | 26 (3.1%) | 70 (8.3%) |
| $75,000 to $99,999 | 132 (15.9%) | 27 (3.2%) |
| $100,000+ | 140 (16.9%) | 24 (2.8%) |
| Total | 831 (100.0%) | 848 (100.0%) |
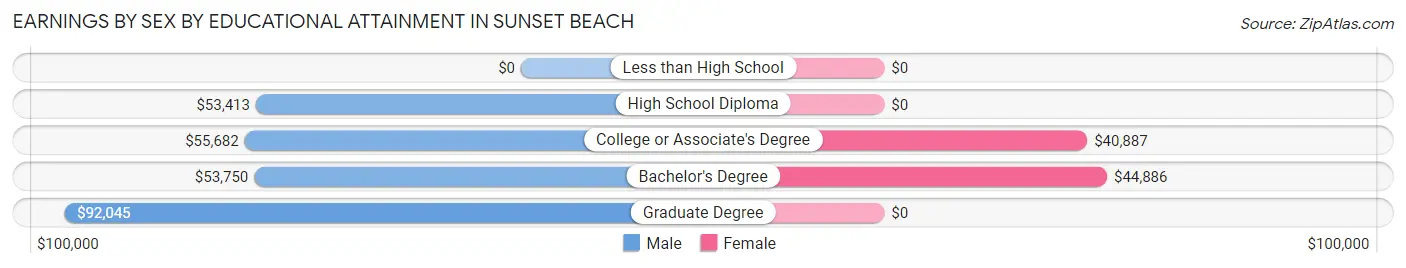
Earnings by Sex by Educational Attainment in Sunset Beach
Average earnings in Sunset Beach are $53,648 for men and $40,330 for women, a difference of 24.8%. Men with an educational attainment of graduate degree enjoy the highest average annual earnings of $92,045, while those with high school diploma education earn the least with $53,413. Women with an educational attainment of bachelor's degree earn the most with the average annual earnings of $44,886, while those with college or associate's degree education have the smallest earnings of $40,887.
| Educational Attainment | Male Income | Female Income |
| Less than High School | - | - |
| High School Diploma | $53,413 | $0 |
| College or Associate's Degree | $55,682 | $40,887 |
| Bachelor's Degree | $53,750 | $44,886 |
| Graduate Degree | $92,045 | $0 |
| Total | $53,648 | $40,330 |
Family Income in Sunset Beach
Family Income Brackets in Sunset Beach
According to the Sunset Beach family income data, there are 413 families falling into the $75,000 to $99,999 income range, which is the most common income bracket and makes up 30.1% of all families. Conversely, the less than $10,000 income bracket is the least frequent group with only 12 families (0.9%) belonging to this category.
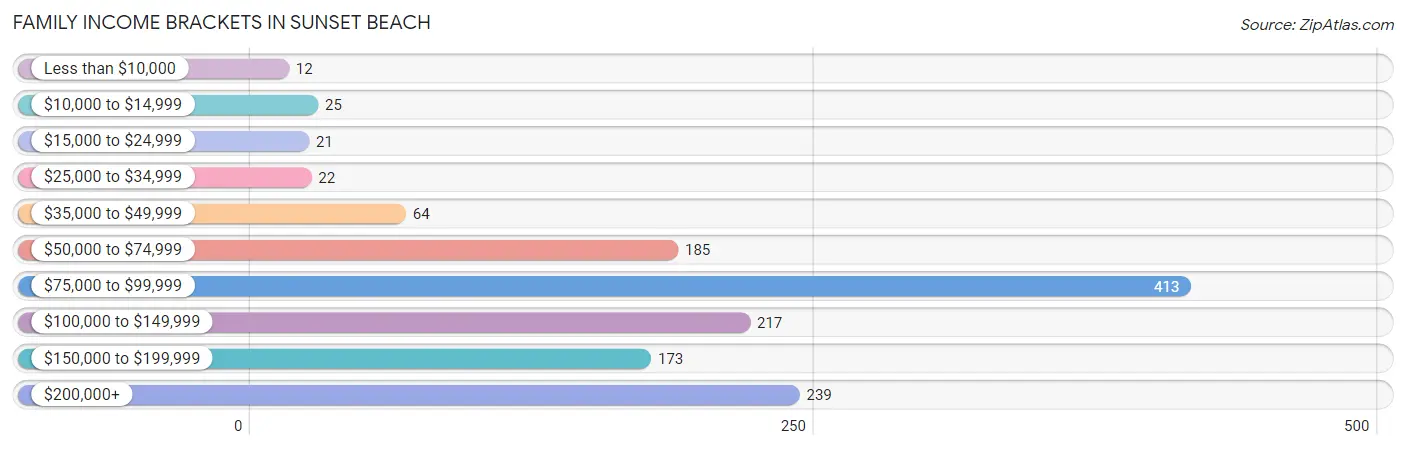
| Income Bracket | # Families | % Families |
| Less than $10,000 | 12 | 0.9% |
| $10,000 to $14,999 | 25 | 1.8% |
| $15,000 to $24,999 | 21 | 1.5% |
| $25,000 to $34,999 | 22 | 1.6% |
| $35,000 to $49,999 | 64 | 4.7% |
| $50,000 to $74,999 | 185 | 13.5% |
| $75,000 to $99,999 | 413 | 30.1% |
| $100,000 to $149,999 | 217 | 15.8% |
| $150,000 to $199,999 | 173 | 12.6% |
| $200,000+ | 239 | 17.4% |
Family Income by Famaliy Size in Sunset Beach
3-person families (158 | 11.5%) account for the highest median family income in Sunset Beach with $131,667 per family, while 2-person families (1,186 | 86.5%) have the highest median income of $47,970 per family member.
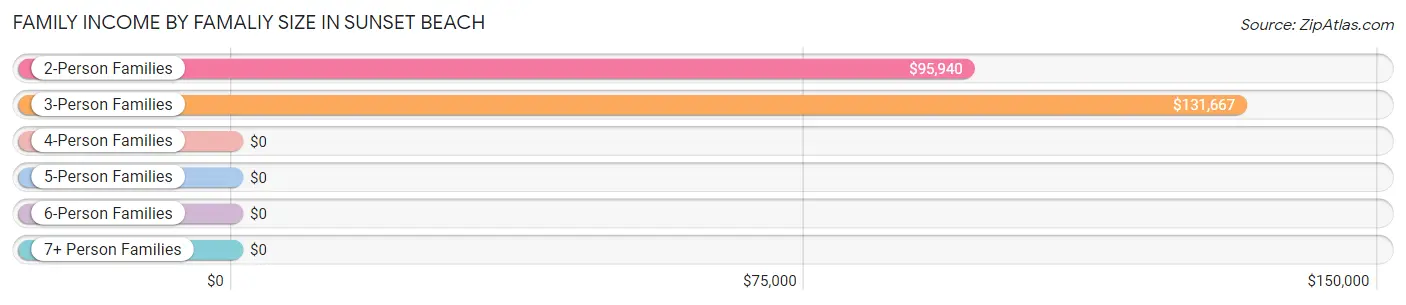
| Income Bracket | # Families | Median Income |
| 2-Person Families | 1,186 (86.5%) | $95,940 |
| 3-Person Families | 158 (11.5%) | $131,667 |
| 4-Person Families | 9 (0.7%) | $0 |
| 5-Person Families | 18 (1.3%) | $0 |
| 6-Person Families | 0 (0.0%) | $0 |
| 7+ Person Families | 0 (0.0%) | $0 |
| Total | 1,371 (100.0%) | $96,498 |
Family Income by Number of Earners in Sunset Beach
The median family income in Sunset Beach is $96,498, with families comprising 3+ earners (94) having the highest median family income of $173,188, while families with no earners (599) have the lowest median family income of $85,764, accounting for 6.9% and 43.7% of families, respectively.
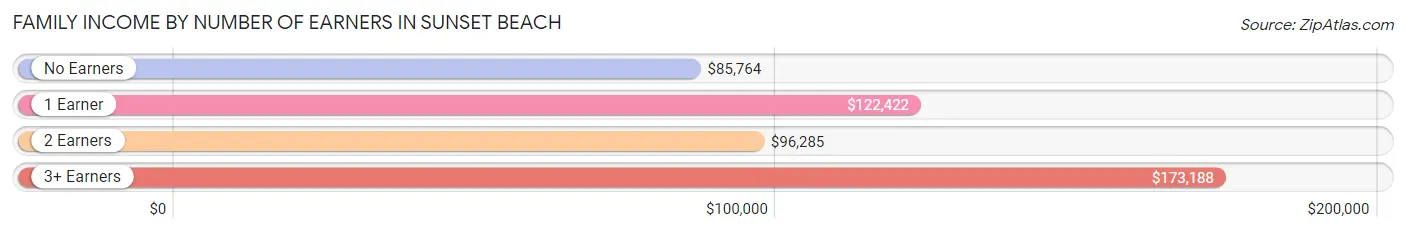
| Number of Earners | # Families | Median Income |
| No Earners | 599 (43.7%) | $85,764 |
| 1 Earner | 315 (23.0%) | $122,422 |
| 2 Earners | 363 (26.5%) | $96,285 |
| 3+ Earners | 94 (6.9%) | $173,188 |
| Total | 1,371 (100.0%) | $96,498 |
Household Income in Sunset Beach
Household Income Brackets in Sunset Beach
With 435 households falling in the category, the $75,000 to $99,999 income range is the most frequent in Sunset Beach, accounting for 19.0% of all households. In contrast, only 39 households (1.7%) fall into the $10,000 to $14,999 income bracket, making it the least populous group.
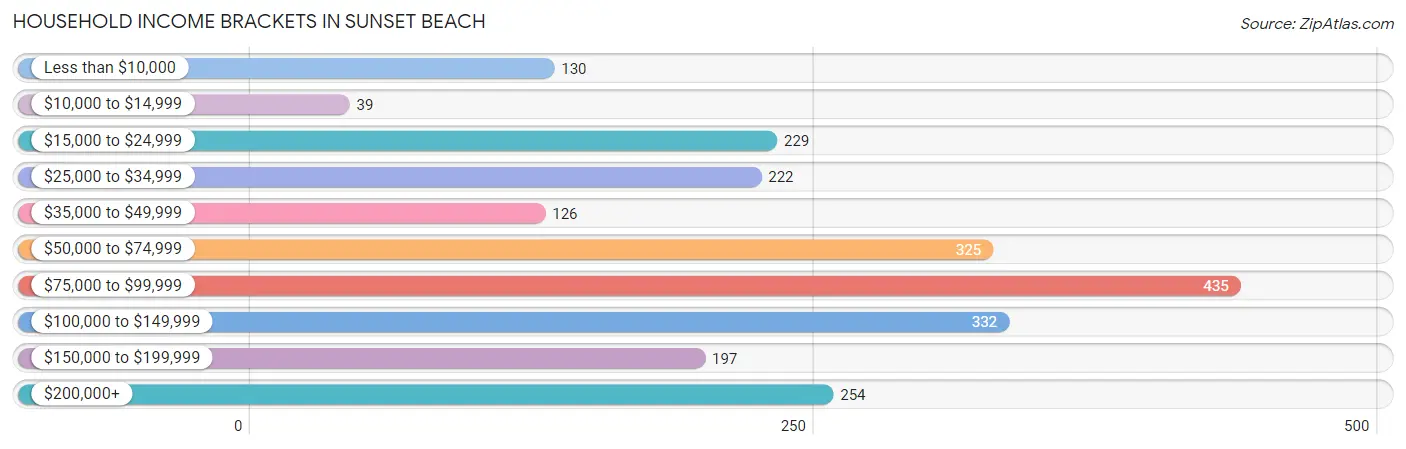
| Income Bracket | # Households | % Households |
| Less than $10,000 | 130 | 5.7% |
| $10,000 to $14,999 | 39 | 1.7% |
| $15,000 to $24,999 | 229 | 10.0% |
| $25,000 to $34,999 | 222 | 9.7% |
| $35,000 to $49,999 | 126 | 5.5% |
| $50,000 to $74,999 | 325 | 14.2% |
| $75,000 to $99,999 | 435 | 19.0% |
| $100,000 to $149,999 | 332 | 14.5% |
| $150,000 to $199,999 | 197 | 8.6% |
| $200,000+ | 254 | 11.1% |
Household Income by Householder Age in Sunset Beach
The median household income in Sunset Beach is $82,261, with the highest median household income of $96,658 found in the 45 to 64 years age bracket for the primary householder. A total of 623 households (27.2%) fall into this category.
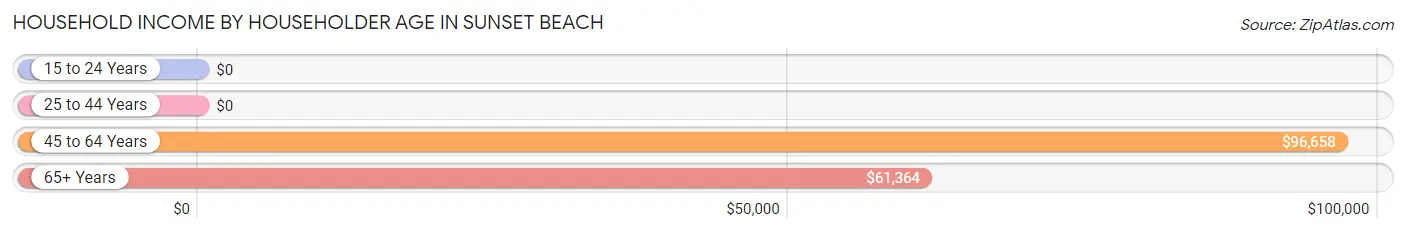
| Income Bracket | # Households | Median Income |
| 15 to 24 Years | 0 (0.0%) | $0 |
| 25 to 44 Years | 42 (1.8%) | $0 |
| 45 to 64 Years | 623 (27.2%) | $96,658 |
| 65+ Years | 1,624 (71.0%) | $61,364 |
| Total | 2,289 (100.0%) | $82,261 |
Poverty in Sunset Beach
Income Below Poverty by Sex and Age in Sunset Beach
With 3.2% poverty level for males and 7.2% for females among the residents of Sunset Beach, 55 to 64 year old males and 45 to 54 year old females are the most vulnerable to poverty, with 24 males (4.6%) and 40 females (25.0%) in their respective age groups living below the poverty level.
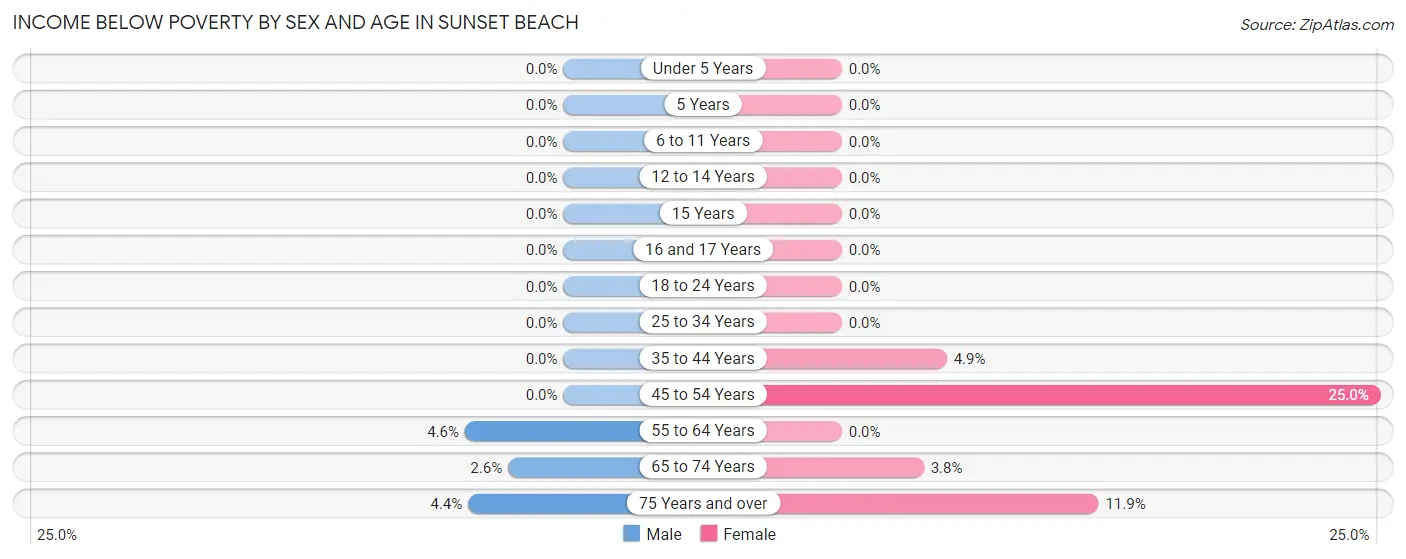
| Age Bracket | Male | Female |
| Under 5 Years | 0 (0.0%) | 0 (0.0%) |
| 5 Years | 0 (0.0%) | 0 (0.0%) |
| 6 to 11 Years | 0 (0.0%) | 0 (0.0%) |
| 12 to 14 Years | 0 (0.0%) | 0 (0.0%) |
| 15 Years | 0 (0.0%) | 0 (0.0%) |
| 16 and 17 Years | 0 (0.0%) | 0 (0.0%) |
| 18 to 24 Years | 0 (0.0%) | 0 (0.0%) |
| 25 to 34 Years | 0 (0.0%) | 0 (0.0%) |
| 35 to 44 Years | 0 (0.0%) | 15 (4.9%) |
| 45 to 54 Years | 0 (0.0%) | 40 (25.0%) |
| 55 to 64 Years | 24 (4.6%) | 0 (0.0%) |
| 65 to 74 Years | 13 (2.6%) | 21 (3.8%) |
| 75 Years and over | 17 (4.4%) | 104 (11.9%) |
| Total | 54 (3.2%) | 180 (7.2%) |
Income Above Poverty by Sex and Age in Sunset Beach
According to the poverty statistics in Sunset Beach, males aged 6 to 11 years and females aged under 5 years are the age groups that are most secure financially, with 100.0% of males and 100.0% of females in these age groups living above the poverty line.
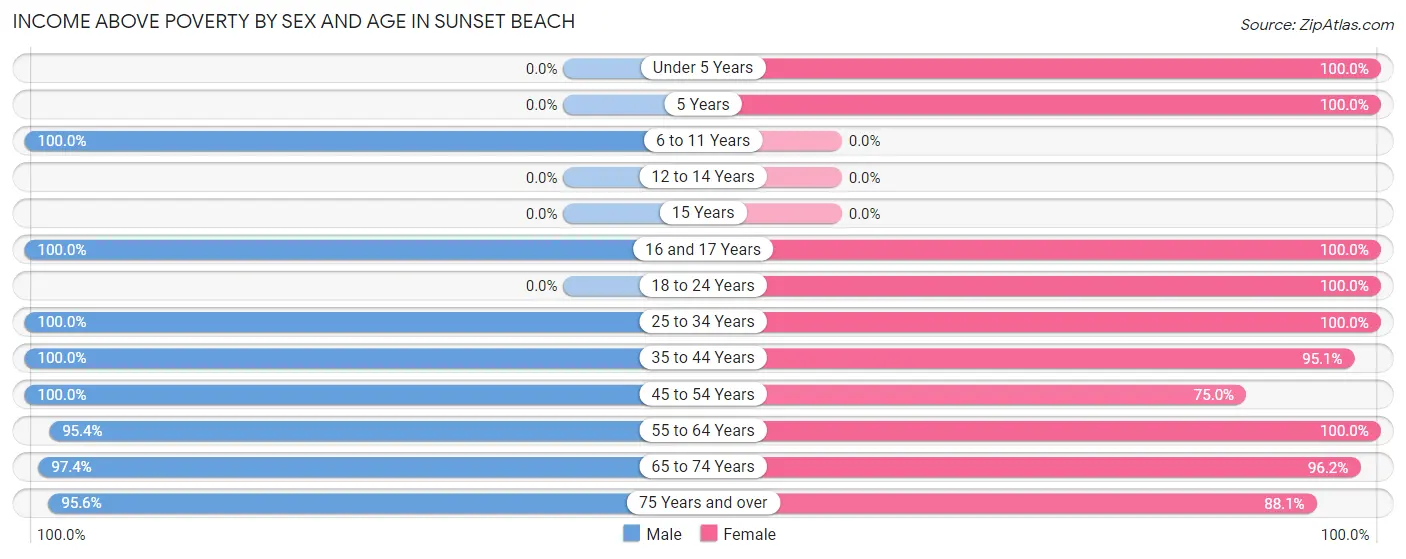
| Age Bracket | Male | Female |
| Under 5 Years | 0 (0.0%) | 47 (100.0%) |
| 5 Years | 0 (0.0%) | 22 (100.0%) |
| 6 to 11 Years | 24 (100.0%) | 0 (0.0%) |
| 12 to 14 Years | 0 (0.0%) | 0 (0.0%) |
| 15 Years | 0 (0.0%) | 0 (0.0%) |
| 16 and 17 Years | 16 (100.0%) | 27 (100.0%) |
| 18 to 24 Years | 0 (0.0%) | 115 (100.0%) |
| 25 to 34 Years | 57 (100.0%) | 42 (100.0%) |
| 35 to 44 Years | 78 (100.0%) | 293 (95.1%) |
| 45 to 54 Years | 101 (100.0%) | 120 (75.0%) |
| 55 to 64 Years | 501 (95.4%) | 352 (100.0%) |
| 65 to 74 Years | 492 (97.4%) | 531 (96.2%) |
| 75 Years and over | 368 (95.6%) | 769 (88.1%) |
| Total | 1,637 (96.8%) | 2,318 (92.8%) |
Income Below Poverty Among Married-Couple Families in Sunset Beach
The poverty statistics for married-couple families in Sunset Beach show that 3.5% or 38 of the total 1,095 families live below the poverty line. Families with no children have the highest poverty rate of 3.7%, comprising of 38 families. On the other hand, families with 1 or 2 children have the lowest poverty rate of 0.0%, which includes 0 families.
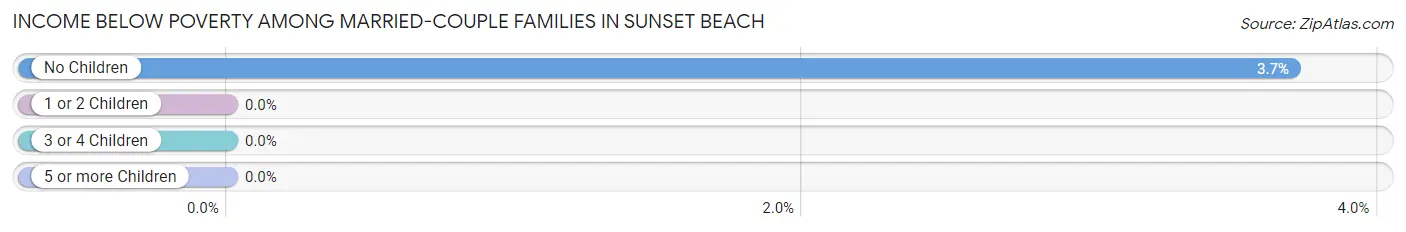
| Children | Above Poverty | Below Poverty |
| No Children | 988 (96.3%) | 38 (3.7%) |
| 1 or 2 Children | 69 (100.0%) | 0 (0.0%) |
| 3 or 4 Children | 0 (0.0%) | 0 (0.0%) |
| 5 or more Children | 0 (0.0%) | 0 (0.0%) |
| Total | 1,057 (96.5%) | 38 (3.5%) |
Income Below Poverty Among Single-Parent Households in Sunset Beach
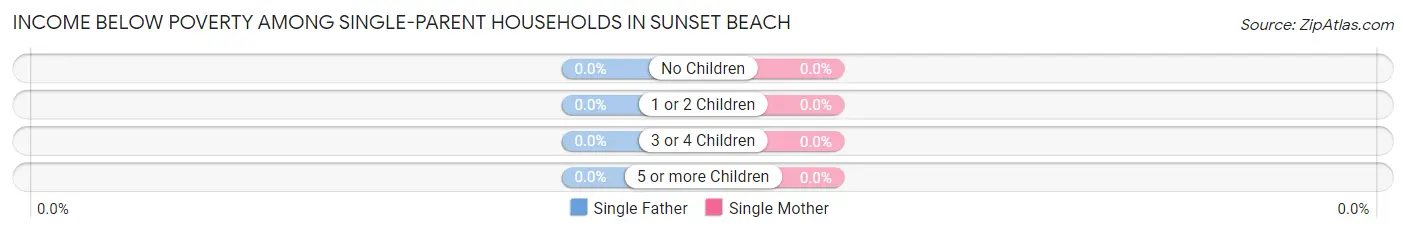
| Children | Single Father | Single Mother |
| No Children | 0 (0.0%) | 0 (0.0%) |
| 1 or 2 Children | 0 (0.0%) | 0 (0.0%) |
| 3 or 4 Children | 0 (0.0%) | 0 (0.0%) |
| 5 or more Children | 0 (0.0%) | 0 (0.0%) |
| Total | 0 (0.0%) | 0 (0.0%) |
Income Below Poverty Among Married-Couple vs Single-Parent Households in Sunset Beach
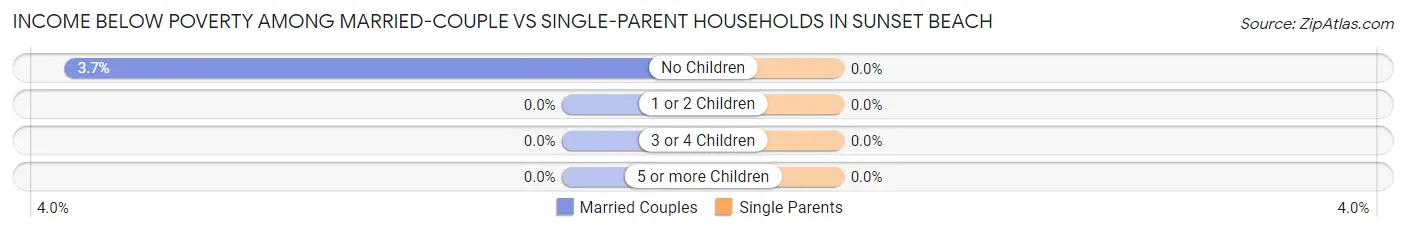
| Children | Married-Couple Families | Single-Parent Households |
| No Children | 38 (3.7%) | 0 (0.0%) |
| 1 or 2 Children | 0 (0.0%) | 0 (0.0%) |
| 3 or 4 Children | 0 (0.0%) | 0 (0.0%) |
| 5 or more Children | 0 (0.0%) | 0 (0.0%) |
| Total | 38 (3.5%) | 0 (0.0%) |
Race in Sunset Beach
The most populous races in Sunset Beach are White / Caucasian (4,058 | 96.9%), Asian (49 | 1.2%), and Some other Race (35 | 0.8%).
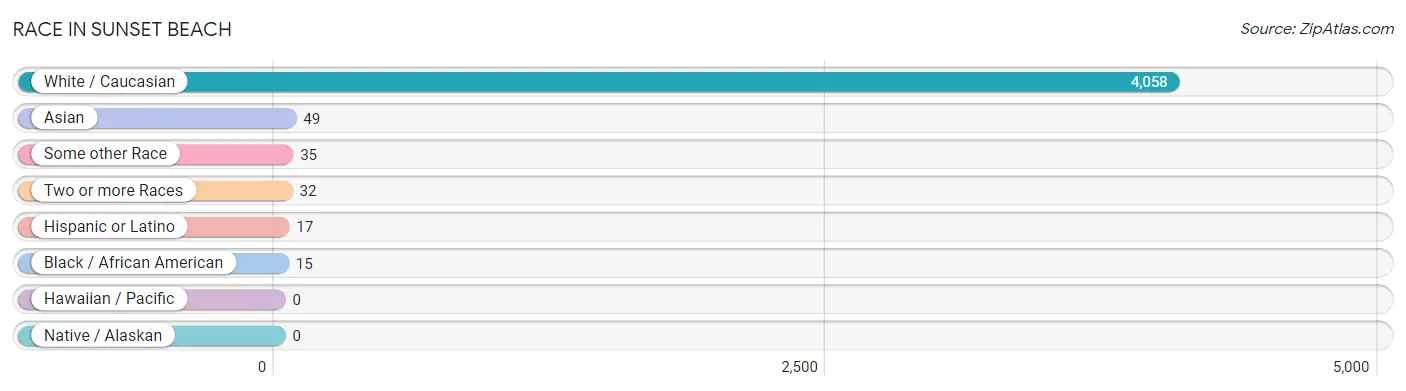
| Race | # Population | % Population |
| Asian | 49 | 1.2% |
| Black / African American | 15 | 0.4% |
| Hawaiian / Pacific | 0 | 0.0% |
| Hispanic or Latino | 17 | 0.4% |
| Native / Alaskan | 0 | 0.0% |
| White / Caucasian | 4,058 | 96.9% |
| Two or more Races | 32 | 0.8% |
| Some other Race | 35 | 0.8% |
| Total | 4,189 | 100.0% |
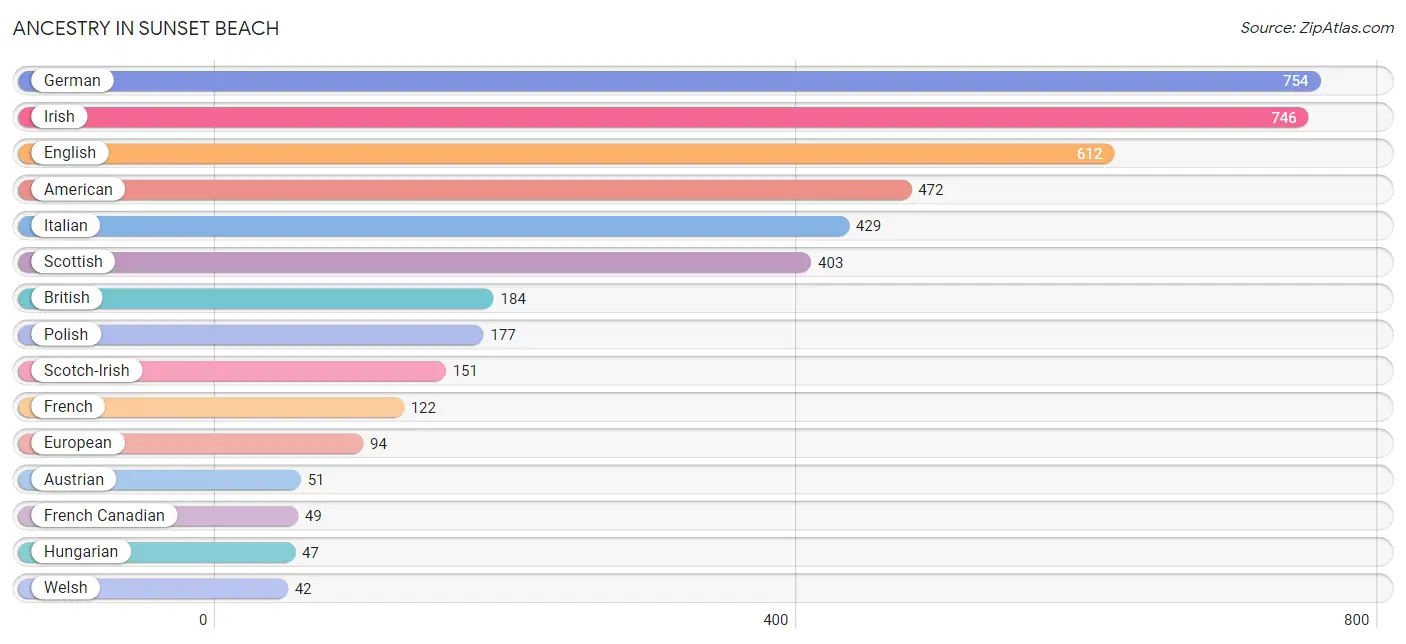
Ancestry in Sunset Beach
The most populous ancestries reported in Sunset Beach are German (754 | 18.0%), Irish (746 | 17.8%), English (612 | 14.6%), American (472 | 11.3%), and Italian (429 | 10.2%), together accounting for 71.9% of all Sunset Beach residents.
| Ancestry | # Population | % Population |
| American | 472 | 11.3% |
| Armenian | 14 | 0.3% |
| Australian | 4 | 0.1% |
| Austrian | 51 | 1.2% |
| British | 184 | 4.4% |
| Cherokee | 6 | 0.1% |
| Croatian | 7 | 0.2% |
| Czech | 16 | 0.4% |
| Danish | 8 | 0.2% |
| Dutch | 41 | 1.0% |
| English | 612 | 14.6% |
| European | 94 | 2.2% |
| Finnish | 11 | 0.3% |
| French | 122 | 2.9% |
| French Canadian | 49 | 1.2% |
| German | 754 | 18.0% |
| Hungarian | 47 | 1.1% |
| Irish | 746 | 17.8% |
| Italian | 429 | 10.2% |
| Korean | 21 | 0.5% |
| Mexican | 7 | 0.2% |
| Norwegian | 32 | 0.8% |
| Pennsylvania German | 8 | 0.2% |
| Polish | 177 | 4.2% |
| Puerto Rican | 10 | 0.2% |
| Russian | 21 | 0.5% |
| Scandinavian | 15 | 0.4% |
| Scotch-Irish | 151 | 3.6% |
| Scottish | 403 | 9.6% |
| Slovak | 8 | 0.2% |
| Swedish | 20 | 0.5% |
| Thai | 28 | 0.7% |
| Welsh | 42 | 1.0% | View All 33 Rows |
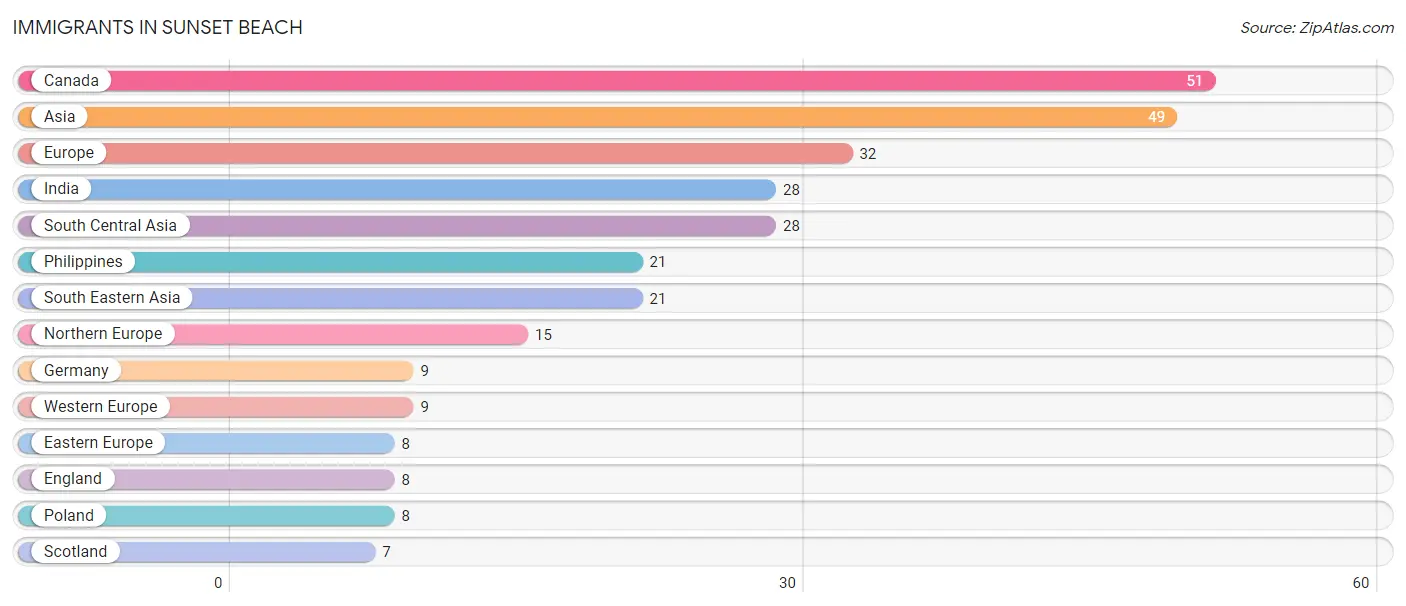
Immigrants in Sunset Beach
The most numerous immigrant groups reported in Sunset Beach came from Canada (51 | 1.2%), Asia (49 | 1.2%), Europe (32 | 0.8%), India (28 | 0.7%), and South Central Asia (28 | 0.7%), together accounting for 4.5% of all Sunset Beach residents.
| Immigration Origin | # Population | % Population |
| Asia | 49 | 1.2% |
| Canada | 51 | 1.2% |
| Eastern Europe | 8 | 0.2% |
| England | 8 | 0.2% |
| Europe | 32 | 0.8% |
| Germany | 9 | 0.2% |
| India | 28 | 0.7% |
| Northern Europe | 15 | 0.4% |
| Philippines | 21 | 0.5% |
| Poland | 8 | 0.2% |
| Scotland | 7 | 0.2% |
| South Central Asia | 28 | 0.7% |
| South Eastern Asia | 21 | 0.5% |
| Western Europe | 9 | 0.2% | View All 14 Rows |
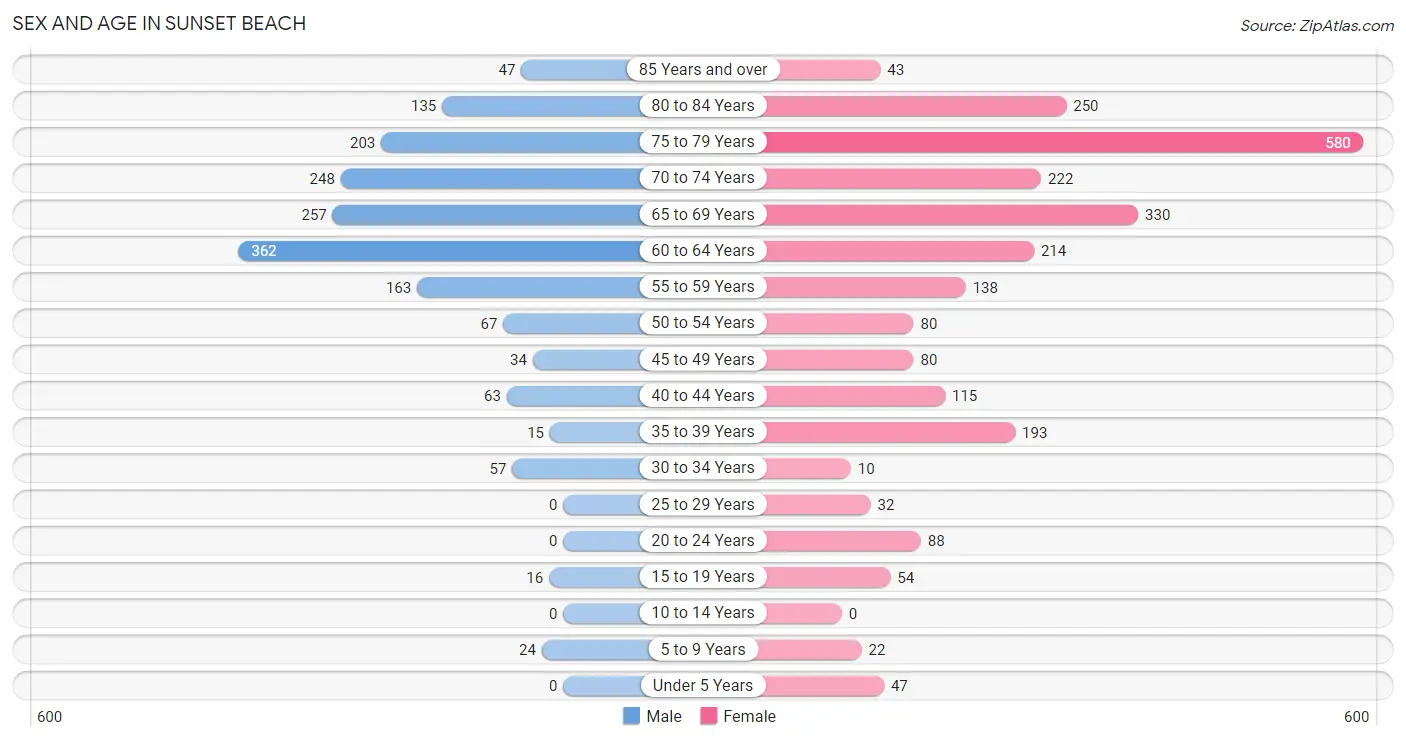
Sex and Age in Sunset Beach
Sex and Age in Sunset Beach
The most populous age groups in Sunset Beach are 60 to 64 Years (362 | 21.4%) for men and 75 to 79 Years (580 | 23.2%) for women.
| Age Bracket | Male | Female |
| Under 5 Years | 0 (0.0%) | 47 (1.9%) |
| 5 to 9 Years | 24 (1.4%) | 22 (0.9%) |
| 10 to 14 Years | 0 (0.0%) | 0 (0.0%) |
| 15 to 19 Years | 16 (0.9%) | 54 (2.2%) |
| 20 to 24 Years | 0 (0.0%) | 88 (3.5%) |
| 25 to 29 Years | 0 (0.0%) | 32 (1.3%) |
| 30 to 34 Years | 57 (3.4%) | 10 (0.4%) |
| 35 to 39 Years | 15 (0.9%) | 193 (7.7%) |
| 40 to 44 Years | 63 (3.7%) | 115 (4.6%) |
| 45 to 49 Years | 34 (2.0%) | 80 (3.2%) |
| 50 to 54 Years | 67 (4.0%) | 80 (3.2%) |
| 55 to 59 Years | 163 (9.6%) | 138 (5.5%) |
| 60 to 64 Years | 362 (21.4%) | 214 (8.6%) |
| 65 to 69 Years | 257 (15.2%) | 330 (13.2%) |
| 70 to 74 Years | 248 (14.7%) | 222 (8.9%) |
| 75 to 79 Years | 203 (12.0%) | 580 (23.2%) |
| 80 to 84 Years | 135 (8.0%) | 250 (10.0%) |
| 85 Years and over | 47 (2.8%) | 43 (1.7%) |
| Total | 1,691 (100.0%) | 2,498 (100.0%) |
Families and Households in Sunset Beach
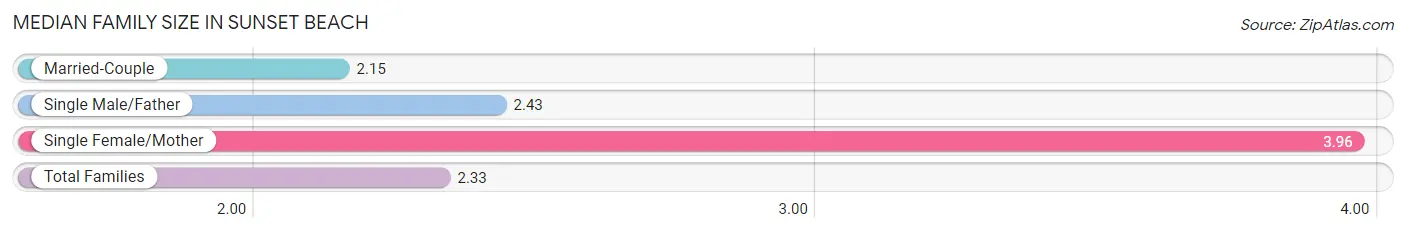
Median Family Size in Sunset Beach
The median family size in Sunset Beach is 2.33 persons per family, with single female/mother families (114 | 8.3%) accounting for the largest median family size of 3.96 persons per family. On the other hand, married-couple families (1,095 | 79.9%) represent the smallest median family size with 2.15 persons per family.
| Family Type | # Families | Family Size |
| Married-Couple | 1,095 (79.9%) | 2.15 |
| Single Male/Father | 162 (11.8%) | 2.43 |
| Single Female/Mother | 114 (8.3%) | 3.96 |
| Total Families | 1,371 (100.0%) | 2.33 |
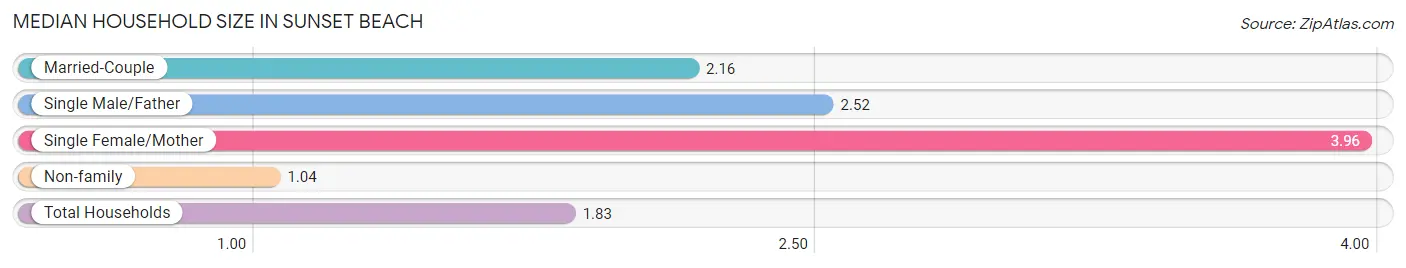
Median Household Size in Sunset Beach
The median household size in Sunset Beach is 1.83 persons per household, with single female/mother households (114 | 5.0%) accounting for the largest median household size of 3.96 persons per household. non-family households (918 | 40.1%) represent the smallest median household size with 1.04 persons per household.
| Household Type | # Households | Household Size |
| Married-Couple | 1,095 (47.8%) | 2.16 |
| Single Male/Father | 162 (7.1%) | 2.52 |
| Single Female/Mother | 114 (5.0%) | 3.96 |
| Non-family | 918 (40.1%) | 1.04 |
| Total Households | 2,289 (100.0%) | 1.83 |
Household Size by Marriage Status in Sunset Beach
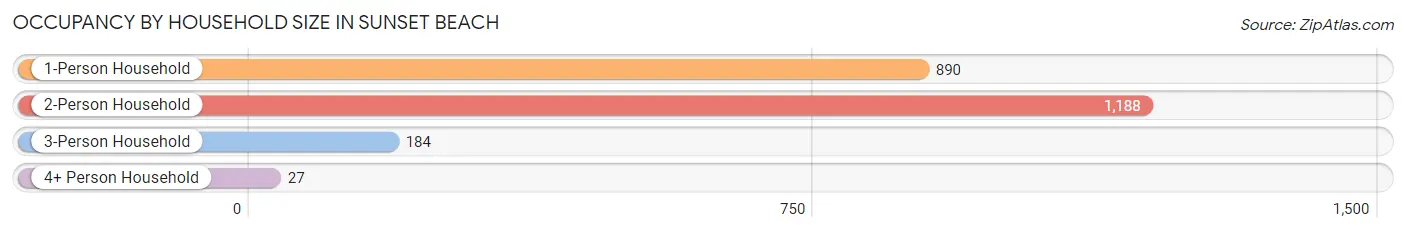
Out of a total of 2,289 households in Sunset Beach, 1,371 (59.9%) are family households, while 918 (40.1%) are nonfamily households. The most numerous type of family households are 2-person households, comprising 1,160, and the most common type of nonfamily households are 1-person households, comprising 890.
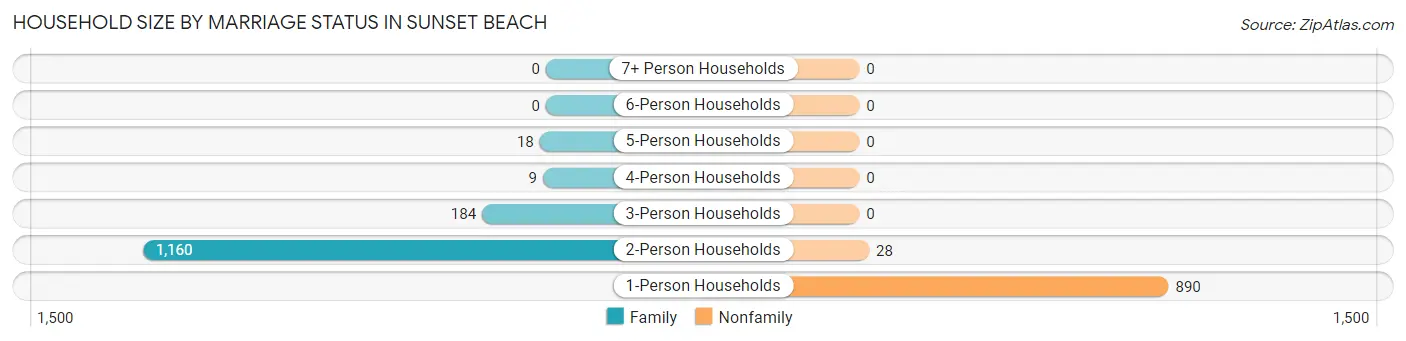
| Household Size | Family Households | Nonfamily Households |
| 1-Person Households | - | 890 (38.9%) |
| 2-Person Households | 1,160 (50.7%) | 28 (1.2%) |
| 3-Person Households | 184 (8.0%) | 0 (0.0%) |
| 4-Person Households | 9 (0.4%) | 0 (0.0%) |
| 5-Person Households | 18 (0.8%) | 0 (0.0%) |
| 6-Person Households | 0 (0.0%) | 0 (0.0%) |
| 7+ Person Households | 0 (0.0%) | 0 (0.0%) |
| Total | 1,371 (59.9%) | 918 (40.1%) |
Female Fertility in Sunset Beach
Fertility by Age in Sunset Beach
Average fertility rate in Sunset Beach is 26.0 births per 1,000 women. Women in the age bracket of 35 to 50 years have the highest fertility rate with 39.0 births per 1,000 women. Women in the age bracket of 35 to 50 years acount for 100.0% of all women with births.
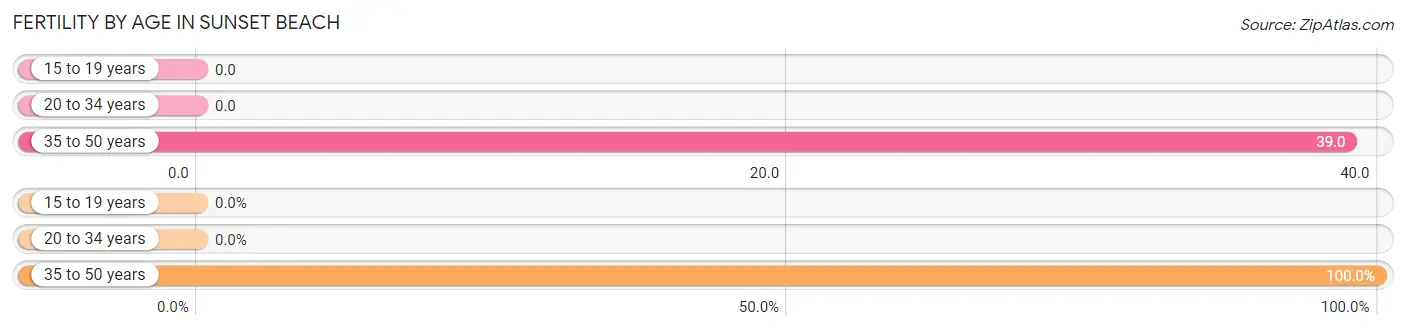
| Age Bracket | Women with Births | Births / 1,000 Women |
| 15 to 19 years | 0 (0.0%) | 0.0 |
| 20 to 34 years | 0 (0.0%) | 0.0 |
| 35 to 50 years | 15 (100.0%) | 39.0 |
| Total | 15 (100.0%) | 26.0 |
Fertility by Age by Marriage Status in Sunset Beach
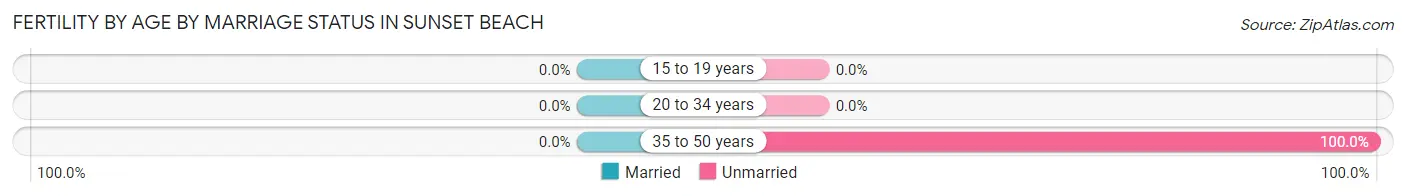
| Age Bracket | Married | Unmarried |
| 15 to 19 years | 0 (0.0%) | 0 (0.0%) |
| 20 to 34 years | 0 (0.0%) | 0 (0.0%) |
| 35 to 50 years | 0 (0.0%) | 15 (100.0%) |
| Total | 0 (0.0%) | 15 (100.0%) |
Fertility by Education in Sunset Beach
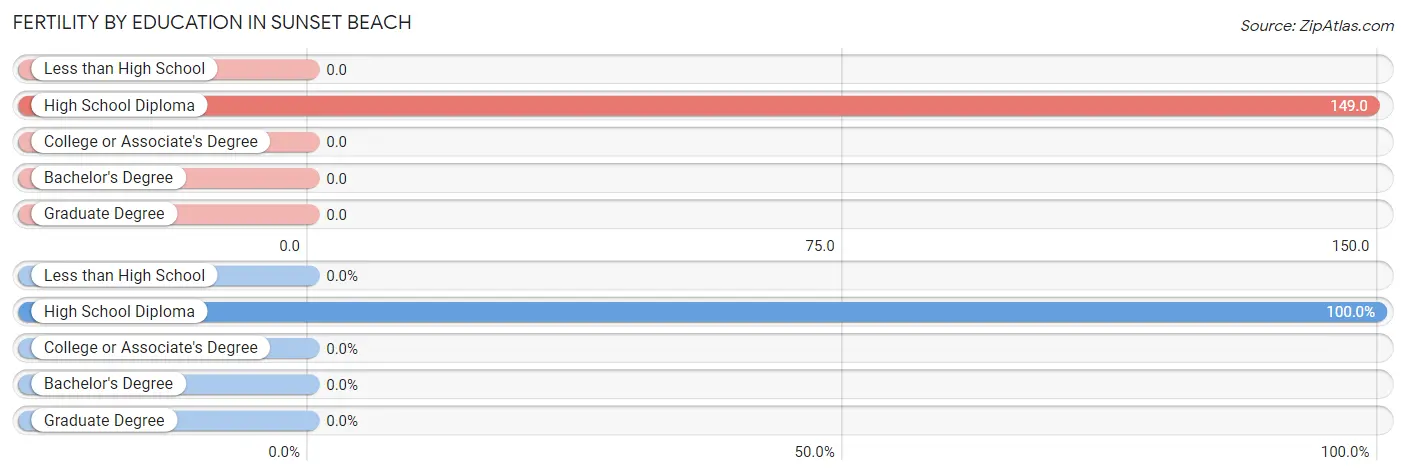
| Educational Attainment | Women with Births | Births / 1,000 Women |
| Less than High School | 0 (0.0%) | 0.0 |
| High School Diploma | 15 (100.0%) | 149.0 |
| College or Associate's Degree | 0 (0.0%) | 0.0 |
| Bachelor's Degree | 0 (0.0%) | 0.0 |
| Graduate Degree | 0 (0.0%) | 0.0 |
| Total | 15 (100.0%) | 26.0 |
Fertility by Education by Marriage Status in Sunset Beach
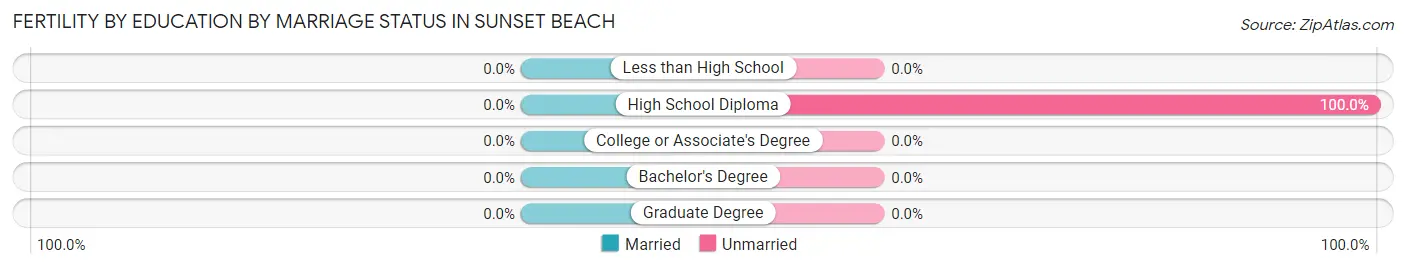
| Educational Attainment | Married | Unmarried |
| Less than High School | 0 (0.0%) | 0 (0.0%) |
| High School Diploma | 0 (0.0%) | 15 (100.0%) |
| College or Associate's Degree | 0 (0.0%) | 0 (0.0%) |
| Bachelor's Degree | 0 (0.0%) | 0 (0.0%) |
| Graduate Degree | 0 (0.0%) | 0 (0.0%) |
| Total | 0 (0.0%) | 15 (100.0%) |
Employment Characteristics in Sunset Beach
Employment by Class of Employer in Sunset Beach
Among the 1,344 employed individuals in Sunset Beach, private company employees (831 | 61.8%), local government employees (191 | 14.2%), and not-for-profit organizations (122 | 9.1%) make up the most common classes of employment.
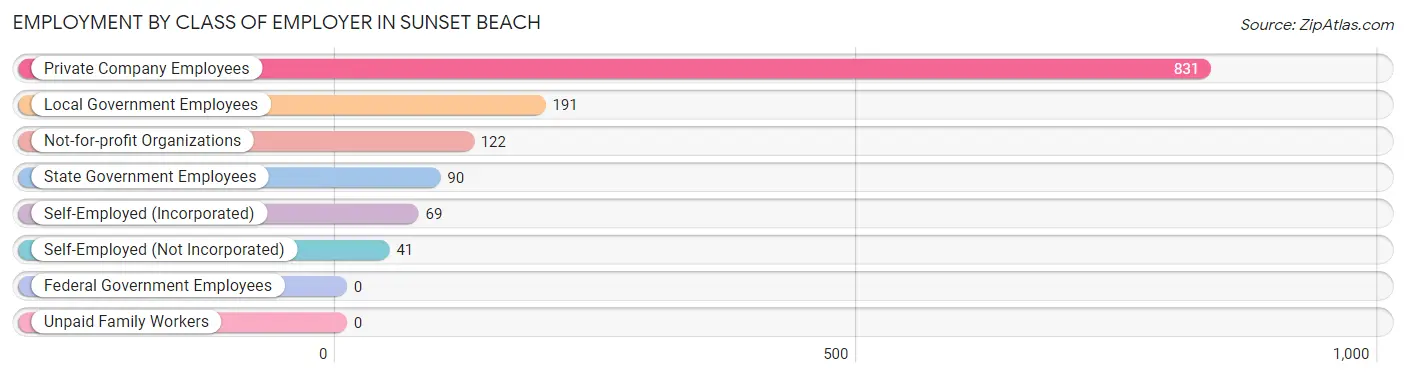
| Employer Class | # Employees | % Employees |
| Private Company Employees | 831 | 61.8% |
| Self-Employed (Incorporated) | 69 | 5.1% |
| Self-Employed (Not Incorporated) | 41 | 3.0% |
| Not-for-profit Organizations | 122 | 9.1% |
| Local Government Employees | 191 | 14.2% |
| State Government Employees | 90 | 6.7% |
| Federal Government Employees | 0 | 0.0% |
| Unpaid Family Workers | 0 | 0.0% |
| Total | 1,344 | 100.0% |
Employment Status by Age in Sunset Beach
According to the labor force statistics for Sunset Beach, out of the total population over 16 years of age (4,096), 35.8% or 1,466 individuals are in the labor force, with 4.0% or 59 of them unemployed. The age group with the highest labor force participation rate is 16 to 19 years, with 100.0% or 70 individuals in the labor force. Within the labor force, the 75 years and over age range has the highest percentage of unemployed individuals, with 40.0% or 6 of them being unemployed.
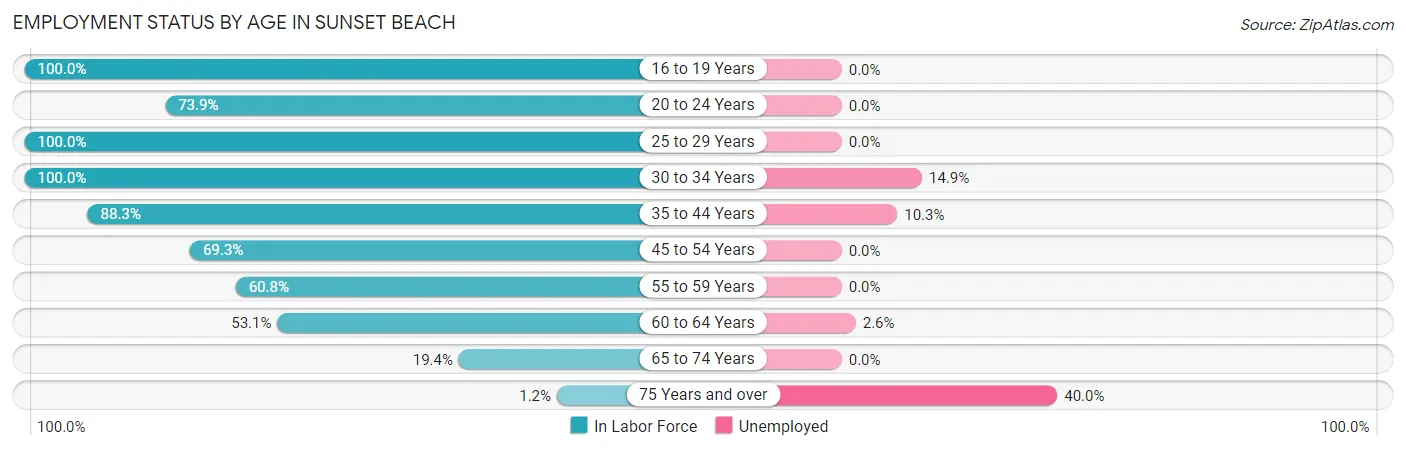
| Age Bracket | In Labor Force | Unemployed |
| 16 to 19 Years | 70 (100.0%) | 0 (0.0%) |
| 20 to 24 Years | 65 (73.9%) | 0 (0.0%) |
| 25 to 29 Years | 32 (100.0%) | 0 (0.0%) |
| 30 to 34 Years | 67 (100.0%) | 10 (14.9%) |
| 35 to 44 Years | 341 (88.3%) | 35 (10.3%) |
| 45 to 54 Years | 181 (69.3%) | 0 (0.0%) |
| 55 to 59 Years | 183 (60.8%) | 0 (0.0%) |
| 60 to 64 Years | 306 (53.1%) | 8 (2.6%) |
| 65 to 74 Years | 205 (19.4%) | 0 (0.0%) |
| 75 Years and over | 15 (1.2%) | 6 (40.0%) |
| Total | 1,466 (35.8%) | 59 (4.0%) |
Employment Status by Educational Attainment in Sunset Beach
According to labor force statistics for Sunset Beach, 68.4% of individuals (1,110) out of the total population between 25 and 64 years of age (1,623) are in the labor force, with 4.8% or 53 of them being unemployed. The group with the highest labor force participation rate are those with the educational attainment of college / associate degree, with 75.0% or 444 individuals in the labor force. Within the labor force, individuals with high school diploma education have the highest percentage of unemployment, with 12.2% or 35 of them being unemployed.
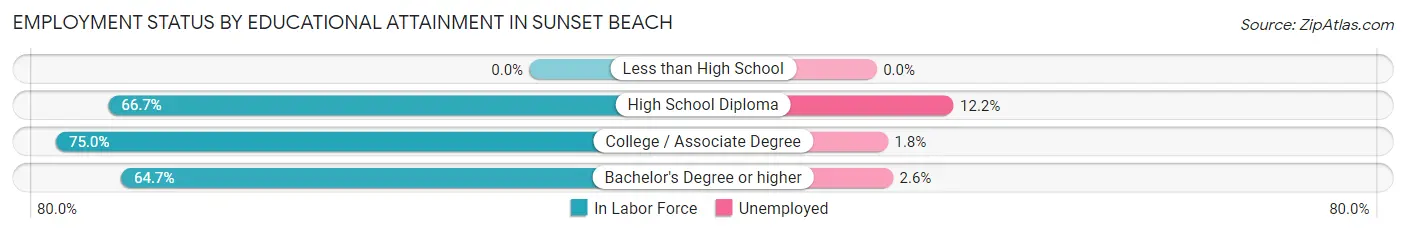
| Educational Attainment | In Labor Force | Unemployed |
| Less than High School | 0 (0.0%) | 0 (0.0%) |
| High School Diploma | 287 (66.7%) | 52 (12.2%) |
| College / Associate Degree | 444 (75.0%) | 11 (1.8%) |
| Bachelor's Degree or higher | 379 (64.7%) | 15 (2.6%) |
| Total | 1,110 (68.4%) | 78 (4.8%) |
Employment Occupations by Sex in Sunset Beach
Management, Business, Science and Arts Occupations
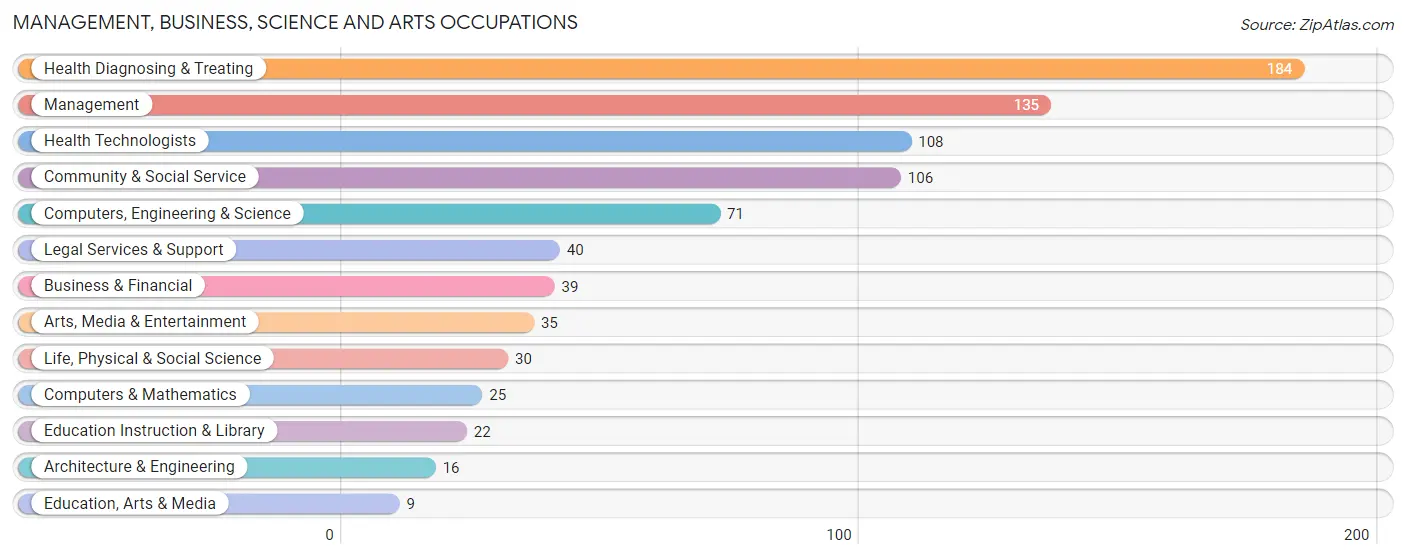
The most common Management, Business, Science and Arts occupations in Sunset Beach are Health Diagnosing & Treating (184 | 13.1%), Management (135 | 9.6%), Health Technologists (108 | 7.7%), Community & Social Service (106 | 7.5%), and Computers, Engineering & Science (71 | 5.1%).
Management, Business, Science and Arts Occupations by Sex
Within the Management, Business, Science and Arts occupations in Sunset Beach, the most male-oriented occupations are Computers, Engineering & Science (100.0%), Computers & Mathematics (100.0%), and Architecture & Engineering (100.0%), while the most female-oriented occupations are Education, Arts & Media (100.0%), Legal Services & Support (100.0%), and Health Diagnosing & Treating (81.5%).
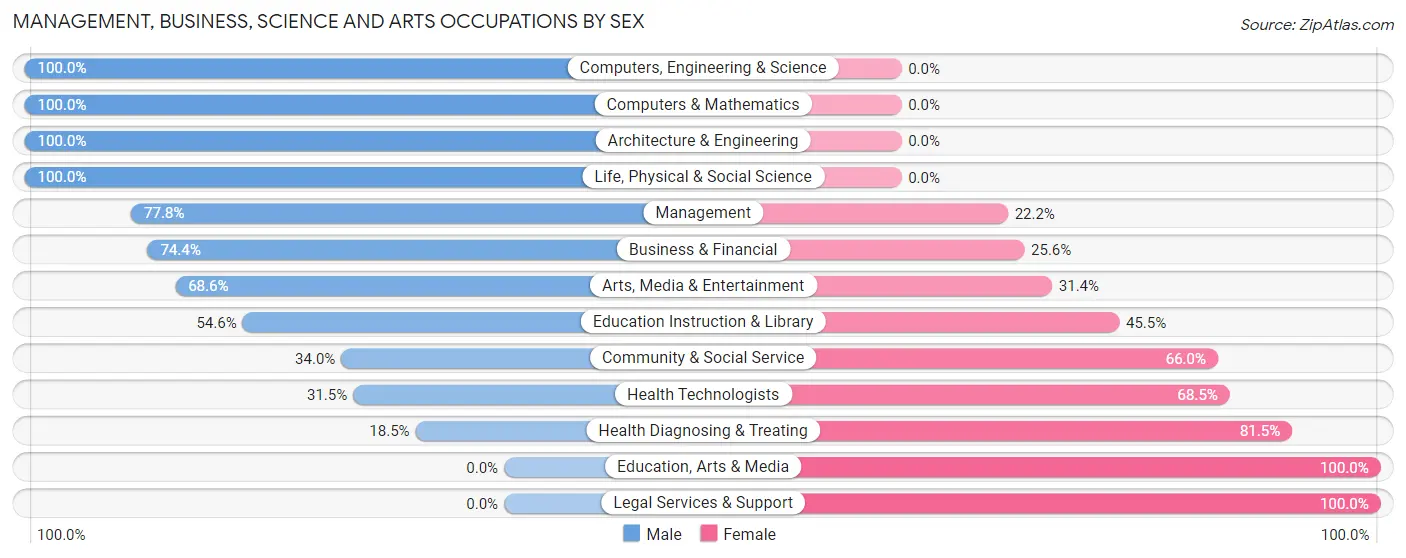
| Occupation | Male | Female |
| Management | 105 (77.8%) | 30 (22.2%) |
| Business & Financial | 29 (74.4%) | 10 (25.6%) |
| Computers, Engineering & Science | 71 (100.0%) | 0 (0.0%) |
| Computers & Mathematics | 25 (100.0%) | 0 (0.0%) |
| Architecture & Engineering | 16 (100.0%) | 0 (0.0%) |
| Life, Physical & Social Science | 30 (100.0%) | 0 (0.0%) |
| Community & Social Service | 36 (34.0%) | 70 (66.0%) |
| Education, Arts & Media | 0 (0.0%) | 9 (100.0%) |
| Legal Services & Support | 0 (0.0%) | 40 (100.0%) |
| Education Instruction & Library | 12 (54.5%) | 10 (45.5%) |
| Arts, Media & Entertainment | 24 (68.6%) | 11 (31.4%) |
| Health Diagnosing & Treating | 34 (18.5%) | 150 (81.5%) |
| Health Technologists | 34 (31.5%) | 74 (68.5%) |
| Total (Category) | 275 (51.4%) | 260 (48.6%) |
| Total (Overall) | 700 (49.8%) | 706 (50.2%) |
Services Occupations
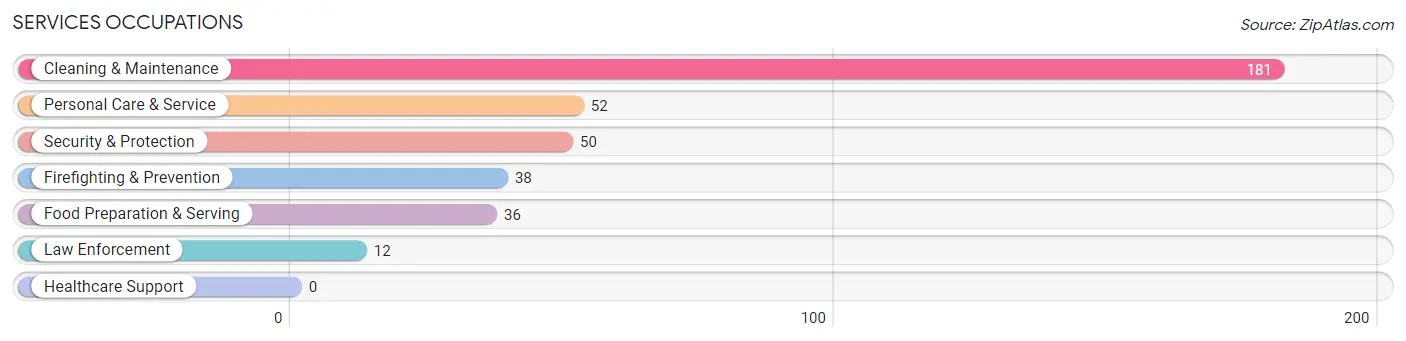
The most common Services occupations in Sunset Beach are Cleaning & Maintenance (181 | 12.9%), Personal Care & Service (52 | 3.7%), Security & Protection (50 | 3.6%), Firefighting & Prevention (38 | 2.7%), and Food Preparation & Serving (36 | 2.6%).
Services Occupations by Sex
Within the Services occupations in Sunset Beach, the most male-oriented occupations are Law Enforcement (100.0%), Cleaning & Maintenance (100.0%), and Personal Care & Service (82.7%), while the most female-oriented occupations are Firefighting & Prevention (84.2%), Food Preparation & Serving (80.6%), and Security & Protection (64.0%).
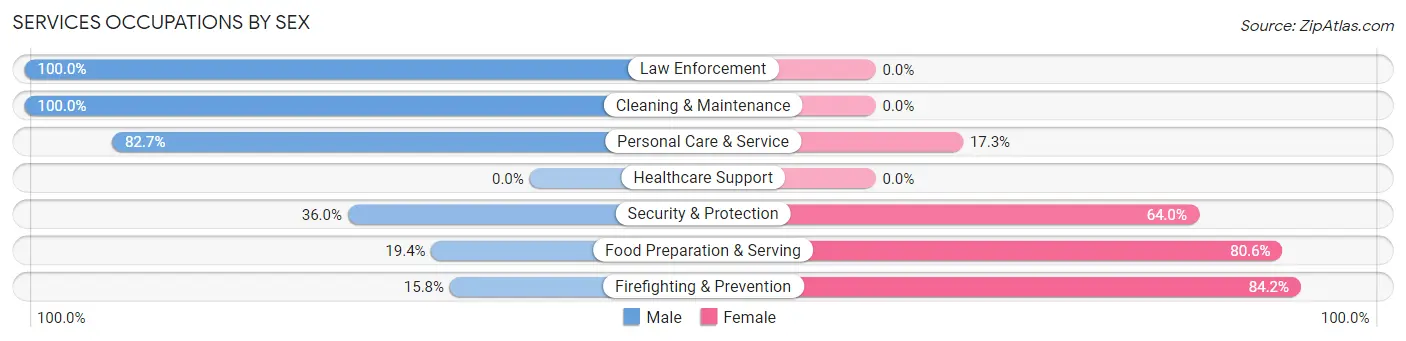
| Occupation | Male | Female |
| Healthcare Support | 0 (0.0%) | 0 (0.0%) |
| Security & Protection | 18 (36.0%) | 32 (64.0%) |
| Firefighting & Prevention | 6 (15.8%) | 32 (84.2%) |
| Law Enforcement | 12 (100.0%) | 0 (0.0%) |
| Food Preparation & Serving | 7 (19.4%) | 29 (80.6%) |
| Cleaning & Maintenance | 181 (100.0%) | 0 (0.0%) |
| Personal Care & Service | 43 (82.7%) | 9 (17.3%) |
| Total (Category) | 249 (78.1%) | 70 (21.9%) |
| Total (Overall) | 700 (49.8%) | 706 (50.2%) |
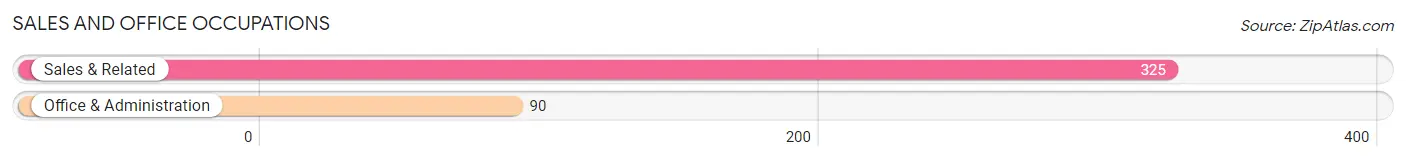
Sales and Office Occupations
The most common Sales and Office occupations in Sunset Beach are Sales & Related (325 | 23.1%), and Office & Administration (90 | 6.4%).
Sales and Office Occupations by Sex
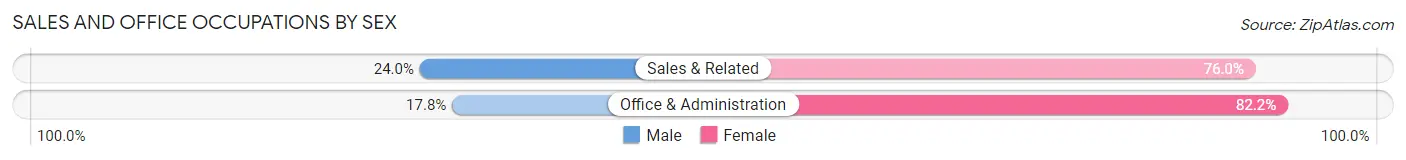
| Occupation | Male | Female |
| Sales & Related | 78 (24.0%) | 247 (76.0%) |
| Office & Administration | 16 (17.8%) | 74 (82.2%) |
| Total (Category) | 94 (22.7%) | 321 (77.3%) |
| Total (Overall) | 700 (49.8%) | 706 (50.2%) |
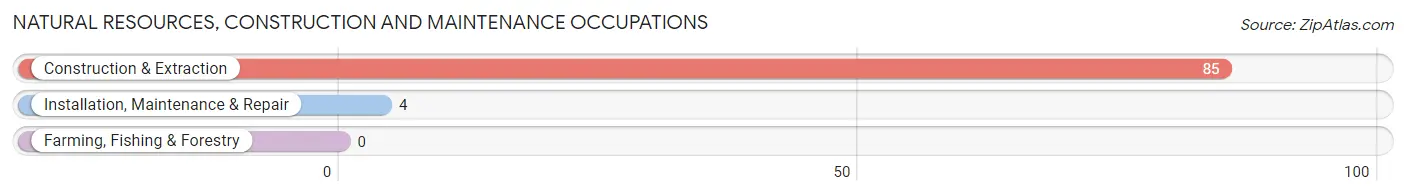
Natural Resources, Construction and Maintenance Occupations
The most common Natural Resources, Construction and Maintenance occupations in Sunset Beach are Construction & Extraction (85 | 6.0%), and Installation, Maintenance & Repair (4 | 0.3%).
Natural Resources, Construction and Maintenance Occupations by Sex
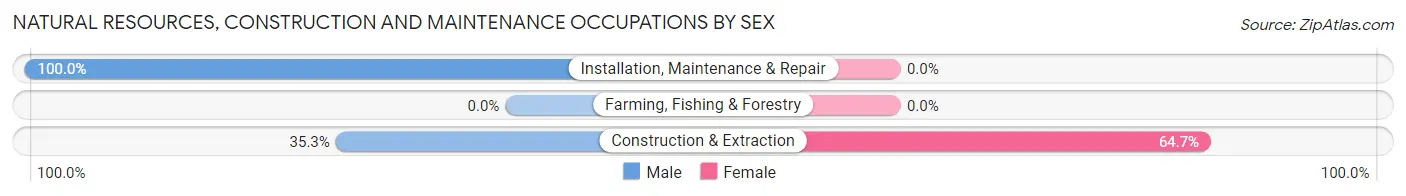
| Occupation | Male | Female |
| Farming, Fishing & Forestry | 0 (0.0%) | 0 (0.0%) |
| Construction & Extraction | 30 (35.3%) | 55 (64.7%) |
| Installation, Maintenance & Repair | 4 (100.0%) | 0 (0.0%) |
| Total (Category) | 34 (38.2%) | 55 (61.8%) |
| Total (Overall) | 700 (49.8%) | 706 (50.2%) |
Production, Transportation and Moving Occupations
The most common Production, Transportation and Moving occupations in Sunset Beach are Material Moving (28 | 2.0%), and Transportation (20 | 1.4%).
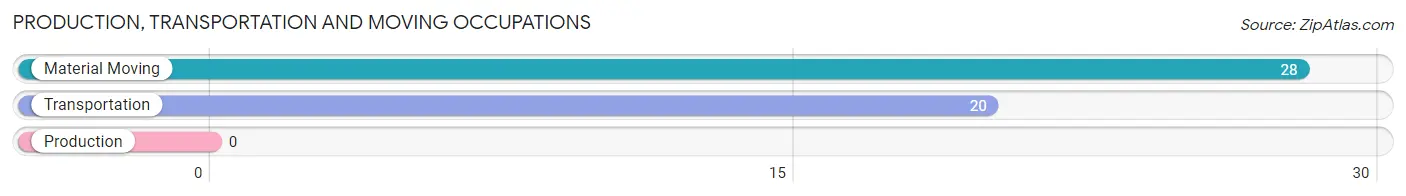
Production, Transportation and Moving Occupations by Sex
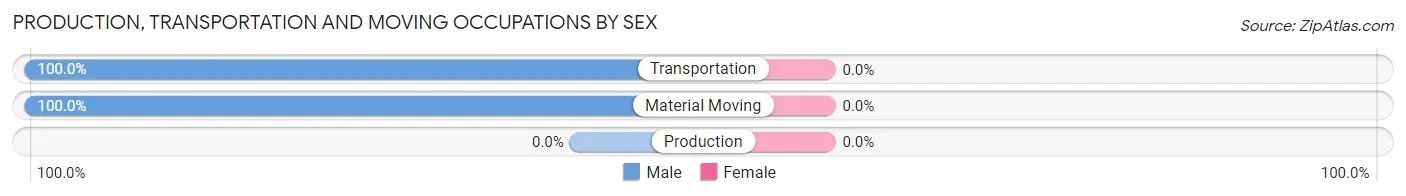
| Occupation | Male | Female |
| Production | 0 (0.0%) | 0 (0.0%) |
| Transportation | 20 (100.0%) | 0 (0.0%) |
| Material Moving | 28 (100.0%) | 0 (0.0%) |
| Total (Category) | 48 (100.0%) | 0 (0.0%) |
| Total (Overall) | 700 (49.8%) | 706 (50.2%) |
Employment Industries by Sex in Sunset Beach
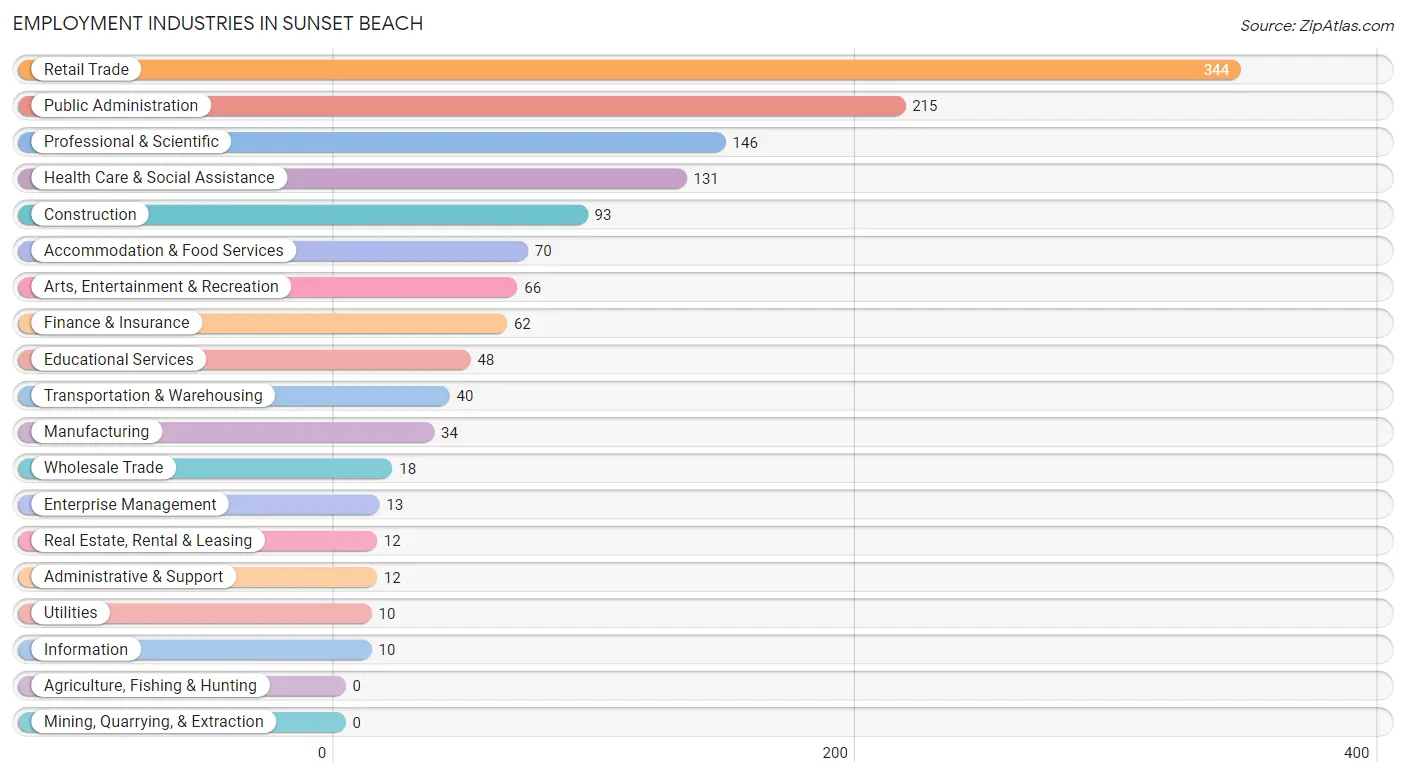
Employment Industries in Sunset Beach
The major employment industries in Sunset Beach include Retail Trade (344 | 24.5%), Public Administration (215 | 15.3%), Professional & Scientific (146 | 10.4%), Health Care & Social Assistance (131 | 9.3%), and Construction (93 | 6.6%).
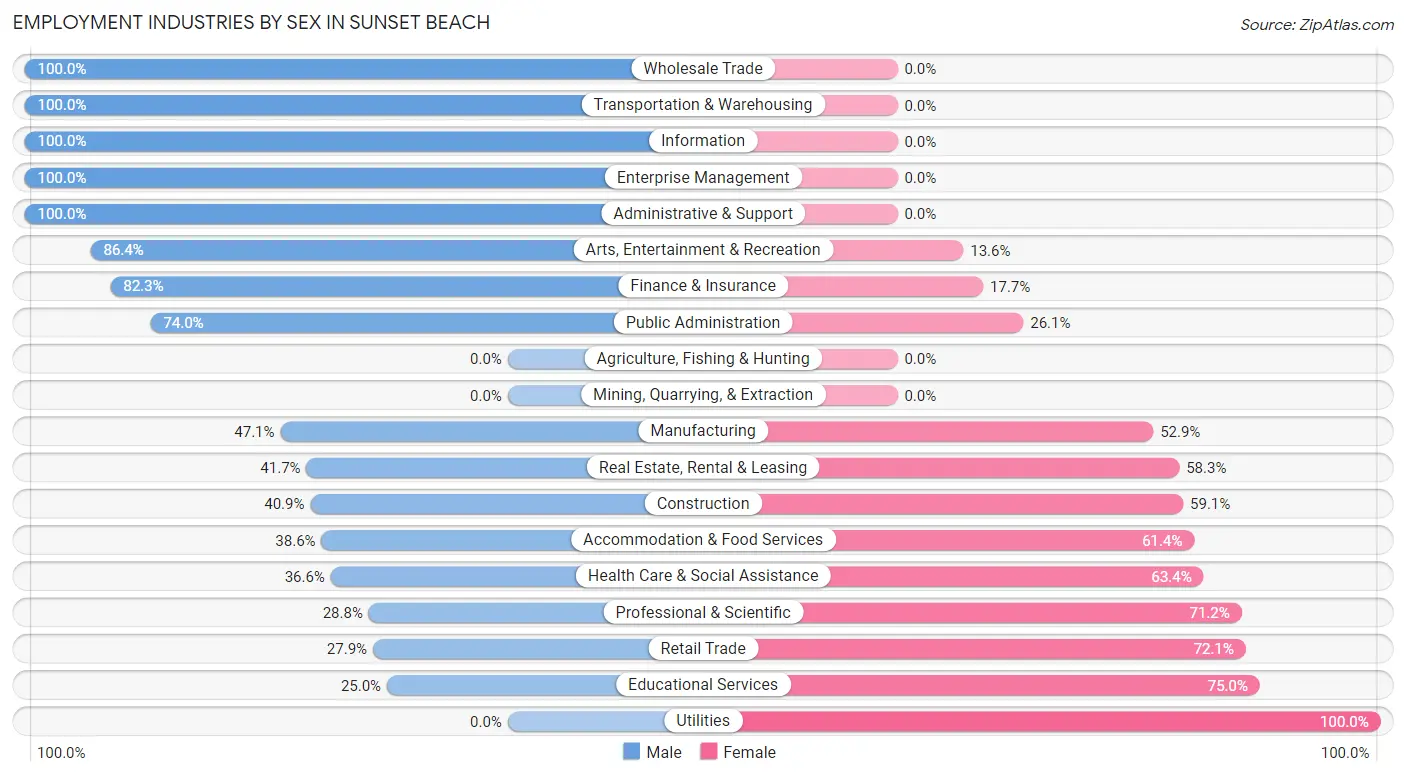
Employment Industries by Sex in Sunset Beach
The Sunset Beach industries that see more men than women are Wholesale Trade (100.0%), Transportation & Warehousing (100.0%), and Information (100.0%), whereas the industries that tend to have a higher number of women are Utilities (100.0%), Educational Services (75.0%), and Retail Trade (72.1%).
| Industry | Male | Female |
| Agriculture, Fishing & Hunting | 0 (0.0%) | 0 (0.0%) |
| Mining, Quarrying, & Extraction | 0 (0.0%) | 0 (0.0%) |
| Construction | 38 (40.9%) | 55 (59.1%) |
| Manufacturing | 16 (47.1%) | 18 (52.9%) |
| Wholesale Trade | 18 (100.0%) | 0 (0.0%) |
| Retail Trade | 96 (27.9%) | 248 (72.1%) |
| Transportation & Warehousing | 40 (100.0%) | 0 (0.0%) |
| Utilities | 0 (0.0%) | 10 (100.0%) |
| Information | 10 (100.0%) | 0 (0.0%) |
| Finance & Insurance | 51 (82.3%) | 11 (17.7%) |
| Real Estate, Rental & Leasing | 5 (41.7%) | 7 (58.3%) |
| Professional & Scientific | 42 (28.8%) | 104 (71.2%) |
| Enterprise Management | 13 (100.0%) | 0 (0.0%) |
| Administrative & Support | 12 (100.0%) | 0 (0.0%) |
| Educational Services | 12 (25.0%) | 36 (75.0%) |
| Health Care & Social Assistance | 48 (36.6%) | 83 (63.4%) |
| Arts, Entertainment & Recreation | 57 (86.4%) | 9 (13.6%) |
| Accommodation & Food Services | 27 (38.6%) | 43 (61.4%) |
| Public Administration | 159 (74.0%) | 56 (26.1%) |
| Total | 700 (49.8%) | 706 (50.2%) |
Education in Sunset Beach
School Enrollment in Sunset Beach
The most common levels of schooling among the 269 students in Sunset Beach are college / undergraduate (117 | 43.5%), high school (60 | 22.3%), and nursery / preschool (57 | 21.2%).
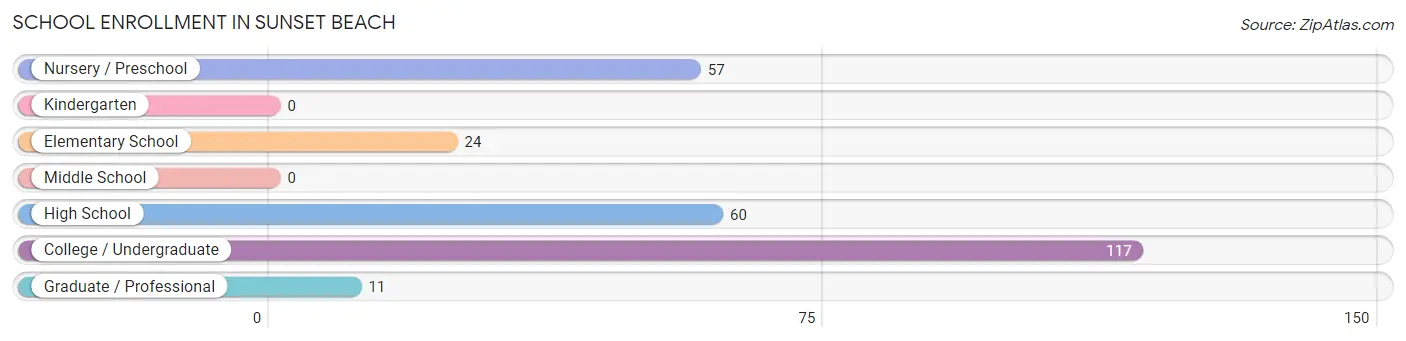
| School Level | # Students | % Students |
| Nursery / Preschool | 57 | 21.2% |
| Kindergarten | 0 | 0.0% |
| Elementary School | 24 | 8.9% |
| Middle School | 0 | 0.0% |
| High School | 60 | 22.3% |
| College / Undergraduate | 117 | 43.5% |
| Graduate / Professional | 11 | 4.1% |
| Total | 269 | 100.0% |
School Enrollment by Age by Funding Source in Sunset Beach
Out of a total of 269 students who are enrolled in schools in Sunset Beach, 30 (11.2%) attend a private institution, while the remaining 239 (88.8%) are enrolled in public schools. The age group of 18 to 19 year olds has the highest likelihood of being enrolled in private schools, with 17 (63.0% in the age bracket) enrolled. Conversely, the age group of 3 to 4 year olds has the lowest likelihood of being enrolled in a private school, with 35 (100.0% in the age bracket) attending a public institution.
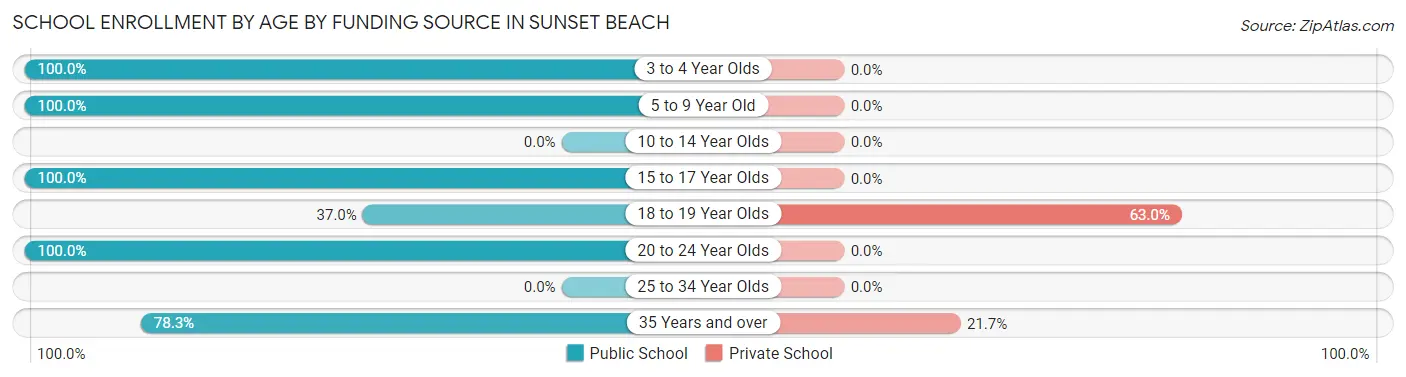
| Age Bracket | Public School | Private School |
| 3 to 4 Year Olds | 35 (100.0%) | 0 (0.0%) |
| 5 to 9 Year Old | 46 (100.0%) | 0 (0.0%) |
| 10 to 14 Year Olds | 0 (0.0%) | 0 (0.0%) |
| 15 to 17 Year Olds | 43 (100.0%) | 0 (0.0%) |
| 18 to 19 Year Olds | 10 (37.0%) | 17 (63.0%) |
| 20 to 24 Year Olds | 58 (100.0%) | 0 (0.0%) |
| 25 to 34 Year Olds | 0 (0.0%) | 0 (0.0%) |
| 35 Years and over | 47 (78.3%) | 13 (21.7%) |
| Total | 239 (88.8%) | 30 (11.2%) |
Educational Attainment by Field of Study in Sunset Beach
Business (365 | 20.7%), education (272 | 15.4%), science & technology (225 | 12.7%), engineering (210 | 11.9%), and social sciences (167 | 9.5%) are the most common fields of study among 1,766 individuals in Sunset Beach who have obtained a bachelor's degree or higher.
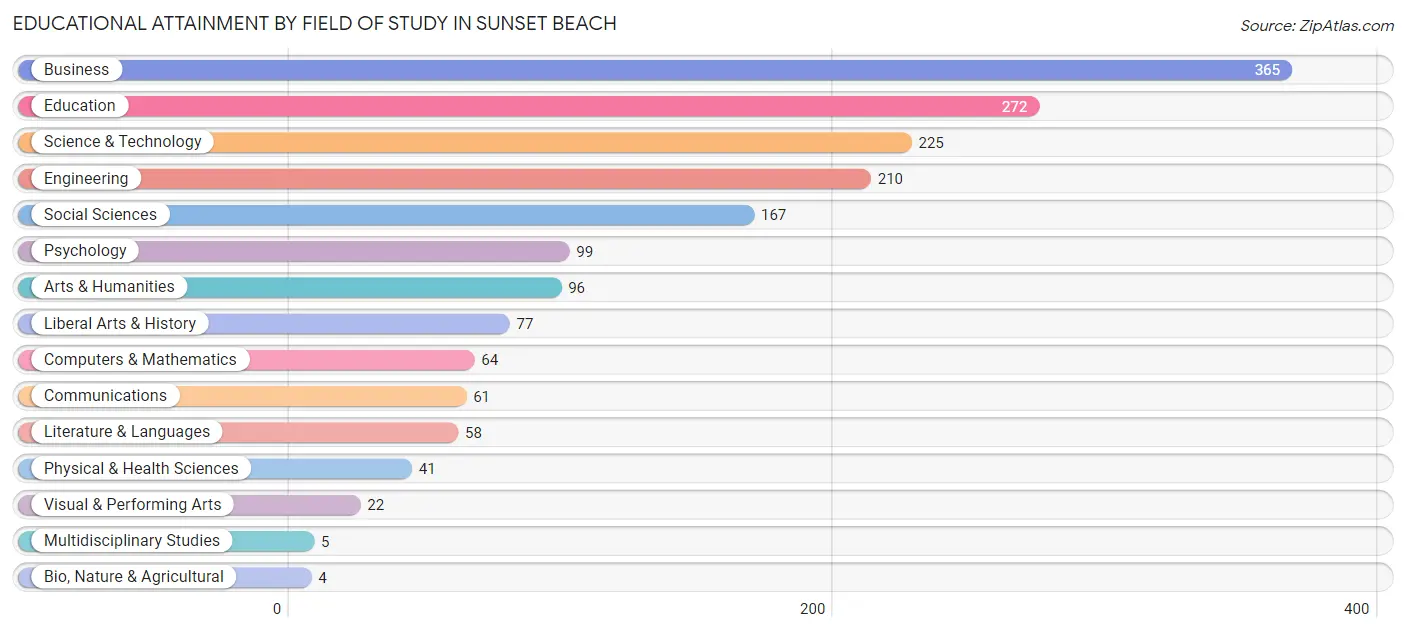
| Field of Study | # Graduates | % Graduates |
| Computers & Mathematics | 64 | 3.6% |
| Bio, Nature & Agricultural | 4 | 0.2% |
| Physical & Health Sciences | 41 | 2.3% |
| Psychology | 99 | 5.6% |
| Social Sciences | 167 | 9.5% |
| Engineering | 210 | 11.9% |
| Multidisciplinary Studies | 5 | 0.3% |
| Science & Technology | 225 | 12.7% |
| Business | 365 | 20.7% |
| Education | 272 | 15.4% |
| Literature & Languages | 58 | 3.3% |
| Liberal Arts & History | 77 | 4.4% |
| Visual & Performing Arts | 22 | 1.3% |
| Communications | 61 | 3.5% |
| Arts & Humanities | 96 | 5.4% |
| Total | 1,766 | 100.0% |
Transportation & Commute in Sunset Beach
Vehicle Availability by Sex in Sunset Beach
The most prevalent vehicle ownership categories in Sunset Beach are males with 2 vehicles (501, accounting for 78.5%) and females with 2 vehicles (361, making up 71.0%).
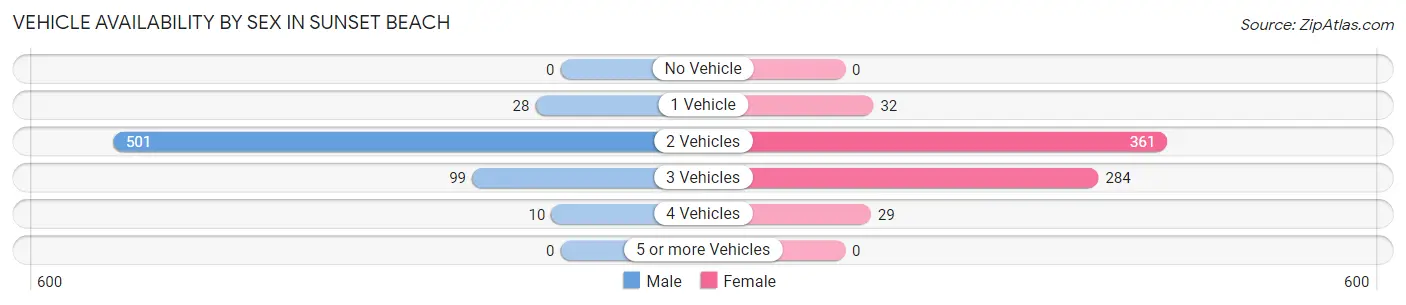
| Vehicles Available | Male | Female |
| No Vehicle | 0 (0.0%) | 0 (0.0%) |
| 1 Vehicle | 28 (4.4%) | 32 (4.5%) |
| 2 Vehicles | 501 (78.5%) | 361 (51.1%) |
| 3 Vehicles | 99 (15.5%) | 284 (40.2%) |
| 4 Vehicles | 10 (1.6%) | 29 (4.1%) |
| 5 or more Vehicles | 0 (0.0%) | 0 (0.0%) |
| Total | 638 (100.0%) | 706 (100.0%) |
Commute Time in Sunset Beach
The most frequently occuring commute durations in Sunset Beach are 20 to 24 minutes (334 commuters, 29.2%), 5 to 9 minutes (201 commuters, 17.5%), and 15 to 19 minutes (191 commuters, 16.7%).
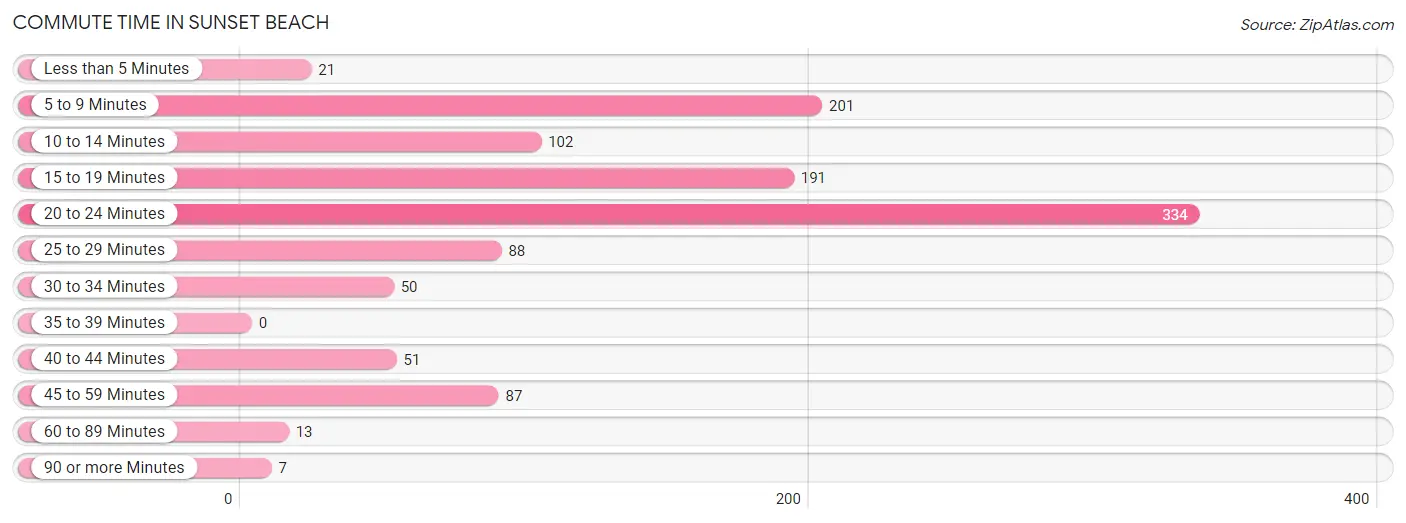
| Commute Time | # Commuters | % Commuters |
| Less than 5 Minutes | 21 | 1.8% |
| 5 to 9 Minutes | 201 | 17.5% |
| 10 to 14 Minutes | 102 | 8.9% |
| 15 to 19 Minutes | 191 | 16.7% |
| 20 to 24 Minutes | 334 | 29.2% |
| 25 to 29 Minutes | 88 | 7.7% |
| 30 to 34 Minutes | 50 | 4.4% |
| 35 to 39 Minutes | 0 | 0.0% |
| 40 to 44 Minutes | 51 | 4.4% |
| 45 to 59 Minutes | 87 | 7.6% |
| 60 to 89 Minutes | 13 | 1.1% |
| 90 or more Minutes | 7 | 0.6% |
Commute Time by Sex in Sunset Beach
The most common commute times in Sunset Beach are 5 to 9 minutes (192 commuters, 40.5%) for males and 20 to 24 minutes (334 commuters, 49.8%) for females.
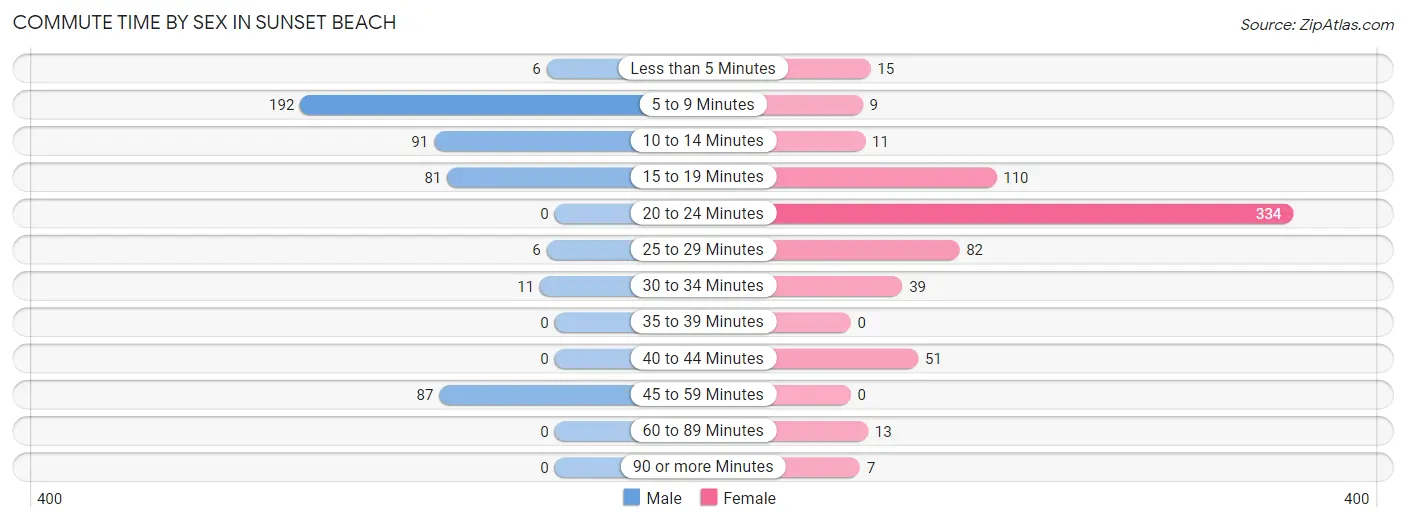
| Commute Time | Male | Female |
| Less than 5 Minutes | 6 (1.3%) | 15 (2.2%) |
| 5 to 9 Minutes | 192 (40.5%) | 9 (1.3%) |
| 10 to 14 Minutes | 91 (19.2%) | 11 (1.6%) |
| 15 to 19 Minutes | 81 (17.1%) | 110 (16.4%) |
| 20 to 24 Minutes | 0 (0.0%) | 334 (49.8%) |
| 25 to 29 Minutes | 6 (1.3%) | 82 (12.2%) |
| 30 to 34 Minutes | 11 (2.3%) | 39 (5.8%) |
| 35 to 39 Minutes | 0 (0.0%) | 0 (0.0%) |
| 40 to 44 Minutes | 0 (0.0%) | 51 (7.6%) |
| 45 to 59 Minutes | 87 (18.3%) | 0 (0.0%) |
| 60 to 89 Minutes | 0 (0.0%) | 13 (1.9%) |
| 90 or more Minutes | 0 (0.0%) | 7 (1.0%) |
Time of Departure to Work by Sex in Sunset Beach
The most frequent times of departure to work in Sunset Beach are 6:00 AM to 6:29 AM (171, 36.1%) for males and 7:30 AM to 7:59 AM (221, 32.9%) for females.
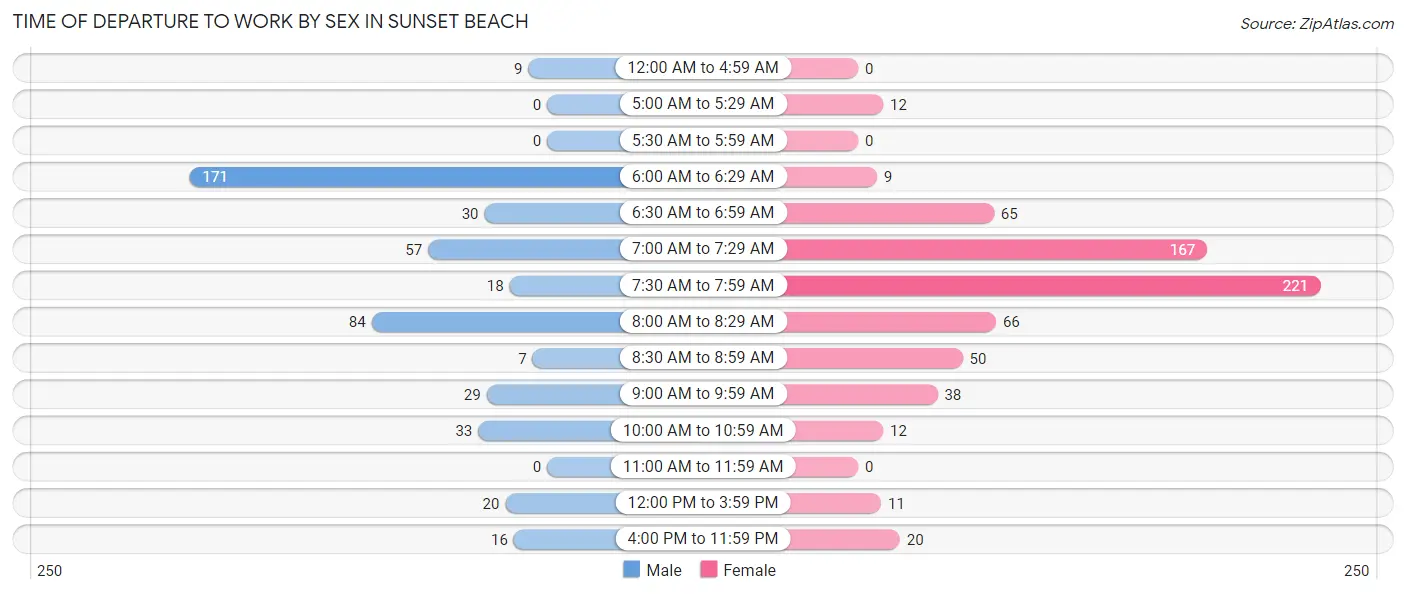
| Time of Departure | Male | Female |
| 12:00 AM to 4:59 AM | 9 (1.9%) | 0 (0.0%) |
| 5:00 AM to 5:29 AM | 0 (0.0%) | 12 (1.8%) |
| 5:30 AM to 5:59 AM | 0 (0.0%) | 0 (0.0%) |
| 6:00 AM to 6:29 AM | 171 (36.1%) | 9 (1.3%) |
| 6:30 AM to 6:59 AM | 30 (6.3%) | 65 (9.7%) |
| 7:00 AM to 7:29 AM | 57 (12.0%) | 167 (24.9%) |
| 7:30 AM to 7:59 AM | 18 (3.8%) | 221 (32.9%) |
| 8:00 AM to 8:29 AM | 84 (17.7%) | 66 (9.8%) |
| 8:30 AM to 8:59 AM | 7 (1.5%) | 50 (7.4%) |
| 9:00 AM to 9:59 AM | 29 (6.1%) | 38 (5.7%) |
| 10:00 AM to 10:59 AM | 33 (7.0%) | 12 (1.8%) |
| 11:00 AM to 11:59 AM | 0 (0.0%) | 0 (0.0%) |
| 12:00 PM to 3:59 PM | 20 (4.2%) | 11 (1.6%) |
| 4:00 PM to 11:59 PM | 16 (3.4%) | 20 (3.0%) |
| Total | 474 (100.0%) | 671 (100.0%) |
Housing Occupancy in Sunset Beach
Occupancy by Ownership in Sunset Beach
Of the total 2,289 dwellings in Sunset Beach, owner-occupied units account for 1,966 (85.9%), while renter-occupied units make up 323 (14.1%).
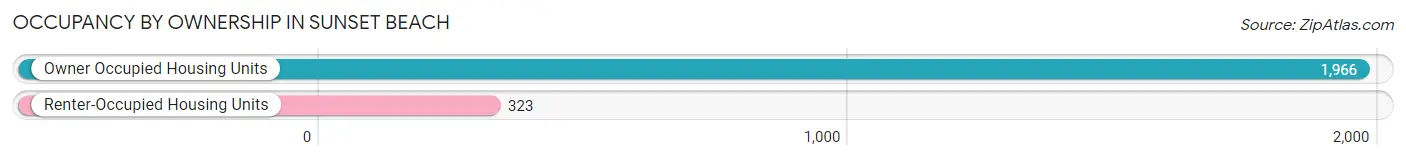
| Occupancy | # Housing Units | % Housing Units |
| Owner Occupied Housing Units | 1,966 | 85.9% |
| Renter-Occupied Housing Units | 323 | 14.1% |
| Total Occupied Housing Units | 2,289 | 100.0% |
Occupancy by Household Size in Sunset Beach
| Household Size | # Housing Units | % Housing Units |
| 1-Person Household | 890 | 38.9% |
| 2-Person Household | 1,188 | 51.9% |
| 3-Person Household | 184 | 8.0% |
| 4+ Person Household | 27 | 1.2% |
| Total Housing Units | 2,289 | 100.0% |
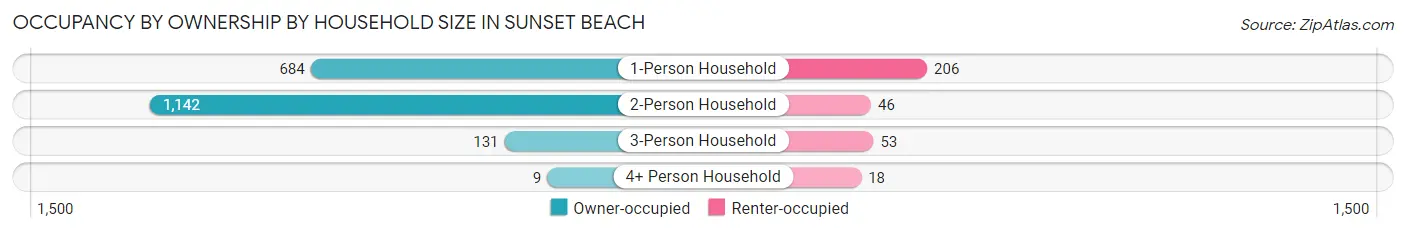
Occupancy by Ownership by Household Size in Sunset Beach
| Household Size | Owner-occupied | Renter-occupied |
| 1-Person Household | 684 (76.8%) | 206 (23.2%) |
| 2-Person Household | 1,142 (96.1%) | 46 (3.9%) |
| 3-Person Household | 131 (71.2%) | 53 (28.8%) |
| 4+ Person Household | 9 (33.3%) | 18 (66.7%) |
| Total Housing Units | 1,966 (85.9%) | 323 (14.1%) |
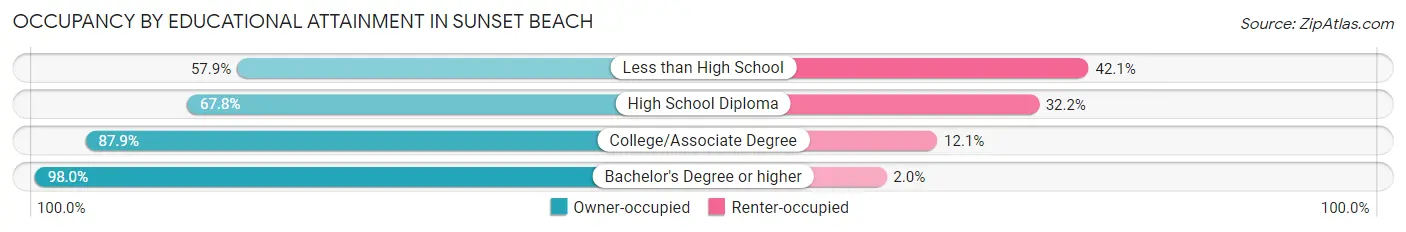
Occupancy by Educational Attainment in Sunset Beach
| Household Size | Owner-occupied | Renter-occupied |
| Less than High School | 11 (57.9%) | 8 (42.1%) |
| High School Diploma | 488 (67.8%) | 232 (32.2%) |
| College/Associate Degree | 451 (87.9%) | 62 (12.1%) |
| Bachelor's Degree or higher | 1,016 (98.0%) | 21 (2.0%) |
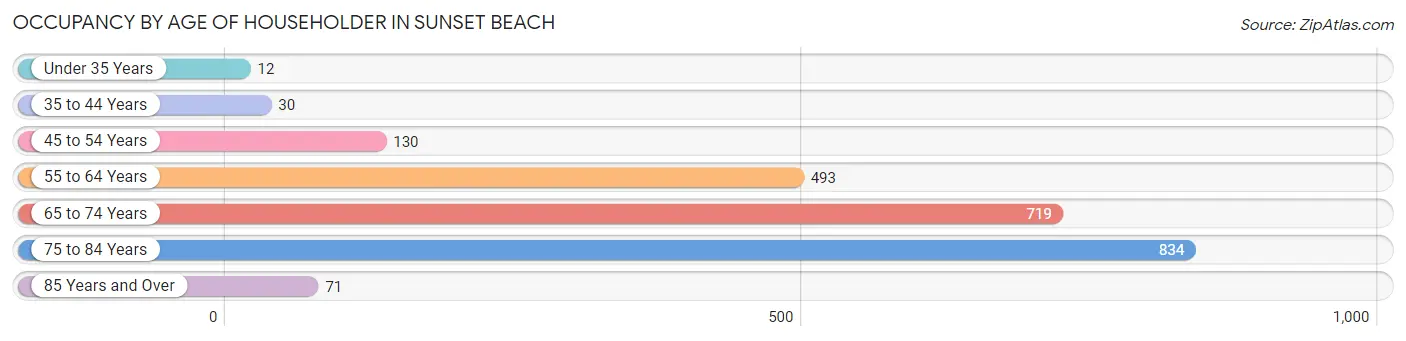
Occupancy by Age of Householder in Sunset Beach
| Age Bracket | # Households | % Households |
| Under 35 Years | 12 | 0.5% |
| 35 to 44 Years | 30 | 1.3% |
| 45 to 54 Years | 130 | 5.7% |
| 55 to 64 Years | 493 | 21.5% |
| 65 to 74 Years | 719 | 31.4% |
| 75 to 84 Years | 834 | 36.4% |
| 85 Years and Over | 71 | 3.1% |
| Total | 2,289 | 100.0% |
Housing Finances in Sunset Beach
Median Income by Occupancy in Sunset Beach
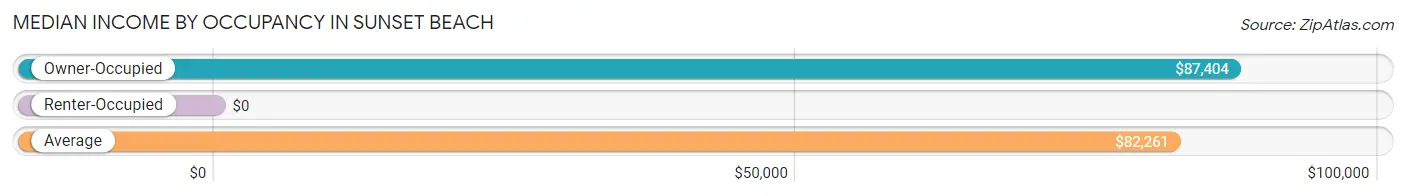
| Occupancy Type | # Households | Median Income |
| Owner-Occupied | 1,966 (85.9%) | $87,404 |
| Renter-Occupied | 323 (14.1%) | $0 |
| Average | 2,289 (100.0%) | $82,261 |
Occupancy by Householder Income Bracket in Sunset Beach
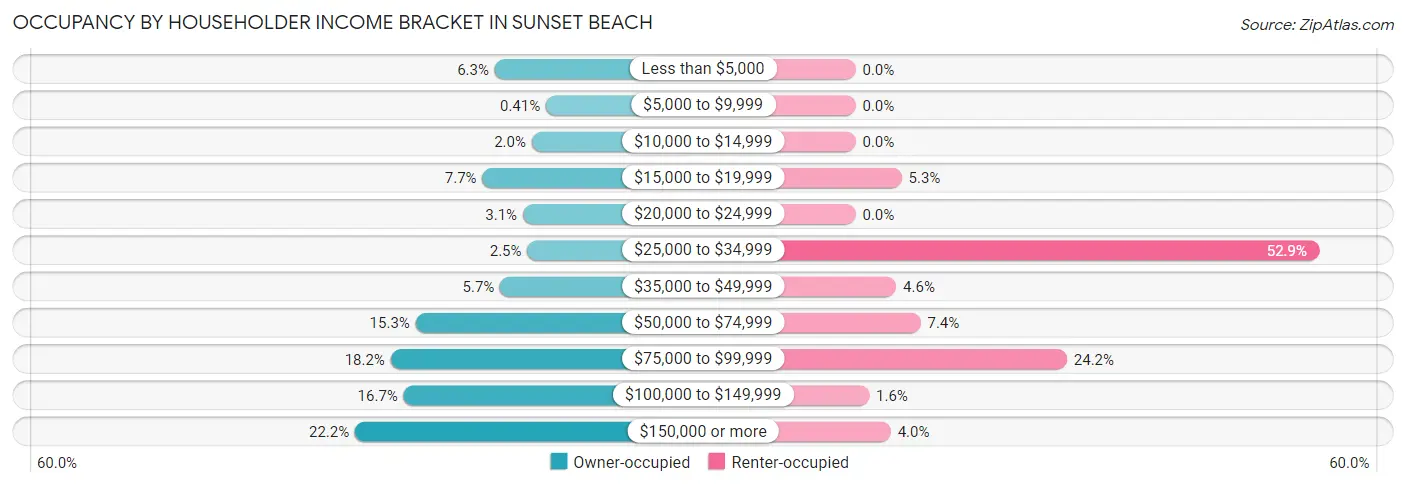
| Income Bracket | Owner-occupied | Renter-occupied |
| Less than $5,000 | 123 (6.3%) | 0 (0.0%) |
| $5,000 to $9,999 | 8 (0.4%) | 0 (0.0%) |
| $10,000 to $14,999 | 40 (2.0%) | 0 (0.0%) |
| $15,000 to $19,999 | 151 (7.7%) | 17 (5.3%) |
| $20,000 to $24,999 | 60 (3.0%) | 0 (0.0%) |
| $25,000 to $34,999 | 50 (2.5%) | 171 (52.9%) |
| $35,000 to $49,999 | 111 (5.7%) | 15 (4.6%) |
| $50,000 to $74,999 | 301 (15.3%) | 24 (7.4%) |
| $75,000 to $99,999 | 357 (18.2%) | 78 (24.1%) |
| $100,000 to $149,999 | 328 (16.7%) | 5 (1.5%) |
| $150,000 or more | 437 (22.2%) | 13 (4.0%) |
| Total | 1,966 (100.0%) | 323 (100.0%) |
Monthly Housing Cost Tiers in Sunset Beach
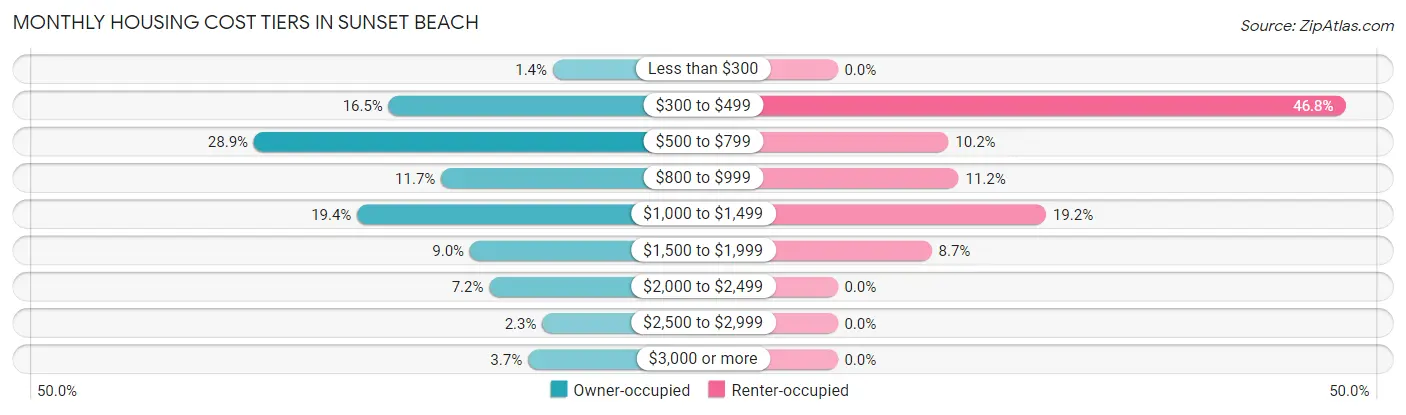
| Monthly Cost | Owner-occupied | Renter-occupied |
| Less than $300 | 27 (1.4%) | 0 (0.0%) |
| $300 to $499 | 324 (16.5%) | 151 (46.8%) |
| $500 to $799 | 568 (28.9%) | 33 (10.2%) |
| $800 to $999 | 229 (11.7%) | 36 (11.2%) |
| $1,000 to $1,499 | 381 (19.4%) | 62 (19.2%) |
| $1,500 to $1,999 | 177 (9.0%) | 28 (8.7%) |
| $2,000 to $2,499 | 142 (7.2%) | 0 (0.0%) |
| $2,500 to $2,999 | 46 (2.3%) | 0 (0.0%) |
| $3,000 or more | 72 (3.7%) | 0 (0.0%) |
| Total | 1,966 (100.0%) | 323 (100.0%) |
Physical Housing Characteristics in Sunset Beach
Housing Structures in Sunset Beach
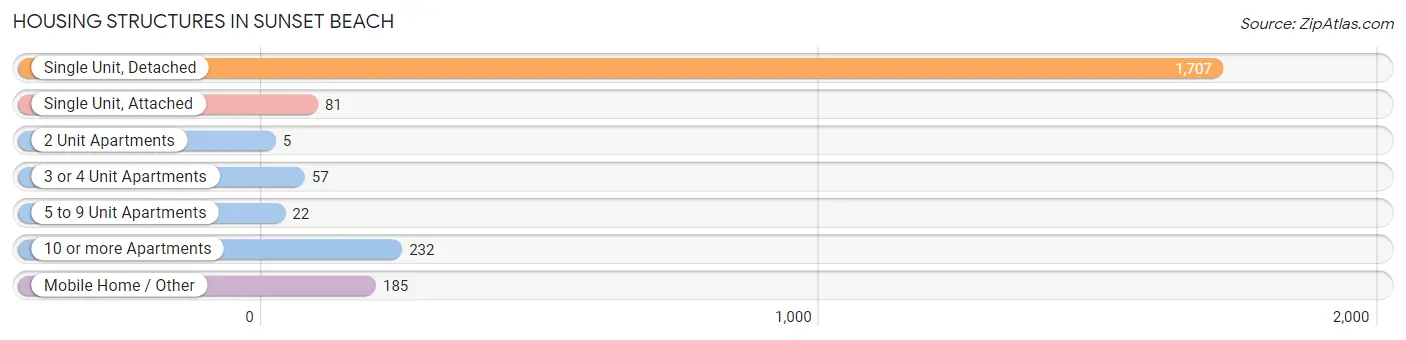
| Structure Type | # Housing Units | % Housing Units |
| Single Unit, Detached | 1,707 | 74.6% |
| Single Unit, Attached | 81 | 3.5% |
| 2 Unit Apartments | 5 | 0.2% |
| 3 or 4 Unit Apartments | 57 | 2.5% |
| 5 to 9 Unit Apartments | 22 | 1.0% |
| 10 or more Apartments | 232 | 10.1% |
| Mobile Home / Other | 185 | 8.1% |
| Total | 2,289 | 100.0% |
Housing Structures by Occupancy in Sunset Beach
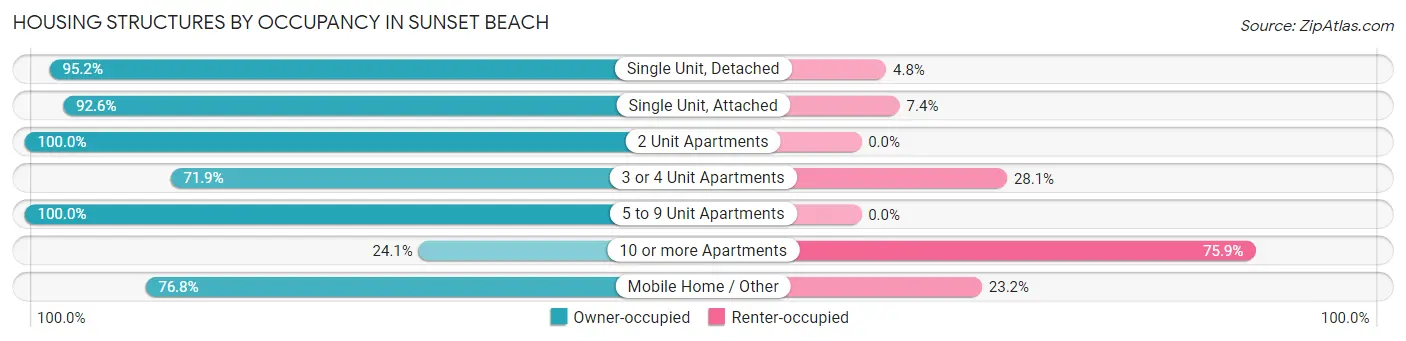
| Structure Type | Owner-occupied | Renter-occupied |
| Single Unit, Detached | 1,625 (95.2%) | 82 (4.8%) |
| Single Unit, Attached | 75 (92.6%) | 6 (7.4%) |
| 2 Unit Apartments | 5 (100.0%) | 0 (0.0%) |
| 3 or 4 Unit Apartments | 41 (71.9%) | 16 (28.1%) |
| 5 to 9 Unit Apartments | 22 (100.0%) | 0 (0.0%) |
| 10 or more Apartments | 56 (24.1%) | 176 (75.9%) |
| Mobile Home / Other | 142 (76.8%) | 43 (23.2%) |
| Total | 1,966 (85.9%) | 323 (14.1%) |
Housing Structures by Number of Rooms in Sunset Beach
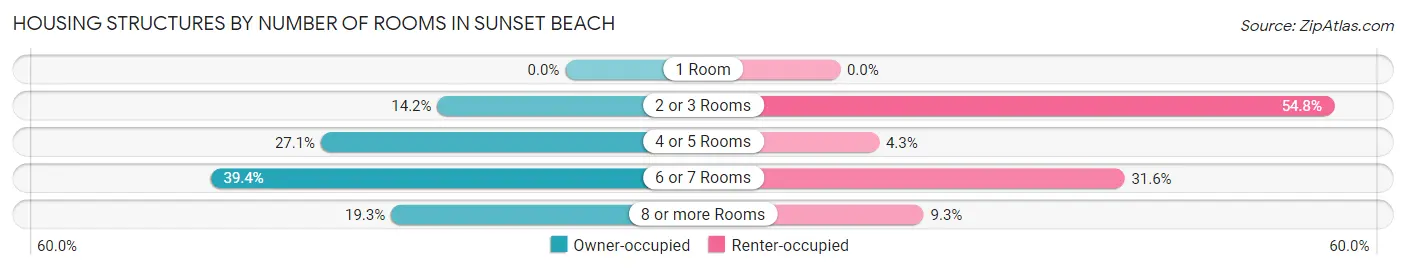
| Number of Rooms | Owner-occupied | Renter-occupied |
| 1 Room | 0 (0.0%) | 0 (0.0%) |
| 2 or 3 Rooms | 279 (14.2%) | 177 (54.8%) |
| 4 or 5 Rooms | 533 (27.1%) | 14 (4.3%) |
| 6 or 7 Rooms | 774 (39.4%) | 102 (31.6%) |
| 8 or more Rooms | 380 (19.3%) | 30 (9.3%) |
| Total | 1,966 (100.0%) | 323 (100.0%) |
Housing Structure by Heating Type in Sunset Beach
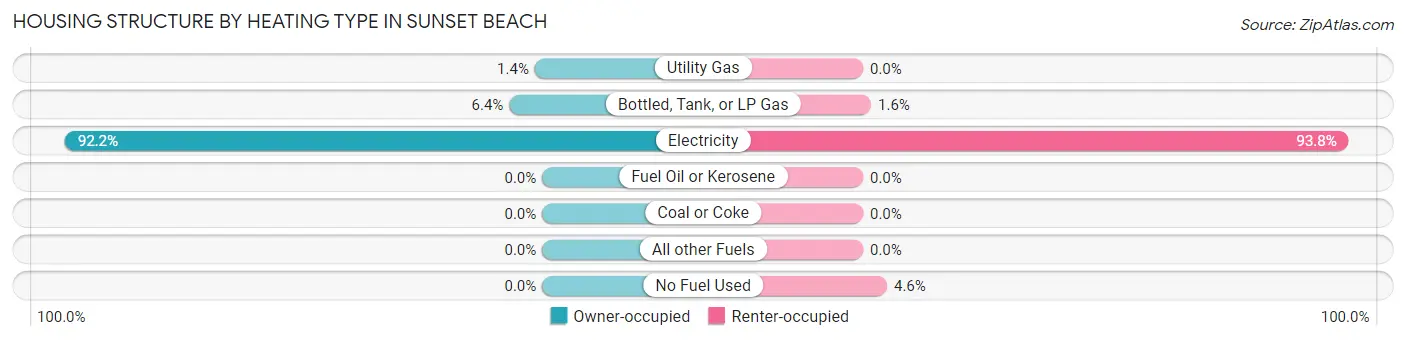
| Heating Type | Owner-occupied | Renter-occupied |
| Utility Gas | 28 (1.4%) | 0 (0.0%) |
| Bottled, Tank, or LP Gas | 125 (6.4%) | 5 (1.5%) |
| Electricity | 1,813 (92.2%) | 303 (93.8%) |
| Fuel Oil or Kerosene | 0 (0.0%) | 0 (0.0%) |
| Coal or Coke | 0 (0.0%) | 0 (0.0%) |
| All other Fuels | 0 (0.0%) | 0 (0.0%) |
| No Fuel Used | 0 (0.0%) | 15 (4.6%) |
| Total | 1,966 (100.0%) | 323 (100.0%) |
Household Vehicle Usage in Sunset Beach
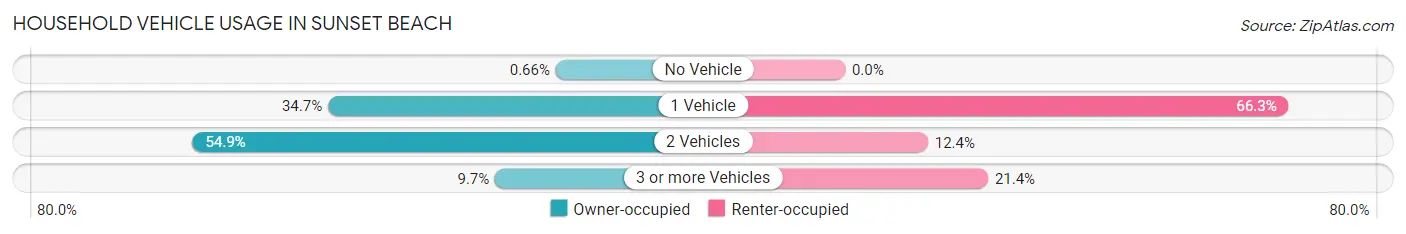
| Vehicles per Household | Owner-occupied | Renter-occupied |
| No Vehicle | 13 (0.7%) | 0 (0.0%) |
| 1 Vehicle | 682 (34.7%) | 214 (66.2%) |
| 2 Vehicles | 1,080 (54.9%) | 40 (12.4%) |
| 3 or more Vehicles | 191 (9.7%) | 69 (21.4%) |
| Total | 1,966 (100.0%) | 323 (100.0%) |
Real Estate & Mortgages in Sunset Beach
Real Estate and Mortgage Overview in Sunset Beach
| Characteristic | Without Mortgage | With Mortgage |
| Housing Units | 1,072 | 894 |
| Median Property Value | $334,800 | $331,300 |
| Median Household Income | $61,111 | $208 |
| Monthly Housing Costs | $572 | $72 |
| Real Estate Taxes | $1,948 | $0 |
Property Value by Mortgage Status in Sunset Beach
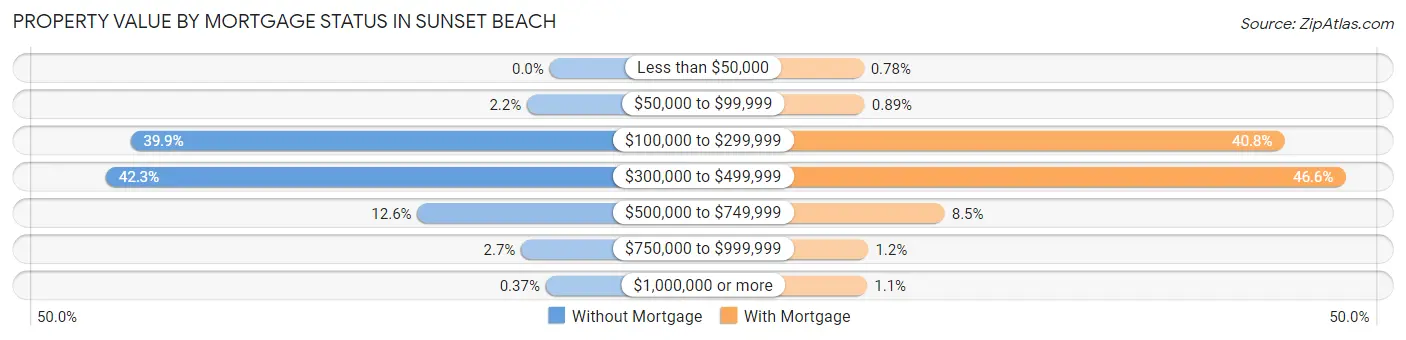
| Property Value | Without Mortgage | With Mortgage |
| Less than $50,000 | 0 (0.0%) | 7 (0.8%) |
| $50,000 to $99,999 | 23 (2.1%) | 8 (0.9%) |
| $100,000 to $299,999 | 428 (39.9%) | 365 (40.8%) |
| $300,000 to $499,999 | 453 (42.3%) | 417 (46.6%) |
| $500,000 to $749,999 | 135 (12.6%) | 76 (8.5%) |
| $750,000 to $999,999 | 29 (2.7%) | 11 (1.2%) |
| $1,000,000 or more | 4 (0.4%) | 10 (1.1%) |
| Total | 1,072 (100.0%) | 894 (100.0%) |
Household Income by Mortgage Status in Sunset Beach
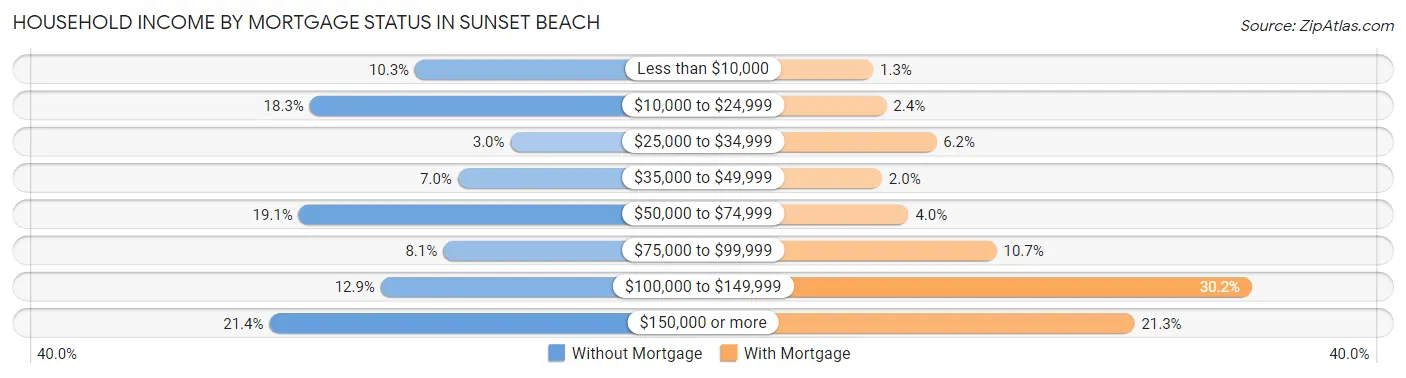
| Household Income | Without Mortgage | With Mortgage |
| Less than $10,000 | 110 (10.3%) | 12 (1.3%) |
| $10,000 to $24,999 | 196 (18.3%) | 21 (2.4%) |
| $25,000 to $34,999 | 32 (3.0%) | 55 (6.1%) |
| $35,000 to $49,999 | 75 (7.0%) | 18 (2.0%) |
| $50,000 to $74,999 | 205 (19.1%) | 36 (4.0%) |
| $75,000 to $99,999 | 87 (8.1%) | 96 (10.7%) |
| $100,000 to $149,999 | 138 (12.9%) | 270 (30.2%) |
| $150,000 or more | 229 (21.4%) | 190 (21.2%) |
| Total | 1,072 (100.0%) | 894 (100.0%) |
Property Value to Household Income Ratio in Sunset Beach
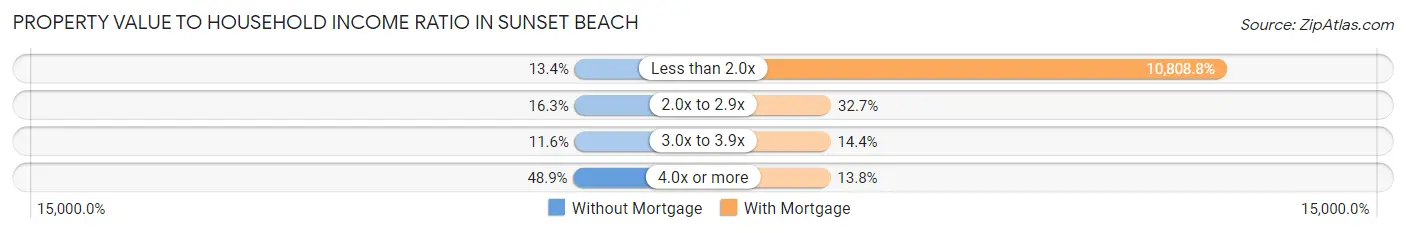
| Value-to-Income Ratio | Without Mortgage | With Mortgage |
| Less than 2.0x | 144 (13.4%) | 96,631 (10,808.8%) |
| 2.0x to 2.9x | 175 (16.3%) | 292 (32.7%) |
| 3.0x to 3.9x | 124 (11.6%) | 129 (14.4%) |
| 4.0x or more | 524 (48.9%) | 123 (13.8%) |
| Total | 1,072 (100.0%) | 894 (100.0%) |
Real Estate Taxes by Mortgage Status in Sunset Beach
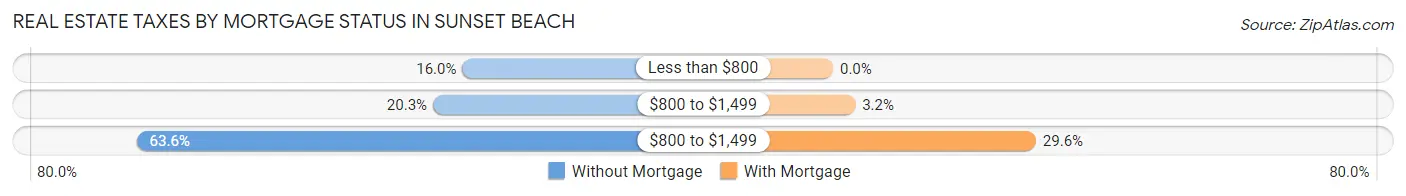
| Property Taxes | Without Mortgage | With Mortgage |
| Less than $800 | 172 (16.0%) | 0 (0.0%) |
| $800 to $1,499 | 218 (20.3%) | 29 (3.2%) |
| $800 to $1,499 | 682 (63.6%) | 265 (29.6%) |
| Total | 1,072 (100.0%) | 894 (100.0%) |
Health & Disability in Sunset Beach
Health Insurance Coverage by Age in Sunset Beach
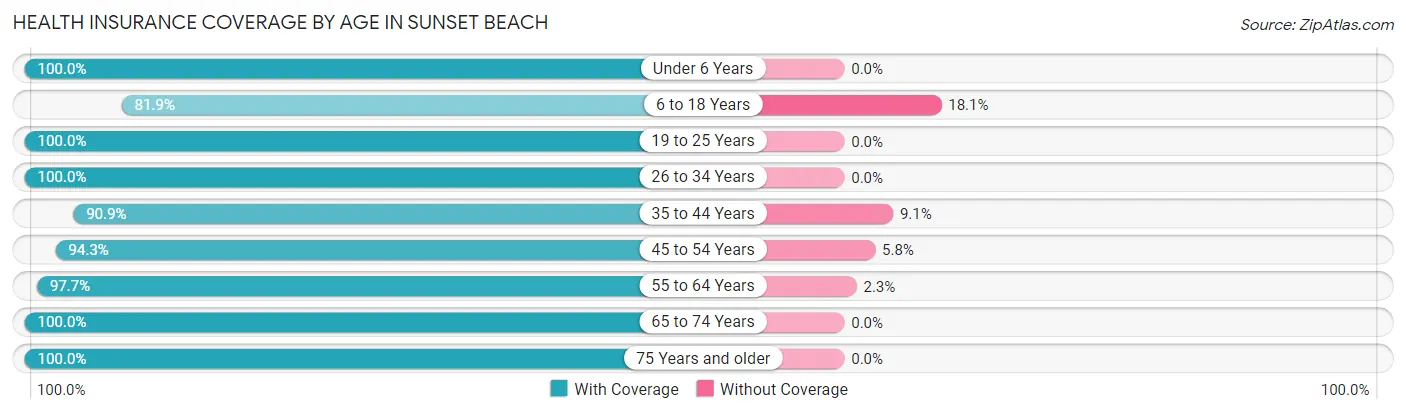
| Age Bracket | With Coverage | Without Coverage |
| Under 6 Years | 69 (100.0%) | 0 (0.0%) |
| 6 to 18 Years | 77 (81.9%) | 17 (18.1%) |
| 19 to 25 Years | 88 (100.0%) | 0 (0.0%) |
| 26 to 34 Years | 99 (100.0%) | 0 (0.0%) |
| 35 to 44 Years | 351 (90.9%) | 35 (9.1%) |
| 45 to 54 Years | 246 (94.3%) | 15 (5.8%) |
| 55 to 64 Years | 857 (97.7%) | 20 (2.3%) |
| 65 to 74 Years | 1,057 (100.0%) | 0 (0.0%) |
| 75 Years and older | 1,258 (100.0%) | 0 (0.0%) |
| Total | 4,102 (97.9%) | 87 (2.1%) |
Health Insurance Coverage by Citizenship Status in Sunset Beach
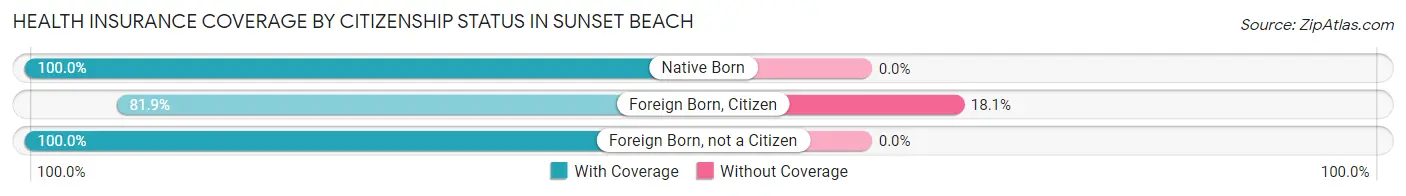
| Citizenship Status | With Coverage | Without Coverage |
| Native Born | 69 (100.0%) | 0 (0.0%) |
| Foreign Born, Citizen | 77 (81.9%) | 17 (18.1%) |
| Foreign Born, not a Citizen | 88 (100.0%) | 0 (0.0%) |
Health Insurance Coverage by Household Income in Sunset Beach
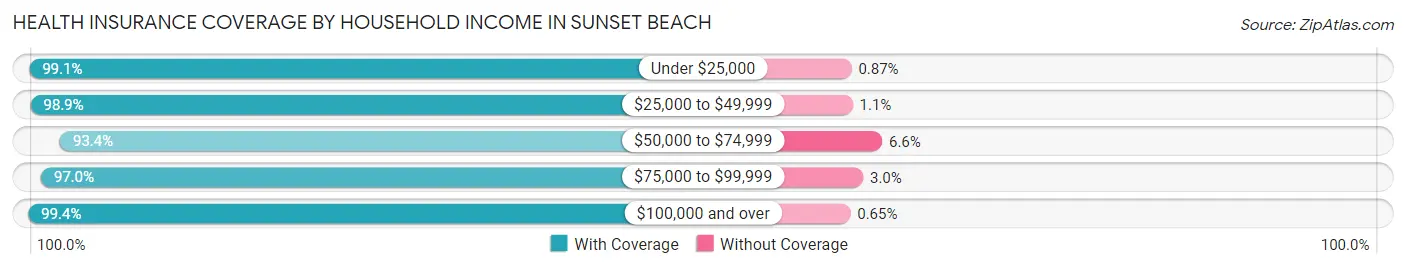
| Household Income | With Coverage | Without Coverage |
| Under $25,000 | 455 (99.1%) | 4 (0.9%) |
| $25,000 to $49,999 | 453 (98.9%) | 5 (1.1%) |
| $50,000 to $74,999 | 495 (93.4%) | 35 (6.6%) |
| $75,000 to $99,999 | 1,021 (97.0%) | 32 (3.0%) |
| $100,000 and over | 1,678 (99.4%) | 11 (0.6%) |
Public vs Private Health Insurance Coverage by Age in Sunset Beach
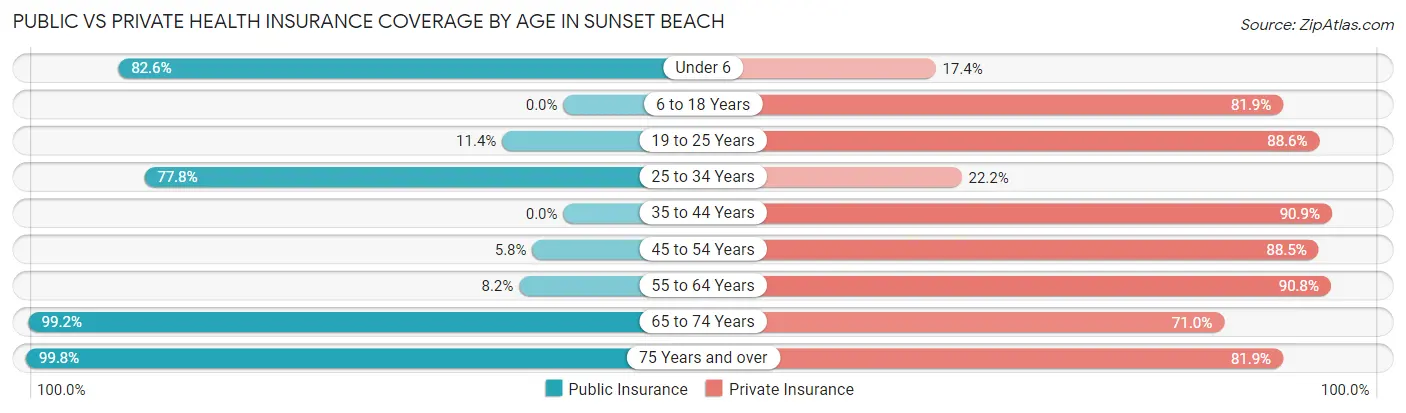
| Age Bracket | Public Insurance | Private Insurance |
| Under 6 | 57 (82.6%) | 12 (17.4%) |
| 6 to 18 Years | 0 (0.0%) | 77 (81.9%) |
| 19 to 25 Years | 10 (11.4%) | 78 (88.6%) |
| 25 to 34 Years | 77 (77.8%) | 22 (22.2%) |
| 35 to 44 Years | 0 (0.0%) | 351 (90.9%) |
| 45 to 54 Years | 15 (5.8%) | 231 (88.5%) |
| 55 to 64 Years | 72 (8.2%) | 796 (90.8%) |
| 65 to 74 Years | 1,049 (99.2%) | 750 (71.0%) |
| 75 Years and over | 1,255 (99.8%) | 1,030 (81.9%) |
| Total | 2,535 (60.5%) | 3,347 (79.9%) |
Disability Status by Sex by Age in Sunset Beach
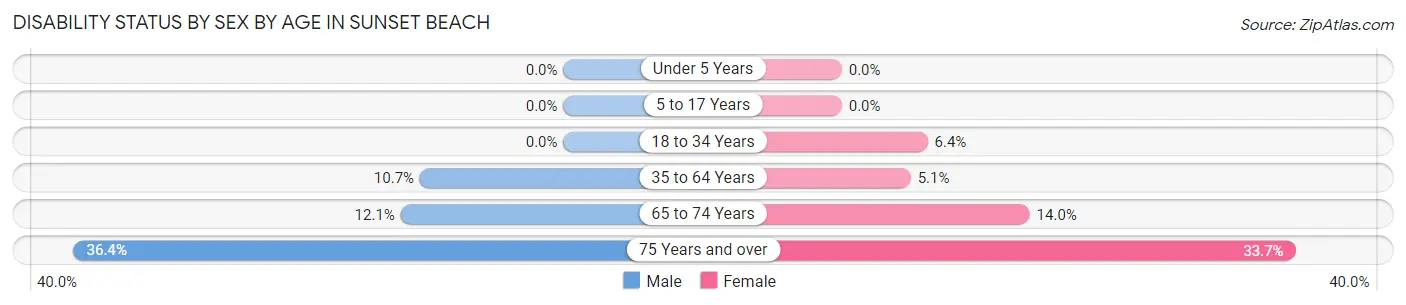
| Age Bracket | Male | Female |
| Under 5 Years | 0 (0.0%) | 0 (0.0%) |
| 5 to 17 Years | 0 (0.0%) | 0 (0.0%) |
| 18 to 34 Years | 0 (0.0%) | 10 (6.4%) |
| 35 to 64 Years | 75 (10.6%) | 42 (5.1%) |
| 65 to 74 Years | 61 (12.1%) | 77 (14.0%) |
| 75 Years and over | 140 (36.4%) | 294 (33.7%) |
Disability Class by Sex by Age in Sunset Beach
Disability Class: Hearing Difficulty
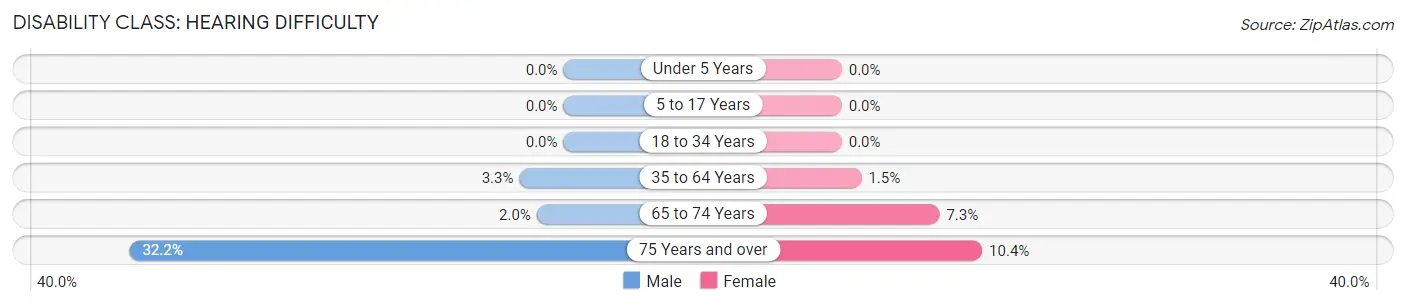
| Age Bracket | Male | Female |
| Under 5 Years | 0 (0.0%) | 0 (0.0%) |
| 5 to 17 Years | 0 (0.0%) | 0 (0.0%) |
| 18 to 34 Years | 0 (0.0%) | 0 (0.0%) |
| 35 to 64 Years | 23 (3.3%) | 12 (1.5%) |
| 65 to 74 Years | 10 (2.0%) | 40 (7.2%) |
| 75 Years and over | 124 (32.2%) | 91 (10.4%) |
Disability Class: Vision Difficulty
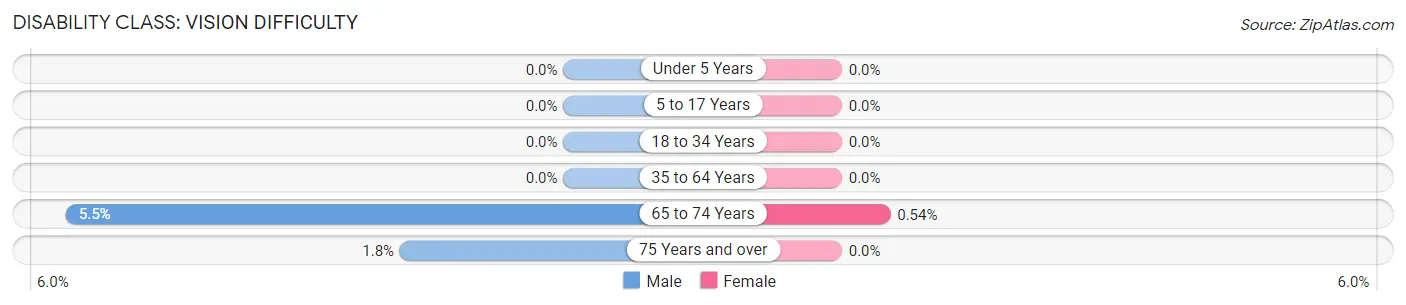
| Age Bracket | Male | Female |
| Under 5 Years | 0 (0.0%) | 0 (0.0%) |
| 5 to 17 Years | 0 (0.0%) | 0 (0.0%) |
| 18 to 34 Years | 0 (0.0%) | 0 (0.0%) |
| 35 to 64 Years | 0 (0.0%) | 0 (0.0%) |
| 65 to 74 Years | 28 (5.5%) | 3 (0.5%) |
| 75 Years and over | 7 (1.8%) | 0 (0.0%) |
Disability Class: Cognitive Difficulty
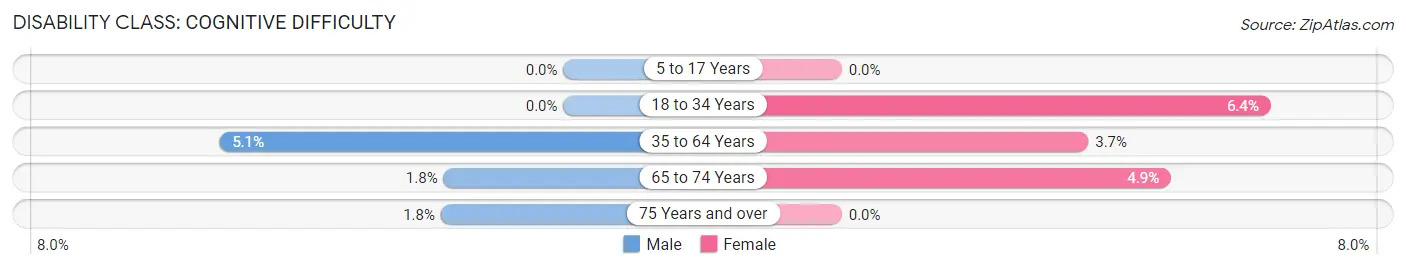
| Age Bracket | Male | Female |
| 5 to 17 Years | 0 (0.0%) | 0 (0.0%) |
| 18 to 34 Years | 0 (0.0%) | 10 (6.4%) |
| 35 to 64 Years | 36 (5.1%) | 30 (3.7%) |
| 65 to 74 Years | 9 (1.8%) | 27 (4.9%) |
| 75 Years and over | 7 (1.8%) | 0 (0.0%) |
Disability Class: Ambulatory Difficulty
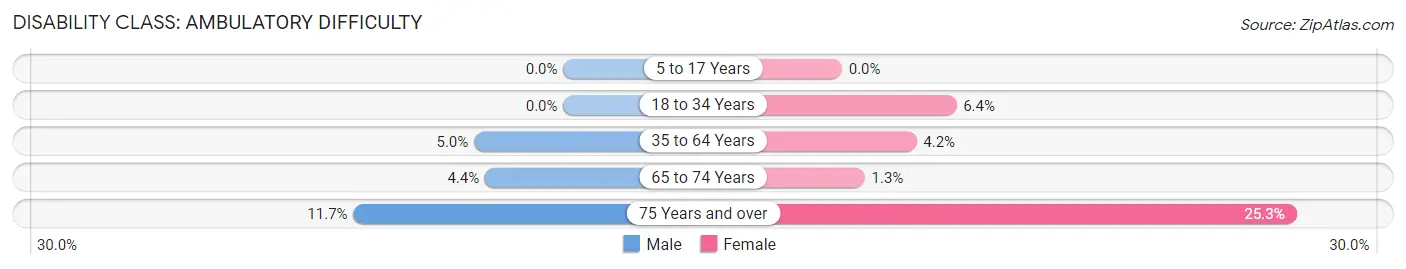
| Age Bracket | Male | Female |
| 5 to 17 Years | 0 (0.0%) | 0 (0.0%) |
| 18 to 34 Years | 0 (0.0%) | 10 (6.4%) |
| 35 to 64 Years | 35 (5.0%) | 34 (4.2%) |
| 65 to 74 Years | 22 (4.4%) | 7 (1.3%) |
| 75 Years and over | 45 (11.7%) | 221 (25.3%) |
Disability Class: Self-Care Difficulty
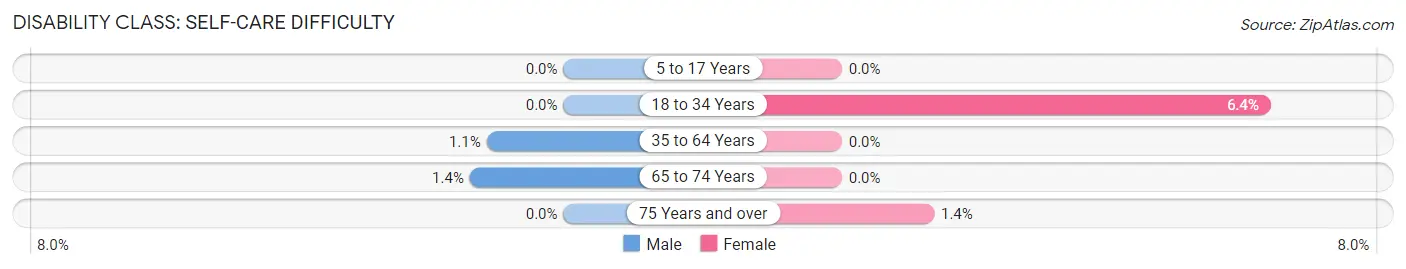
| Age Bracket | Male | Female |
| 5 to 17 Years | 0 (0.0%) | 0 (0.0%) |
| 18 to 34 Years | 0 (0.0%) | 10 (6.4%) |
| 35 to 64 Years | 8 (1.1%) | 0 (0.0%) |
| 65 to 74 Years | 7 (1.4%) | 0 (0.0%) |
| 75 Years and over | 0 (0.0%) | 12 (1.4%) |
Technology Access in Sunset Beach
Computing Device Access in Sunset Beach
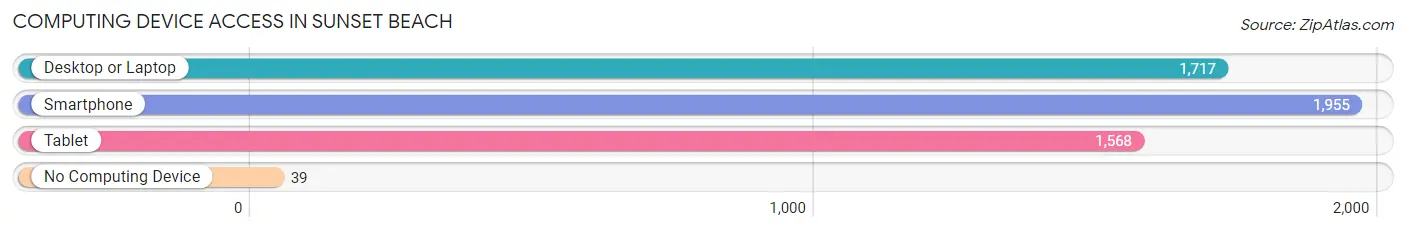
| Device Type | # Households | % Households |
| Desktop or Laptop | 1,717 | 75.0% |
| Smartphone | 1,955 | 85.4% |
| Tablet | 1,568 | 68.5% |
| No Computing Device | 39 | 1.7% |
| Total | 2,289 | 100.0% |
Internet Access in Sunset Beach
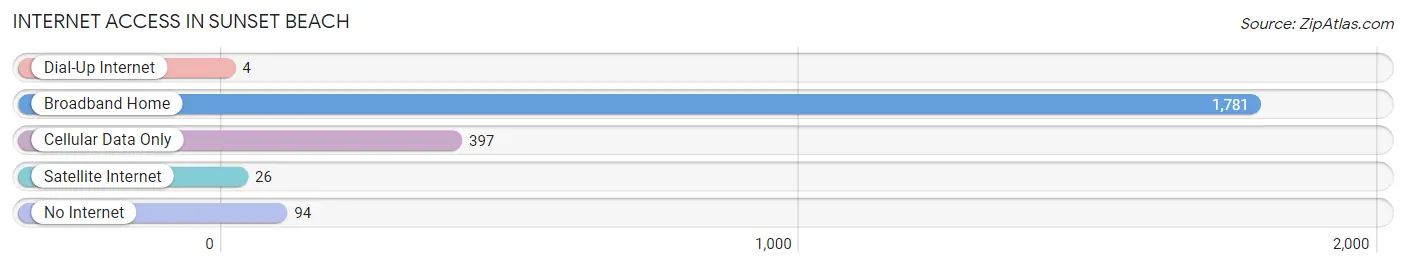
| Internet Type | # Households | % Households |
| Dial-Up Internet | 4 | 0.2% |
| Broadband Home | 1,781 | 77.8% |
| Cellular Data Only | 397 | 17.3% |
| Satellite Internet | 26 | 1.1% |
| No Internet | 94 | 4.1% |
| Total | 2,289 | 100.0% |
Sunset Beach Summary
Sunset Beach is a small town located in Brunswick County, North Carolina. It is situated on the southernmost tip of the state, just south of the North Carolina-South Carolina border. The town is bordered by the Atlantic Ocean to the east, the Intracoastal Waterway to the west, and the Cape Fear River to the north. The town is known for its beautiful beaches, fishing, and golfing.
Geography
Sunset Beach is located on the southernmost tip of North Carolina, just south of the North Carolina-South Carolina border. The town is bordered by the Atlantic Ocean to the east, the Intracoastal Waterway to the west, and the Cape Fear River to the north. The town is situated on a barrier island, which is separated from the mainland by a series of canals and marshes. The town is approximately 4.5 miles long and 0.5 miles wide. The town is divided into two distinct sections, the north end and the south end. The north end is home to the town’s commercial district, while the south end is home to the residential area.
The town is known for its beautiful beaches, which are made up of white sand and crystal clear waters. The beaches are popular for swimming, sunbathing, and fishing. The town also has several golf courses, including the Sea Trail Golf Resort and the Ocean Ridge Plantation.
Economy
Sunset Beach is a popular tourist destination, and the town’s economy is largely dependent on tourism. The town is home to several hotels, restaurants, and shops, which cater to tourists. The town also has several marinas, which offer boat rentals and fishing charters.
The town is also home to several manufacturing companies, including a boat manufacturing plant and a seafood processing plant. The town is also home to several small businesses, including a grocery store, a hardware store, and a pharmacy.
Demographics
As of the 2010 census, the population of Sunset Beach was 2,817. The population is predominantly white (94.3%), with a small percentage of African Americans (2.3%) and Hispanics (2.2%). The median household income is $50,945, and the median age is 48.
The town is home to several churches, including the First Baptist Church of Sunset Beach, the Sunset Beach United Methodist Church, and the St. John’s Episcopal Church. The town is also home to several schools, including the Sunset Beach Elementary School, the Sunset Beach Middle School, and the Brunswick County Academy.
Conclusion
Sunset Beach is a small town located in Brunswick County, North Carolina. It is situated on the southernmost tip of the state, just south of the North Carolina-South Carolina border. The town is known for its beautiful beaches, fishing, and golfing. The town’s economy is largely dependent on tourism, and the town is home to several hotels, restaurants, and shops. The population of Sunset Beach is predominantly white, with a small percentage of African Americans and Hispanics. The town is home to several churches and schools, and is a popular tourist destination.
Common Questions
What is Per Capita Income in Sunset Beach?
Per Capita income in Sunset Beach is $54,410.
What is the Median Family Income in Sunset Beach?
Median Family Income in Sunset Beach is $96,498.
What is the Median Household income in Sunset Beach?
Median Household Income in Sunset Beach is $82,261.
What is Income or Wage Gap in Sunset Beach?
Income or Wage Gap in Sunset Beach is 24.9%.
Women in Sunset Beach earn 75.1 cents for every dollar earned by a man.
What is Family Income Deficit in Sunset Beach?
Family Income Deficit in Sunset Beach is $8,203.
Families that are below poverty line in Sunset Beach earn $8,203 less on average than the poverty threshold level.
What is Inequality or Gini Index in Sunset Beach?
Inequality or Gini Index in Sunset Beach is 0.44.
What is the Total Population of Sunset Beach?
Total Population of Sunset Beach is 4,189.
What is the Total Male Population of Sunset Beach?
Total Male Population of Sunset Beach is 1,691.
What is the Total Female Population of Sunset Beach?
Total Female Population of Sunset Beach is 2,498.
What is the Ratio of Males per 100 Females in Sunset Beach?
There are 67.69 Males per 100 Females in Sunset Beach.
What is the Ratio of Females per 100 Males in Sunset Beach?
There are 147.72 Females per 100 Males in Sunset Beach.
What is the Median Population Age in Sunset Beach?
Median Population Age in Sunset Beach is 66.8 Years.
What is the Average Family Size in Sunset Beach
Average Family Size in Sunset Beach is 2.3 People.
What is the Average Household Size in Sunset Beach
Average Household Size in Sunset Beach is 1.8 People.
How Large is the Labor Force in Sunset Beach?
There are 1,466 People in the Labor Forcein in Sunset Beach.
What is the Percentage of People in the Labor Force in Sunset Beach?
35.8% of People are in the Labor Force in Sunset Beach.
What is the Unemployment Rate in Sunset Beach?
Unemployment Rate in Sunset Beach is 4.0%.