Southport, NC Map & Demographics
Southport Map
Southport Overview
$42,236
PER CAPITA INCOME
$89,044
AVG FAMILY INCOME
$78,287
AVG HOUSEHOLD INCOME
7.6%
WAGE / INCOME GAP [ % ]
92.4¢/ $1
WAGE / INCOME GAP [ $ ]
0.40
INEQUALITY / GINI INDEX
4,015
TOTAL POPULATION
1,870
MALE POPULATION
2,145
FEMALE POPULATION
87.18
MALES / 100 FEMALES
114.71
FEMALES / 100 MALES
61.4
MEDIAN AGE
2.5
AVG FAMILY SIZE
2.2
AVG HOUSEHOLD SIZE
1,542
LABOR FORCE [ PEOPLE ]
44.4%
PERCENT IN LABOR FORCE
0.8%
UNEMPLOYMENT RATE
Southport Zip Codes
Southport Area Codes
Income in Southport
Income Overview in Southport
Per Capita Income in Southport is $42,236, while median incomes of families and households are $89,044 and $78,287 respectively.
| Characteristic | Number | Measure |
| Per Capita Income | 4,015 | $42,236 |
| Median Family Income | 1,277 | $89,044 |
| Mean Family Income | 1,277 | $102,437 |
| Median Household Income | 1,749 | $78,287 |
| Mean Household Income | 1,749 | $90,134 |
| Income Deficit | 1,277 | $0 |
| Wage / Income Gap (%) | 4,015 | 7.58% |
| Wage / Income Gap ($) | 4,015 | 92.42¢ per $1 |
| Gini / Inequality Index | 4,015 | 0.40 |
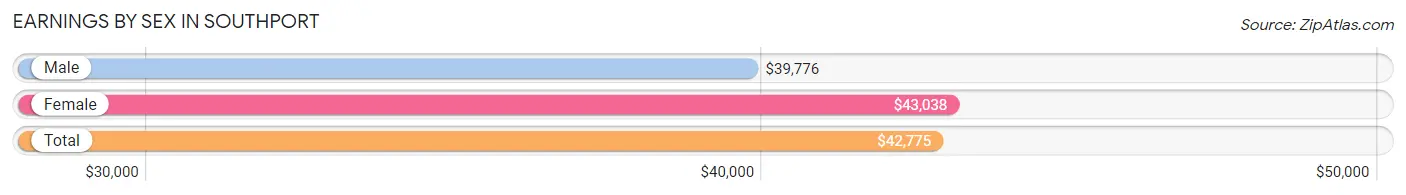
Earnings by Sex in Southport
Average Earnings in Southport are $42,775, $39,776 for men and $43,038 for women, a difference of 7.6%.
| Sex | Number | Average Earnings |
| Male | 813 (51.3%) | $39,776 |
| Female | 773 (48.7%) | $43,038 |
| Total | 1,586 (100.0%) | $42,775 |
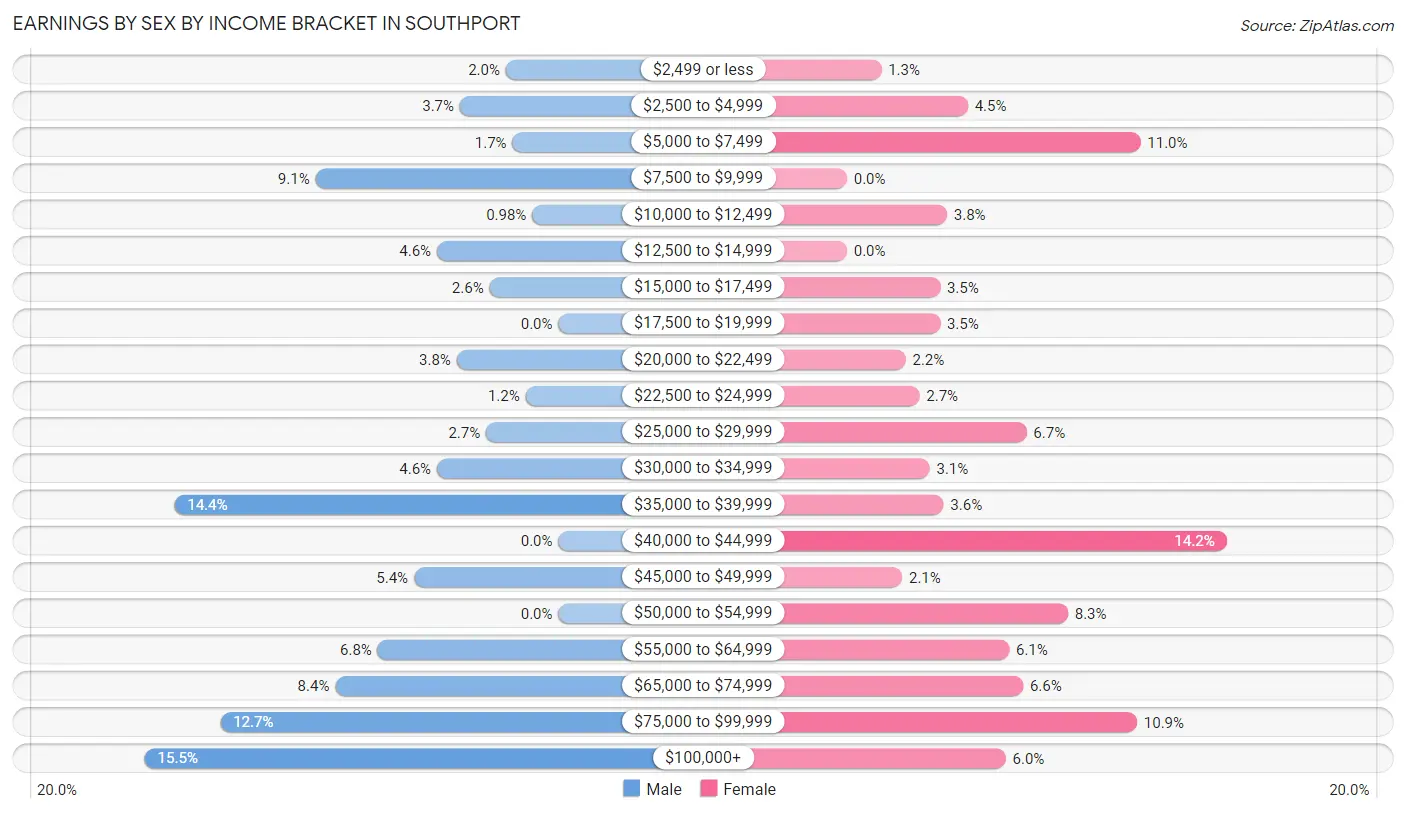
Earnings by Sex by Income Bracket in Southport
The most common earnings brackets in Southport are $100,000+ for men (126 | 15.5%) and $40,000 to $44,999 for women (110 | 14.2%).
| Income | Male | Female |
| $2,499 or less | 16 (2.0%) | 10 (1.3%) |
| $2,500 to $4,999 | 30 (3.7%) | 35 (4.5%) |
| $5,000 to $7,499 | 14 (1.7%) | 85 (11.0%) |
| $7,500 to $9,999 | 74 (9.1%) | 0 (0.0%) |
| $10,000 to $12,499 | 8 (1.0%) | 29 (3.7%) |
| $12,500 to $14,999 | 37 (4.5%) | 0 (0.0%) |
| $15,000 to $17,499 | 21 (2.6%) | 27 (3.5%) |
| $17,500 to $19,999 | 0 (0.0%) | 27 (3.5%) |
| $20,000 to $22,499 | 31 (3.8%) | 17 (2.2%) |
| $22,500 to $24,999 | 10 (1.2%) | 21 (2.7%) |
| $25,000 to $29,999 | 22 (2.7%) | 52 (6.7%) |
| $30,000 to $34,999 | 37 (4.5%) | 24 (3.1%) |
| $35,000 to $39,999 | 117 (14.4%) | 28 (3.6%) |
| $40,000 to $44,999 | 0 (0.0%) | 110 (14.2%) |
| $45,000 to $49,999 | 44 (5.4%) | 16 (2.1%) |
| $50,000 to $54,999 | 0 (0.0%) | 64 (8.3%) |
| $55,000 to $64,999 | 55 (6.8%) | 47 (6.1%) |
| $65,000 to $74,999 | 68 (8.4%) | 51 (6.6%) |
| $75,000 to $99,999 | 103 (12.7%) | 84 (10.9%) |
| $100,000+ | 126 (15.5%) | 46 (5.9%) |
| Total | 813 (100.0%) | 773 (100.0%) |
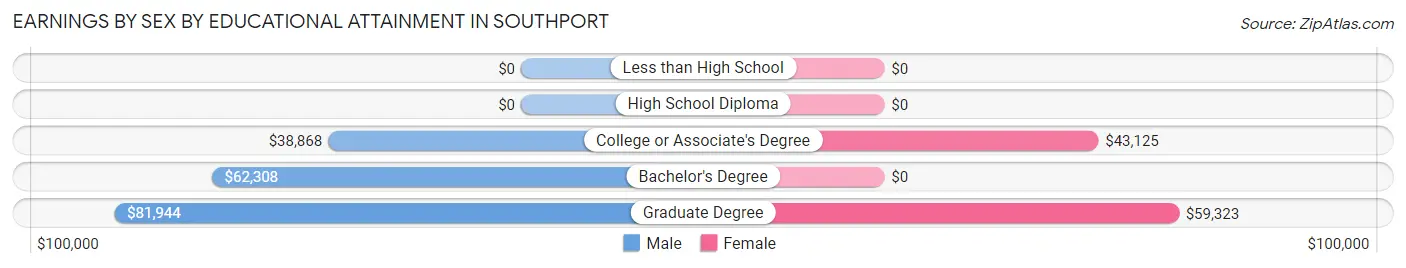
Earnings by Sex by Educational Attainment in Southport
Average earnings in Southport are $39,776 for men and $42,988 for women, a difference of 7.5%. Men with an educational attainment of graduate degree enjoy the highest average annual earnings of $81,944, while those with college or associate's degree education earn the least with $38,868. Women with an educational attainment of graduate degree earn the most with the average annual earnings of $59,323, while those with college or associate's degree education have the smallest earnings of $43,125.
| Educational Attainment | Male Income | Female Income |
| Less than High School | - | - |
| High School Diploma | - | - |
| College or Associate's Degree | $38,868 | $43,125 |
| Bachelor's Degree | $62,308 | $0 |
| Graduate Degree | $81,944 | $59,323 |
| Total | $39,776 | $42,988 |
Family Income in Southport
Family Income Brackets in Southport
According to the Southport family income data, there are 372 families falling into the $100,000 to $149,999 income range, which is the most common income bracket and makes up 29.1% of all families.
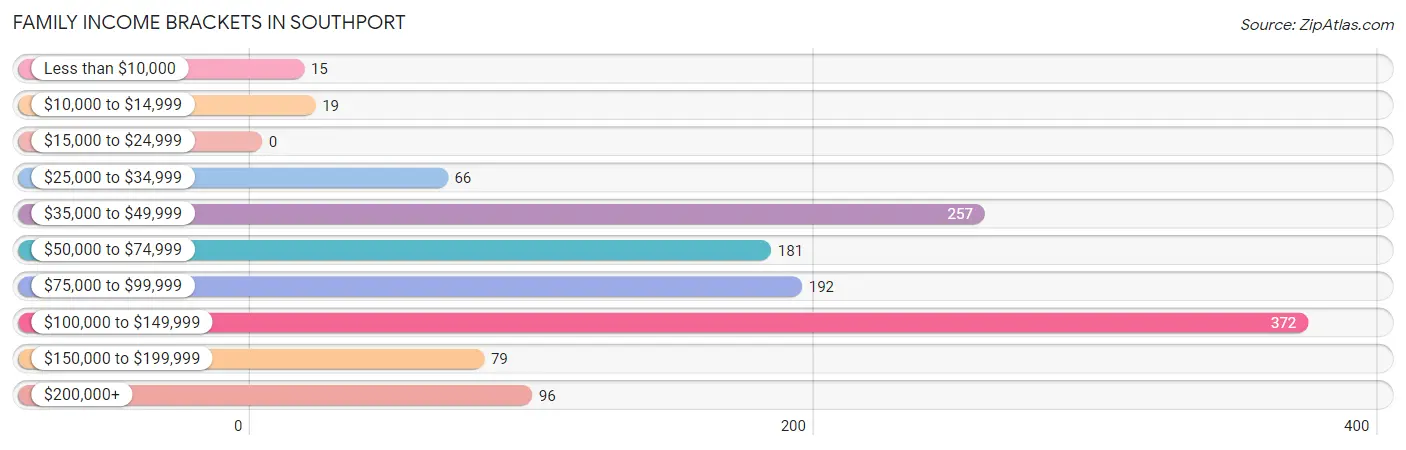
| Income Bracket | # Families | % Families |
| Less than $10,000 | 15 | 1.2% |
| $10,000 to $14,999 | 19 | 1.5% |
| $15,000 to $24,999 | 0 | 0.0% |
| $25,000 to $34,999 | 66 | 5.2% |
| $35,000 to $49,999 | 257 | 20.1% |
| $50,000 to $74,999 | 181 | 14.2% |
| $75,000 to $99,999 | 192 | 15.0% |
| $100,000 to $149,999 | 372 | 29.1% |
| $150,000 to $199,999 | 79 | 6.2% |
| $200,000+ | 96 | 7.5% |
Family Income by Famaliy Size in Southport
3-person families (177 | 13.9%) account for the highest median family income in Southport with $126,849 per family, while 2-person families (934 | 73.1%) have the highest median income of $47,812 per family member.
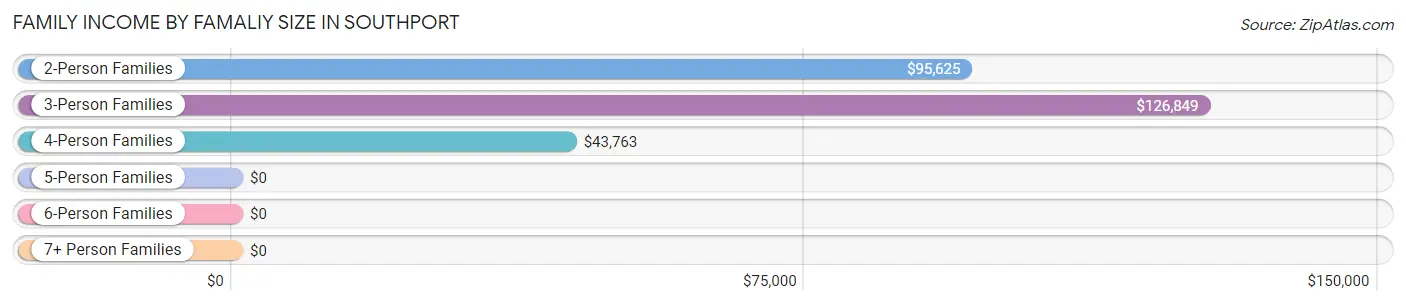
| Income Bracket | # Families | Median Income |
| 2-Person Families | 934 (73.1%) | $95,625 |
| 3-Person Families | 177 (13.9%) | $126,849 |
| 4-Person Families | 160 (12.5%) | $43,763 |
| 5-Person Families | 0 (0.0%) | $0 |
| 6-Person Families | 0 (0.0%) | $0 |
| 7+ Person Families | 6 (0.5%) | $0 |
| Total | 1,277 (100.0%) | $89,044 |
Family Income by Number of Earners in Southport
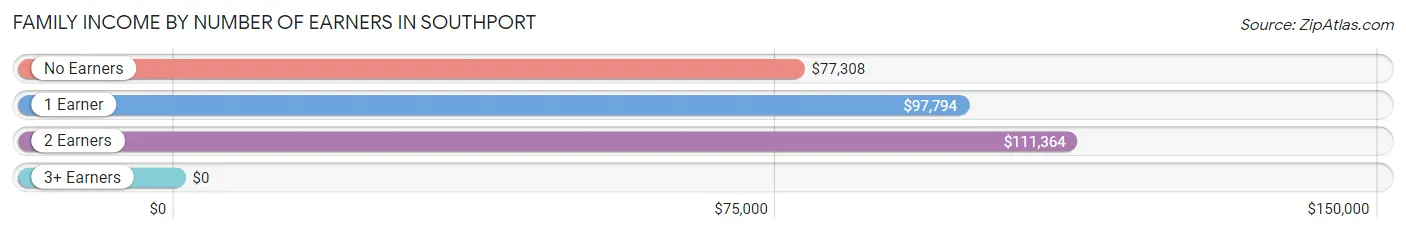
| Number of Earners | # Families | Median Income |
| No Earners | 486 (38.1%) | $77,308 |
| 1 Earner | 436 (34.1%) | $97,794 |
| 2 Earners | 340 (26.6%) | $111,364 |
| 3+ Earners | 15 (1.2%) | $0 |
| Total | 1,277 (100.0%) | $89,044 |
Household Income in Southport
Household Income Brackets in Southport
With 420 households falling in the category, the $100,000 to $149,999 income range is the most frequent in Southport, accounting for 24.0% of all households. In contrast, only 38 households (2.2%) fall into the $10,000 to $14,999 income bracket, making it the least populous group.
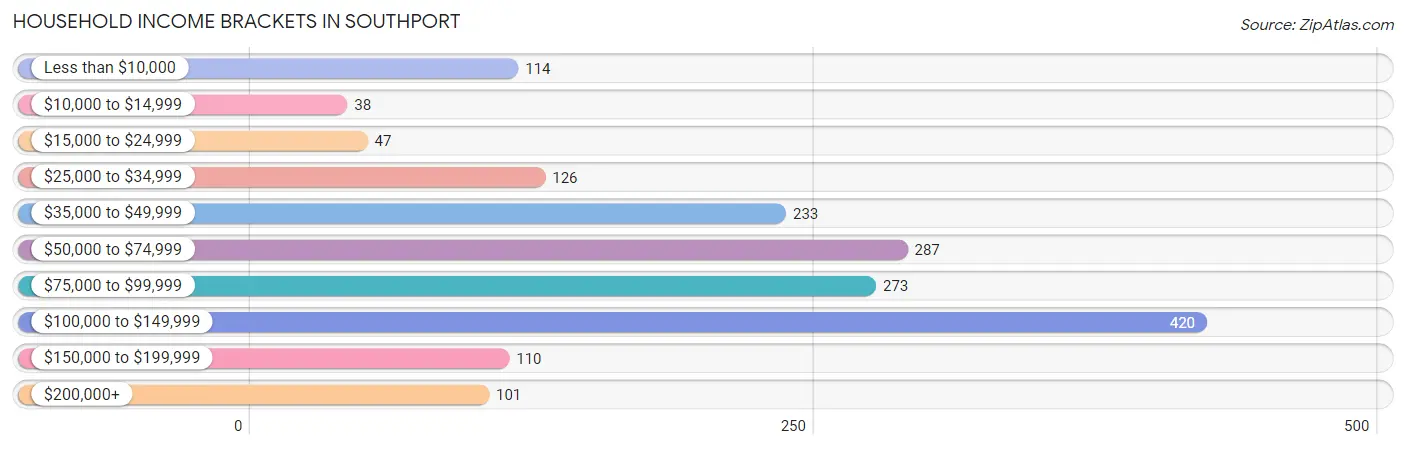
| Income Bracket | # Households | % Households |
| Less than $10,000 | 114 | 6.5% |
| $10,000 to $14,999 | 38 | 2.2% |
| $15,000 to $24,999 | 47 | 2.7% |
| $25,000 to $34,999 | 126 | 7.2% |
| $35,000 to $49,999 | 233 | 13.3% |
| $50,000 to $74,999 | 287 | 16.4% |
| $75,000 to $99,999 | 273 | 15.6% |
| $100,000 to $149,999 | 420 | 24.0% |
| $150,000 to $199,999 | 110 | 6.3% |
| $200,000+ | 101 | 5.8% |
Household Income by Householder Age in Southport
The median household income in Southport is $78,287, with the highest median household income of $80,726 found in the 25 to 44 years age bracket for the primary householder. A total of 214 households (12.2%) fall into this category. Meanwhile, the 15 to 24 years age bracket for the primary householder has the lowest median household income of $0, with 26 households (1.5%) in this group.
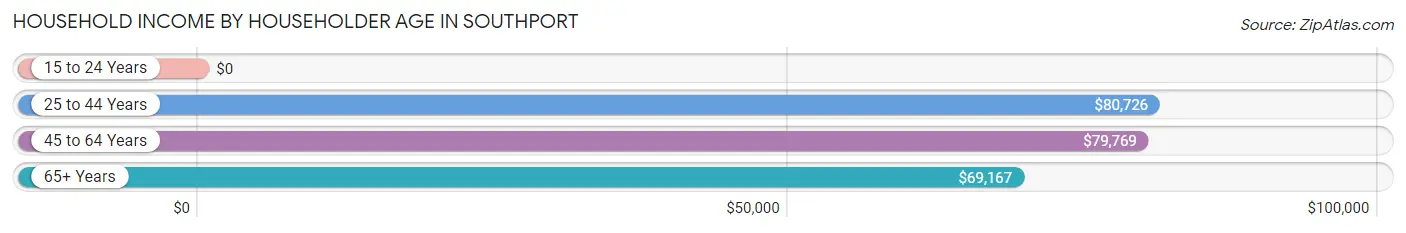
| Income Bracket | # Households | Median Income |
| 15 to 24 Years | 26 (1.5%) | $0 |
| 25 to 44 Years | 214 (12.2%) | $80,726 |
| 45 to 64 Years | 609 (34.8%) | $79,769 |
| 65+ Years | 900 (51.5%) | $69,167 |
| Total | 1,749 (100.0%) | $78,287 |
Poverty in Southport
Income Below Poverty by Sex and Age in Southport
With 2.1% poverty level for males and 8.2% for females among the residents of Southport, 55 to 64 year old males and 25 to 34 year old females are the most vulnerable to poverty, with 17 males (7.2%) and 26 females (17.0%) in their respective age groups living below the poverty level.
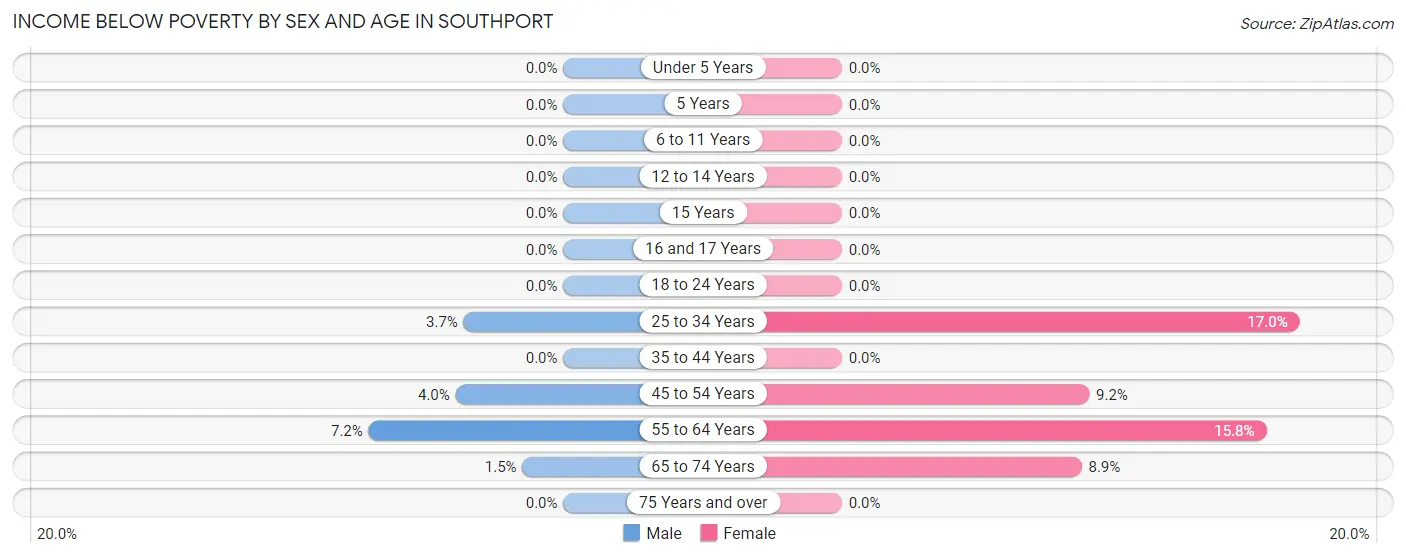
| Age Bracket | Male | Female |
| Under 5 Years | 0 (0.0%) | 0 (0.0%) |
| 5 Years | 0 (0.0%) | 0 (0.0%) |
| 6 to 11 Years | 0 (0.0%) | 0 (0.0%) |
| 12 to 14 Years | 0 (0.0%) | 0 (0.0%) |
| 15 Years | 0 (0.0%) | 0 (0.0%) |
| 16 and 17 Years | 0 (0.0%) | 0 (0.0%) |
| 18 to 24 Years | 0 (0.0%) | 0 (0.0%) |
| 25 to 34 Years | 7 (3.7%) | 26 (17.0%) |
| 35 to 44 Years | 0 (0.0%) | 0 (0.0%) |
| 45 to 54 Years | 7 (4.0%) | 18 (9.2%) |
| 55 to 64 Years | 17 (7.2%) | 75 (15.8%) |
| 65 to 74 Years | 8 (1.5%) | 47 (8.9%) |
| 75 Years and over | 0 (0.0%) | 0 (0.0%) |
| Total | 39 (2.1%) | 166 (8.2%) |
Income Above Poverty by Sex and Age in Southport
According to the poverty statistics in Southport, males aged under 5 years and females aged under 5 years are the age groups that are most secure financially, with 100.0% of males and 100.0% of females in these age groups living above the poverty line.
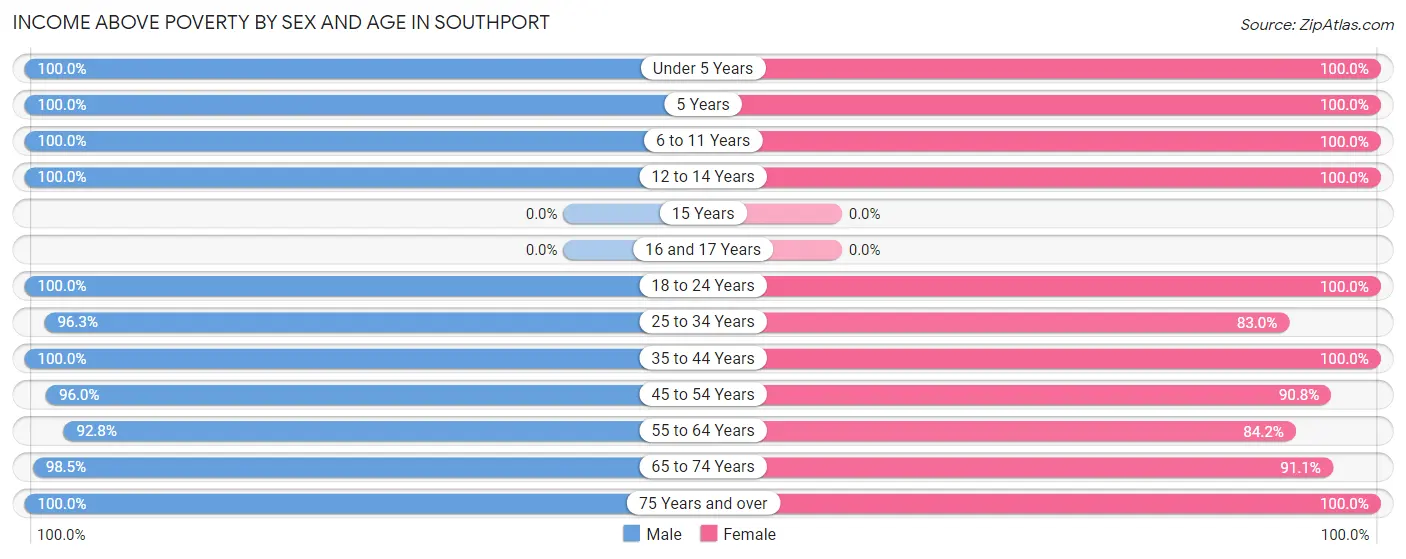
| Age Bracket | Male | Female |
| Under 5 Years | 55 (100.0%) | 105 (100.0%) |
| 5 Years | 93 (100.0%) | 45 (100.0%) |
| 6 to 11 Years | 171 (100.0%) | 17 (100.0%) |
| 12 to 14 Years | 31 (100.0%) | 24 (100.0%) |
| 15 Years | 0 (0.0%) | 0 (0.0%) |
| 16 and 17 Years | 0 (0.0%) | 0 (0.0%) |
| 18 to 24 Years | 15 (100.0%) | 57 (100.0%) |
| 25 to 34 Years | 182 (96.3%) | 127 (83.0%) |
| 35 to 44 Years | 100 (100.0%) | 180 (100.0%) |
| 45 to 54 Years | 168 (96.0%) | 178 (90.8%) |
| 55 to 64 Years | 218 (92.8%) | 401 (84.2%) |
| 65 to 74 Years | 518 (98.5%) | 481 (91.1%) |
| 75 Years and over | 221 (100.0%) | 249 (100.0%) |
| Total | 1,772 (97.9%) | 1,864 (91.8%) |
Income Below Poverty Among Married-Couple Families in Southport
The poverty statistics for married-couple families in Southport show that 1.4% or 15 of the total 1,050 families live below the poverty line. Families with no children have the highest poverty rate of 1.7%, comprising of 15 families. On the other hand, families with 1 or 2 children have the lowest poverty rate of 0.0%, which includes 0 families.
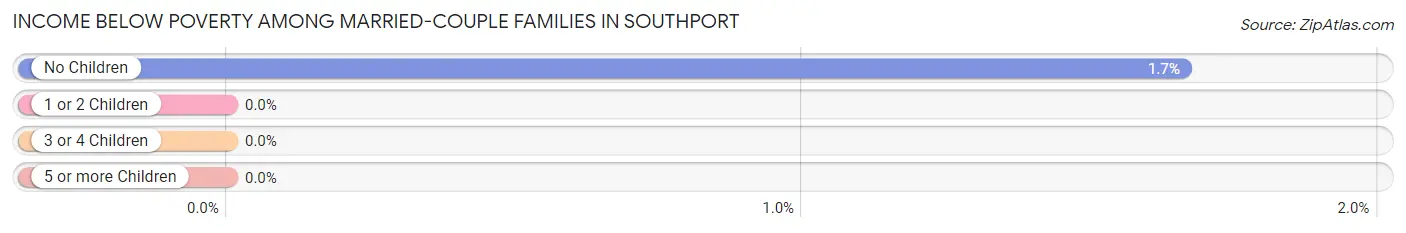
| Children | Above Poverty | Below Poverty |
| No Children | 889 (98.3%) | 15 (1.7%) |
| 1 or 2 Children | 140 (100.0%) | 0 (0.0%) |
| 3 or 4 Children | 6 (100.0%) | 0 (0.0%) |
| 5 or more Children | 0 (0.0%) | 0 (0.0%) |
| Total | 1,035 (98.6%) | 15 (1.4%) |
Income Below Poverty Among Single-Parent Households in Southport
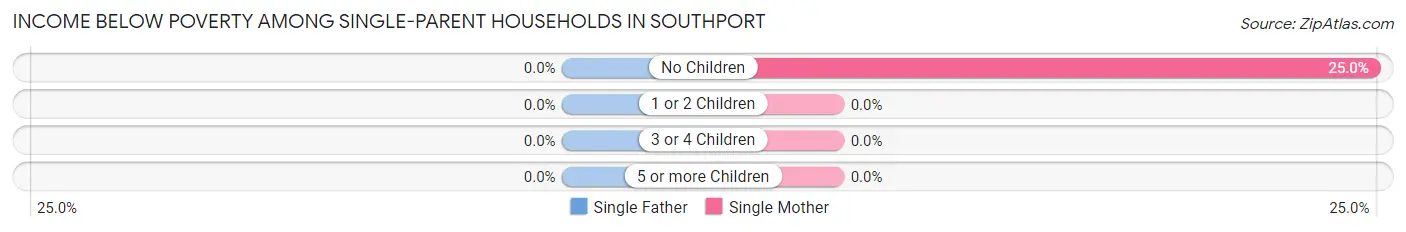
| Children | Single Father | Single Mother |
| No Children | 0 (0.0%) | 19 (25.0%) |
| 1 or 2 Children | 0 (0.0%) | 0 (0.0%) |
| 3 or 4 Children | 0 (0.0%) | 0 (0.0%) |
| 5 or more Children | 0 (0.0%) | 0 (0.0%) |
| Total | 0 (0.0%) | 19 (8.4%) |
Income Below Poverty Among Married-Couple vs Single-Parent Households in Southport
The poverty data for Southport shows that 15 of the married-couple family households (1.4%) and 19 of the single-parent households (8.4%) are living below the poverty level. Within the married-couple family households, those with no children have the highest poverty rate, with 15 households (1.7%) falling below the poverty line. Among the single-parent households, those with no children have the highest poverty rate, with 19 household (25.0%) living below poverty.
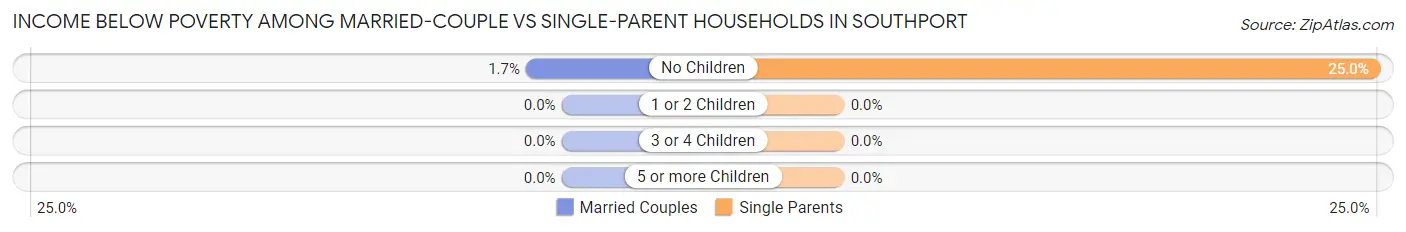
| Children | Married-Couple Families | Single-Parent Households |
| No Children | 15 (1.7%) | 19 (25.0%) |
| 1 or 2 Children | 0 (0.0%) | 0 (0.0%) |
| 3 or 4 Children | 0 (0.0%) | 0 (0.0%) |
| 5 or more Children | 0 (0.0%) | 0 (0.0%) |
| Total | 15 (1.4%) | 19 (8.4%) |
Race in Southport
The most populous races in Southport are White / Caucasian (3,431 | 85.5%), Black / African American (441 | 11.0%), and Two or more Races (143 | 3.6%).
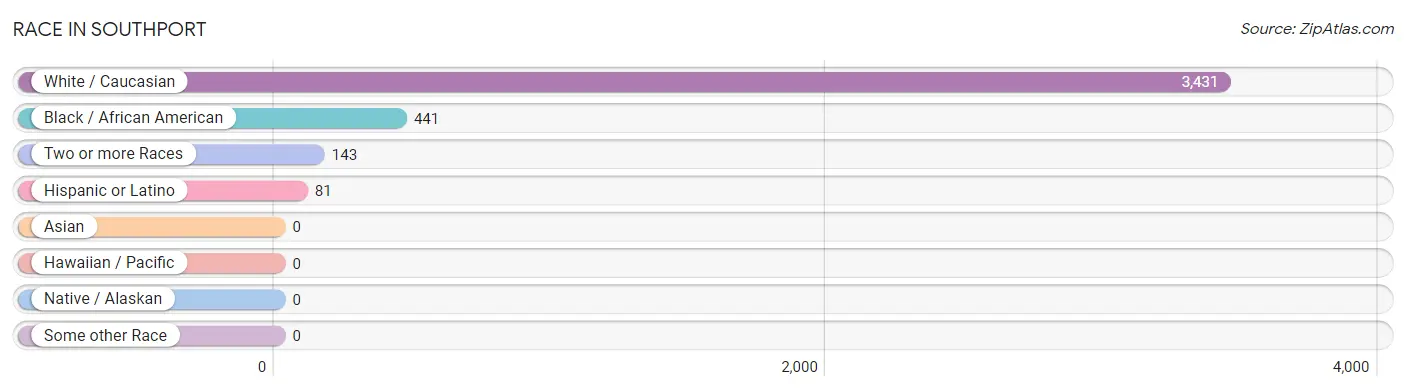
| Race | # Population | % Population |
| Asian | 0 | 0.0% |
| Black / African American | 441 | 11.0% |
| Hawaiian / Pacific | 0 | 0.0% |
| Hispanic or Latino | 81 | 2.0% |
| Native / Alaskan | 0 | 0.0% |
| White / Caucasian | 3,431 | 85.5% |
| Two or more Races | 143 | 3.6% |
| Some other Race | 0 | 0.0% |
| Total | 4,015 | 100.0% |
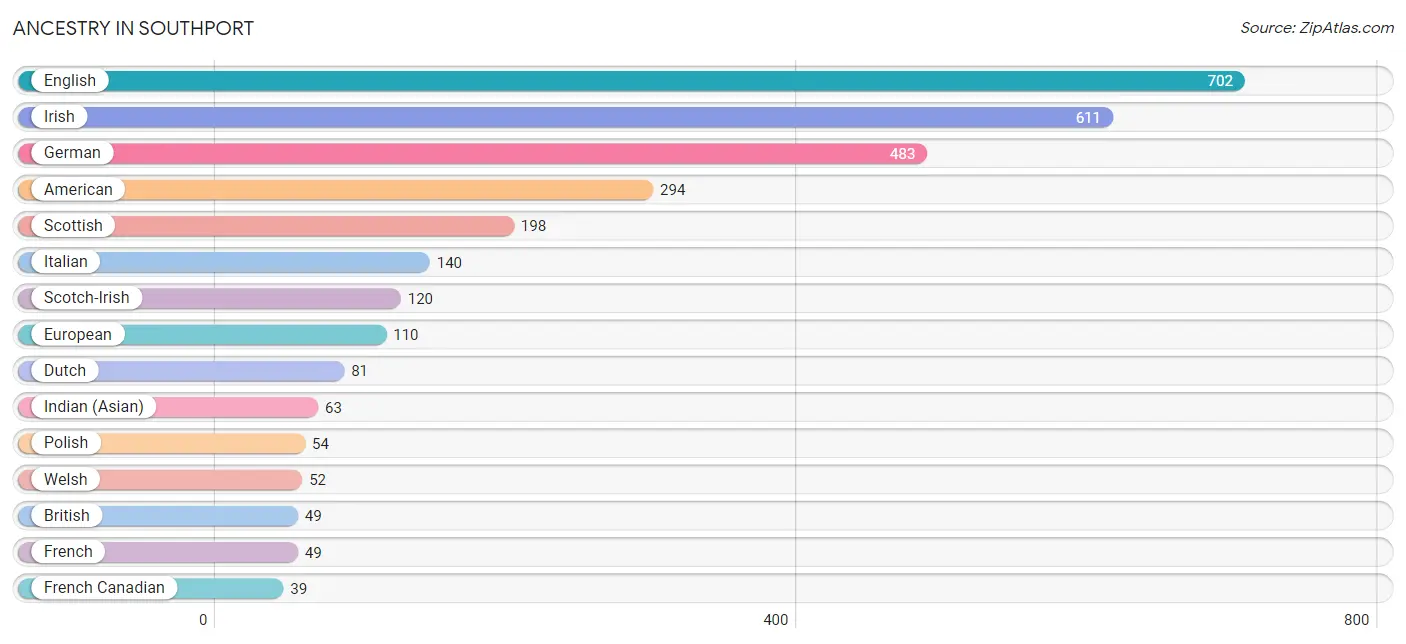
Ancestry in Southport
The most populous ancestries reported in Southport are English (702 | 17.5%), Irish (611 | 15.2%), German (483 | 12.0%), American (294 | 7.3%), and Scottish (198 | 4.9%), together accounting for 57.0% of all Southport residents.
| Ancestry | # Population | % Population |
| Alsatian | 10 | 0.3% |
| American | 294 | 7.3% |
| Arab | 8 | 0.2% |
| Blackfeet | 11 | 0.3% |
| British | 49 | 1.2% |
| Canadian | 9 | 0.2% |
| Cherokee | 36 | 0.9% |
| Czechoslovakian | 22 | 0.5% |
| Danish | 5 | 0.1% |
| Dutch | 81 | 2.0% |
| Ecuadorian | 26 | 0.6% |
| English | 702 | 17.5% |
| European | 110 | 2.7% |
| French | 49 | 1.2% |
| French Canadian | 39 | 1.0% |
| German | 483 | 12.0% |
| Greek | 17 | 0.4% |
| Hungarian | 10 | 0.3% |
| Indian (Asian) | 63 | 1.6% |
| Irish | 611 | 15.2% |
| Italian | 140 | 3.5% |
| Lithuanian | 16 | 0.4% |
| Mexican | 23 | 0.6% |
| Norwegian | 24 | 0.6% |
| Polish | 54 | 1.3% |
| Portuguese | 5 | 0.1% |
| Puerto Rican | 32 | 0.8% |
| Scotch-Irish | 120 | 3.0% |
| Scottish | 198 | 4.9% |
| Slovak | 9 | 0.2% |
| South American | 26 | 0.6% |
| Swedish | 24 | 0.6% |
| Swiss | 6 | 0.2% |
| Syrian | 8 | 0.2% |
| Welsh | 52 | 1.3% | View All 35 Rows |
Immigrants in Southport
The most numerous immigrant groups reported in Southport came from Europe (41 | 1.0%), Ecuador (26 | 0.6%), Latin America (26 | 0.6%), South America (26 | 0.6%), and Northern Europe (24 | 0.6%), together accounting for 3.6% of all Southport residents.
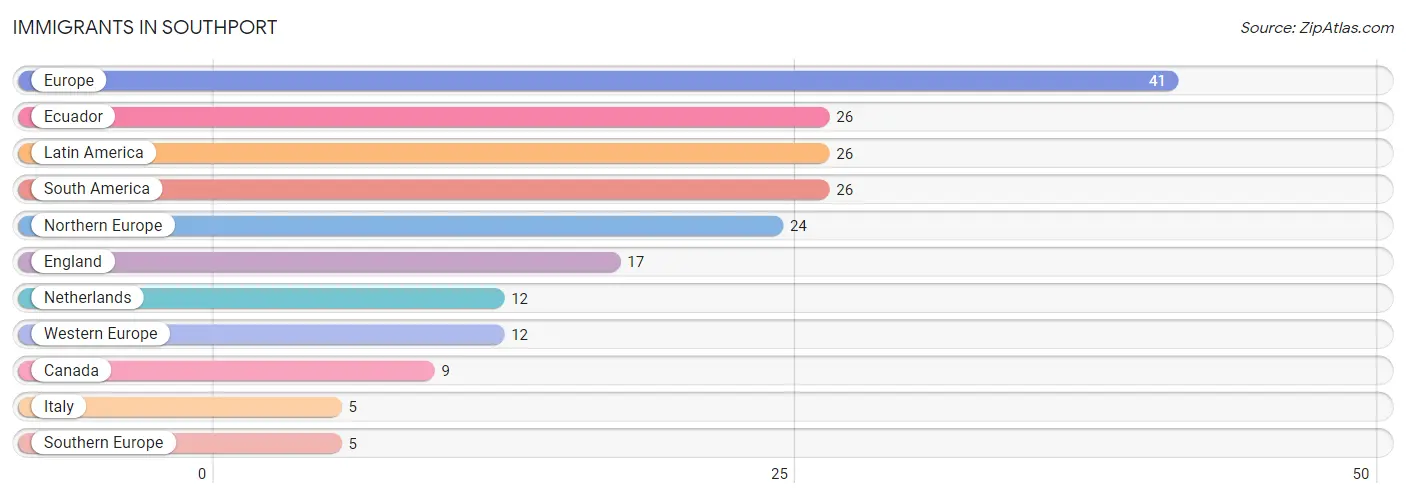
| Immigration Origin | # Population | % Population |
| Canada | 9 | 0.2% |
| Ecuador | 26 | 0.6% |
| England | 17 | 0.4% |
| Europe | 41 | 1.0% |
| Italy | 5 | 0.1% |
| Latin America | 26 | 0.6% |
| Netherlands | 12 | 0.3% |
| Northern Europe | 24 | 0.6% |
| South America | 26 | 0.6% |
| Southern Europe | 5 | 0.1% |
| Western Europe | 12 | 0.3% | View All 11 Rows |
Sex and Age in Southport
Sex and Age in Southport
The most populous age groups in Southport are 70 to 74 Years (327 | 17.5%) for men and 70 to 74 Years (335 | 15.6%) for women.
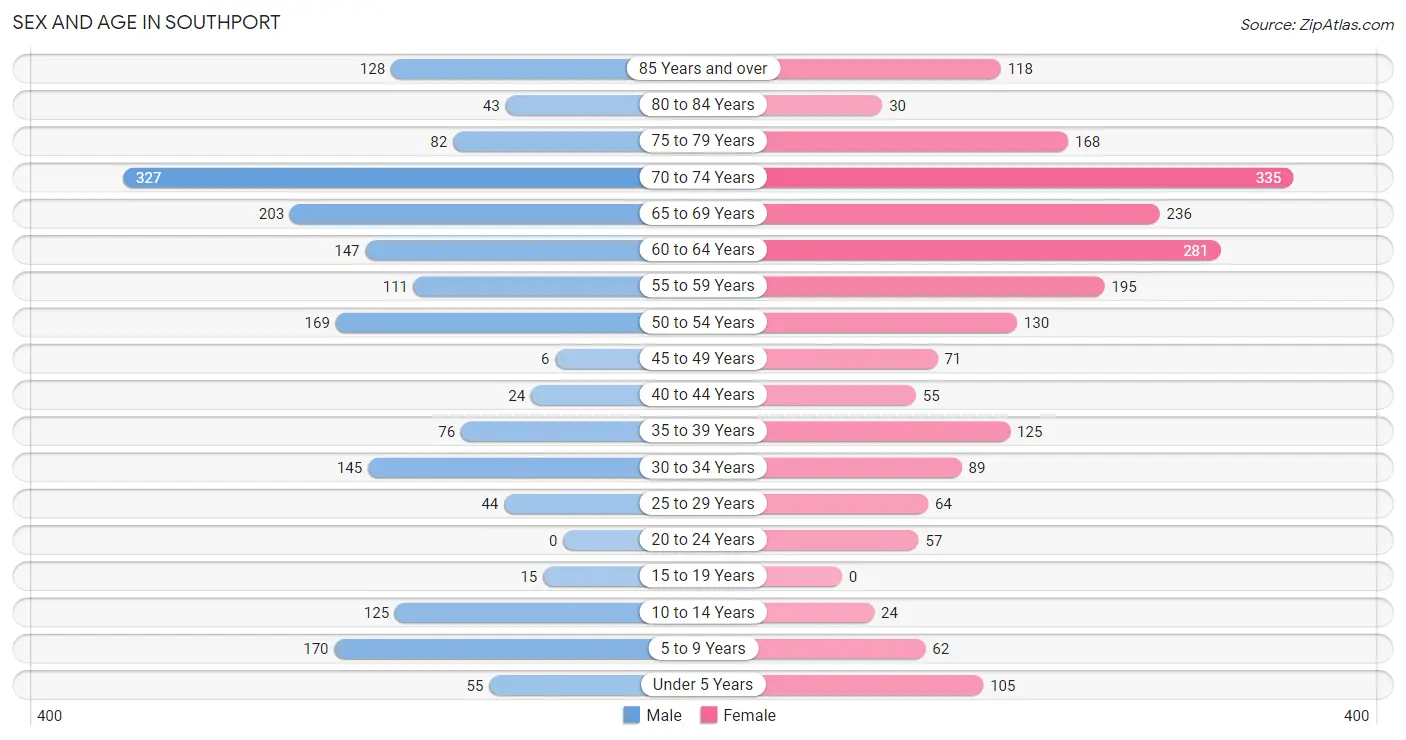
| Age Bracket | Male | Female |
| Under 5 Years | 55 (2.9%) | 105 (4.9%) |
| 5 to 9 Years | 170 (9.1%) | 62 (2.9%) |
| 10 to 14 Years | 125 (6.7%) | 24 (1.1%) |
| 15 to 19 Years | 15 (0.8%) | 0 (0.0%) |
| 20 to 24 Years | 0 (0.0%) | 57 (2.7%) |
| 25 to 29 Years | 44 (2.4%) | 64 (3.0%) |
| 30 to 34 Years | 145 (7.7%) | 89 (4.2%) |
| 35 to 39 Years | 76 (4.1%) | 125 (5.8%) |
| 40 to 44 Years | 24 (1.3%) | 55 (2.6%) |
| 45 to 49 Years | 6 (0.3%) | 71 (3.3%) |
| 50 to 54 Years | 169 (9.0%) | 130 (6.1%) |
| 55 to 59 Years | 111 (5.9%) | 195 (9.1%) |
| 60 to 64 Years | 147 (7.9%) | 281 (13.1%) |
| 65 to 69 Years | 203 (10.9%) | 236 (11.0%) |
| 70 to 74 Years | 327 (17.5%) | 335 (15.6%) |
| 75 to 79 Years | 82 (4.4%) | 168 (7.8%) |
| 80 to 84 Years | 43 (2.3%) | 30 (1.4%) |
| 85 Years and over | 128 (6.8%) | 118 (5.5%) |
| Total | 1,870 (100.0%) | 2,145 (100.0%) |
Families and Households in Southport
Median Family Size in Southport
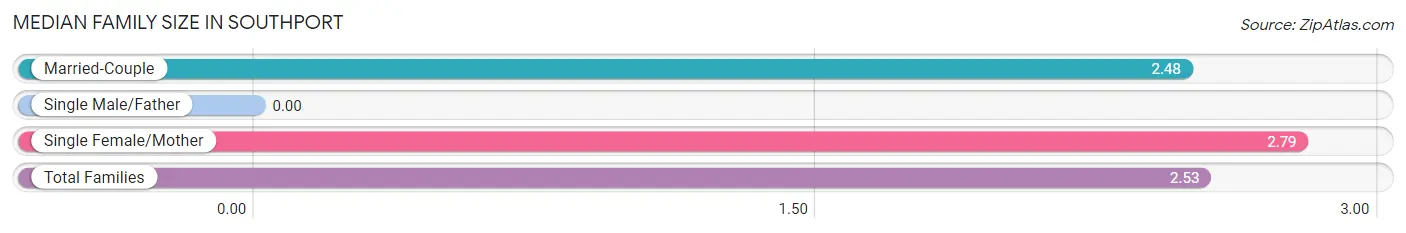
| Family Type | # Families | Family Size |
| Married-Couple | 1,050 (82.2%) | 2.48 |
| Single Male/Father | 0 (0.0%) | - |
| Single Female/Mother | 227 (17.8%) | 2.79 |
| Total Families | 1,277 (100.0%) | 2.53 |
Median Household Size in Southport
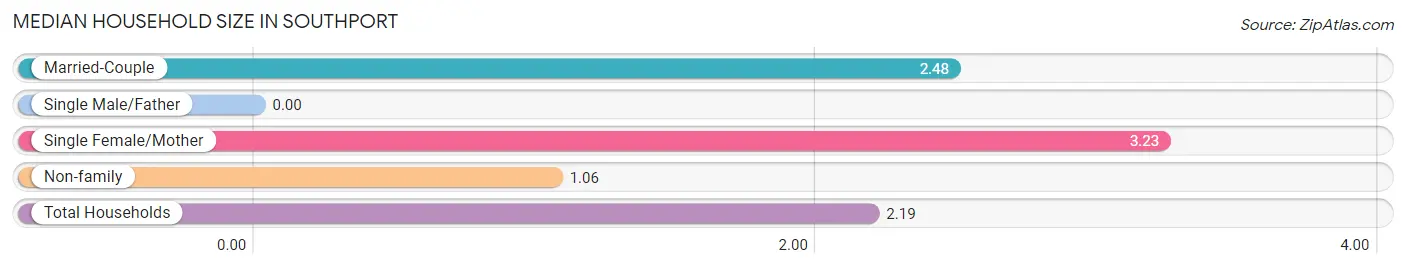
| Household Type | # Households | Household Size |
| Married-Couple | 1,050 (60.0%) | 2.48 |
| Single Male/Father | 0 (0.0%) | - |
| Single Female/Mother | 227 (13.0%) | 3.23 |
| Non-family | 472 (27.0%) | 1.06 |
| Total Households | 1,749 (100.0%) | 2.19 |
Household Size by Marriage Status in Southport
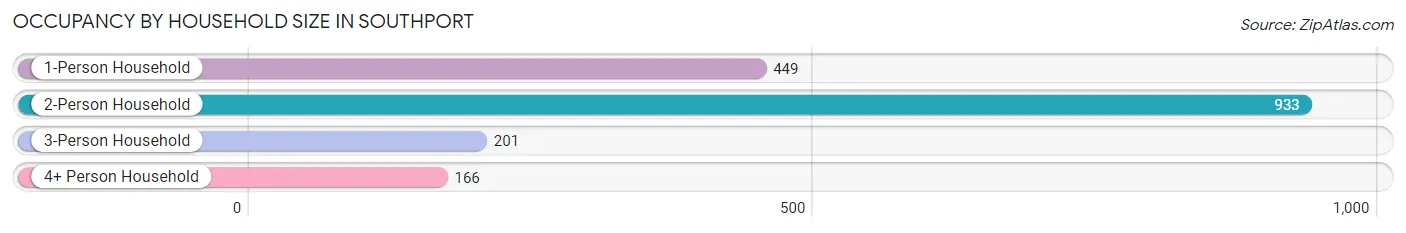
Out of a total of 1,749 households in Southport, 1,277 (73.0%) are family households, while 472 (27.0%) are nonfamily households. The most numerous type of family households are 2-person households, comprising 910, and the most common type of nonfamily households are 1-person households, comprising 449.
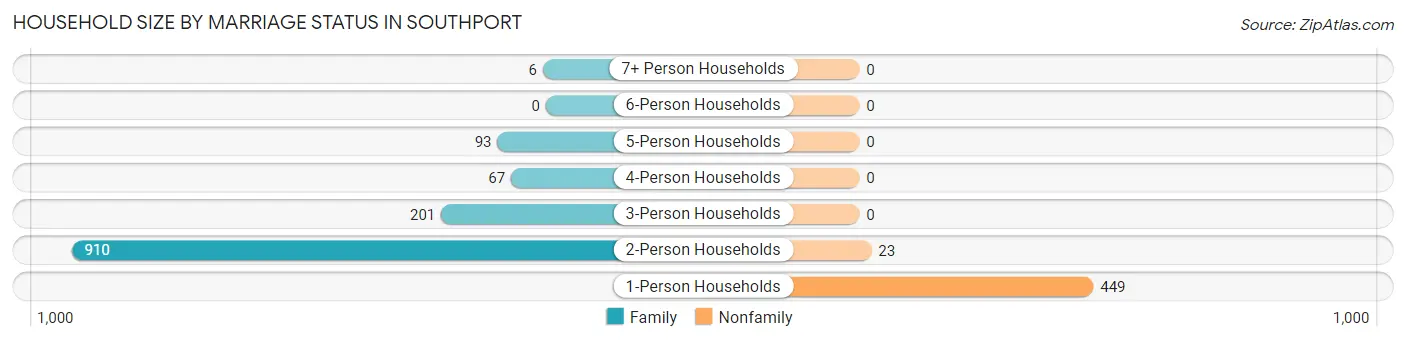
| Household Size | Family Households | Nonfamily Households |
| 1-Person Households | - | 449 (25.7%) |
| 2-Person Households | 910 (52.0%) | 23 (1.3%) |
| 3-Person Households | 201 (11.5%) | 0 (0.0%) |
| 4-Person Households | 67 (3.8%) | 0 (0.0%) |
| 5-Person Households | 93 (5.3%) | 0 (0.0%) |
| 6-Person Households | 0 (0.0%) | 0 (0.0%) |
| 7+ Person Households | 6 (0.3%) | 0 (0.0%) |
| Total | 1,277 (73.0%) | 472 (27.0%) |
Female Fertility in Southport
Fertility by Age in Southport
Average fertility rate in Southport is 85.0 births per 1,000 women. Women in the age bracket of 20 to 34 years have the highest fertility rate with 171.0 births per 1,000 women. Women in the age bracket of 20 to 34 years acount for 87.8% of all women with births.
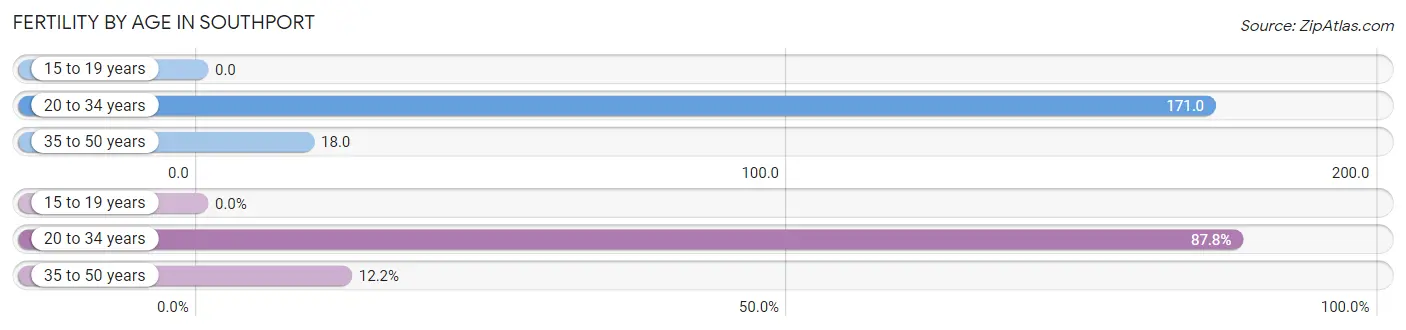
| Age Bracket | Women with Births | Births / 1,000 Women |
| 15 to 19 years | 0 (0.0%) | 0.0 |
| 20 to 34 years | 36 (87.8%) | 171.0 |
| 35 to 50 years | 5 (12.2%) | 18.0 |
| Total | 41 (100.0%) | 85.0 |
Fertility by Age by Marriage Status in Southport
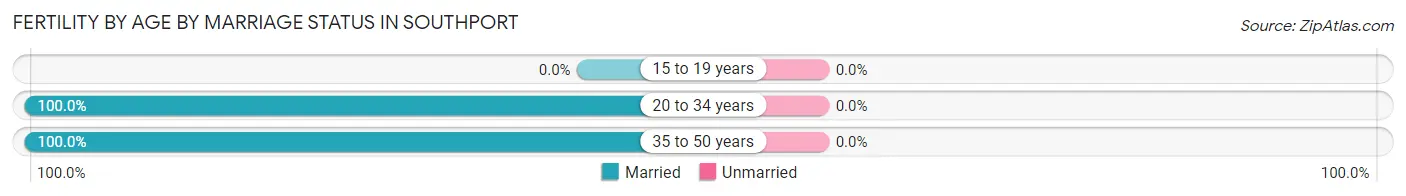
| Age Bracket | Married | Unmarried |
| 15 to 19 years | 0 (0.0%) | 0 (0.0%) |
| 20 to 34 years | 36 (100.0%) | 0 (0.0%) |
| 35 to 50 years | 5 (100.0%) | 0 (0.0%) |
| Total | 41 (100.0%) | 0 (0.0%) |
Fertility by Education in Southport
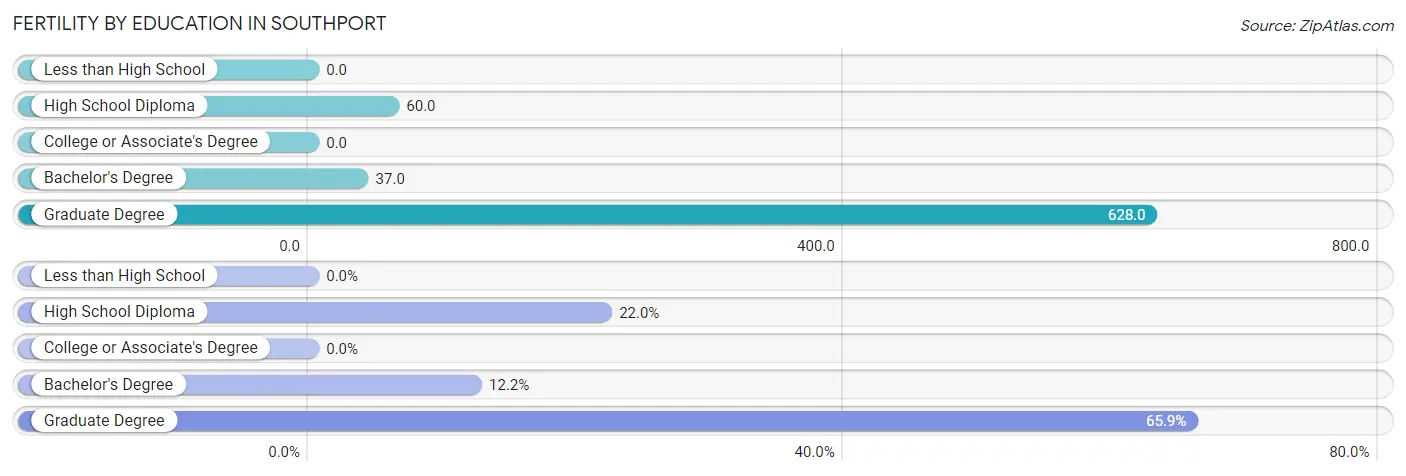
| Educational Attainment | Women with Births | Births / 1,000 Women |
| Less than High School | 0 (0.0%) | 0.0 |
| High School Diploma | 9 (22.0%) | 60.0 |
| College or Associate's Degree | 0 (0.0%) | 0.0 |
| Bachelor's Degree | 5 (12.2%) | 37.0 |
| Graduate Degree | 27 (65.8%) | 628.0 |
| Total | 41 (100.0%) | 85.0 |
Fertility by Education by Marriage Status in Southport
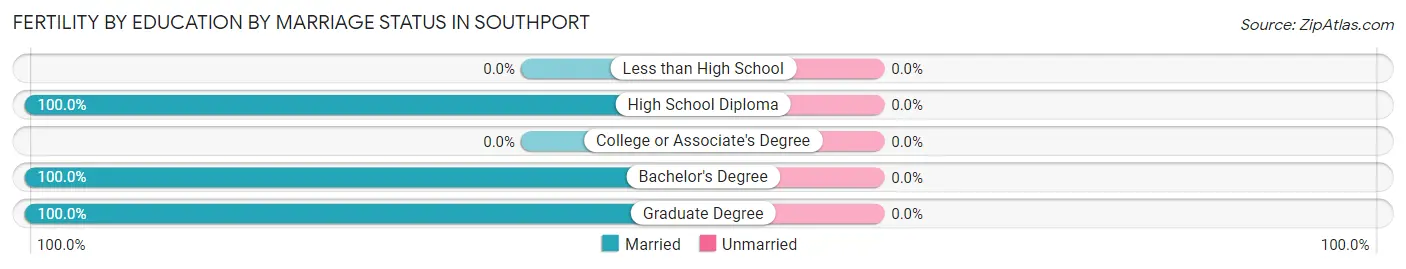
| Educational Attainment | Married | Unmarried |
| Less than High School | 0 (0.0%) | 0 (0.0%) |
| High School Diploma | 9 (100.0%) | 0 (0.0%) |
| College or Associate's Degree | 0 (0.0%) | 0 (0.0%) |
| Bachelor's Degree | 5 (100.0%) | 0 (0.0%) |
| Graduate Degree | 27 (100.0%) | 0 (0.0%) |
| Total | 41 (100.0%) | 0 (0.0%) |
Employment Characteristics in Southport
Employment by Class of Employer in Southport
Among the 1,431 employed individuals in Southport, private company employees (733 | 51.2%), local government employees (243 | 17.0%), and self-employed (not incorporated) (143 | 10.0%) make up the most common classes of employment.
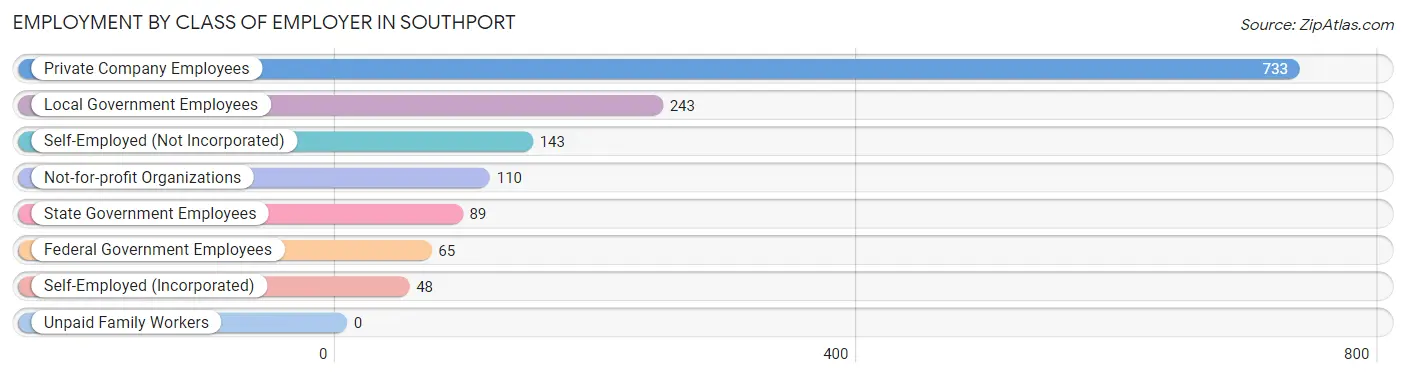
| Employer Class | # Employees | % Employees |
| Private Company Employees | 733 | 51.2% |
| Self-Employed (Incorporated) | 48 | 3.4% |
| Self-Employed (Not Incorporated) | 143 | 10.0% |
| Not-for-profit Organizations | 110 | 7.7% |
| Local Government Employees | 243 | 17.0% |
| State Government Employees | 89 | 6.2% |
| Federal Government Employees | 65 | 4.5% |
| Unpaid Family Workers | 0 | 0.0% |
| Total | 1,431 | 100.0% |
Employment Status by Age in Southport
According to the labor force statistics for Southport, out of the total population over 16 years of age (3,474), 44.4% or 1,542 individuals are in the labor force, with 0.8% or 12 of them unemployed. The age group with the highest labor force participation rate is 30 to 34 years, with 97.0% or 227 individuals in the labor force. Within the labor force, the 65 to 74 years age range has the highest percentage of unemployed individuals, with 5.5% or 12 of them being unemployed.
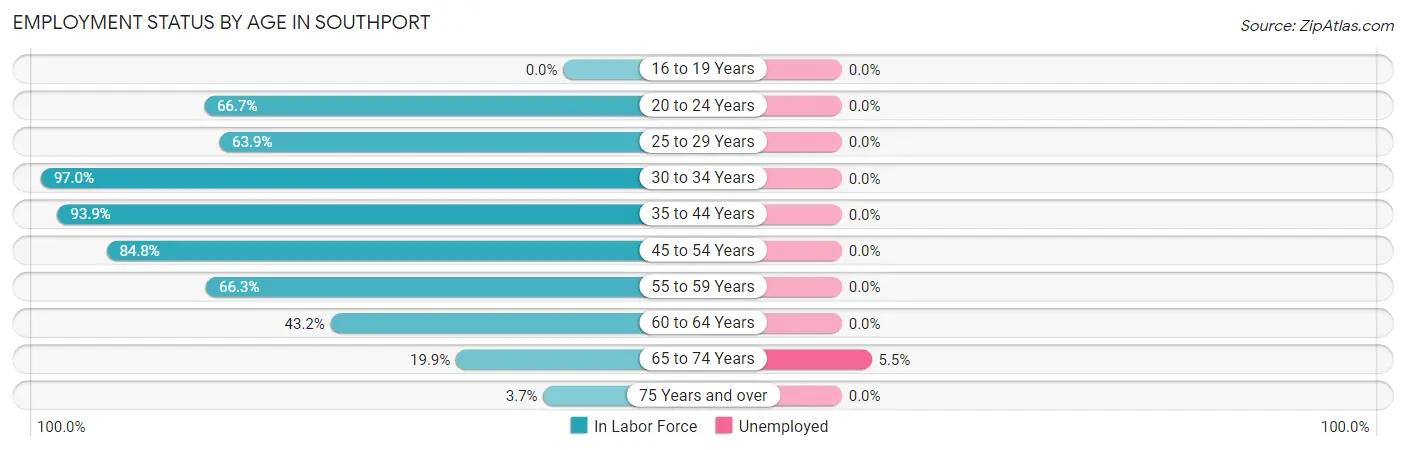
| Age Bracket | In Labor Force | Unemployed |
| 16 to 19 Years | 0 (0.0%) | 0 (0.0%) |
| 20 to 24 Years | 38 (66.7%) | 0 (0.0%) |
| 25 to 29 Years | 69 (63.9%) | 0 (0.0%) |
| 30 to 34 Years | 227 (97.0%) | 0 (0.0%) |
| 35 to 44 Years | 263 (93.9%) | 0 (0.0%) |
| 45 to 54 Years | 319 (84.8%) | 0 (0.0%) |
| 55 to 59 Years | 203 (66.3%) | 0 (0.0%) |
| 60 to 64 Years | 185 (43.2%) | 0 (0.0%) |
| 65 to 74 Years | 219 (19.9%) | 12 (5.5%) |
| 75 Years and over | 21 (3.7%) | 0 (0.0%) |
| Total | 1,542 (44.4%) | 12 (0.8%) |
Employment Status by Educational Attainment in Southport
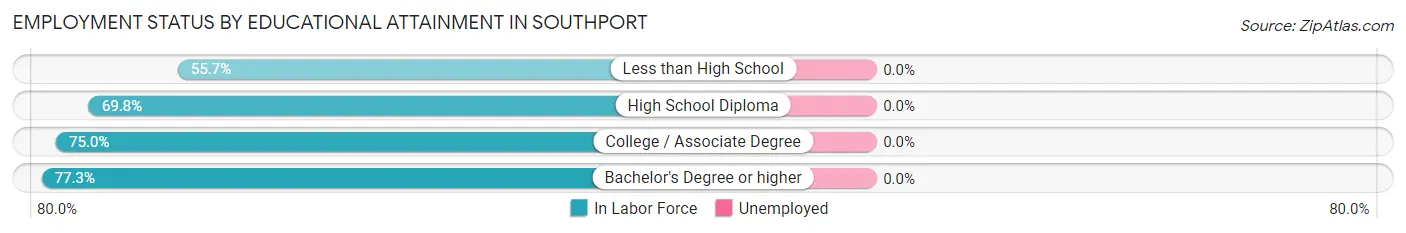
| Educational Attainment | In Labor Force | Unemployed |
| Less than High School | 54 (55.7%) | 0 (0.0%) |
| High School Diploma | 354 (69.8%) | 0 (0.0%) |
| College / Associate Degree | 460 (75.0%) | 0 (0.0%) |
| Bachelor's Degree or higher | 398 (77.3%) | 0 (0.0%) |
| Total | 1,266 (73.1%) | 0 (0.0%) |
Employment Occupations by Sex in Southport
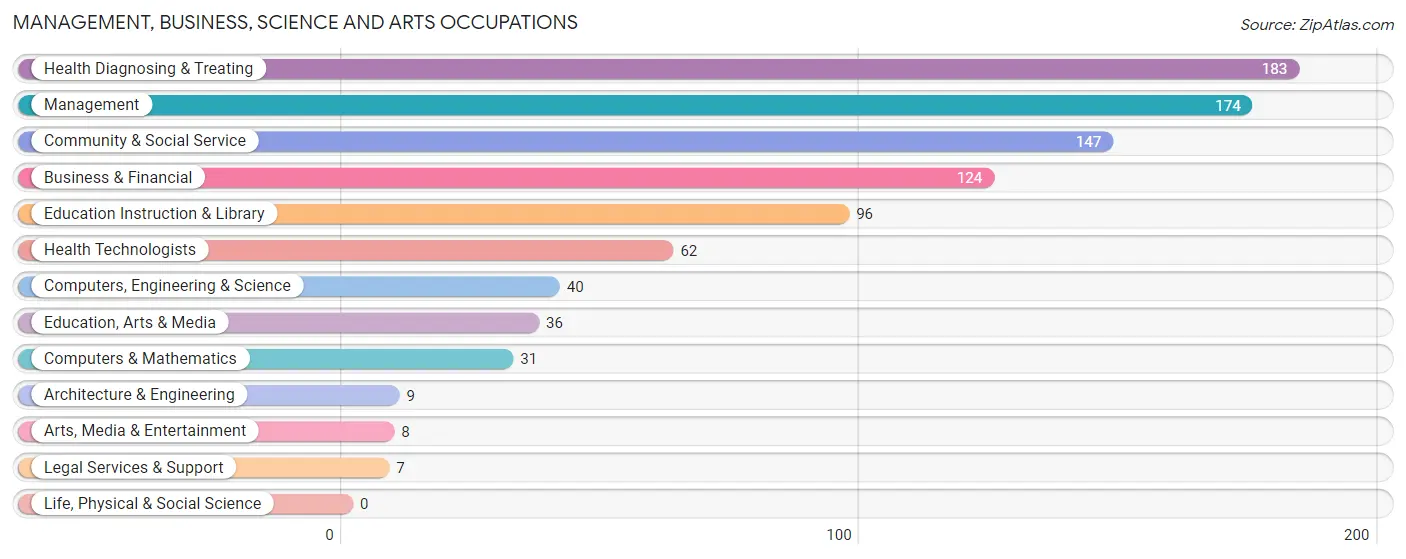
Management, Business, Science and Arts Occupations
The most common Management, Business, Science and Arts occupations in Southport are Health Diagnosing & Treating (183 | 11.9%), Management (174 | 11.4%), Community & Social Service (147 | 9.6%), Business & Financial (124 | 8.1%), and Education Instruction & Library (96 | 6.3%).
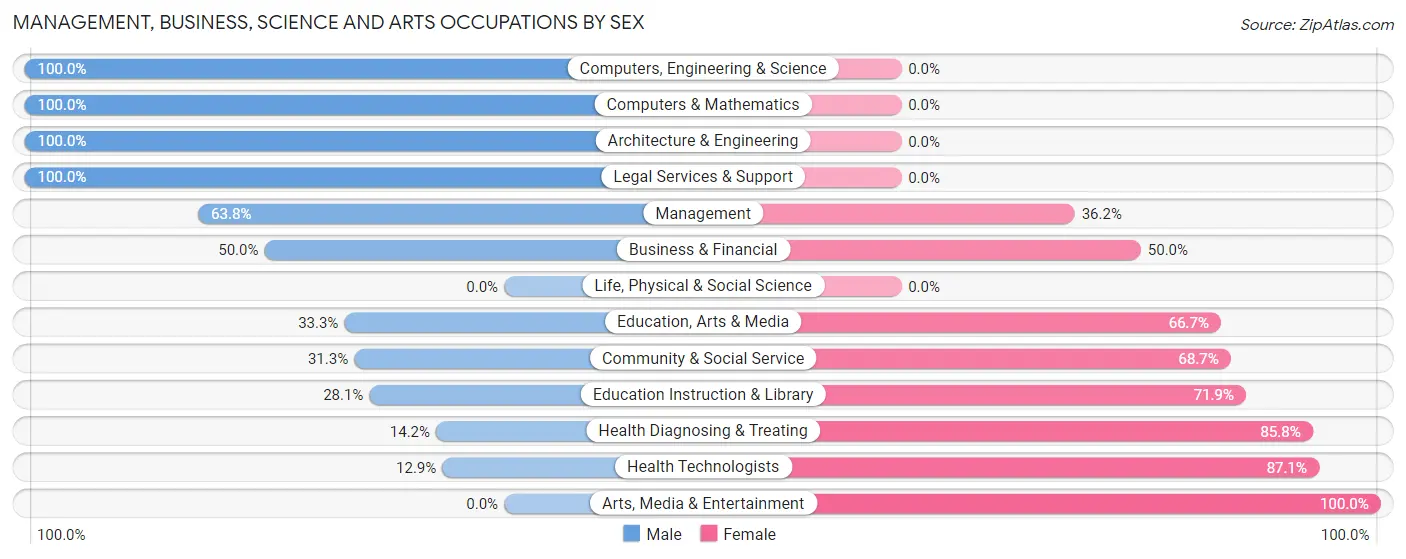
Management, Business, Science and Arts Occupations by Sex
Within the Management, Business, Science and Arts occupations in Southport, the most male-oriented occupations are Computers, Engineering & Science (100.0%), Computers & Mathematics (100.0%), and Architecture & Engineering (100.0%), while the most female-oriented occupations are Arts, Media & Entertainment (100.0%), Health Technologists (87.1%), and Health Diagnosing & Treating (85.8%).
| Occupation | Male | Female |
| Management | 111 (63.8%) | 63 (36.2%) |
| Business & Financial | 62 (50.0%) | 62 (50.0%) |
| Computers, Engineering & Science | 40 (100.0%) | 0 (0.0%) |
| Computers & Mathematics | 31 (100.0%) | 0 (0.0%) |
| Architecture & Engineering | 9 (100.0%) | 0 (0.0%) |
| Life, Physical & Social Science | 0 (0.0%) | 0 (0.0%) |
| Community & Social Service | 46 (31.3%) | 101 (68.7%) |
| Education, Arts & Media | 12 (33.3%) | 24 (66.7%) |
| Legal Services & Support | 7 (100.0%) | 0 (0.0%) |
| Education Instruction & Library | 27 (28.1%) | 69 (71.9%) |
| Arts, Media & Entertainment | 0 (0.0%) | 8 (100.0%) |
| Health Diagnosing & Treating | 26 (14.2%) | 157 (85.8%) |
| Health Technologists | 8 (12.9%) | 54 (87.1%) |
| Total (Category) | 285 (42.7%) | 383 (57.3%) |
| Total (Overall) | 790 (51.6%) | 742 (48.4%) |
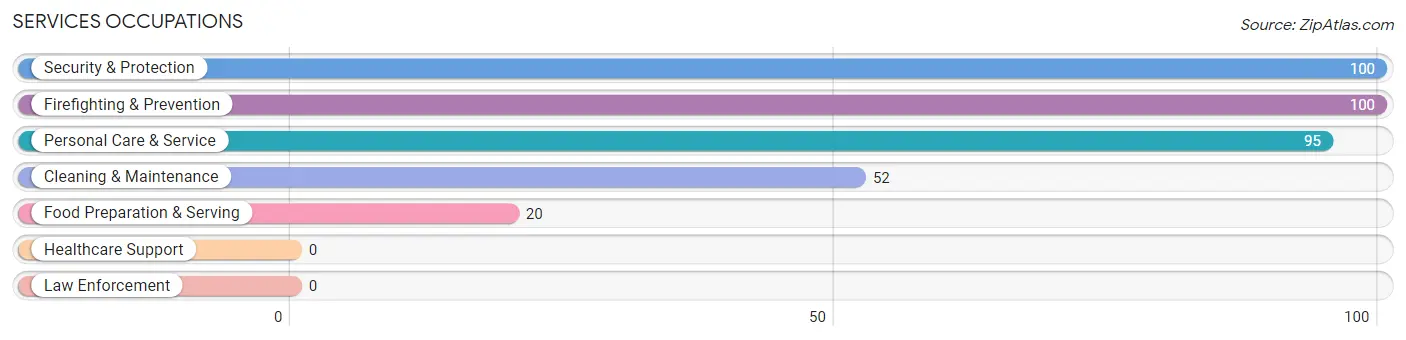
Services Occupations
The most common Services occupations in Southport are Security & Protection (100 | 6.5%), Firefighting & Prevention (100 | 6.5%), Personal Care & Service (95 | 6.2%), Cleaning & Maintenance (52 | 3.4%), and Food Preparation & Serving (20 | 1.3%).
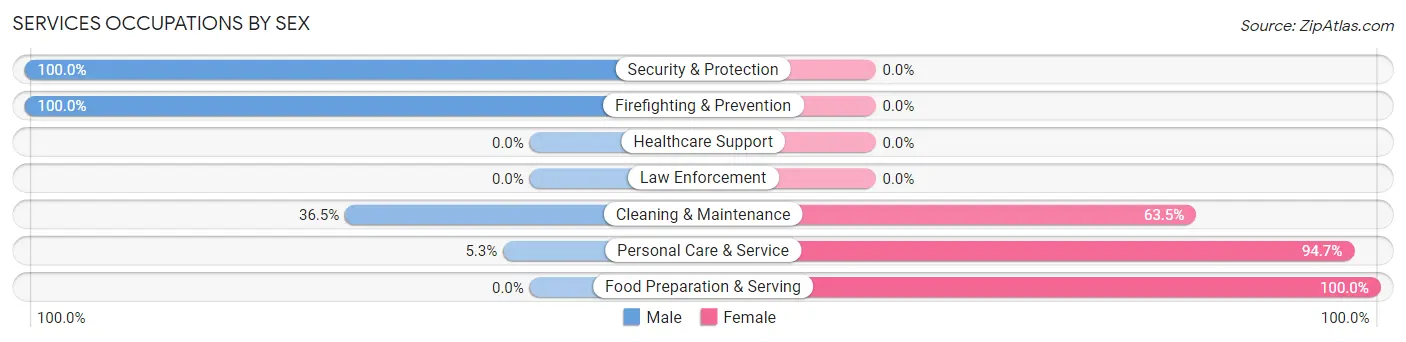
Services Occupations by Sex
Within the Services occupations in Southport, the most male-oriented occupations are Security & Protection (100.0%), Firefighting & Prevention (100.0%), and Cleaning & Maintenance (36.5%), while the most female-oriented occupations are Food Preparation & Serving (100.0%), Personal Care & Service (94.7%), and Cleaning & Maintenance (63.5%).
| Occupation | Male | Female |
| Healthcare Support | 0 (0.0%) | 0 (0.0%) |
| Security & Protection | 100 (100.0%) | 0 (0.0%) |
| Firefighting & Prevention | 100 (100.0%) | 0 (0.0%) |
| Law Enforcement | 0 (0.0%) | 0 (0.0%) |
| Food Preparation & Serving | 0 (0.0%) | 20 (100.0%) |
| Cleaning & Maintenance | 19 (36.5%) | 33 (63.5%) |
| Personal Care & Service | 5 (5.3%) | 90 (94.7%) |
| Total (Category) | 124 (46.4%) | 143 (53.6%) |
| Total (Overall) | 790 (51.6%) | 742 (48.4%) |
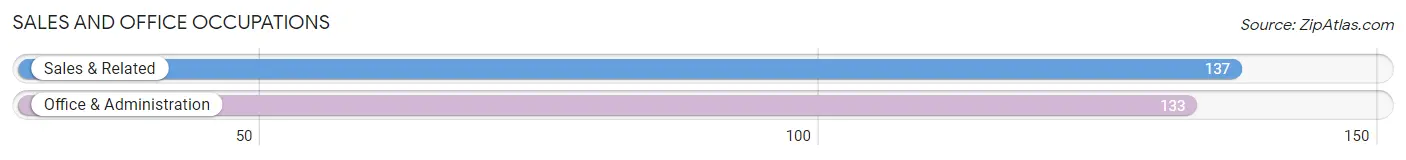
Sales and Office Occupations
The most common Sales and Office occupations in Southport are Sales & Related (137 | 8.9%), and Office & Administration (133 | 8.7%).
Sales and Office Occupations by Sex
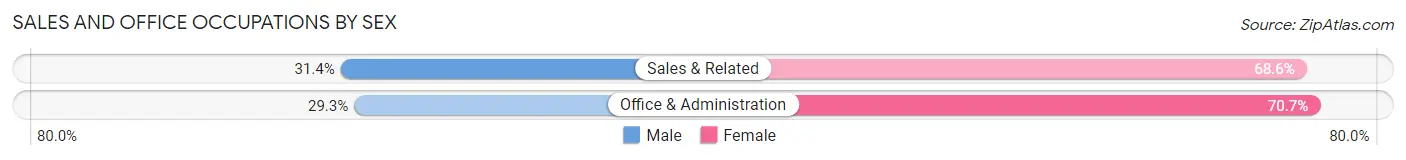
| Occupation | Male | Female |
| Sales & Related | 43 (31.4%) | 94 (68.6%) |
| Office & Administration | 39 (29.3%) | 94 (70.7%) |
| Total (Category) | 82 (30.4%) | 188 (69.6%) |
| Total (Overall) | 790 (51.6%) | 742 (48.4%) |
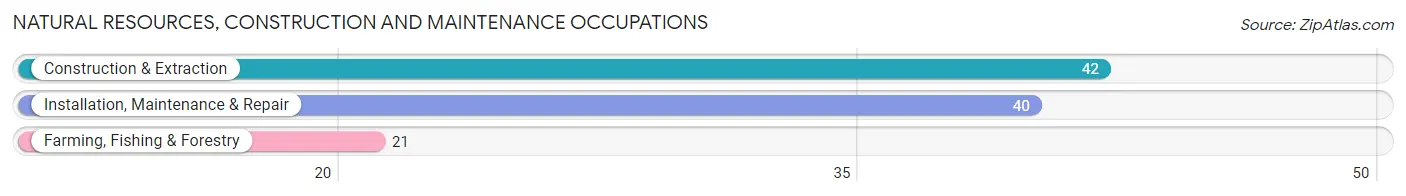
Natural Resources, Construction and Maintenance Occupations
The most common Natural Resources, Construction and Maintenance occupations in Southport are Construction & Extraction (42 | 2.7%), Installation, Maintenance & Repair (40 | 2.6%), and Farming, Fishing & Forestry (21 | 1.4%).
Natural Resources, Construction and Maintenance Occupations by Sex
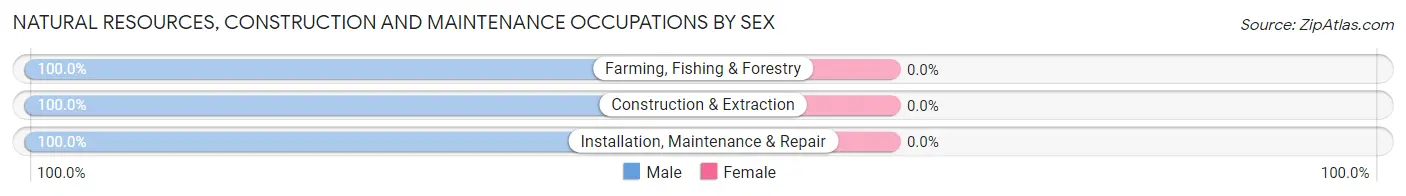
| Occupation | Male | Female |
| Farming, Fishing & Forestry | 21 (100.0%) | 0 (0.0%) |
| Construction & Extraction | 42 (100.0%) | 0 (0.0%) |
| Installation, Maintenance & Repair | 40 (100.0%) | 0 (0.0%) |
| Total (Category) | 103 (100.0%) | 0 (0.0%) |
| Total (Overall) | 790 (51.6%) | 742 (48.4%) |
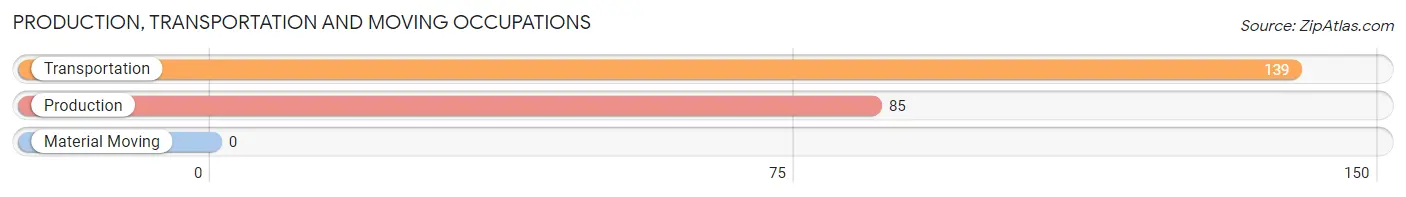
Production, Transportation and Moving Occupations
The most common Production, Transportation and Moving occupations in Southport are Transportation (139 | 9.1%), and Production (85 | 5.6%).
Production, Transportation and Moving Occupations by Sex
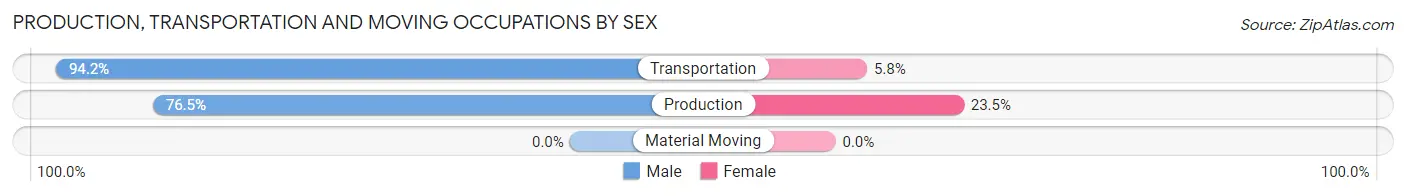
| Occupation | Male | Female |
| Production | 65 (76.5%) | 20 (23.5%) |
| Transportation | 131 (94.2%) | 8 (5.8%) |
| Material Moving | 0 (0.0%) | 0 (0.0%) |
| Total (Category) | 196 (87.5%) | 28 (12.5%) |
| Total (Overall) | 790 (51.6%) | 742 (48.4%) |
Employment Industries by Sex in Southport
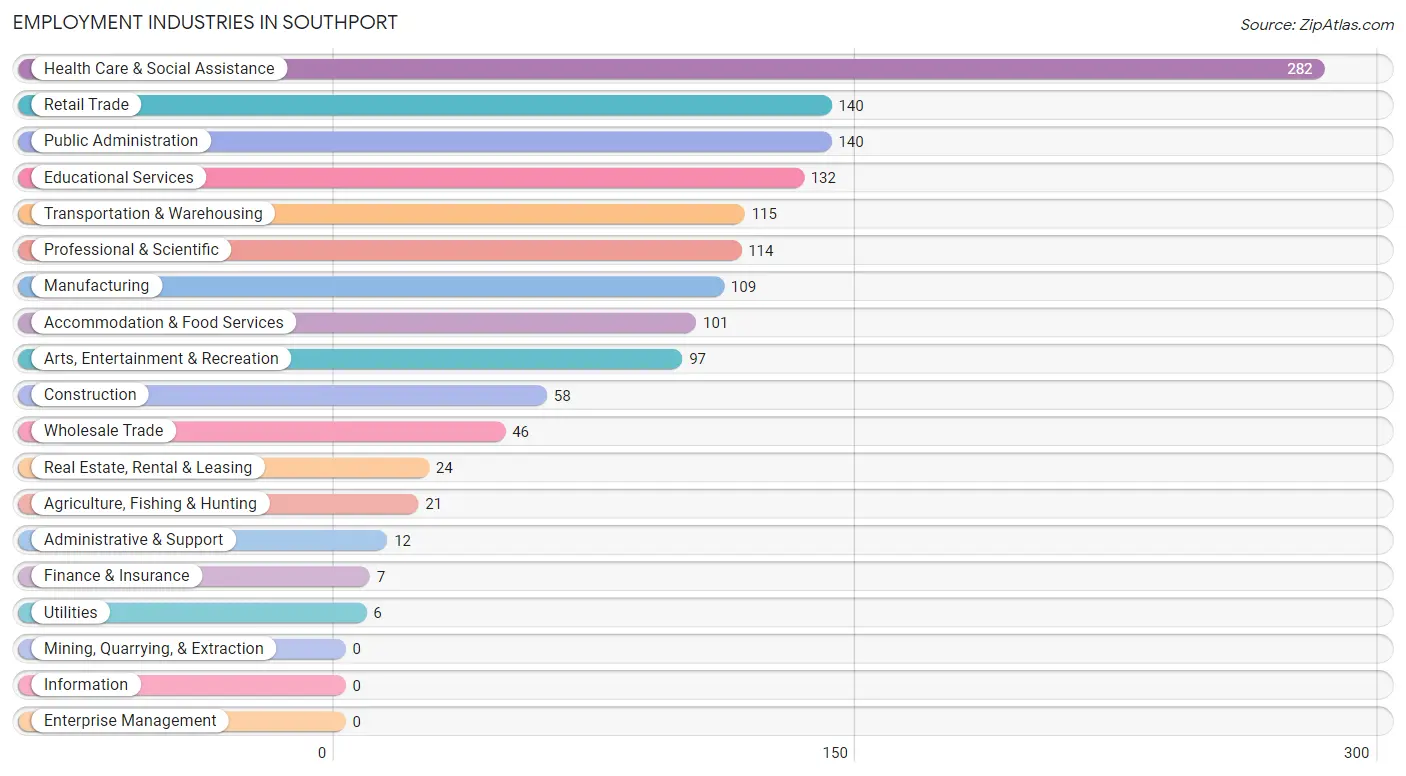
Employment Industries in Southport
The major employment industries in Southport include Health Care & Social Assistance (282 | 18.4%), Retail Trade (140 | 9.1%), Public Administration (140 | 9.1%), Educational Services (132 | 8.6%), and Transportation & Warehousing (115 | 7.5%).
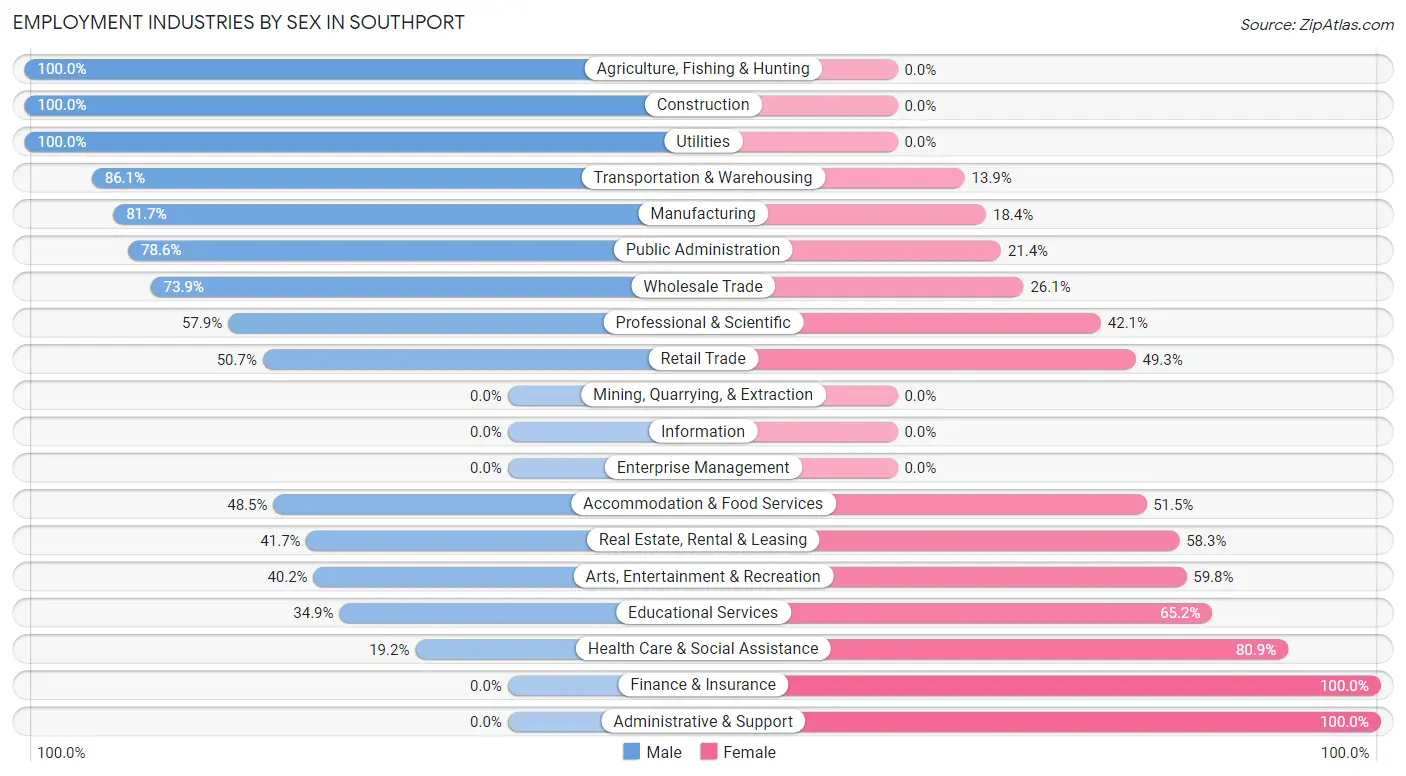
Employment Industries by Sex in Southport
The Southport industries that see more men than women are Agriculture, Fishing & Hunting (100.0%), Construction (100.0%), and Utilities (100.0%), whereas the industries that tend to have a higher number of women are Finance & Insurance (100.0%), Administrative & Support (100.0%), and Health Care & Social Assistance (80.8%).
| Industry | Male | Female |
| Agriculture, Fishing & Hunting | 21 (100.0%) | 0 (0.0%) |
| Mining, Quarrying, & Extraction | 0 (0.0%) | 0 (0.0%) |
| Construction | 58 (100.0%) | 0 (0.0%) |
| Manufacturing | 89 (81.7%) | 20 (18.3%) |
| Wholesale Trade | 34 (73.9%) | 12 (26.1%) |
| Retail Trade | 71 (50.7%) | 69 (49.3%) |
| Transportation & Warehousing | 99 (86.1%) | 16 (13.9%) |
| Utilities | 6 (100.0%) | 0 (0.0%) |
| Information | 0 (0.0%) | 0 (0.0%) |
| Finance & Insurance | 0 (0.0%) | 7 (100.0%) |
| Real Estate, Rental & Leasing | 10 (41.7%) | 14 (58.3%) |
| Professional & Scientific | 66 (57.9%) | 48 (42.1%) |
| Enterprise Management | 0 (0.0%) | 0 (0.0%) |
| Administrative & Support | 0 (0.0%) | 12 (100.0%) |
| Educational Services | 46 (34.8%) | 86 (65.1%) |
| Health Care & Social Assistance | 54 (19.2%) | 228 (80.8%) |
| Arts, Entertainment & Recreation | 39 (40.2%) | 58 (59.8%) |
| Accommodation & Food Services | 49 (48.5%) | 52 (51.5%) |
| Public Administration | 110 (78.6%) | 30 (21.4%) |
| Total | 790 (51.6%) | 742 (48.4%) |
Education in Southport
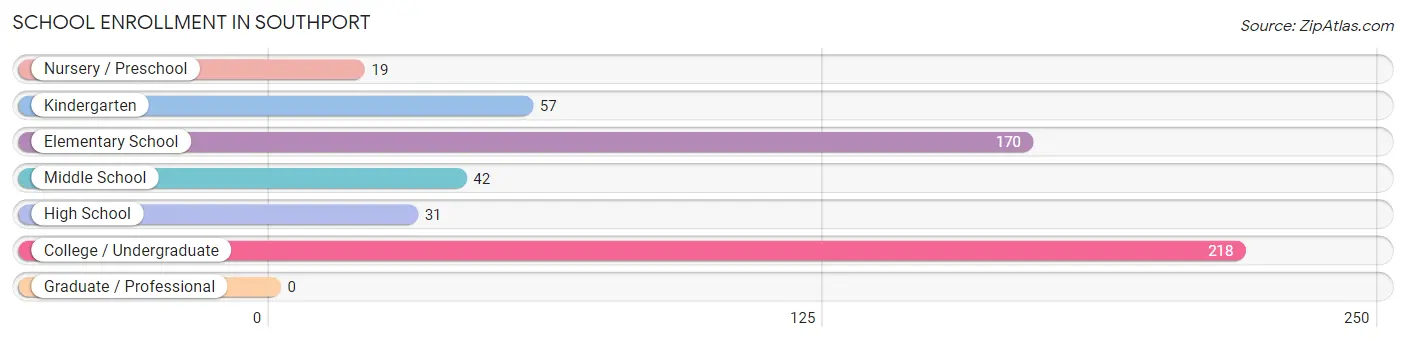
School Enrollment in Southport
The most common levels of schooling among the 537 students in Southport are college / undergraduate (218 | 40.6%), elementary school (170 | 31.7%), and kindergarten (57 | 10.6%).
| School Level | # Students | % Students |
| Nursery / Preschool | 19 | 3.5% |
| Kindergarten | 57 | 10.6% |
| Elementary School | 170 | 31.7% |
| Middle School | 42 | 7.8% |
| High School | 31 | 5.8% |
| College / Undergraduate | 218 | 40.6% |
| Graduate / Professional | 0 | 0.0% |
| Total | 537 | 100.0% |
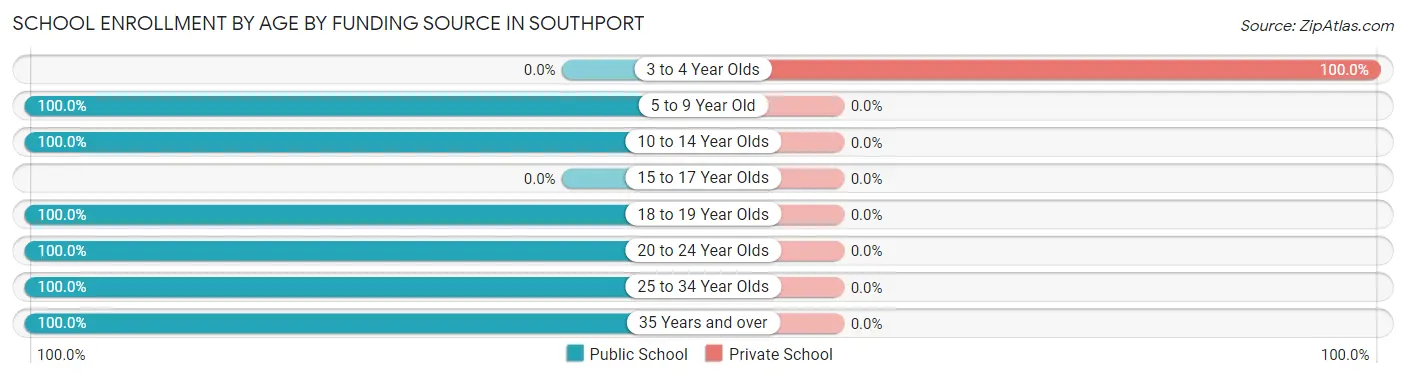
School Enrollment by Age by Funding Source in Southport
Out of a total of 537 students who are enrolled in schools in Southport, 19 (3.5%) attend a private institution, while the remaining 518 (96.5%) are enrolled in public schools. The age group of 3 to 4 year olds has the highest likelihood of being enrolled in private schools, with 19 (100.0% in the age bracket) enrolled. Conversely, the age group of 5 to 9 year old has the lowest likelihood of being enrolled in a private school, with 151 (100.0% in the age bracket) attending a public institution.
| Age Bracket | Public School | Private School |
| 3 to 4 Year Olds | 0 (0.0%) | 19 (100.0%) |
| 5 to 9 Year Old | 151 (100.0%) | 0 (0.0%) |
| 10 to 14 Year Olds | 149 (100.0%) | 0 (0.0%) |
| 15 to 17 Year Olds | 0 (0.0%) | 0 (0.0%) |
| 18 to 19 Year Olds | 15 (100.0%) | 0 (0.0%) |
| 20 to 24 Year Olds | 22 (100.0%) | 0 (0.0%) |
| 25 to 34 Year Olds | 79 (100.0%) | 0 (0.0%) |
| 35 Years and over | 102 (100.0%) | 0 (0.0%) |
| Total | 518 (96.5%) | 19 (3.5%) |
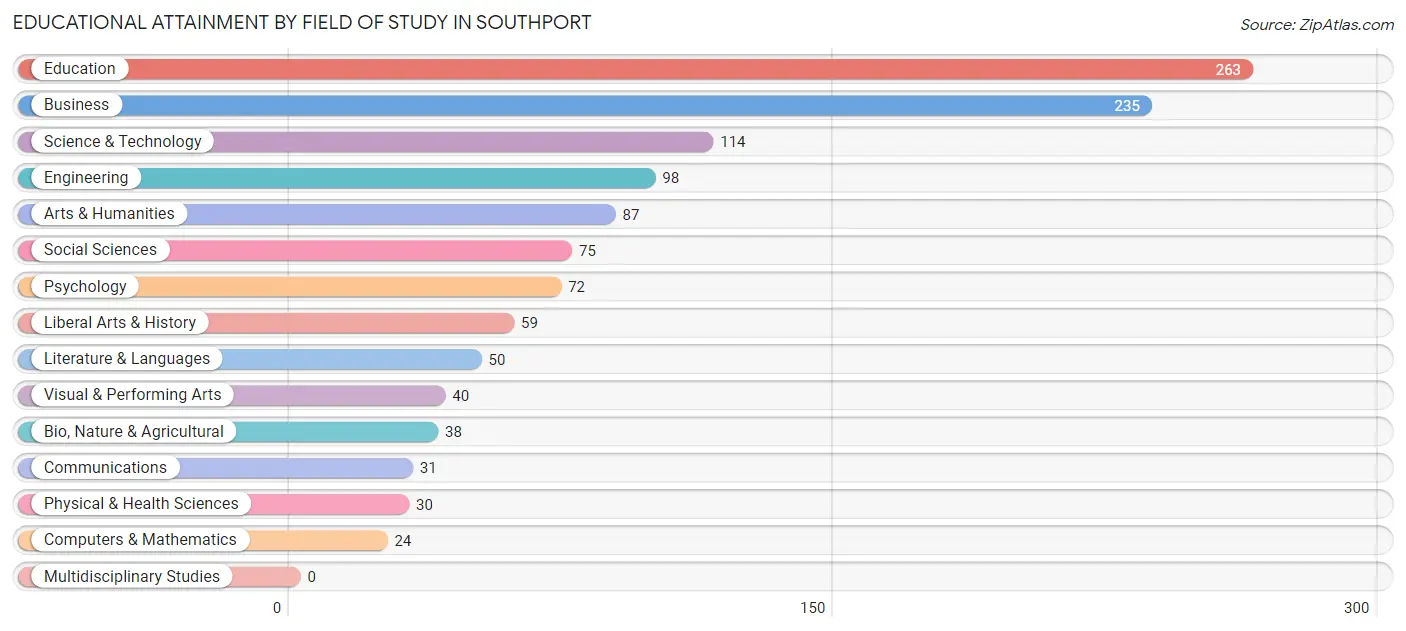
Educational Attainment by Field of Study in Southport
Education (263 | 21.6%), business (235 | 19.3%), science & technology (114 | 9.4%), engineering (98 | 8.1%), and arts & humanities (87 | 7.1%) are the most common fields of study among 1,216 individuals in Southport who have obtained a bachelor's degree or higher.
| Field of Study | # Graduates | % Graduates |
| Computers & Mathematics | 24 | 2.0% |
| Bio, Nature & Agricultural | 38 | 3.1% |
| Physical & Health Sciences | 30 | 2.5% |
| Psychology | 72 | 5.9% |
| Social Sciences | 75 | 6.2% |
| Engineering | 98 | 8.1% |
| Multidisciplinary Studies | 0 | 0.0% |
| Science & Technology | 114 | 9.4% |
| Business | 235 | 19.3% |
| Education | 263 | 21.6% |
| Literature & Languages | 50 | 4.1% |
| Liberal Arts & History | 59 | 4.9% |
| Visual & Performing Arts | 40 | 3.3% |
| Communications | 31 | 2.5% |
| Arts & Humanities | 87 | 7.1% |
| Total | 1,216 | 100.0% |
Transportation & Commute in Southport
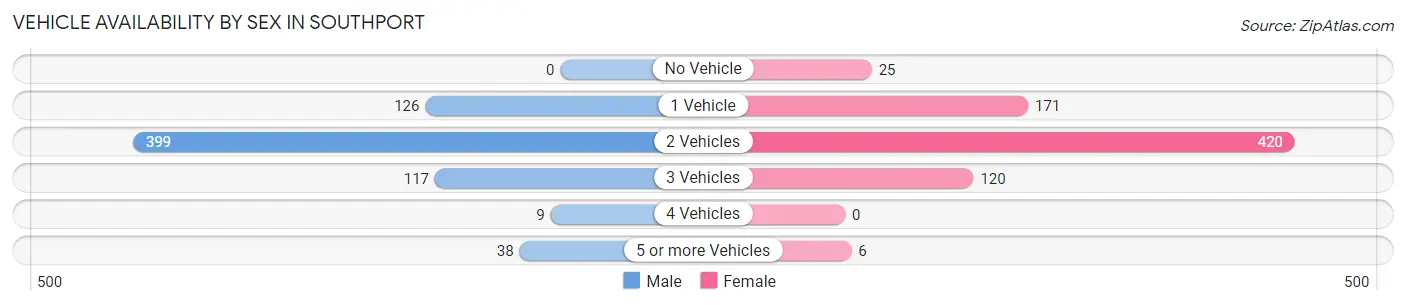
Vehicle Availability by Sex in Southport
The most prevalent vehicle ownership categories in Southport are males with 2 vehicles (399, accounting for 57.9%) and females with 2 vehicles (420, making up 53.8%).
| Vehicles Available | Male | Female |
| No Vehicle | 0 (0.0%) | 25 (3.4%) |
| 1 Vehicle | 126 (18.3%) | 171 (23.1%) |
| 2 Vehicles | 399 (57.9%) | 420 (56.6%) |
| 3 Vehicles | 117 (17.0%) | 120 (16.2%) |
| 4 Vehicles | 9 (1.3%) | 0 (0.0%) |
| 5 or more Vehicles | 38 (5.5%) | 6 (0.8%) |
| Total | 689 (100.0%) | 742 (100.0%) |
Commute Time in Southport
The most frequently occuring commute durations in Southport are 10 to 14 minutes (330 commuters, 27.3%), 5 to 9 minutes (249 commuters, 20.6%), and 45 to 59 minutes (135 commuters, 11.2%).
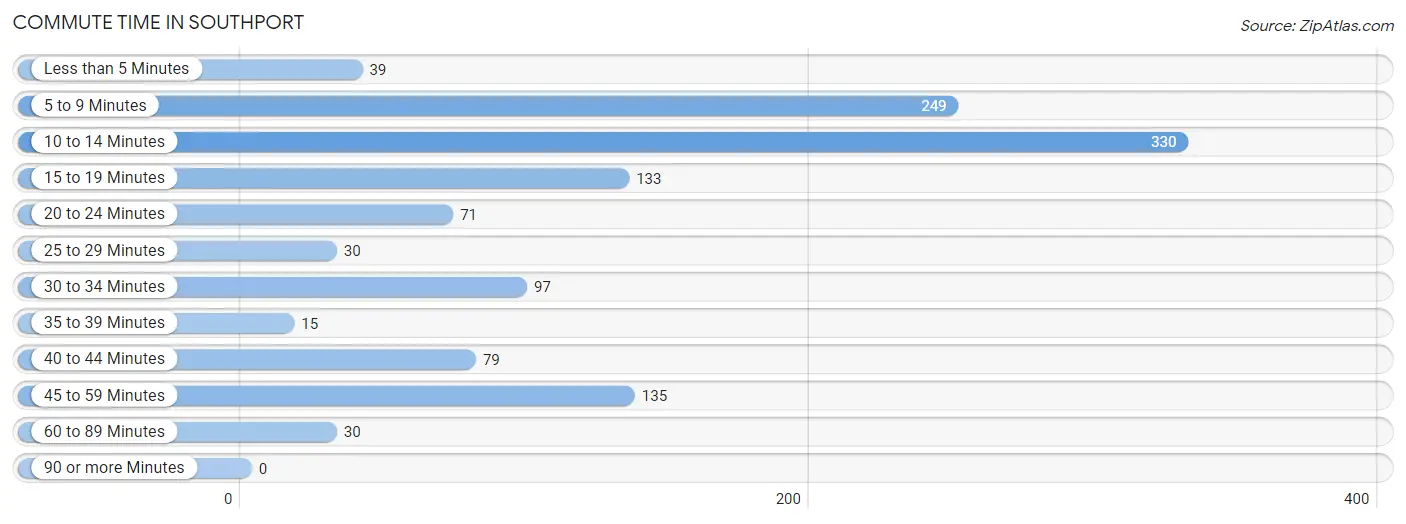
| Commute Time | # Commuters | % Commuters |
| Less than 5 Minutes | 39 | 3.2% |
| 5 to 9 Minutes | 249 | 20.6% |
| 10 to 14 Minutes | 330 | 27.3% |
| 15 to 19 Minutes | 133 | 11.0% |
| 20 to 24 Minutes | 71 | 5.9% |
| 25 to 29 Minutes | 30 | 2.5% |
| 30 to 34 Minutes | 97 | 8.0% |
| 35 to 39 Minutes | 15 | 1.2% |
| 40 to 44 Minutes | 79 | 6.5% |
| 45 to 59 Minutes | 135 | 11.2% |
| 60 to 89 Minutes | 30 | 2.5% |
| 90 or more Minutes | 0 | 0.0% |
Commute Time by Sex in Southport
The most common commute times in Southport are 5 to 9 minutes (116 commuters, 19.8%) for males and 10 to 14 minutes (240 commuters, 38.5%) for females.
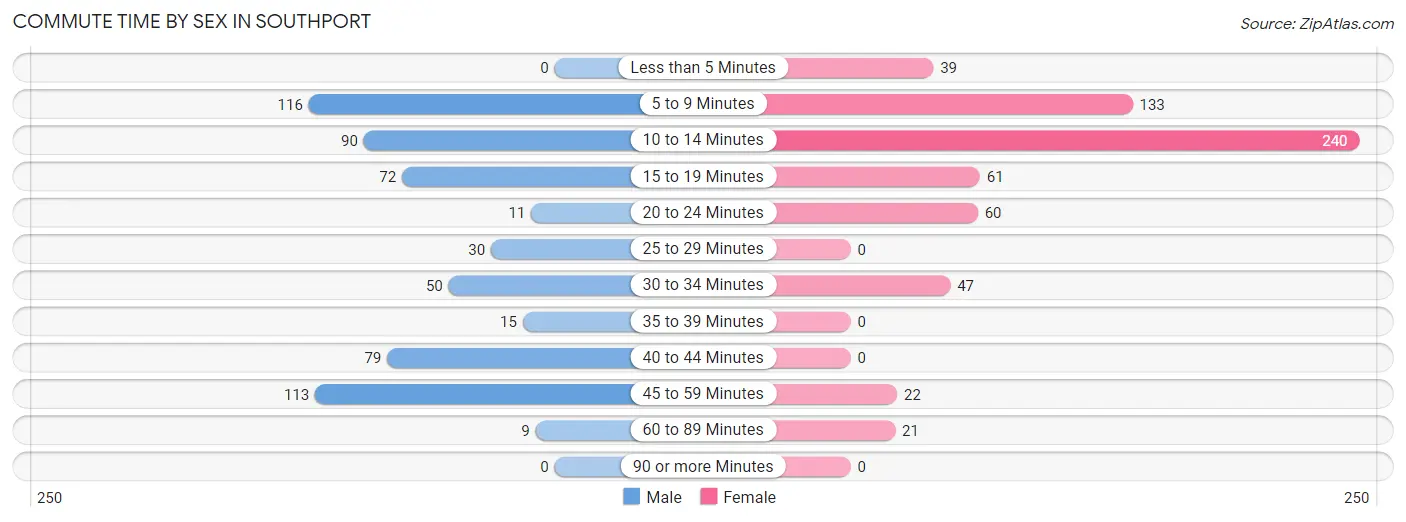
| Commute Time | Male | Female |
| Less than 5 Minutes | 0 (0.0%) | 39 (6.3%) |
| 5 to 9 Minutes | 116 (19.8%) | 133 (21.3%) |
| 10 to 14 Minutes | 90 (15.4%) | 240 (38.5%) |
| 15 to 19 Minutes | 72 (12.3%) | 61 (9.8%) |
| 20 to 24 Minutes | 11 (1.9%) | 60 (9.6%) |
| 25 to 29 Minutes | 30 (5.1%) | 0 (0.0%) |
| 30 to 34 Minutes | 50 (8.6%) | 47 (7.5%) |
| 35 to 39 Minutes | 15 (2.6%) | 0 (0.0%) |
| 40 to 44 Minutes | 79 (13.5%) | 0 (0.0%) |
| 45 to 59 Minutes | 113 (19.3%) | 22 (3.5%) |
| 60 to 89 Minutes | 9 (1.5%) | 21 (3.4%) |
| 90 or more Minutes | 0 (0.0%) | 0 (0.0%) |
Time of Departure to Work by Sex in Southport
The most frequent times of departure to work in Southport are 7:00 AM to 7:29 AM (120, 20.5%) for males and 4:00 PM to 11:59 PM (113, 18.1%) for females.
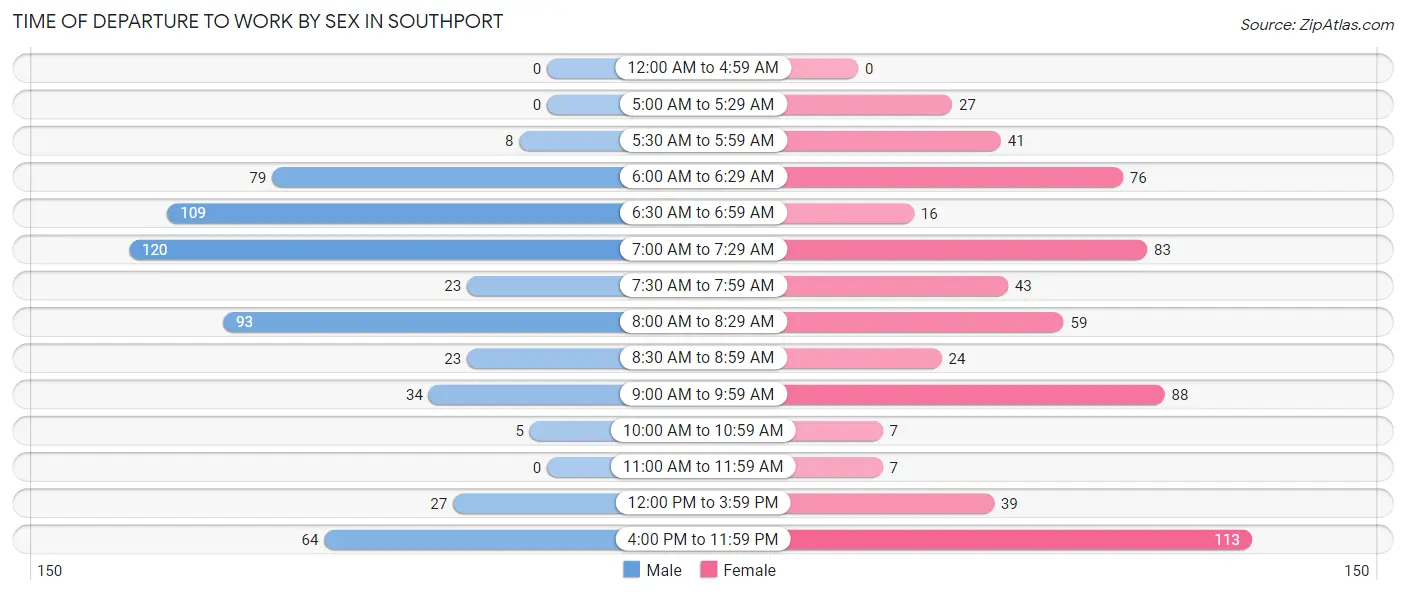
| Time of Departure | Male | Female |
| 12:00 AM to 4:59 AM | 0 (0.0%) | 0 (0.0%) |
| 5:00 AM to 5:29 AM | 0 (0.0%) | 27 (4.3%) |
| 5:30 AM to 5:59 AM | 8 (1.4%) | 41 (6.6%) |
| 6:00 AM to 6:29 AM | 79 (13.5%) | 76 (12.2%) |
| 6:30 AM to 6:59 AM | 109 (18.6%) | 16 (2.6%) |
| 7:00 AM to 7:29 AM | 120 (20.5%) | 83 (13.3%) |
| 7:30 AM to 7:59 AM | 23 (3.9%) | 43 (6.9%) |
| 8:00 AM to 8:29 AM | 93 (15.9%) | 59 (9.5%) |
| 8:30 AM to 8:59 AM | 23 (3.9%) | 24 (3.8%) |
| 9:00 AM to 9:59 AM | 34 (5.8%) | 88 (14.1%) |
| 10:00 AM to 10:59 AM | 5 (0.9%) | 7 (1.1%) |
| 11:00 AM to 11:59 AM | 0 (0.0%) | 7 (1.1%) |
| 12:00 PM to 3:59 PM | 27 (4.6%) | 39 (6.3%) |
| 4:00 PM to 11:59 PM | 64 (10.9%) | 113 (18.1%) |
| Total | 585 (100.0%) | 623 (100.0%) |
Housing Occupancy in Southport
Occupancy by Ownership in Southport
Of the total 1,749 dwellings in Southport, owner-occupied units account for 1,368 (78.2%), while renter-occupied units make up 381 (21.8%).
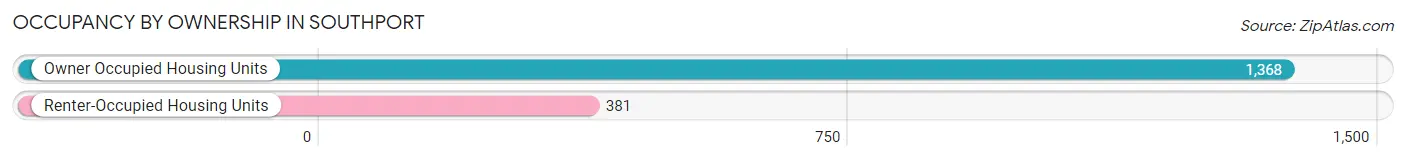
| Occupancy | # Housing Units | % Housing Units |
| Owner Occupied Housing Units | 1,368 | 78.2% |
| Renter-Occupied Housing Units | 381 | 21.8% |
| Total Occupied Housing Units | 1,749 | 100.0% |
Occupancy by Household Size in Southport
| Household Size | # Housing Units | % Housing Units |
| 1-Person Household | 449 | 25.7% |
| 2-Person Household | 933 | 53.3% |
| 3-Person Household | 201 | 11.5% |
| 4+ Person Household | 166 | 9.5% |
| Total Housing Units | 1,749 | 100.0% |
Occupancy by Ownership by Household Size in Southport
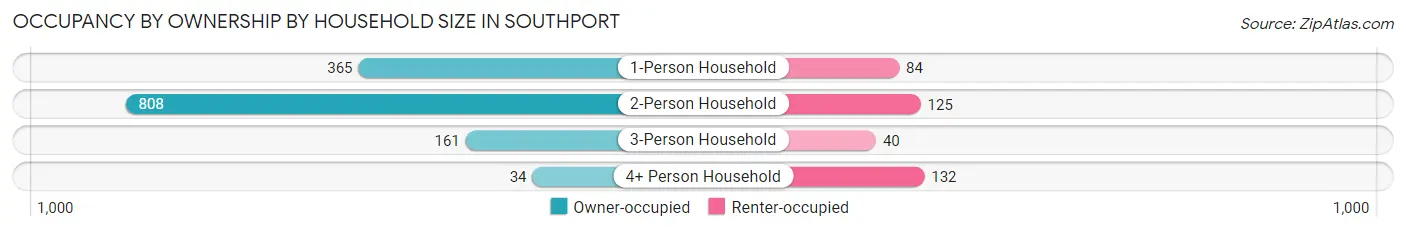
| Household Size | Owner-occupied | Renter-occupied |
| 1-Person Household | 365 (81.3%) | 84 (18.7%) |
| 2-Person Household | 808 (86.6%) | 125 (13.4%) |
| 3-Person Household | 161 (80.1%) | 40 (19.9%) |
| 4+ Person Household | 34 (20.5%) | 132 (79.5%) |
| Total Housing Units | 1,368 (78.2%) | 381 (21.8%) |
Occupancy by Educational Attainment in Southport
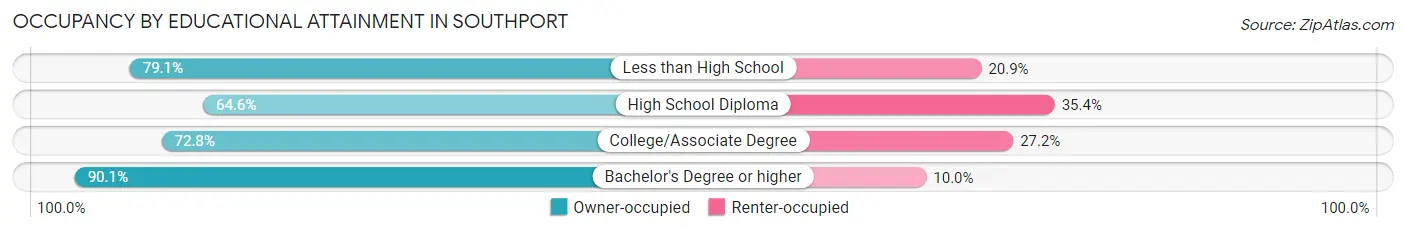
| Household Size | Owner-occupied | Renter-occupied |
| Less than High School | 91 (79.1%) | 24 (20.9%) |
| High School Diploma | 146 (64.6%) | 80 (35.4%) |
| College/Associate Degree | 579 (72.8%) | 216 (27.2%) |
| Bachelor's Degree or higher | 552 (90.0%) | 61 (10.0%) |
Occupancy by Age of Householder in Southport
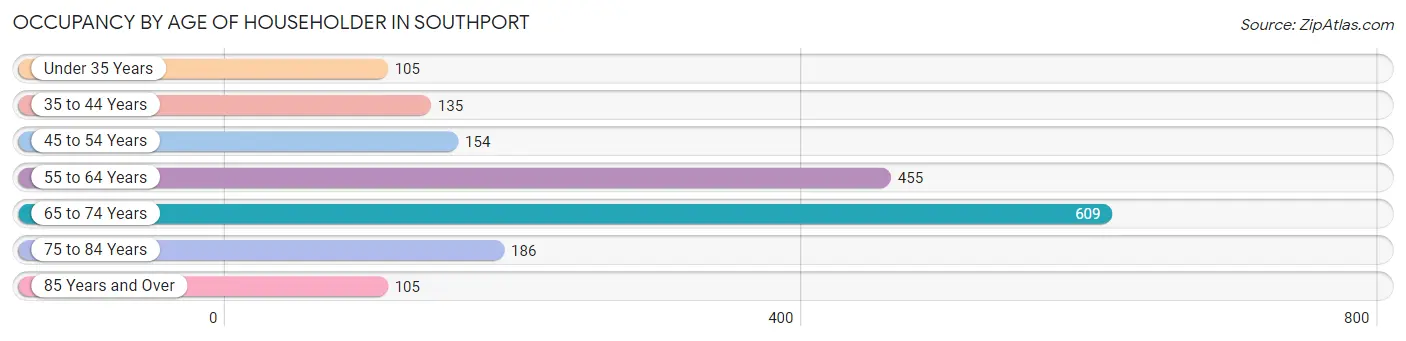
| Age Bracket | # Households | % Households |
| Under 35 Years | 105 | 6.0% |
| 35 to 44 Years | 135 | 7.7% |
| 45 to 54 Years | 154 | 8.8% |
| 55 to 64 Years | 455 | 26.0% |
| 65 to 74 Years | 609 | 34.8% |
| 75 to 84 Years | 186 | 10.6% |
| 85 Years and Over | 105 | 6.0% |
| Total | 1,749 | 100.0% |
Housing Finances in Southport
Median Income by Occupancy in Southport
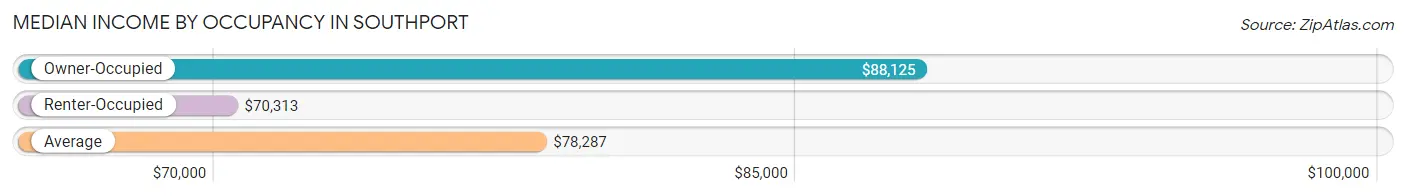
| Occupancy Type | # Households | Median Income |
| Owner-Occupied | 1,368 (78.2%) | $88,125 |
| Renter-Occupied | 381 (21.8%) | $70,313 |
| Average | 1,749 (100.0%) | $78,287 |
Occupancy by Householder Income Bracket in Southport
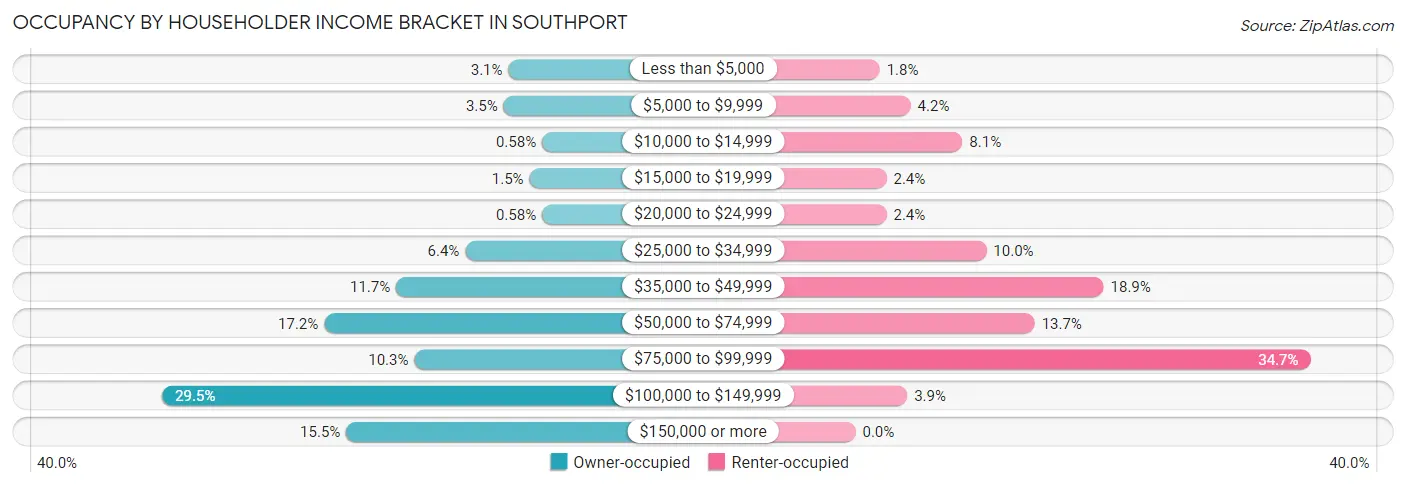
| Income Bracket | Owner-occupied | Renter-occupied |
| Less than $5,000 | 43 (3.1%) | 7 (1.8%) |
| $5,000 to $9,999 | 48 (3.5%) | 16 (4.2%) |
| $10,000 to $14,999 | 8 (0.6%) | 31 (8.1%) |
| $15,000 to $19,999 | 21 (1.5%) | 9 (2.4%) |
| $20,000 to $24,999 | 8 (0.6%) | 9 (2.4%) |
| $25,000 to $34,999 | 88 (6.4%) | 38 (10.0%) |
| $35,000 to $49,999 | 160 (11.7%) | 72 (18.9%) |
| $50,000 to $74,999 | 235 (17.2%) | 52 (13.7%) |
| $75,000 to $99,999 | 141 (10.3%) | 132 (34.6%) |
| $100,000 to $149,999 | 404 (29.5%) | 15 (3.9%) |
| $150,000 or more | 212 (15.5%) | 0 (0.0%) |
| Total | 1,368 (100.0%) | 381 (100.0%) |
Monthly Housing Cost Tiers in Southport
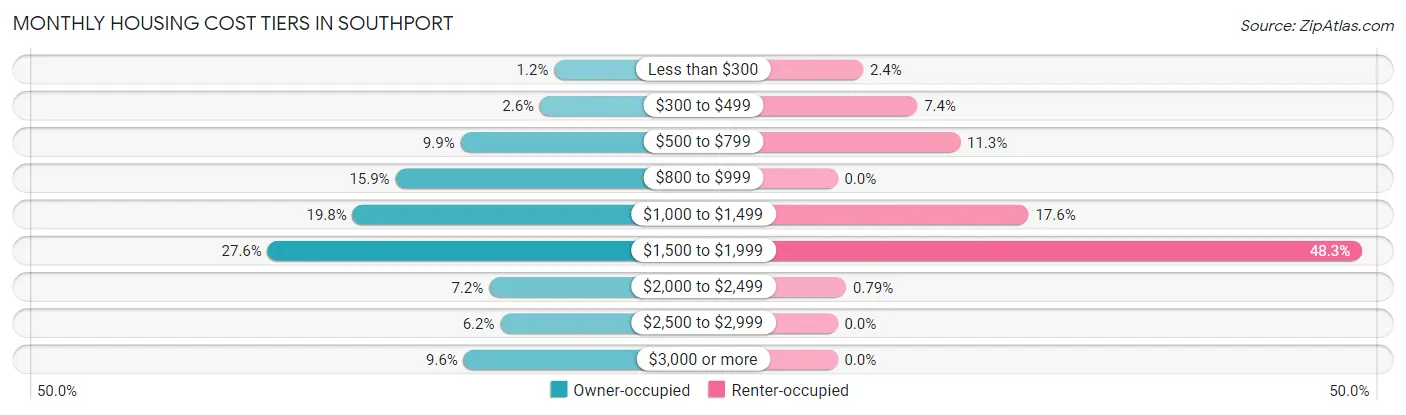
| Monthly Cost | Owner-occupied | Renter-occupied |
| Less than $300 | 17 (1.2%) | 9 (2.4%) |
| $300 to $499 | 35 (2.6%) | 28 (7.3%) |
| $500 to $799 | 135 (9.9%) | 43 (11.3%) |
| $800 to $999 | 217 (15.9%) | 0 (0.0%) |
| $1,000 to $1,499 | 271 (19.8%) | 67 (17.6%) |
| $1,500 to $1,999 | 378 (27.6%) | 184 (48.3%) |
| $2,000 to $2,499 | 99 (7.2%) | 3 (0.8%) |
| $2,500 to $2,999 | 85 (6.2%) | 0 (0.0%) |
| $3,000 or more | 131 (9.6%) | 0 (0.0%) |
| Total | 1,368 (100.0%) | 381 (100.0%) |
Physical Housing Characteristics in Southport
Housing Structures in Southport
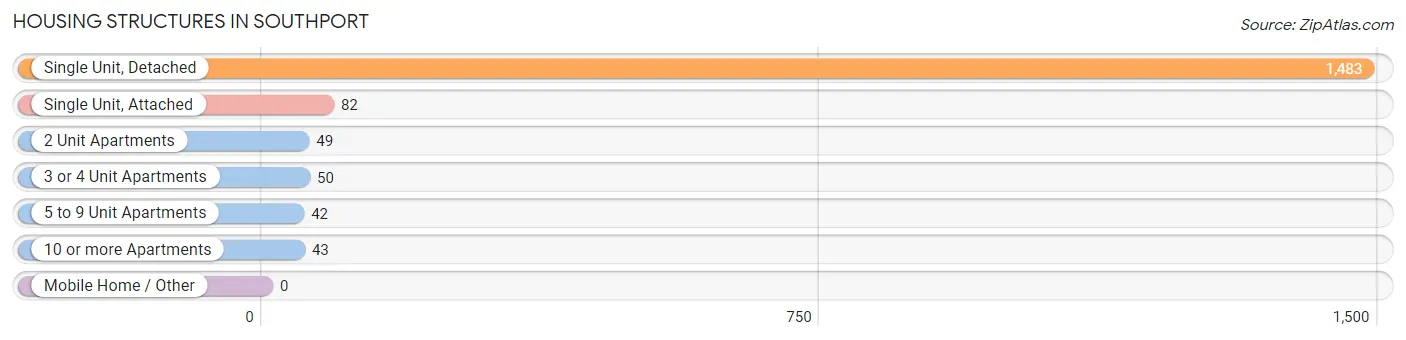
| Structure Type | # Housing Units | % Housing Units |
| Single Unit, Detached | 1,483 | 84.8% |
| Single Unit, Attached | 82 | 4.7% |
| 2 Unit Apartments | 49 | 2.8% |
| 3 or 4 Unit Apartments | 50 | 2.9% |
| 5 to 9 Unit Apartments | 42 | 2.4% |
| 10 or more Apartments | 43 | 2.5% |
| Mobile Home / Other | 0 | 0.0% |
| Total | 1,749 | 100.0% |
Housing Structures by Occupancy in Southport
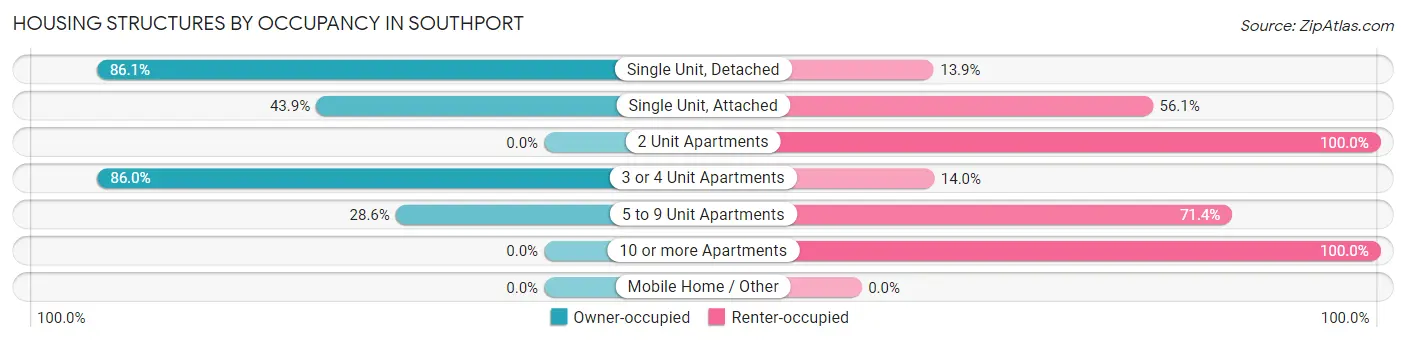
| Structure Type | Owner-occupied | Renter-occupied |
| Single Unit, Detached | 1,277 (86.1%) | 206 (13.9%) |
| Single Unit, Attached | 36 (43.9%) | 46 (56.1%) |
| 2 Unit Apartments | 0 (0.0%) | 49 (100.0%) |
| 3 or 4 Unit Apartments | 43 (86.0%) | 7 (14.0%) |
| 5 to 9 Unit Apartments | 12 (28.6%) | 30 (71.4%) |
| 10 or more Apartments | 0 (0.0%) | 43 (100.0%) |
| Mobile Home / Other | 0 (0.0%) | 0 (0.0%) |
| Total | 1,368 (78.2%) | 381 (21.8%) |
Housing Structures by Number of Rooms in Southport
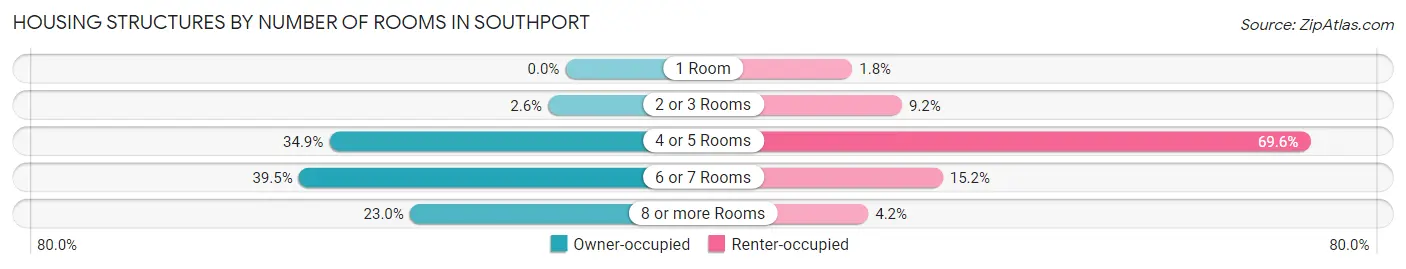
| Number of Rooms | Owner-occupied | Renter-occupied |
| 1 Room | 0 (0.0%) | 7 (1.8%) |
| 2 or 3 Rooms | 35 (2.6%) | 35 (9.2%) |
| 4 or 5 Rooms | 478 (34.9%) | 265 (69.6%) |
| 6 or 7 Rooms | 540 (39.5%) | 58 (15.2%) |
| 8 or more Rooms | 315 (23.0%) | 16 (4.2%) |
| Total | 1,368 (100.0%) | 381 (100.0%) |
Housing Structure by Heating Type in Southport
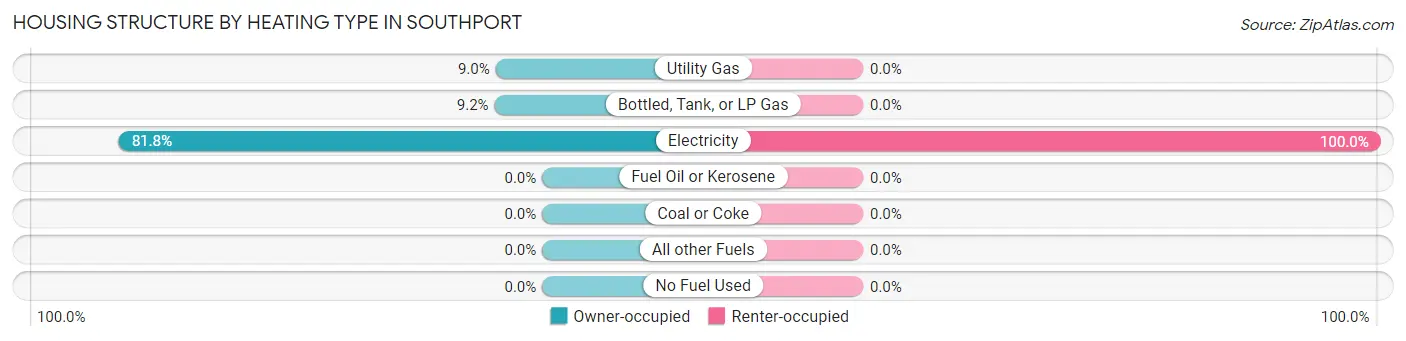
| Heating Type | Owner-occupied | Renter-occupied |
| Utility Gas | 123 (9.0%) | 0 (0.0%) |
| Bottled, Tank, or LP Gas | 126 (9.2%) | 0 (0.0%) |
| Electricity | 1,119 (81.8%) | 381 (100.0%) |
| Fuel Oil or Kerosene | 0 (0.0%) | 0 (0.0%) |
| Coal or Coke | 0 (0.0%) | 0 (0.0%) |
| All other Fuels | 0 (0.0%) | 0 (0.0%) |
| No Fuel Used | 0 (0.0%) | 0 (0.0%) |
| Total | 1,368 (100.0%) | 381 (100.0%) |
Household Vehicle Usage in Southport
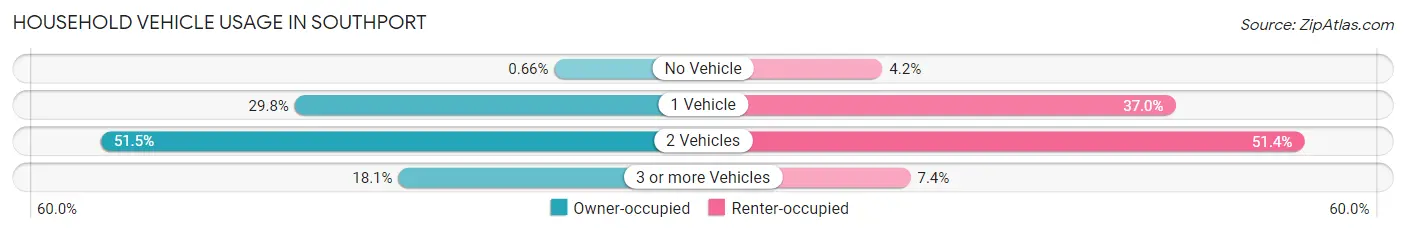
| Vehicles per Household | Owner-occupied | Renter-occupied |
| No Vehicle | 9 (0.7%) | 16 (4.2%) |
| 1 Vehicle | 407 (29.7%) | 141 (37.0%) |
| 2 Vehicles | 704 (51.5%) | 196 (51.4%) |
| 3 or more Vehicles | 248 (18.1%) | 28 (7.3%) |
| Total | 1,368 (100.0%) | 381 (100.0%) |
Real Estate & Mortgages in Southport
Real Estate and Mortgage Overview in Southport
| Characteristic | Without Mortgage | With Mortgage |
| Housing Units | 434 | 934 |
| Median Property Value | $361,300 | $329,700 |
| Median Household Income | $63,830 | $200 |
| Monthly Housing Costs | $830 | $131 |
| Real Estate Taxes | $2,616 | $24 |
Property Value by Mortgage Status in Southport
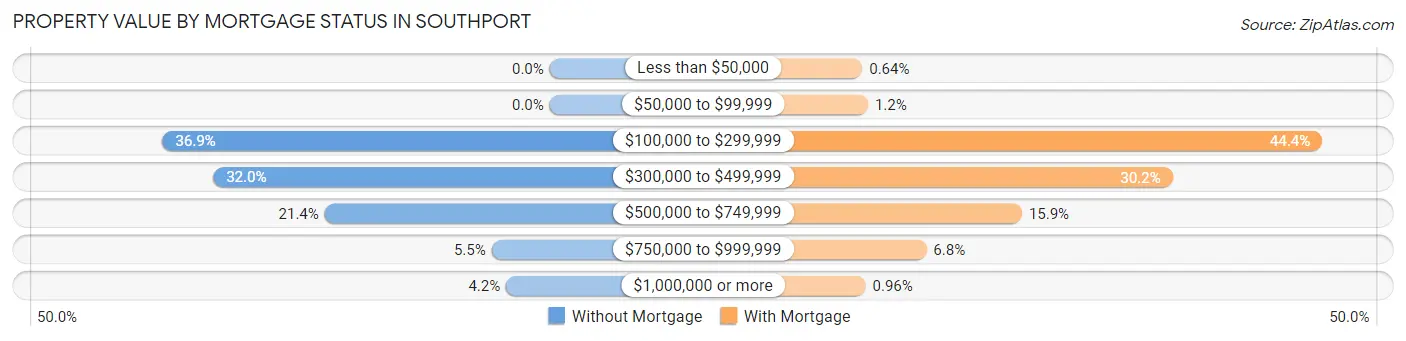
| Property Value | Without Mortgage | With Mortgage |
| Less than $50,000 | 0 (0.0%) | 6 (0.6%) |
| $50,000 to $99,999 | 0 (0.0%) | 11 (1.2%) |
| $100,000 to $299,999 | 160 (36.9%) | 415 (44.4%) |
| $300,000 to $499,999 | 139 (32.0%) | 282 (30.2%) |
| $500,000 to $749,999 | 93 (21.4%) | 148 (15.9%) |
| $750,000 to $999,999 | 24 (5.5%) | 63 (6.8%) |
| $1,000,000 or more | 18 (4.2%) | 9 (1.0%) |
| Total | 434 (100.0%) | 934 (100.0%) |
Household Income by Mortgage Status in Southport
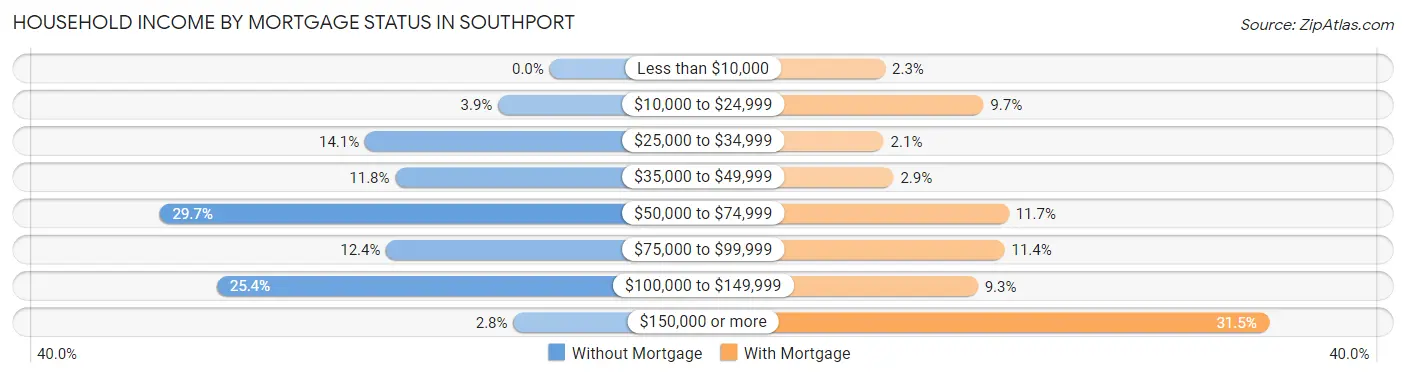
| Household Income | Without Mortgage | With Mortgage |
| Less than $10,000 | 0 (0.0%) | 21 (2.2%) |
| $10,000 to $24,999 | 17 (3.9%) | 91 (9.7%) |
| $25,000 to $34,999 | 61 (14.1%) | 20 (2.1%) |
| $35,000 to $49,999 | 51 (11.7%) | 27 (2.9%) |
| $50,000 to $74,999 | 129 (29.7%) | 109 (11.7%) |
| $75,000 to $99,999 | 54 (12.4%) | 106 (11.4%) |
| $100,000 to $149,999 | 110 (25.4%) | 87 (9.3%) |
| $150,000 or more | 12 (2.8%) | 294 (31.5%) |
| Total | 434 (100.0%) | 934 (100.0%) |
Property Value to Household Income Ratio in Southport
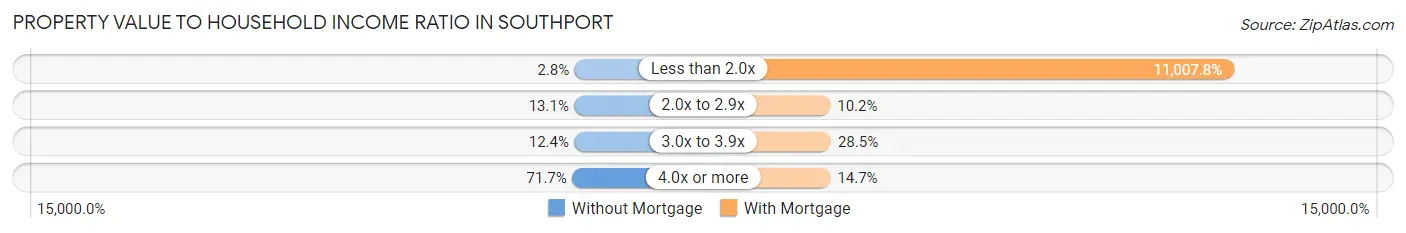
| Value-to-Income Ratio | Without Mortgage | With Mortgage |
| Less than 2.0x | 12 (2.8%) | 102,813 (11,007.8%) |
| 2.0x to 2.9x | 57 (13.1%) | 95 (10.2%) |
| 3.0x to 3.9x | 54 (12.4%) | 266 (28.5%) |
| 4.0x or more | 311 (71.7%) | 137 (14.7%) |
| Total | 434 (100.0%) | 934 (100.0%) |
Real Estate Taxes by Mortgage Status in Southport
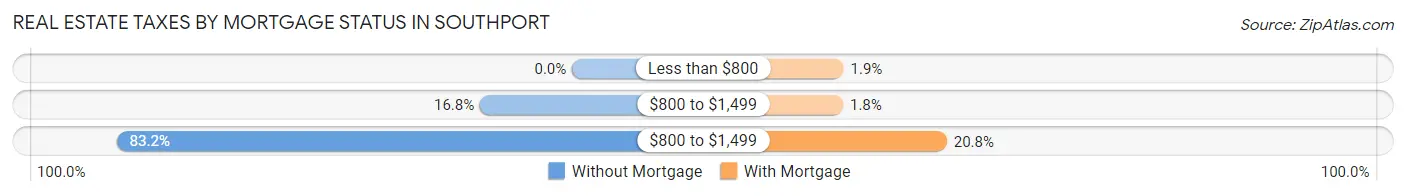
| Property Taxes | Without Mortgage | With Mortgage |
| Less than $800 | 0 (0.0%) | 18 (1.9%) |
| $800 to $1,499 | 73 (16.8%) | 17 (1.8%) |
| $800 to $1,499 | 361 (83.2%) | 194 (20.8%) |
| Total | 434 (100.0%) | 934 (100.0%) |
Health & Disability in Southport
Health Insurance Coverage by Age in Southport
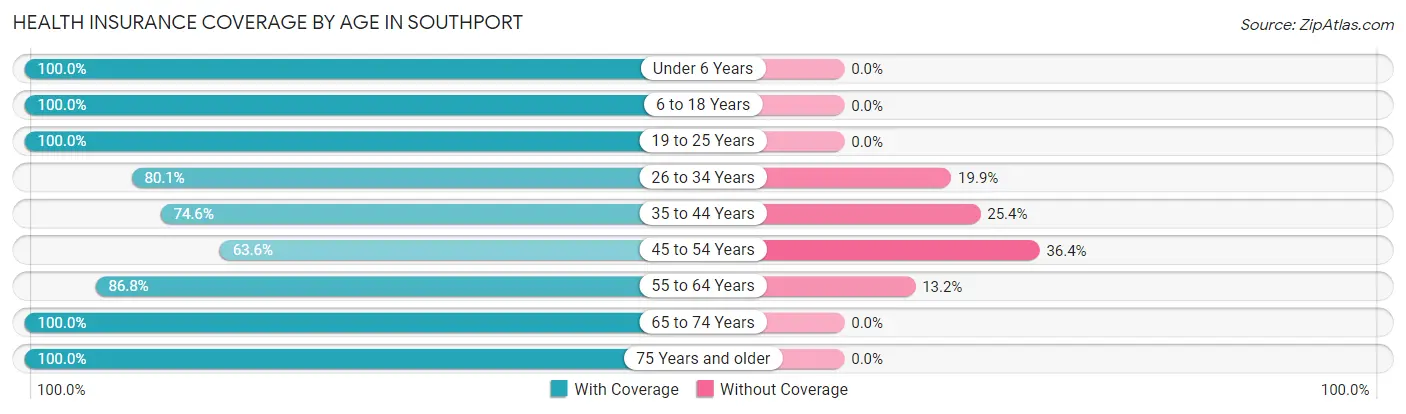
| Age Bracket | With Coverage | Without Coverage |
| Under 6 Years | 298 (100.0%) | 0 (0.0%) |
| 6 to 18 Years | 243 (100.0%) | 0 (0.0%) |
| 19 to 25 Years | 113 (100.0%) | 0 (0.0%) |
| 26 to 34 Years | 241 (80.1%) | 60 (19.9%) |
| 35 to 44 Years | 209 (74.6%) | 71 (25.4%) |
| 45 to 54 Years | 236 (63.6%) | 135 (36.4%) |
| 55 to 64 Years | 617 (86.8%) | 94 (13.2%) |
| 65 to 74 Years | 1,054 (100.0%) | 0 (0.0%) |
| 75 Years and older | 470 (100.0%) | 0 (0.0%) |
| Total | 3,481 (90.6%) | 360 (9.4%) |
Health Insurance Coverage by Citizenship Status in Southport
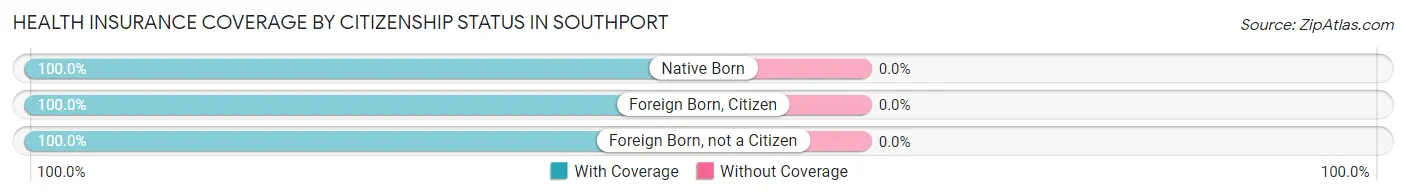
| Citizenship Status | With Coverage | Without Coverage |
| Native Born | 298 (100.0%) | 0 (0.0%) |
| Foreign Born, Citizen | 243 (100.0%) | 0 (0.0%) |
| Foreign Born, not a Citizen | 113 (100.0%) | 0 (0.0%) |
Health Insurance Coverage by Household Income in Southport
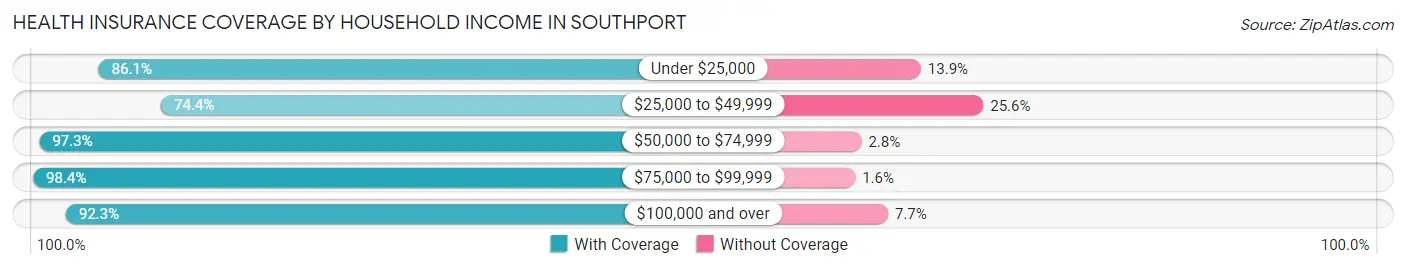
| Household Income | With Coverage | Without Coverage |
| Under $25,000 | 211 (86.1%) | 34 (13.9%) |
| $25,000 to $49,999 | 518 (74.4%) | 178 (25.6%) |
| $50,000 to $74,999 | 566 (97.3%) | 16 (2.8%) |
| $75,000 to $99,999 | 746 (98.4%) | 12 (1.6%) |
| $100,000 and over | 1,433 (92.3%) | 120 (7.7%) |
Public vs Private Health Insurance Coverage by Age in Southport
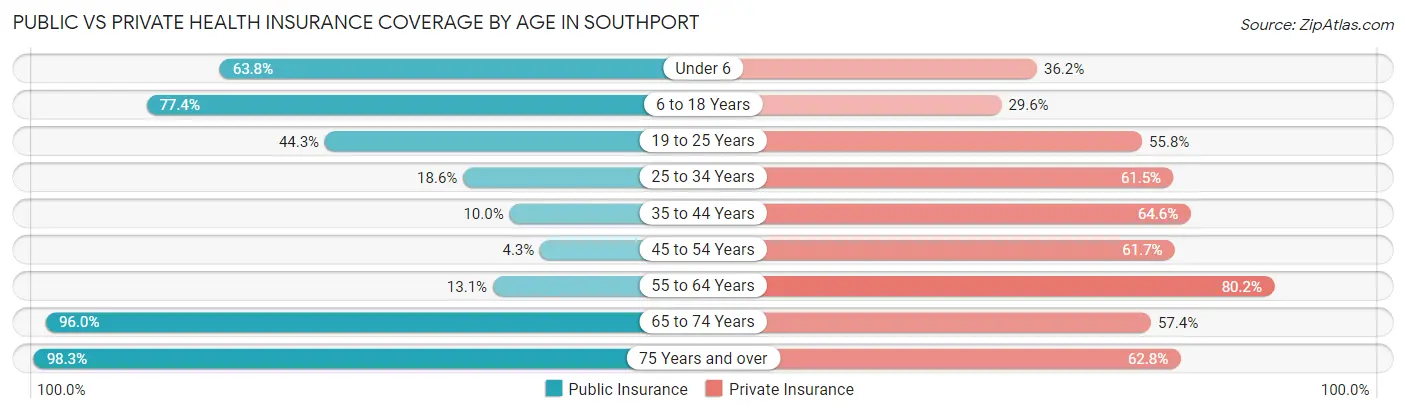
| Age Bracket | Public Insurance | Private Insurance |
| Under 6 | 190 (63.8%) | 108 (36.2%) |
| 6 to 18 Years | 188 (77.4%) | 72 (29.6%) |
| 19 to 25 Years | 50 (44.3%) | 63 (55.7%) |
| 25 to 34 Years | 56 (18.6%) | 185 (61.5%) |
| 35 to 44 Years | 28 (10.0%) | 181 (64.6%) |
| 45 to 54 Years | 16 (4.3%) | 229 (61.7%) |
| 55 to 64 Years | 93 (13.1%) | 570 (80.2%) |
| 65 to 74 Years | 1,012 (96.0%) | 605 (57.4%) |
| 75 Years and over | 462 (98.3%) | 295 (62.8%) |
| Total | 2,095 (54.5%) | 2,308 (60.1%) |
Disability Status by Sex by Age in Southport
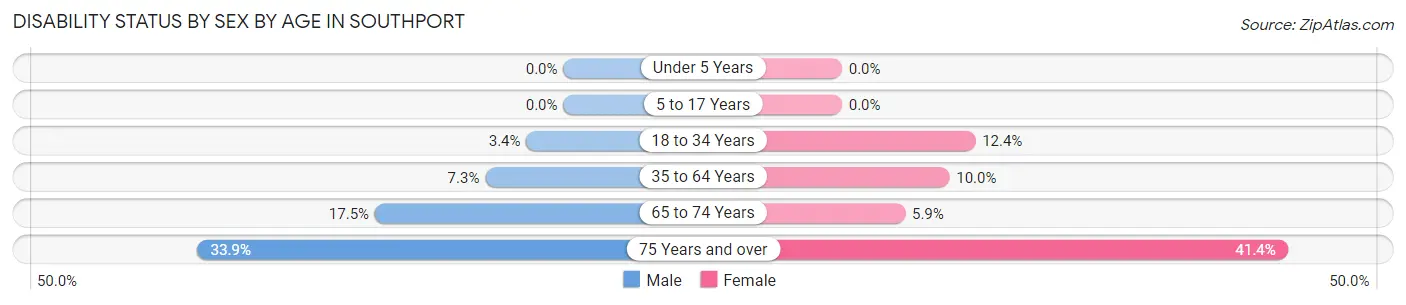
| Age Bracket | Male | Female |
| Under 5 Years | 0 (0.0%) | 0 (0.0%) |
| 5 to 17 Years | 0 (0.0%) | 0 (0.0%) |
| 18 to 34 Years | 7 (3.4%) | 26 (12.4%) |
| 35 to 64 Years | 37 (7.2%) | 85 (10.0%) |
| 65 to 74 Years | 92 (17.5%) | 31 (5.9%) |
| 75 Years and over | 75 (33.9%) | 103 (41.4%) |
Disability Class by Sex by Age in Southport
Disability Class: Hearing Difficulty
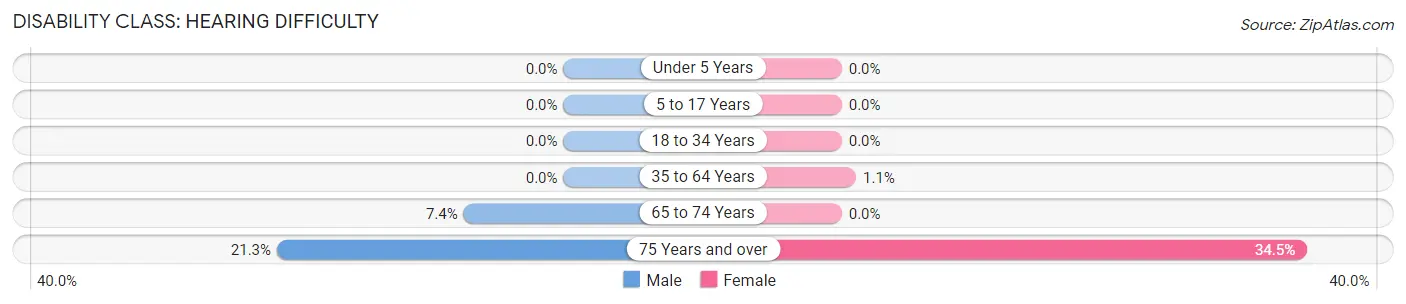
| Age Bracket | Male | Female |
| Under 5 Years | 0 (0.0%) | 0 (0.0%) |
| 5 to 17 Years | 0 (0.0%) | 0 (0.0%) |
| 18 to 34 Years | 0 (0.0%) | 0 (0.0%) |
| 35 to 64 Years | 0 (0.0%) | 9 (1.1%) |
| 65 to 74 Years | 39 (7.4%) | 0 (0.0%) |
| 75 Years and over | 47 (21.3%) | 86 (34.5%) |
Disability Class: Vision Difficulty
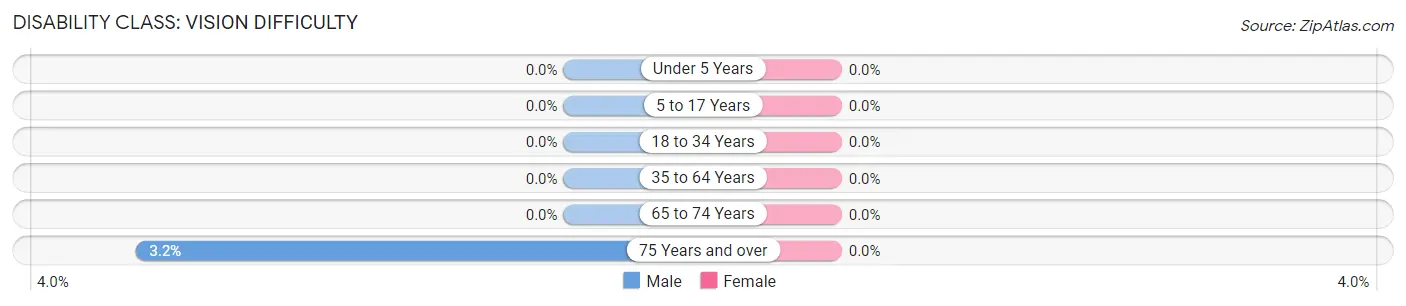
| Age Bracket | Male | Female |
| Under 5 Years | 0 (0.0%) | 0 (0.0%) |
| 5 to 17 Years | 0 (0.0%) | 0 (0.0%) |
| 18 to 34 Years | 0 (0.0%) | 0 (0.0%) |
| 35 to 64 Years | 0 (0.0%) | 0 (0.0%) |
| 65 to 74 Years | 0 (0.0%) | 0 (0.0%) |
| 75 Years and over | 7 (3.2%) | 0 (0.0%) |
Disability Class: Cognitive Difficulty
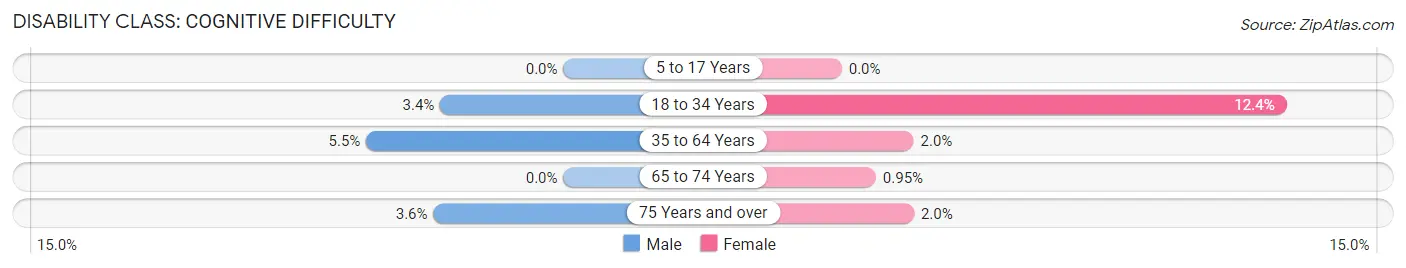
| Age Bracket | Male | Female |
| 5 to 17 Years | 0 (0.0%) | 0 (0.0%) |
| 18 to 34 Years | 7 (3.4%) | 26 (12.4%) |
| 35 to 64 Years | 28 (5.5%) | 17 (2.0%) |
| 65 to 74 Years | 0 (0.0%) | 5 (0.9%) |
| 75 Years and over | 8 (3.6%) | 5 (2.0%) |
Disability Class: Ambulatory Difficulty
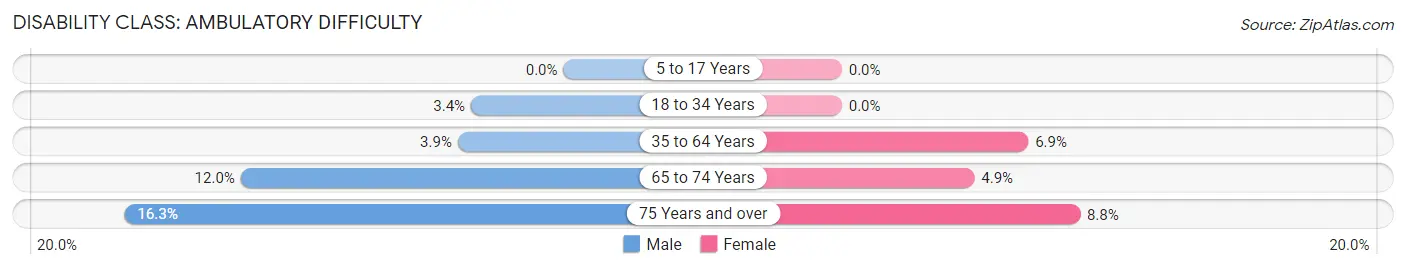
| Age Bracket | Male | Female |
| 5 to 17 Years | 0 (0.0%) | 0 (0.0%) |
| 18 to 34 Years | 7 (3.4%) | 0 (0.0%) |
| 35 to 64 Years | 20 (3.9%) | 59 (6.9%) |
| 65 to 74 Years | 63 (12.0%) | 26 (4.9%) |
| 75 Years and over | 36 (16.3%) | 22 (8.8%) |
Disability Class: Self-Care Difficulty
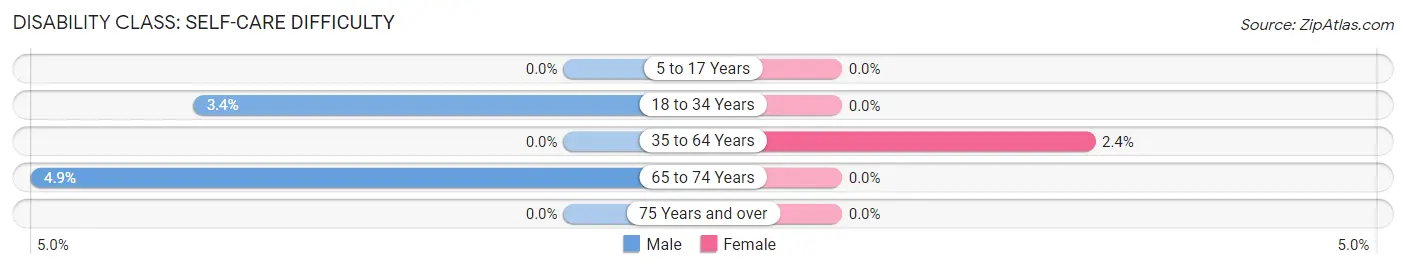
| Age Bracket | Male | Female |
| 5 to 17 Years | 0 (0.0%) | 0 (0.0%) |
| 18 to 34 Years | 7 (3.4%) | 0 (0.0%) |
| 35 to 64 Years | 0 (0.0%) | 20 (2.4%) |
| 65 to 74 Years | 26 (4.9%) | 0 (0.0%) |
| 75 Years and over | 0 (0.0%) | 0 (0.0%) |
Technology Access in Southport
Computing Device Access in Southport

| Device Type | # Households | % Households |
| Desktop or Laptop | 1,535 | 87.8% |
| Smartphone | 1,561 | 89.2% |
| Tablet | 1,187 | 67.9% |
| No Computing Device | 119 | 6.8% |
| Total | 1,749 | 100.0% |
Internet Access in Southport
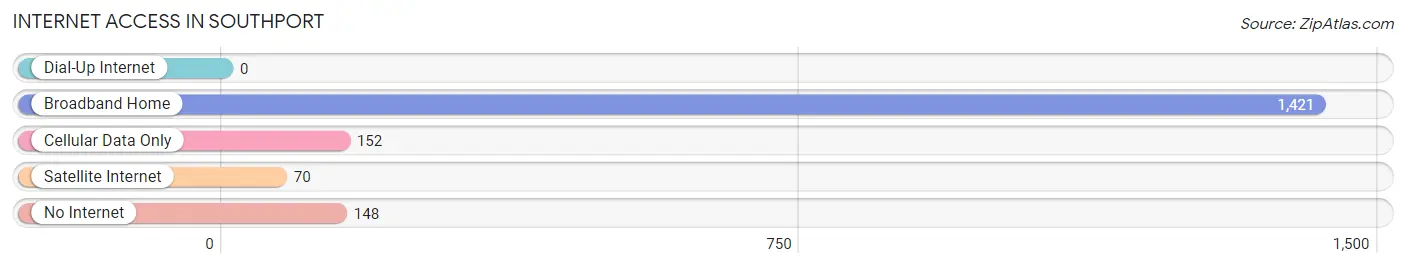
| Internet Type | # Households | % Households |
| Dial-Up Internet | 0 | 0.0% |
| Broadband Home | 1,421 | 81.2% |
| Cellular Data Only | 152 | 8.7% |
| Satellite Internet | 70 | 4.0% |
| No Internet | 148 | 8.5% |
| Total | 1,749 | 100.0% |
Southport Summary
Southport is a small town located in Brunswick County, North Carolina. It is situated on the Cape Fear River, approximately 30 miles south of Wilmington. The town has a population of approximately 2,500 people and is known for its historic downtown area, which is listed on the National Register of Historic Places.
Geography
Southport is located in the southeastern corner of North Carolina, on the Cape Fear River. It is bordered by the towns of Oak Island to the north, Boiling Spring Lakes to the east, and Bolivia to the south. The town is situated on a peninsula, with the Cape Fear River to the west and the Intracoastal Waterway to the east. The town is approximately 30 miles south of Wilmington and is accessible by car via US Highway 17.
Climate
Southport has a humid subtropical climate, with hot, humid summers and mild winters. The average annual temperature is around 70 degrees Fahrenheit, with temperatures reaching the mid-90s in the summer months and the mid-50s in the winter months. The town receives an average of 48 inches of precipitation per year, with most of it falling in the summer months.
Economy
Southport’s economy is largely based on tourism and fishing. The town is home to several marinas, which attract visitors from all over the country. The town also has a thriving seafood industry, with several restaurants and seafood markets. In addition, the town is home to several small businesses, including retail stores, art galleries, and antique shops.
Demographics
As of the 2010 census, Southport had a population of 2,517 people. The racial makeup of the town was 94.3% White, 2.3% African American, 0.7% Native American, 0.7% Asian, 0.2% Pacific Islander, and 1.7% from two or more races. The median household income was $41,944, and the median family income was $50,917.
History
Southport was founded in 1792 by a group of settlers from New England. The town was originally known as Smithville, but was later renamed Southport in 1887. The town was an important port during the Civil War, and was the site of several battles. After the war, the town experienced a period of growth, with the construction of several hotels and other businesses. In the late 19th century, the town became a popular tourist destination, and many of the historic buildings in the downtown area were built during this time. In the early 20th century, the town experienced a decline in population, but has since seen a resurgence in recent years.
Southport is a small town with a rich history and a vibrant economy. It is home to a diverse population and is a popular tourist destination. The town is known for its historic downtown area, which is listed on the National Register of Historic Places. Southport is a great place to live, work, and visit, and is sure to continue to be a thriving community for years to come.
Common Questions
What is Per Capita Income in Southport?
Per Capita income in Southport is $42,236.
What is the Median Family Income in Southport?
Median Family Income in Southport is $89,044.
What is the Median Household income in Southport?
Median Household Income in Southport is $78,287.
What is Income or Wage Gap in Southport?
Income or Wage Gap in Southport is 7.6%.
Women in Southport earn 92.4 cents for every dollar earned by a man.
What is Inequality or Gini Index in Southport?
Inequality or Gini Index in Southport is 0.40.
What is the Total Population of Southport?
Total Population of Southport is 4,015.
What is the Total Male Population of Southport?
Total Male Population of Southport is 1,870.
What is the Total Female Population of Southport?
Total Female Population of Southport is 2,145.
What is the Ratio of Males per 100 Females in Southport?
There are 87.18 Males per 100 Females in Southport.
What is the Ratio of Females per 100 Males in Southport?
There are 114.71 Females per 100 Males in Southport.
What is the Median Population Age in Southport?
Median Population Age in Southport is 61.4 Years.
What is the Average Family Size in Southport
Average Family Size in Southport is 2.5 People.
What is the Average Household Size in Southport
Average Household Size in Southport is 2.2 People.
How Large is the Labor Force in Southport?
There are 1,542 People in the Labor Forcein in Southport.
What is the Percentage of People in the Labor Force in Southport?
44.4% of People are in the Labor Force in Southport.
What is the Unemployment Rate in Southport?
Unemployment Rate in Southport is 0.8%.