Rocky Point, NC Map & Demographics
Rocky Point Map
Rocky Point Overview
$29,029
PER CAPITA INCOME
$50,500
AVG FAMILY INCOME
$47,500
AVG HOUSEHOLD INCOME
0.43
INEQUALITY / GINI INDEX
940
TOTAL POPULATION
551
MALE POPULATION
389
FEMALE POPULATION
141.65
MALES / 100 FEMALES
70.60
FEMALES / 100 MALES
40.3
MEDIAN AGE
3.2
AVG FAMILY SIZE
2.3
AVG HOUSEHOLD SIZE
495
LABOR FORCE [ PEOPLE ]
66.4%
PERCENT IN LABOR FORCE
7.5%
UNEMPLOYMENT RATE
Rocky Point Zip Codes
Rocky Point Area Codes
Income in Rocky Point
Income Overview in Rocky Point
Per Capita Income in Rocky Point is $29,029, while median incomes of families and households are $50,500 and $47,500 respectively.
| Characteristic | Number | Measure |
| Per Capita Income | 940 | $29,029 |
| Median Family Income | 226 | $50,500 |
| Mean Family Income | 226 | $70,756 |
| Median Household Income | 412 | $47,500 |
| Mean Household Income | 412 | $65,187 |
| Income Deficit | 226 | $0 |
| Wage / Income Gap (%) | 940 | 0.00% |
| Wage / Income Gap ($) | 940 | 100.00¢ per $1 |
| Gini / Inequality Index | 940 | 0.43 |
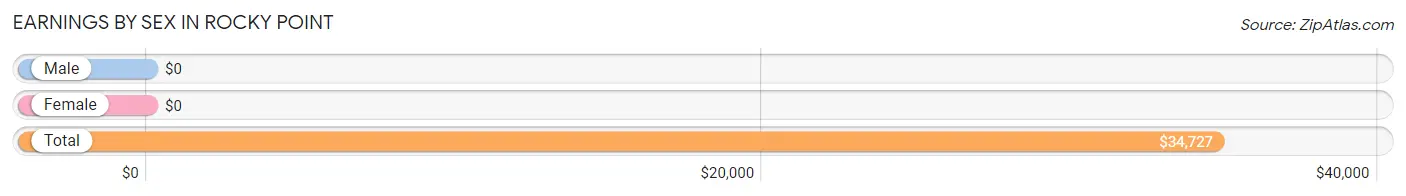
Earnings by Sex in Rocky Point
| Sex | Number | Average Earnings |
| Male | 281 (59.2%) | $0 |
| Female | 194 (40.8%) | $0 |
| Total | 475 (100.0%) | $34,727 |
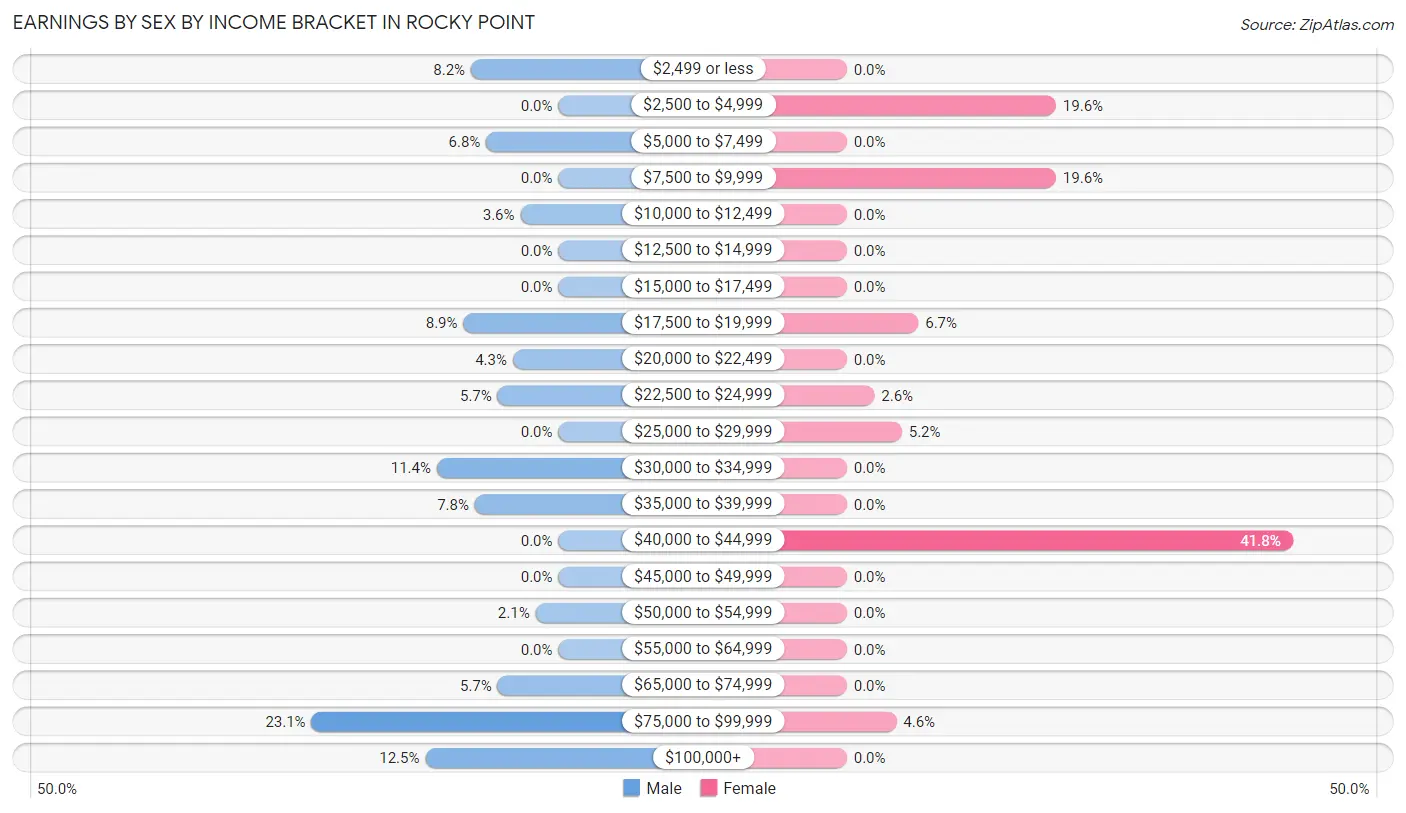
Earnings by Sex by Income Bracket in Rocky Point
The most common earnings brackets in Rocky Point are $75,000 to $99,999 for men (65 | 23.1%) and $40,000 to $44,999 for women (81 | 41.7%).
| Income | Male | Female |
| $2,499 or less | 23 (8.2%) | 0 (0.0%) |
| $2,500 to $4,999 | 0 (0.0%) | 38 (19.6%) |
| $5,000 to $7,499 | 19 (6.8%) | 0 (0.0%) |
| $7,500 to $9,999 | 0 (0.0%) | 38 (19.6%) |
| $10,000 to $12,499 | 10 (3.6%) | 0 (0.0%) |
| $12,500 to $14,999 | 0 (0.0%) | 0 (0.0%) |
| $15,000 to $17,499 | 0 (0.0%) | 0 (0.0%) |
| $17,500 to $19,999 | 25 (8.9%) | 13 (6.7%) |
| $20,000 to $22,499 | 12 (4.3%) | 0 (0.0%) |
| $22,500 to $24,999 | 16 (5.7%) | 5 (2.6%) |
| $25,000 to $29,999 | 0 (0.0%) | 10 (5.1%) |
| $30,000 to $34,999 | 32 (11.4%) | 0 (0.0%) |
| $35,000 to $39,999 | 22 (7.8%) | 0 (0.0%) |
| $40,000 to $44,999 | 0 (0.0%) | 81 (41.7%) |
| $45,000 to $49,999 | 0 (0.0%) | 0 (0.0%) |
| $50,000 to $54,999 | 6 (2.1%) | 0 (0.0%) |
| $55,000 to $64,999 | 0 (0.0%) | 0 (0.0%) |
| $65,000 to $74,999 | 16 (5.7%) | 0 (0.0%) |
| $75,000 to $99,999 | 65 (23.1%) | 9 (4.6%) |
| $100,000+ | 35 (12.5%) | 0 (0.0%) |
| Total | 281 (100.0%) | 194 (100.0%) |
Earnings by Sex by Educational Attainment in Rocky Point
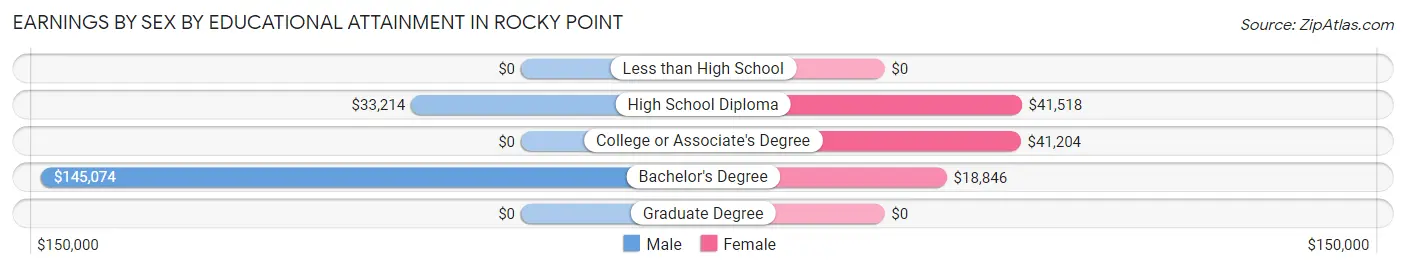
| Educational Attainment | Male Income | Female Income |
| Less than High School | - | - |
| High School Diploma | $33,214 | $41,518 |
| College or Associate's Degree | - | - |
| Bachelor's Degree | $145,074 | $18,846 |
| Graduate Degree | - | - |
| Total | - | - |
Family Income in Rocky Point
Family Income Brackets in Rocky Point
According to the Rocky Point family income data, there are 54 families falling into the $35,000 to $49,999 income range, which is the most common income bracket and makes up 23.9% of all families.
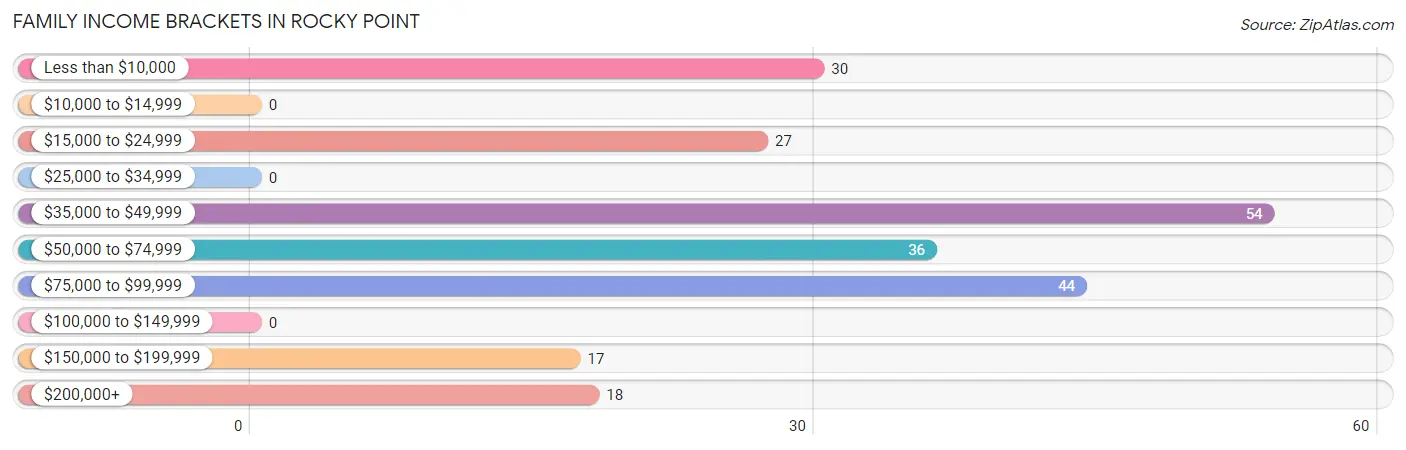
| Income Bracket | # Families | % Families |
| Less than $10,000 | 30 | 13.3% |
| $10,000 to $14,999 | 0 | 0.0% |
| $15,000 to $24,999 | 27 | 11.9% |
| $25,000 to $34,999 | 0 | 0.0% |
| $35,000 to $49,999 | 54 | 23.9% |
| $50,000 to $74,999 | 36 | 15.9% |
| $75,000 to $99,999 | 44 | 19.5% |
| $100,000 to $149,999 | 0 | 0.0% |
| $150,000 to $199,999 | 17 | 7.5% |
| $200,000+ | 18 | 8.0% |
Family Income by Famaliy Size in Rocky Point
2-person families (115 | 50.9%) account for the highest median family income in Rocky Point with $79,219 per family, while 2-person families (115 | 50.9%) have the highest median income of $39,610 per family member.
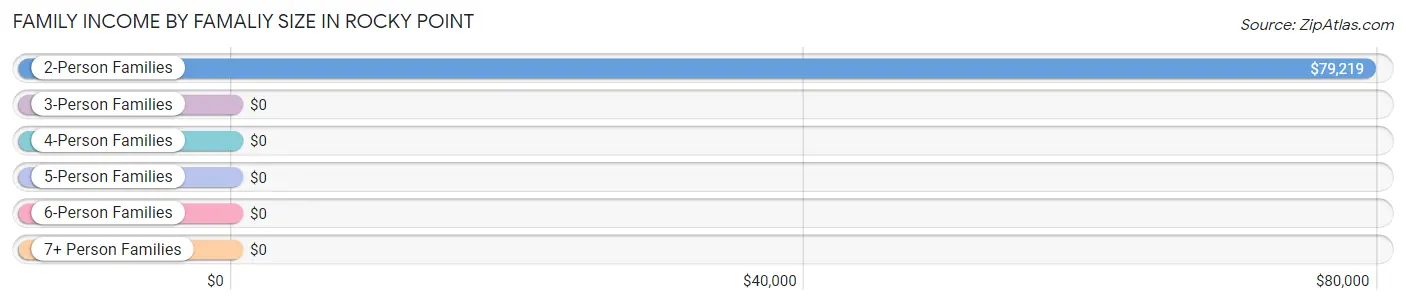
| Income Bracket | # Families | Median Income |
| 2-Person Families | 115 (50.9%) | $79,219 |
| 3-Person Families | 37 (16.4%) | $0 |
| 4-Person Families | 58 (25.7%) | $0 |
| 5-Person Families | 16 (7.1%) | $0 |
| 6-Person Families | 0 (0.0%) | $0 |
| 7+ Person Families | 0 (0.0%) | $0 |
| Total | 226 (100.0%) | $50,500 |
Family Income by Number of Earners in Rocky Point
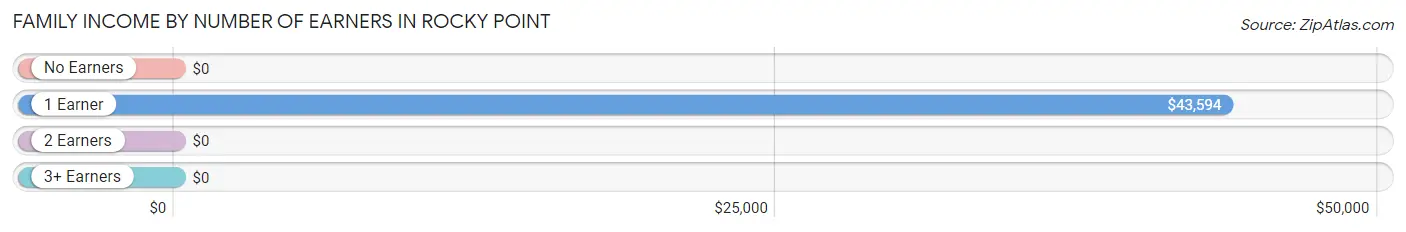
| Number of Earners | # Families | Median Income |
| No Earners | 0 (0.0%) | $0 |
| 1 Earner | 145 (64.2%) | $43,594 |
| 2 Earners | 75 (33.2%) | $0 |
| 3+ Earners | 6 (2.6%) | $0 |
| Total | 226 (100.0%) | $50,500 |
Household Income in Rocky Point
Household Income Brackets in Rocky Point
With 109 households falling in the category, the $75,000 to $99,999 income range is the most frequent in Rocky Point, accounting for 26.5% of all households. In contrast, only 7 households (1.7%) fall into the $25,000 to $34,999 income bracket, making it the least populous group.
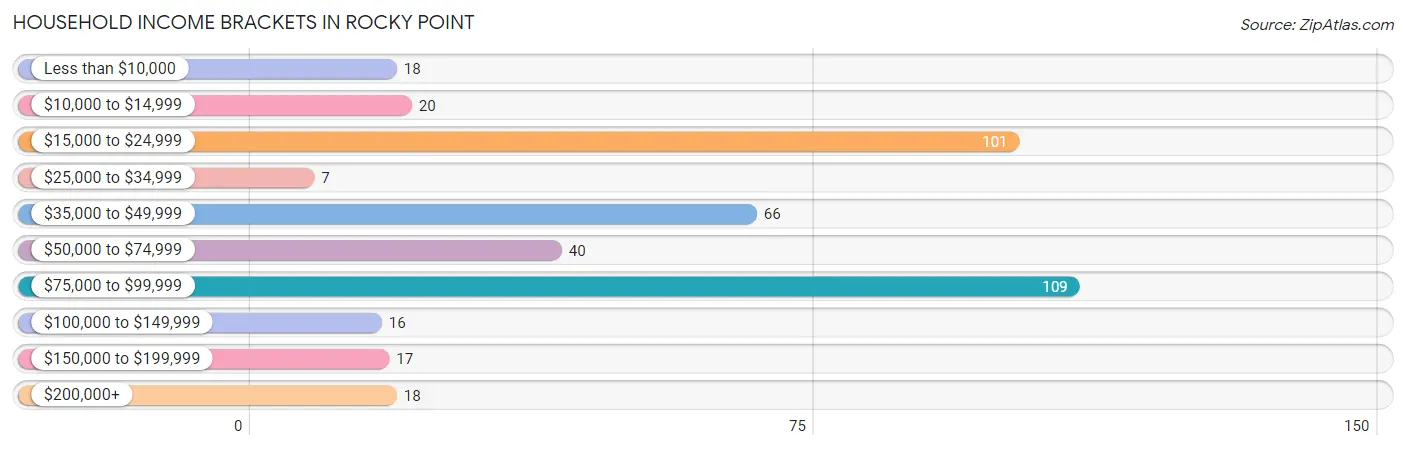
| Income Bracket | # Households | % Households |
| Less than $10,000 | 18 | 4.4% |
| $10,000 to $14,999 | 20 | 4.9% |
| $15,000 to $24,999 | 101 | 24.5% |
| $25,000 to $34,999 | 7 | 1.7% |
| $35,000 to $49,999 | 66 | 16.0% |
| $50,000 to $74,999 | 40 | 9.7% |
| $75,000 to $99,999 | 109 | 26.5% |
| $100,000 to $149,999 | 16 | 3.9% |
| $150,000 to $199,999 | 17 | 4.1% |
| $200,000+ | 18 | 4.4% |
Household Income by Householder Age in Rocky Point
The median household income in Rocky Point is $47,500, with the highest median household income of $46,607 found in the 65+ years age bracket for the primary householder. A total of 88 households (21.4%) fall into this category.
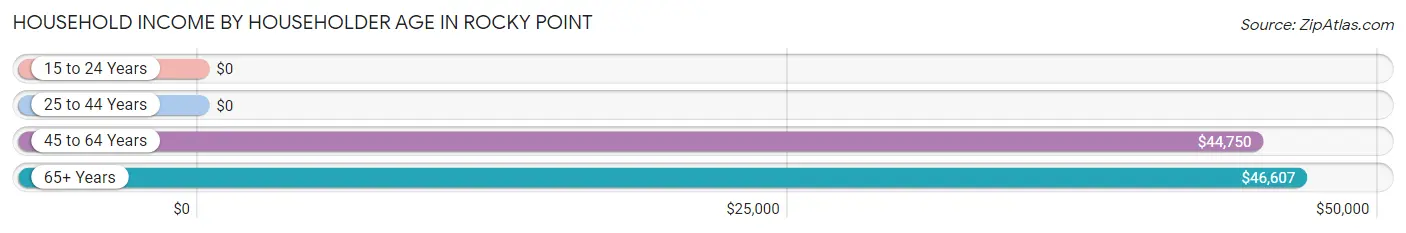
| Income Bracket | # Households | Median Income |
| 15 to 24 Years | 0 (0.0%) | $0 |
| 25 to 44 Years | 138 (33.5%) | $0 |
| 45 to 64 Years | 186 (45.2%) | $44,750 |
| 65+ Years | 88 (21.4%) | $46,607 |
| Total | 412 (100.0%) | $47,500 |
Poverty in Rocky Point
Income Below Poverty by Sex and Age in Rocky Point
With 30.3% poverty level for males and 28.3% for females among the residents of Rocky Point, 6 to 11 year old males and under 5 year old females are the most vulnerable to poverty, with 68 males (100.0%) and 20 females (100.0%) in their respective age groups living below the poverty level.
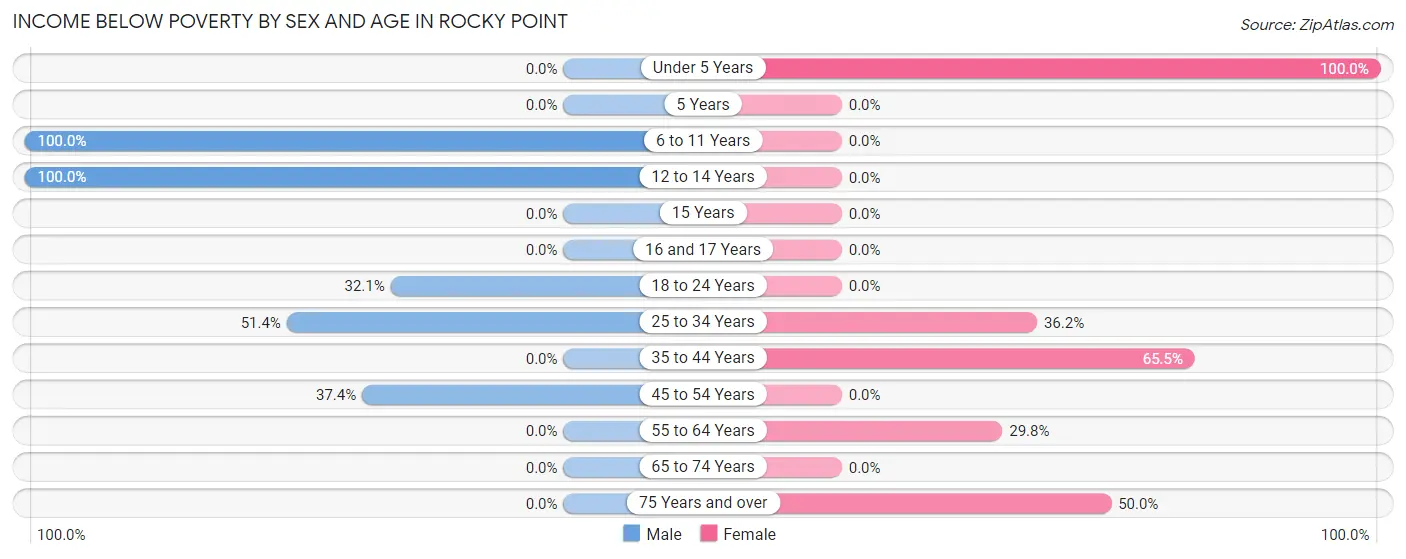
| Age Bracket | Male | Female |
| Under 5 Years | 0 (0.0%) | 20 (100.0%) |
| 5 Years | 0 (0.0%) | 0 (0.0%) |
| 6 to 11 Years | 68 (100.0%) | 0 (0.0%) |
| 12 to 14 Years | 26 (100.0%) | 0 (0.0%) |
| 15 Years | 0 (0.0%) | 0 (0.0%) |
| 16 and 17 Years | 0 (0.0%) | 0 (0.0%) |
| 18 to 24 Years | 17 (32.1%) | 0 (0.0%) |
| 25 to 34 Years | 19 (51.3%) | 25 (36.2%) |
| 35 to 44 Years | 0 (0.0%) | 38 (65.5%) |
| 45 to 54 Years | 37 (37.4%) | 0 (0.0%) |
| 55 to 64 Years | 0 (0.0%) | 14 (29.8%) |
| 65 to 74 Years | 0 (0.0%) | 0 (0.0%) |
| 75 Years and over | 0 (0.0%) | 13 (50.0%) |
| Total | 167 (30.3%) | 110 (28.3%) |
Income Above Poverty by Sex and Age in Rocky Point
According to the poverty statistics in Rocky Point, males aged under 5 years and females aged 5 years are the age groups that are most secure financially, with 100.0% of males and 100.0% of females in these age groups living above the poverty line.
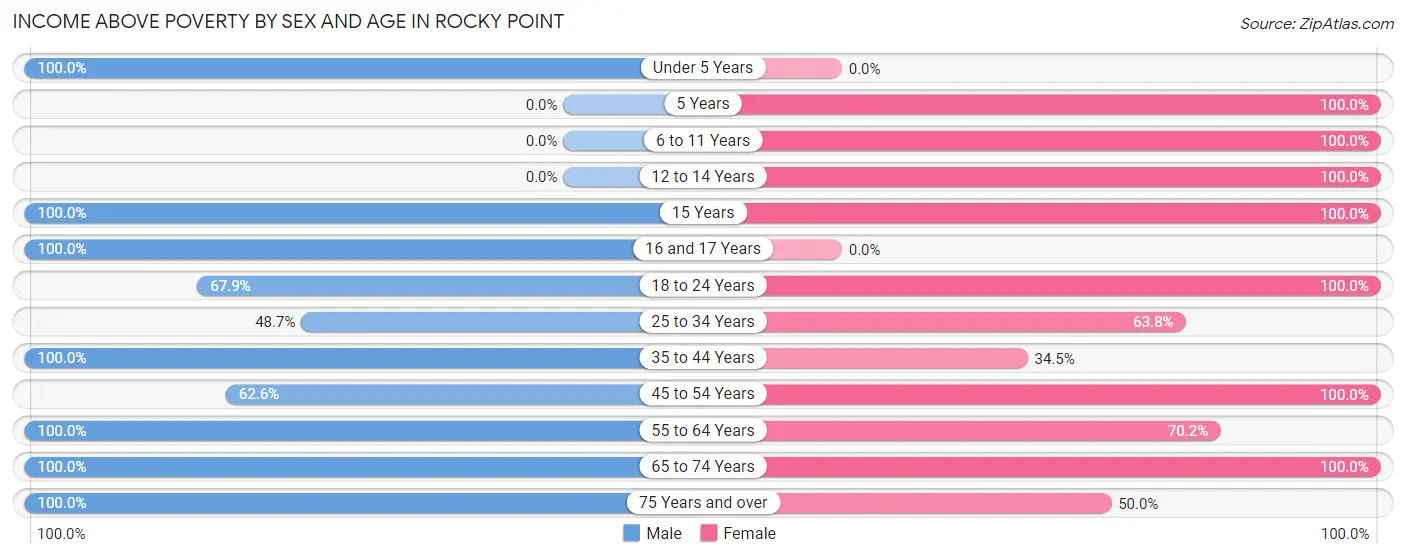
| Age Bracket | Male | Female |
| Under 5 Years | 27 (100.0%) | 0 (0.0%) |
| 5 Years | 0 (0.0%) | 10 (100.0%) |
| 6 to 11 Years | 0 (0.0%) | 13 (100.0%) |
| 12 to 14 Years | 0 (0.0%) | 13 (100.0%) |
| 15 Years | 10 (100.0%) | 7 (100.0%) |
| 16 and 17 Years | 11 (100.0%) | 0 (0.0%) |
| 18 to 24 Years | 36 (67.9%) | 13 (100.0%) |
| 25 to 34 Years | 18 (48.6%) | 44 (63.8%) |
| 35 to 44 Years | 81 (100.0%) | 20 (34.5%) |
| 45 to 54 Years | 62 (62.6%) | 65 (100.0%) |
| 55 to 64 Years | 84 (100.0%) | 33 (70.2%) |
| 65 to 74 Years | 18 (100.0%) | 48 (100.0%) |
| 75 Years and over | 37 (100.0%) | 13 (50.0%) |
| Total | 384 (69.7%) | 279 (71.7%) |
Income Below Poverty Among Married-Couple Families in Rocky Point
The poverty statistics for married-couple families in Rocky Point show that 23.9% or 38 of the total 159 families live below the poverty line. Families with 1 or 2 children have the highest poverty rate of 50.0%, comprising of 38 families. On the other hand, families with no children have the lowest poverty rate of 0.0%, which includes 0 families.
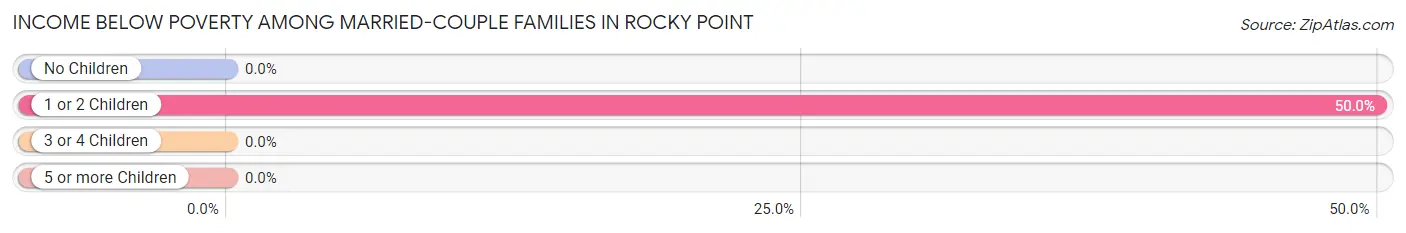
| Children | Above Poverty | Below Poverty |
| No Children | 83 (100.0%) | 0 (0.0%) |
| 1 or 2 Children | 38 (50.0%) | 38 (50.0%) |
| 3 or 4 Children | 0 (0.0%) | 0 (0.0%) |
| 5 or more Children | 0 (0.0%) | 0 (0.0%) |
| Total | 121 (76.1%) | 38 (23.9%) |
Income Below Poverty Among Single-Parent Households in Rocky Point
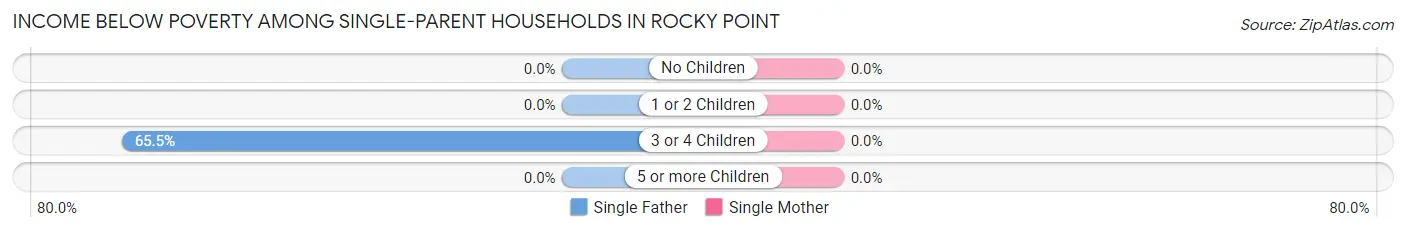
| Children | Single Father | Single Mother |
| No Children | 0 (0.0%) | 0 (0.0%) |
| 1 or 2 Children | 0 (0.0%) | 0 (0.0%) |
| 3 or 4 Children | 19 (65.5%) | 0 (0.0%) |
| 5 or more Children | 0 (0.0%) | 0 (0.0%) |
| Total | 19 (42.2%) | 0 (0.0%) |
Income Below Poverty Among Married-Couple vs Single-Parent Households in Rocky Point
The poverty data for Rocky Point shows that 38 of the married-couple family households (23.9%) and 19 of the single-parent households (28.4%) are living below the poverty level. Within the married-couple family households, those with 1 or 2 children have the highest poverty rate, with 38 households (50.0%) falling below the poverty line. Among the single-parent households, those with 3 or 4 children have the highest poverty rate, with 19 household (65.5%) living below poverty.
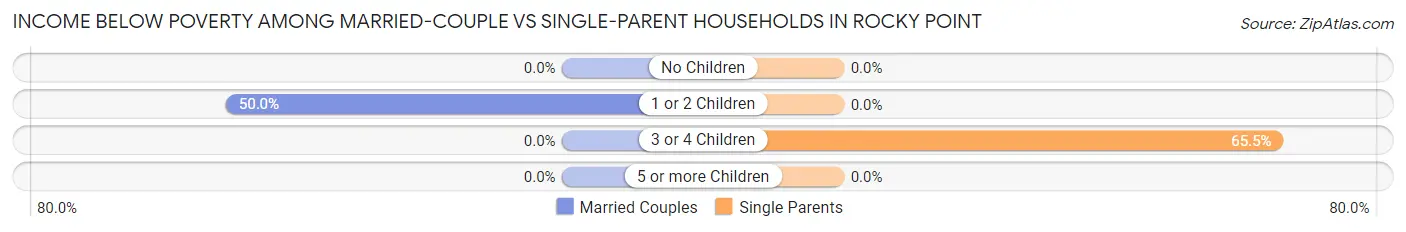
| Children | Married-Couple Families | Single-Parent Households |
| No Children | 0 (0.0%) | 0 (0.0%) |
| 1 or 2 Children | 38 (50.0%) | 0 (0.0%) |
| 3 or 4 Children | 0 (0.0%) | 19 (65.5%) |
| 5 or more Children | 0 (0.0%) | 0 (0.0%) |
| Total | 38 (23.9%) | 19 (28.4%) |
Race in Rocky Point
The most populous races in Rocky Point are White / Caucasian (639 | 68.0%), Hispanic or Latino (235 | 25.0%), and Some other Race (198 | 21.1%).
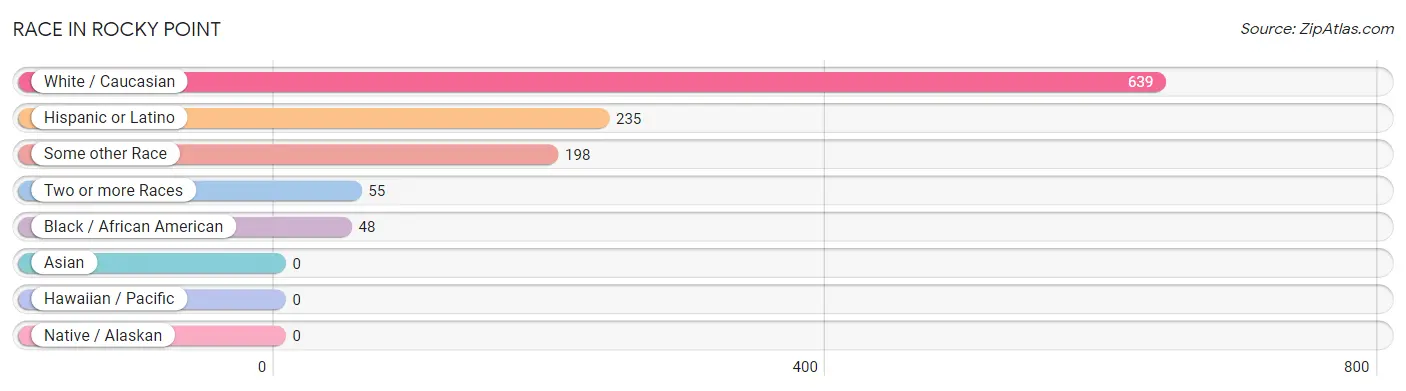
| Race | # Population | % Population |
| Asian | 0 | 0.0% |
| Black / African American | 48 | 5.1% |
| Hawaiian / Pacific | 0 | 0.0% |
| Hispanic or Latino | 235 | 25.0% |
| Native / Alaskan | 0 | 0.0% |
| White / Caucasian | 639 | 68.0% |
| Two or more Races | 55 | 5.9% |
| Some other Race | 198 | 21.1% |
| Total | 940 | 100.0% |
Ancestry in Rocky Point
The most populous ancestries reported in Rocky Point are Mexican (198 | 21.1%), Irish (160 | 17.0%), English (112 | 11.9%), Scotch-Irish (60 | 6.4%), and German (52 | 5.5%), together accounting for 61.9% of all Rocky Point residents.
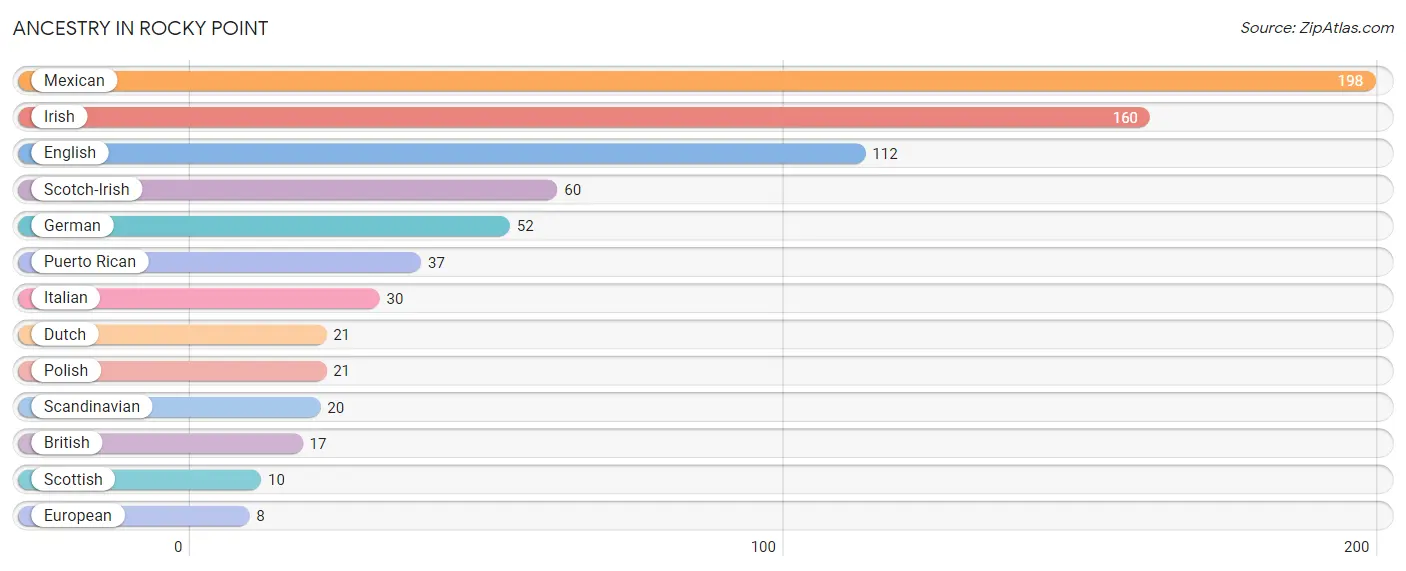
| Ancestry | # Population | % Population |
| British | 17 | 1.8% |
| Dutch | 21 | 2.2% |
| English | 112 | 11.9% |
| European | 8 | 0.9% |
| German | 52 | 5.5% |
| Irish | 160 | 17.0% |
| Italian | 30 | 3.2% |
| Mexican | 198 | 21.1% |
| Polish | 21 | 2.2% |
| Puerto Rican | 37 | 3.9% |
| Scandinavian | 20 | 2.1% |
| Scotch-Irish | 60 | 6.4% |
| Scottish | 10 | 1.1% | View All 13 Rows |
Immigrants in Rocky Point
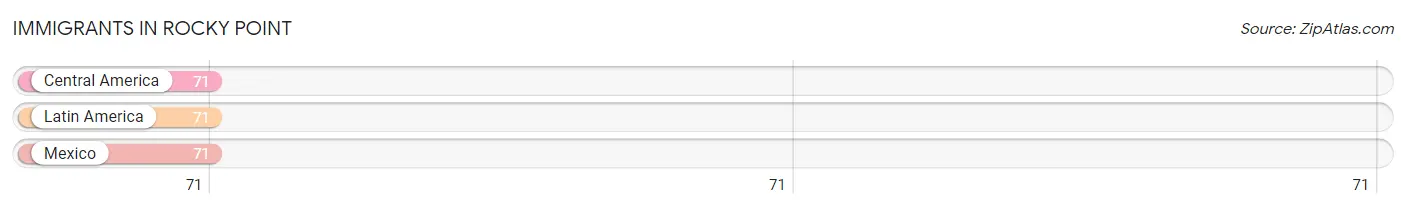
The most numerous immigrant groups reported in Rocky Point came from Central America (71 | 7.5%), Latin America (71 | 7.5%), and Mexico (71 | 7.5%), together accounting for 22.6% of all Rocky Point residents.
| Immigration Origin | # Population | % Population |
| Central America | 71 | 7.5% |
| Latin America | 71 | 7.5% |
| Mexico | 71 | 7.5% | View All 3 Rows |
Sex and Age in Rocky Point
Sex and Age in Rocky Point
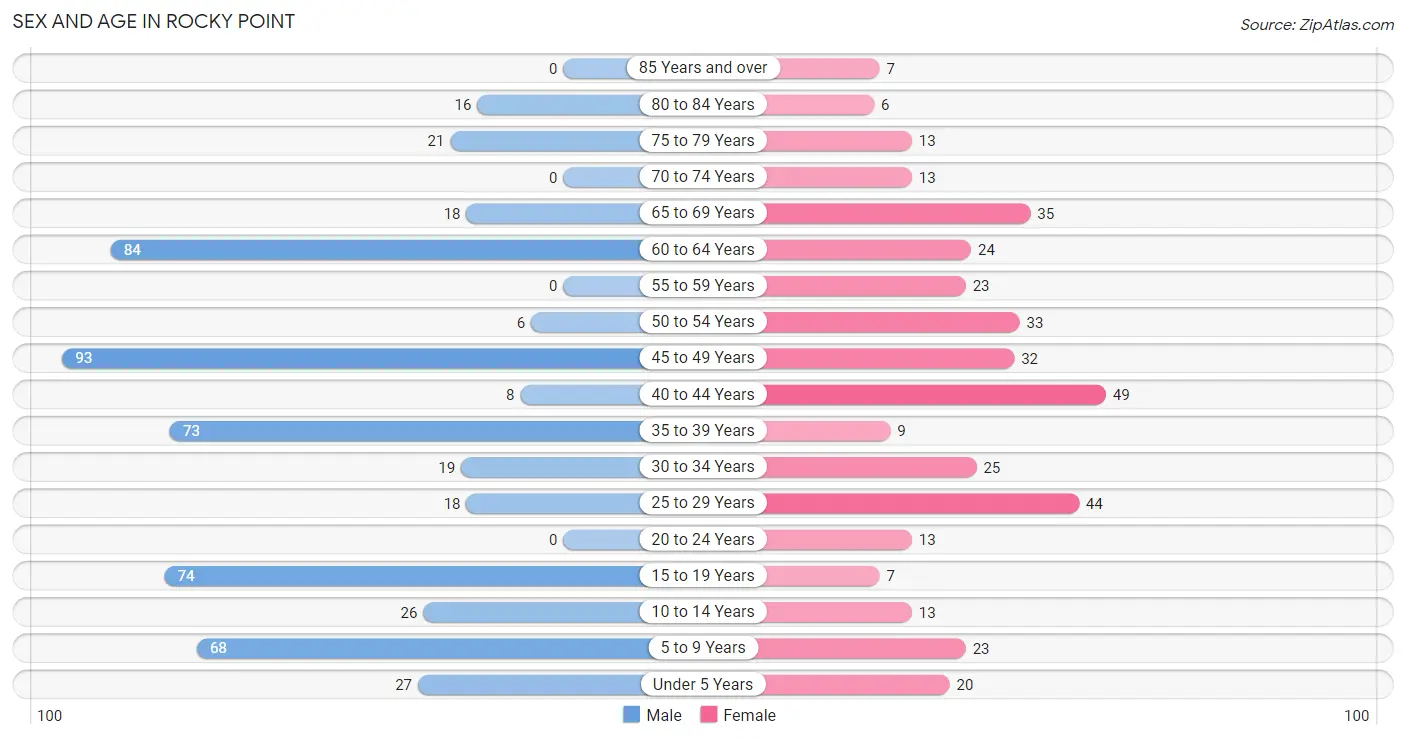
The most populous age groups in Rocky Point are 45 to 49 Years (93 | 16.9%) for men and 40 to 44 Years (49 | 12.6%) for women.
| Age Bracket | Male | Female |
| Under 5 Years | 27 (4.9%) | 20 (5.1%) |
| 5 to 9 Years | 68 (12.3%) | 23 (5.9%) |
| 10 to 14 Years | 26 (4.7%) | 13 (3.3%) |
| 15 to 19 Years | 74 (13.4%) | 7 (1.8%) |
| 20 to 24 Years | 0 (0.0%) | 13 (3.3%) |
| 25 to 29 Years | 18 (3.3%) | 44 (11.3%) |
| 30 to 34 Years | 19 (3.5%) | 25 (6.4%) |
| 35 to 39 Years | 73 (13.3%) | 9 (2.3%) |
| 40 to 44 Years | 8 (1.5%) | 49 (12.6%) |
| 45 to 49 Years | 93 (16.9%) | 32 (8.2%) |
| 50 to 54 Years | 6 (1.1%) | 33 (8.5%) |
| 55 to 59 Years | 0 (0.0%) | 23 (5.9%) |
| 60 to 64 Years | 84 (15.2%) | 24 (6.2%) |
| 65 to 69 Years | 18 (3.3%) | 35 (9.0%) |
| 70 to 74 Years | 0 (0.0%) | 13 (3.3%) |
| 75 to 79 Years | 21 (3.8%) | 13 (3.3%) |
| 80 to 84 Years | 16 (2.9%) | 6 (1.5%) |
| 85 Years and over | 0 (0.0%) | 7 (1.8%) |
| Total | 551 (100.0%) | 389 (100.0%) |
Families and Households in Rocky Point
Median Family Size in Rocky Point
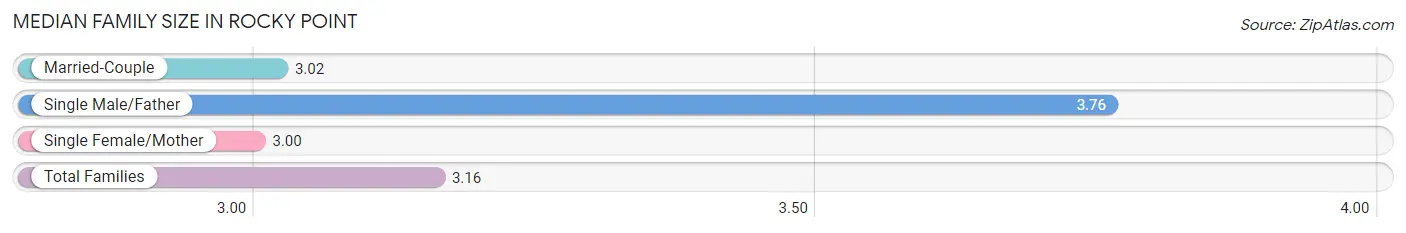
The median family size in Rocky Point is 3.16 persons per family, with single male/father families (45 | 19.9%) accounting for the largest median family size of 3.76 persons per family. On the other hand, single female/mother families (22 | 9.7%) represent the smallest median family size with 3.00 persons per family.
| Family Type | # Families | Family Size |
| Married-Couple | 159 (70.4%) | 3.02 |
| Single Male/Father | 45 (19.9%) | 3.76 |
| Single Female/Mother | 22 (9.7%) | 3.00 |
| Total Families | 226 (100.0%) | 3.16 |
Median Household Size in Rocky Point
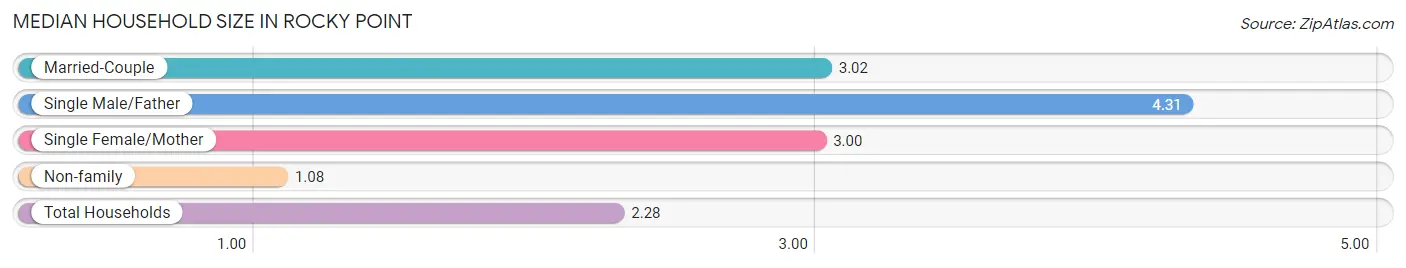
The median household size in Rocky Point is 2.28 persons per household, with single male/father households (45 | 10.9%) accounting for the largest median household size of 4.31 persons per household. non-family households (186 | 45.2%) represent the smallest median household size with 1.08 persons per household.
| Household Type | # Households | Household Size |
| Married-Couple | 159 (38.6%) | 3.02 |
| Single Male/Father | 45 (10.9%) | 4.31 |
| Single Female/Mother | 22 (5.3%) | 3.00 |
| Non-family | 186 (45.2%) | 1.08 |
| Total Households | 412 (100.0%) | 2.28 |
Household Size by Marriage Status in Rocky Point
Out of a total of 412 households in Rocky Point, 226 (54.8%) are family households, while 186 (45.2%) are nonfamily households. The most numerous type of family households are 2-person households, comprising 115, and the most common type of nonfamily households are 1-person households, comprising 170.
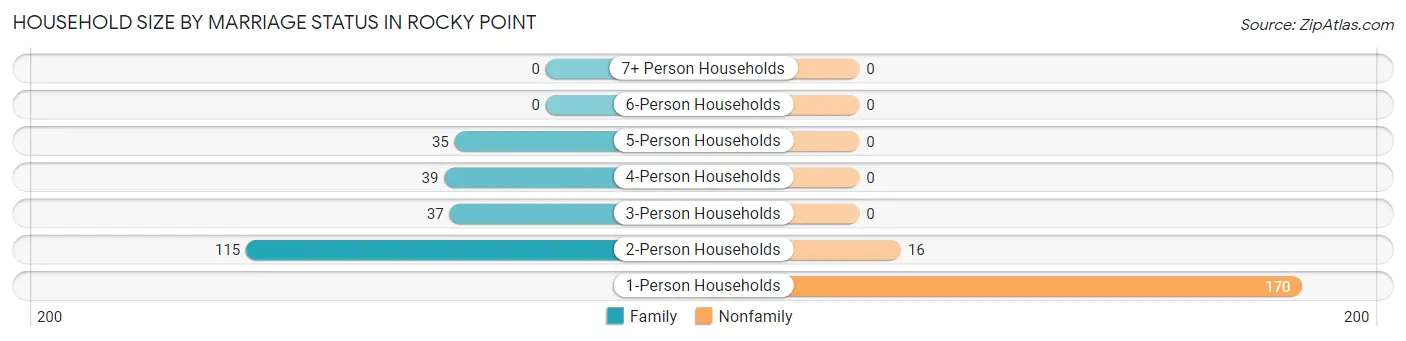
| Household Size | Family Households | Nonfamily Households |
| 1-Person Households | - | 170 (41.3%) |
| 2-Person Households | 115 (27.9%) | 16 (3.9%) |
| 3-Person Households | 37 (9.0%) | 0 (0.0%) |
| 4-Person Households | 39 (9.5%) | 0 (0.0%) |
| 5-Person Households | 35 (8.5%) | 0 (0.0%) |
| 6-Person Households | 0 (0.0%) | 0 (0.0%) |
| 7+ Person Households | 0 (0.0%) | 0 (0.0%) |
| Total | 226 (54.8%) | 186 (45.2%) |
Female Fertility in Rocky Point
Fertility by Age in Rocky Point
| Age Bracket | Women with Births | Births / 1,000 Women |
| 15 to 19 years | 0 (0.0%) | 0.0 |
| 20 to 34 years | 0 (0.0%) | 0.0 |
| 35 to 50 years | 0 (0.0%) | 0.0 |
| Total | 0 (0.0%) | 0.0 |
Fertility by Age by Marriage Status in Rocky Point
| Age Bracket | Married | Unmarried |
| 15 to 19 years | 0 (0.0%) | 0 (0.0%) |
| 20 to 34 years | 0 (0.0%) | 0 (0.0%) |
| 35 to 50 years | 0 (0.0%) | 0 (0.0%) |
| Total | 0 (0.0%) | 0 (0.0%) |
Fertility by Education in Rocky Point
| Educational Attainment | Women with Births | Births / 1,000 Women |
| Less than High School | 0 (0.0%) | 0.0 |
| High School Diploma | 0 (0.0%) | 0.0 |
| College or Associate's Degree | 0 (0.0%) | 0.0 |
| Bachelor's Degree | 0 (0.0%) | 0.0 |
| Graduate Degree | 0 (0.0%) | 0.0 |
| Total | 0 (0.0%) | 0.0 |
Fertility by Education by Marriage Status in Rocky Point
| Educational Attainment | Married | Unmarried |
| Less than High School | 0 (0.0%) | 0 (0.0%) |
| High School Diploma | 0 (0.0%) | 0 (0.0%) |
| College or Associate's Degree | 0 (0.0%) | 0 (0.0%) |
| Bachelor's Degree | 0 (0.0%) | 0 (0.0%) |
| Graduate Degree | 0 (0.0%) | 0 (0.0%) |
| Total | 0 (0.0%) | 0 (0.0%) |
Employment Characteristics in Rocky Point
Employment by Class of Employer in Rocky Point
Among the 458 employed individuals in Rocky Point, private company employees (257 | 56.1%), local government employees (67 | 14.6%), and federal government employees (57 | 12.4%) make up the most common classes of employment.
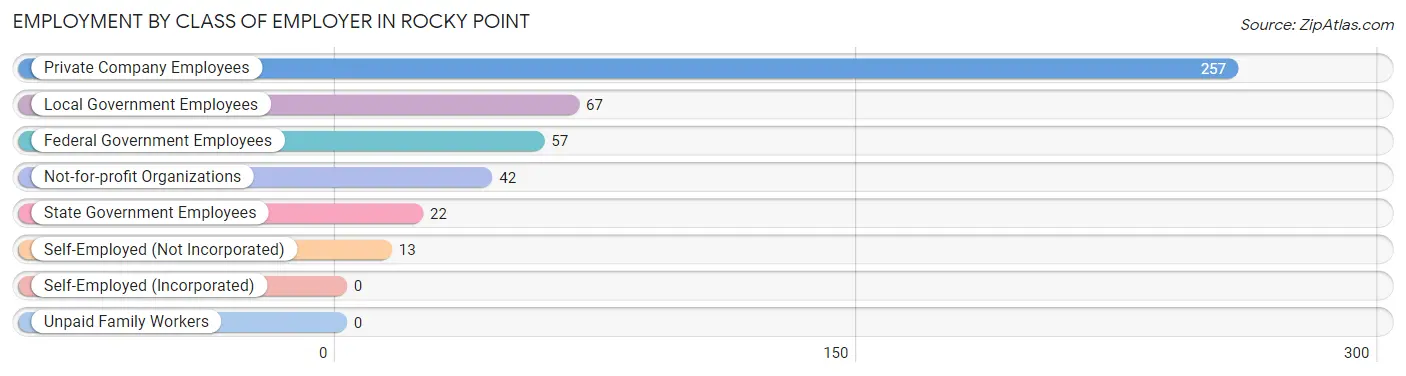
| Employer Class | # Employees | % Employees |
| Private Company Employees | 257 | 56.1% |
| Self-Employed (Incorporated) | 0 | 0.0% |
| Self-Employed (Not Incorporated) | 13 | 2.8% |
| Not-for-profit Organizations | 42 | 9.2% |
| Local Government Employees | 67 | 14.6% |
| State Government Employees | 22 | 4.8% |
| Federal Government Employees | 57 | 12.4% |
| Unpaid Family Workers | 0 | 0.0% |
| Total | 458 | 100.0% |
Employment Status by Age in Rocky Point
According to the labor force statistics for Rocky Point, out of the total population over 16 years of age (746), 66.4% or 495 individuals are in the labor force, with 7.5% or 37 of them unemployed. The age group with the highest labor force participation rate is 20 to 24 years, with 100.0% or 13 individuals in the labor force. Within the labor force, the 35 to 44 years age range has the highest percentage of unemployed individuals, with 23.1% or 27 of them being unemployed.
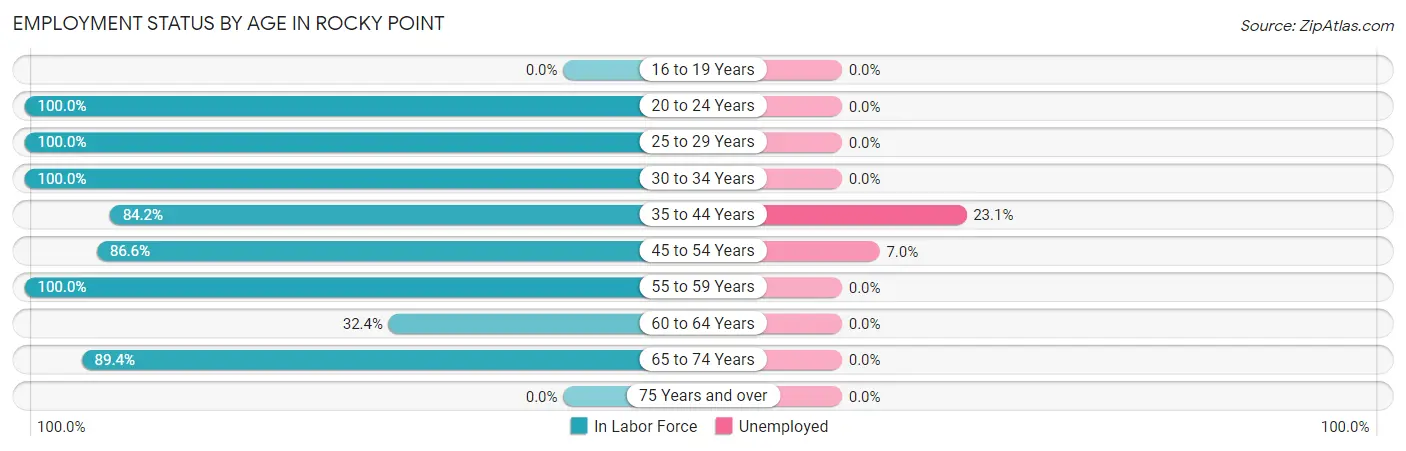
| Age Bracket | In Labor Force | Unemployed |
| 16 to 19 Years | 0 (0.0%) | 0 (0.0%) |
| 20 to 24 Years | 13 (100.0%) | 0 (0.0%) |
| 25 to 29 Years | 62 (100.0%) | 0 (0.0%) |
| 30 to 34 Years | 44 (100.0%) | 0 (0.0%) |
| 35 to 44 Years | 117 (84.2%) | 27 (23.1%) |
| 45 to 54 Years | 142 (86.6%) | 10 (7.0%) |
| 55 to 59 Years | 23 (100.0%) | 0 (0.0%) |
| 60 to 64 Years | 35 (32.4%) | 0 (0.0%) |
| 65 to 74 Years | 59 (89.4%) | 0 (0.0%) |
| 75 Years and over | 0 (0.0%) | 0 (0.0%) |
| Total | 495 (66.4%) | 37 (7.5%) |
Employment Status by Educational Attainment in Rocky Point
According to labor force statistics for Rocky Point, 78.3% of individuals (423) out of the total population between 25 and 64 years of age (540) are in the labor force, with 8.7% or 37 of them being unemployed. The group with the highest labor force participation rate are those with the educational attainment of high school diploma, with 100.0% or 79 individuals in the labor force. Within the labor force, individuals with less than high school education have the highest percentage of unemployment, with 18.9% or 27 of them being unemployed.
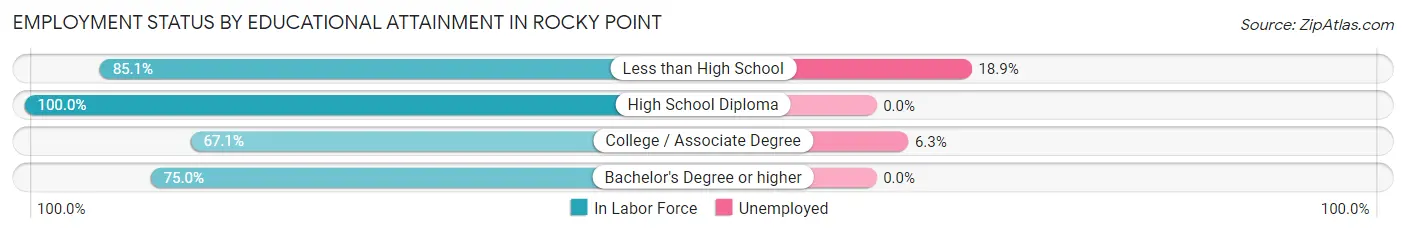
| Educational Attainment | In Labor Force | Unemployed |
| Less than High School | 143 (85.1%) | 32 (18.9%) |
| High School Diploma | 79 (100.0%) | 0 (0.0%) |
| College / Associate Degree | 159 (67.1%) | 15 (6.3%) |
| Bachelor's Degree or higher | 42 (75.0%) | 0 (0.0%) |
| Total | 423 (78.3%) | 47 (8.7%) |
Employment Occupations by Sex in Rocky Point
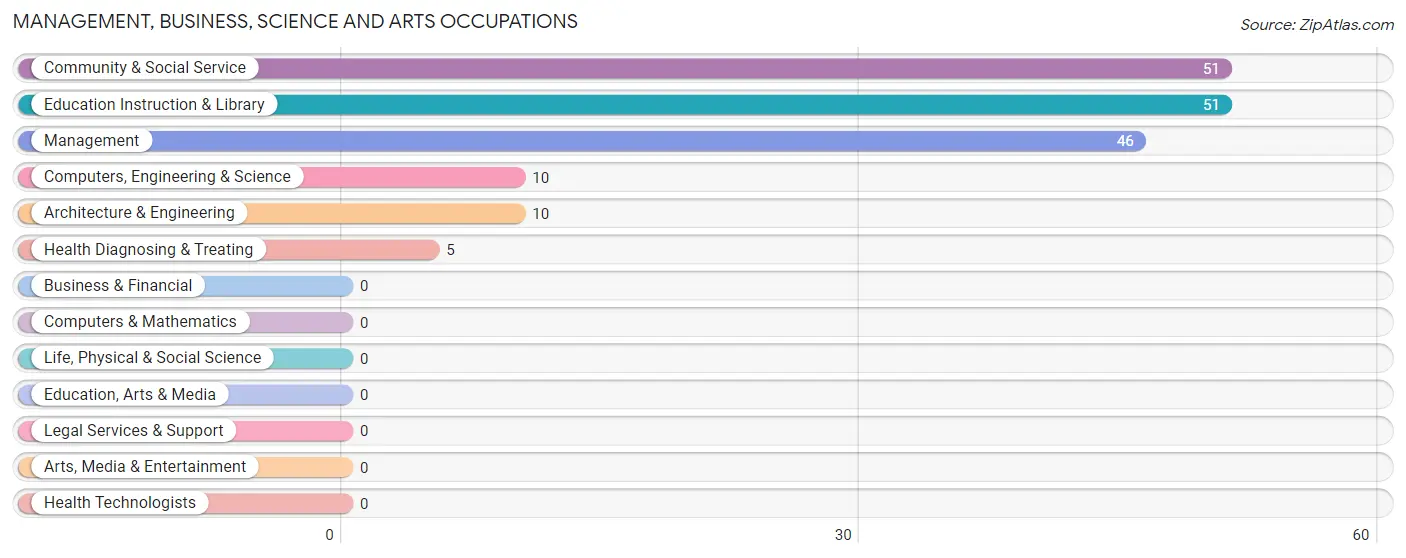
Management, Business, Science and Arts Occupations
The most common Management, Business, Science and Arts occupations in Rocky Point are Community & Social Service (51 | 11.1%), Education Instruction & Library (51 | 11.1%), Management (46 | 10.0%), Computers, Engineering & Science (10 | 2.2%), and Architecture & Engineering (10 | 2.2%).
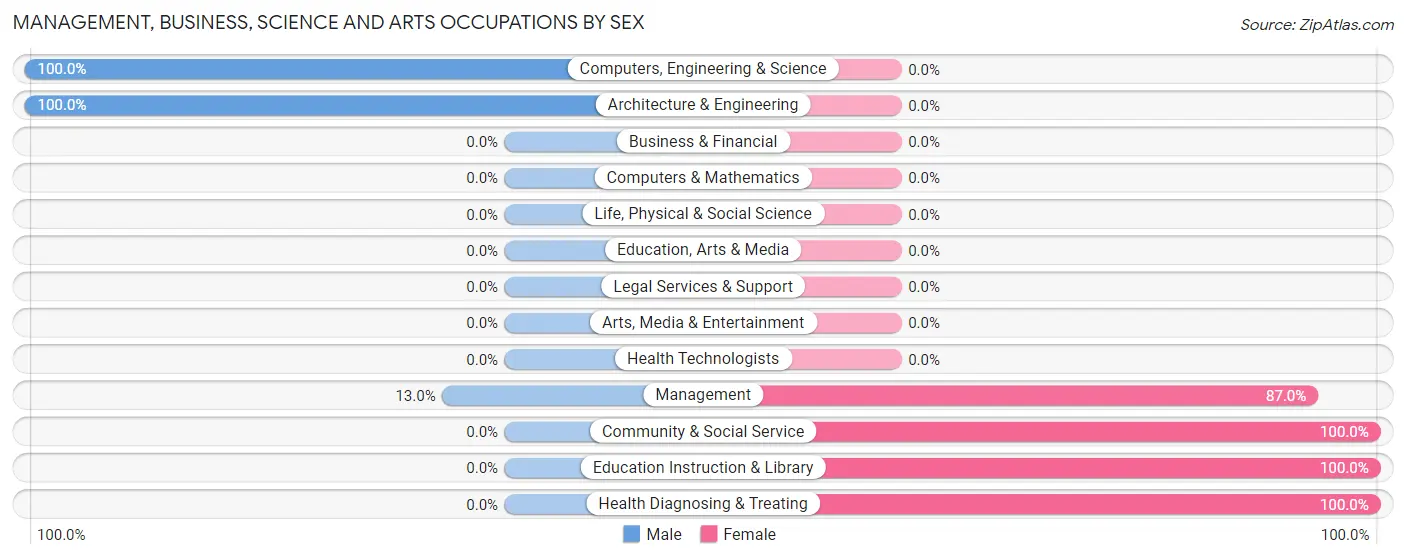
Management, Business, Science and Arts Occupations by Sex
Within the Management, Business, Science and Arts occupations in Rocky Point, the most male-oriented occupations are Computers, Engineering & Science (100.0%), Architecture & Engineering (100.0%), and Management (13.0%), while the most female-oriented occupations are Community & Social Service (100.0%), Education Instruction & Library (100.0%), and Health Diagnosing & Treating (100.0%).
| Occupation | Male | Female |
| Management | 6 (13.0%) | 40 (87.0%) |
| Business & Financial | 0 (0.0%) | 0 (0.0%) |
| Computers, Engineering & Science | 10 (100.0%) | 0 (0.0%) |
| Computers & Mathematics | 0 (0.0%) | 0 (0.0%) |
| Architecture & Engineering | 10 (100.0%) | 0 (0.0%) |
| Life, Physical & Social Science | 0 (0.0%) | 0 (0.0%) |
| Community & Social Service | 0 (0.0%) | 51 (100.0%) |
| Education, Arts & Media | 0 (0.0%) | 0 (0.0%) |
| Legal Services & Support | 0 (0.0%) | 0 (0.0%) |
| Education Instruction & Library | 0 (0.0%) | 51 (100.0%) |
| Arts, Media & Entertainment | 0 (0.0%) | 0 (0.0%) |
| Health Diagnosing & Treating | 0 (0.0%) | 5 (100.0%) |
| Health Technologists | 0 (0.0%) | 0 (0.0%) |
| Total (Category) | 16 (14.3%) | 96 (85.7%) |
| Total (Overall) | 270 (59.0%) | 188 (41.0%) |
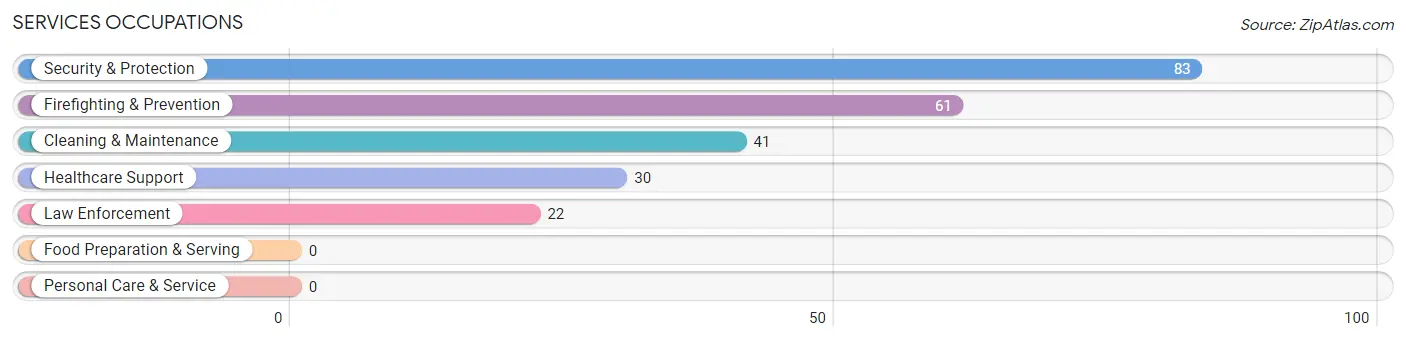
Services Occupations
The most common Services occupations in Rocky Point are Security & Protection (83 | 18.1%), Firefighting & Prevention (61 | 13.3%), Cleaning & Maintenance (41 | 8.9%), Healthcare Support (30 | 6.6%), and Law Enforcement (22 | 4.8%).
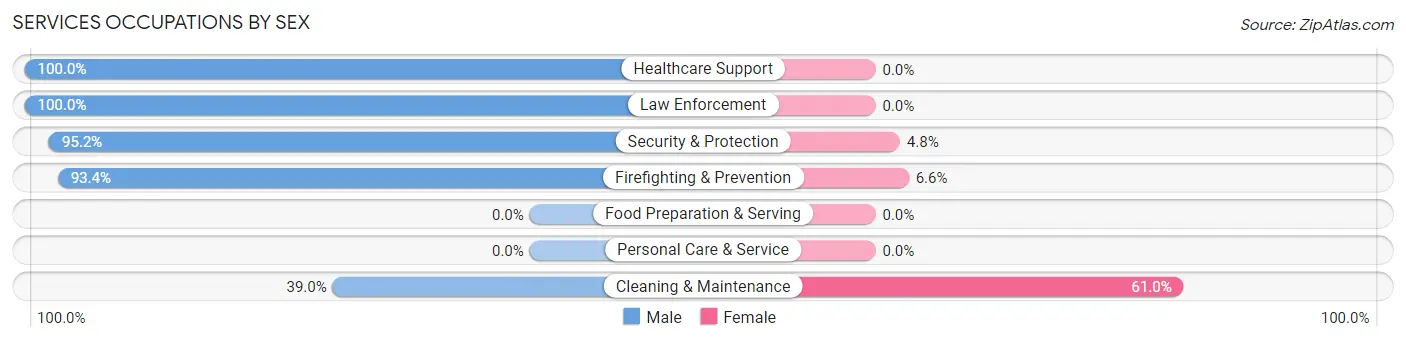
Services Occupations by Sex
Within the Services occupations in Rocky Point, the most male-oriented occupations are Healthcare Support (100.0%), Law Enforcement (100.0%), and Security & Protection (95.2%), while the most female-oriented occupations are Cleaning & Maintenance (61.0%), Firefighting & Prevention (6.6%), and Security & Protection (4.8%).
| Occupation | Male | Female |
| Healthcare Support | 30 (100.0%) | 0 (0.0%) |
| Security & Protection | 79 (95.2%) | 4 (4.8%) |
| Firefighting & Prevention | 57 (93.4%) | 4 (6.6%) |
| Law Enforcement | 22 (100.0%) | 0 (0.0%) |
| Food Preparation & Serving | 0 (0.0%) | 0 (0.0%) |
| Cleaning & Maintenance | 16 (39.0%) | 25 (61.0%) |
| Personal Care & Service | 0 (0.0%) | 0 (0.0%) |
| Total (Category) | 125 (81.2%) | 29 (18.8%) |
| Total (Overall) | 270 (59.0%) | 188 (41.0%) |
Sales and Office Occupations
The most common Sales and Office occupations in Rocky Point are Sales & Related (58 | 12.7%), and Office & Administration (40 | 8.7%).
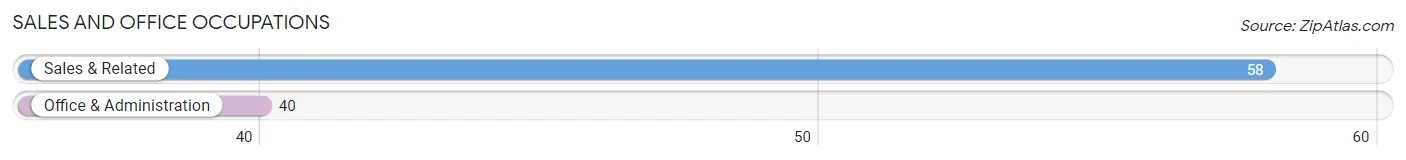
Sales and Office Occupations by Sex

| Occupation | Male | Female |
| Sales & Related | 35 (60.3%) | 23 (39.7%) |
| Office & Administration | 0 (0.0%) | 40 (100.0%) |
| Total (Category) | 35 (35.7%) | 63 (64.3%) |
| Total (Overall) | 270 (59.0%) | 188 (41.0%) |
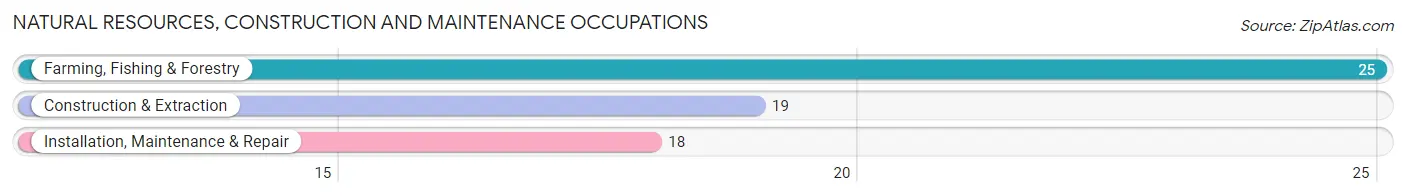
Natural Resources, Construction and Maintenance Occupations
The most common Natural Resources, Construction and Maintenance occupations in Rocky Point are Farming, Fishing & Forestry (25 | 5.5%), Construction & Extraction (19 | 4.2%), and Installation, Maintenance & Repair (18 | 3.9%).
Natural Resources, Construction and Maintenance Occupations by Sex
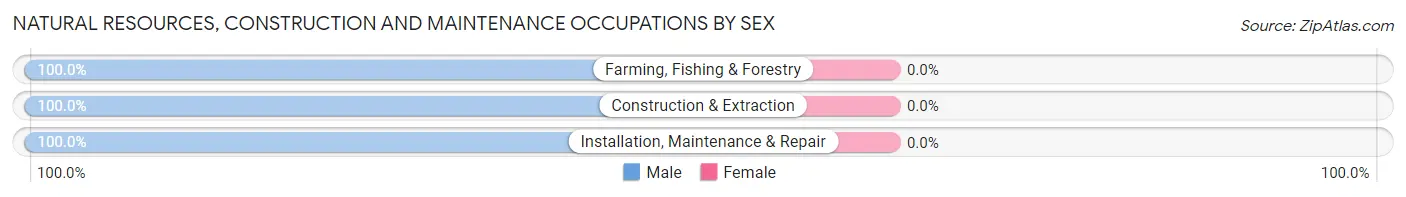
| Occupation | Male | Female |
| Farming, Fishing & Forestry | 25 (100.0%) | 0 (0.0%) |
| Construction & Extraction | 19 (100.0%) | 0 (0.0%) |
| Installation, Maintenance & Repair | 18 (100.0%) | 0 (0.0%) |
| Total (Category) | 62 (100.0%) | 0 (0.0%) |
| Total (Overall) | 270 (59.0%) | 188 (41.0%) |
Production, Transportation and Moving Occupations
The most common Production, Transportation and Moving occupations in Rocky Point are Material Moving (16 | 3.5%), Production (8 | 1.8%), and Transportation (8 | 1.8%).
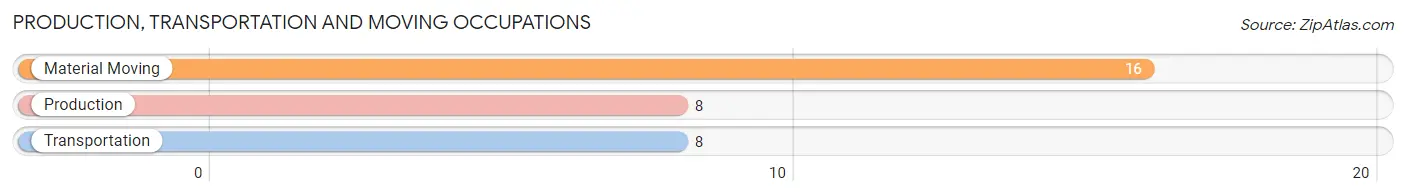
Production, Transportation and Moving Occupations by Sex
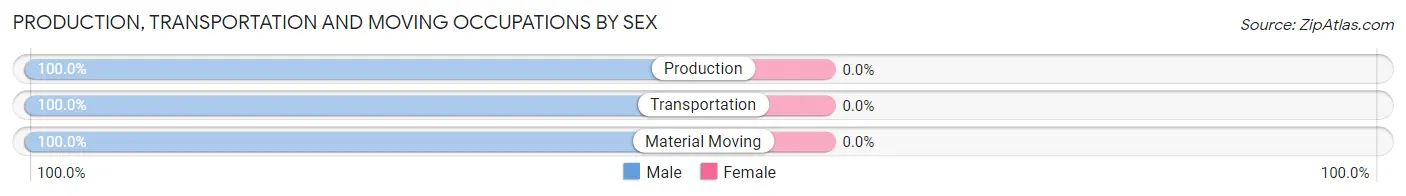
| Occupation | Male | Female |
| Production | 8 (100.0%) | 0 (0.0%) |
| Transportation | 8 (100.0%) | 0 (0.0%) |
| Material Moving | 16 (100.0%) | 0 (0.0%) |
| Total (Category) | 32 (100.0%) | 0 (0.0%) |
| Total (Overall) | 270 (59.0%) | 188 (41.0%) |
Employment Industries by Sex in Rocky Point
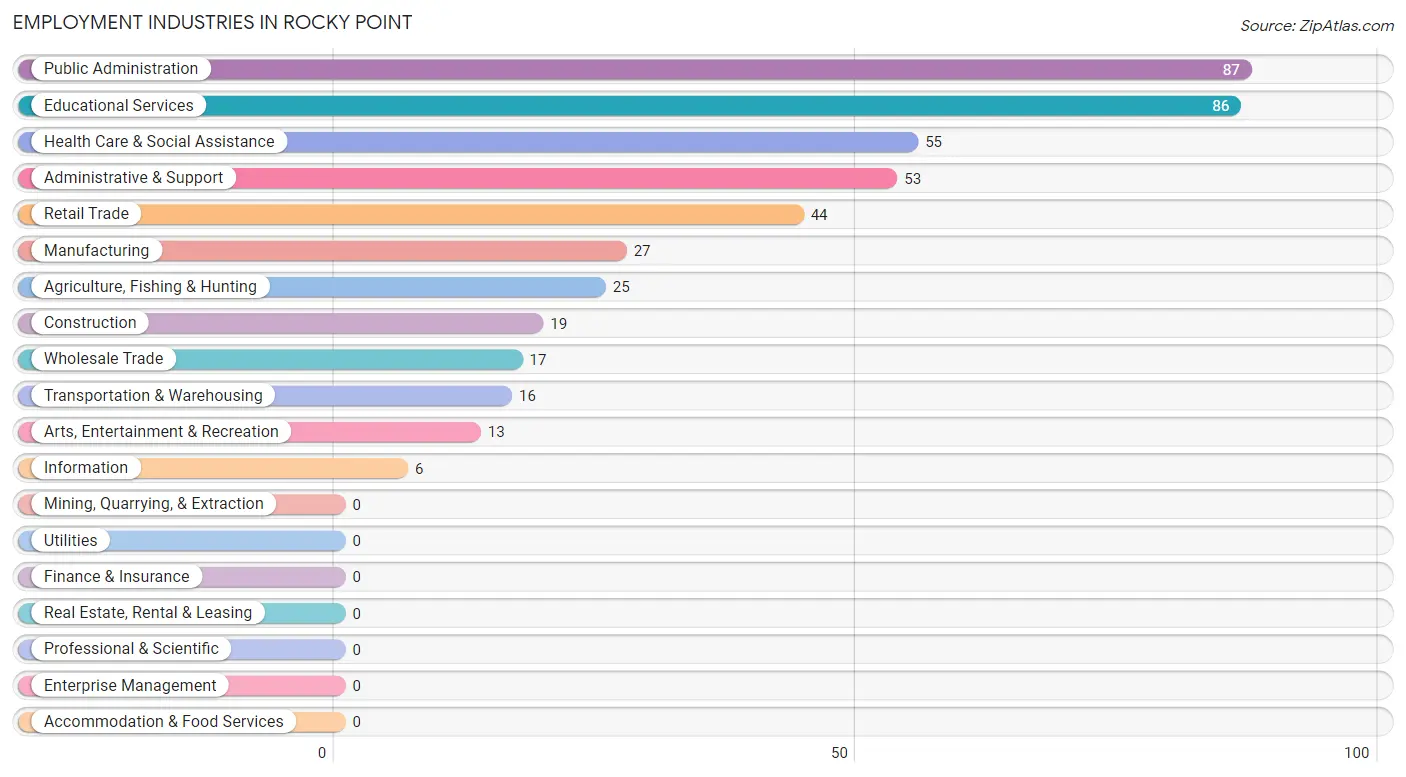
Employment Industries in Rocky Point
The major employment industries in Rocky Point include Public Administration (87 | 19.0%), Educational Services (86 | 18.8%), Health Care & Social Assistance (55 | 12.0%), Administrative & Support (53 | 11.6%), and Retail Trade (44 | 9.6%).
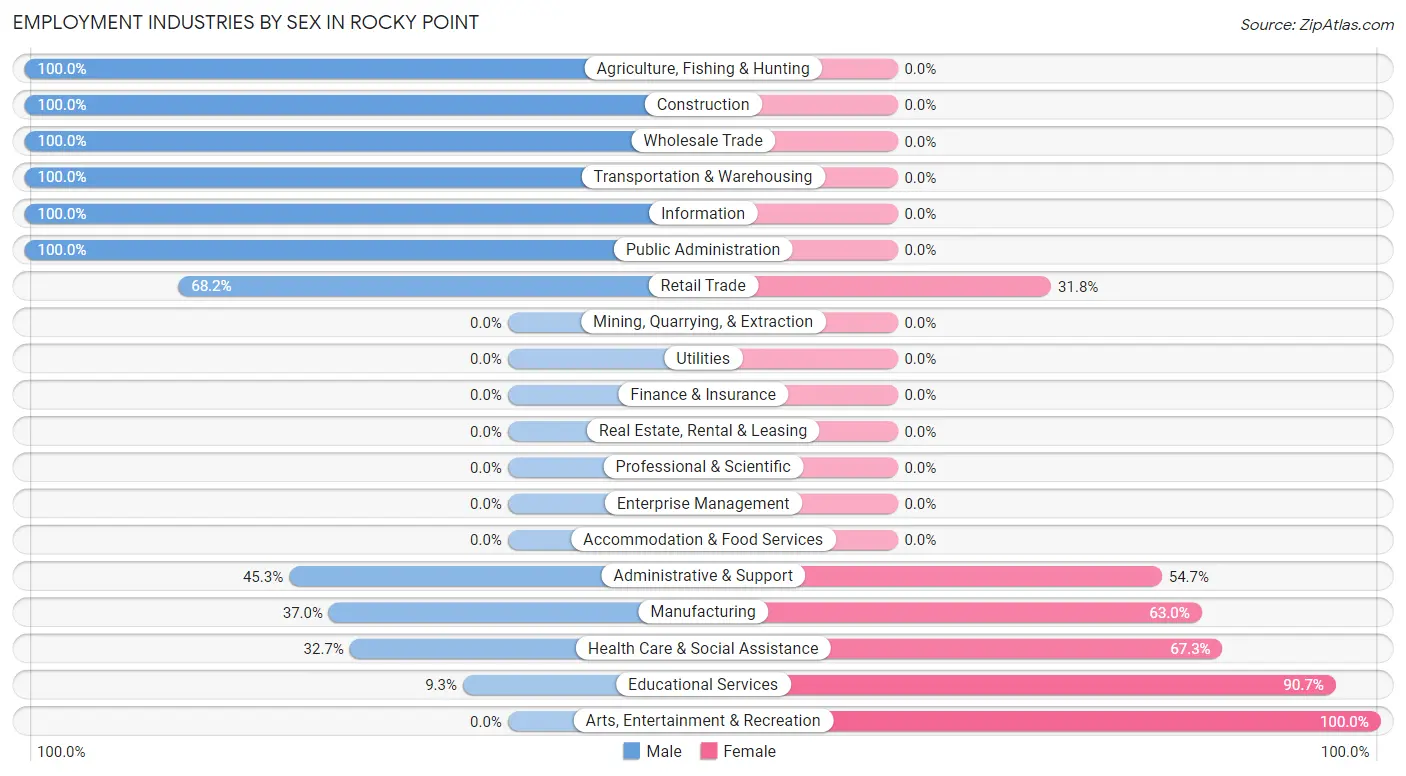
Employment Industries by Sex in Rocky Point
The Rocky Point industries that see more men than women are Agriculture, Fishing & Hunting (100.0%), Construction (100.0%), and Wholesale Trade (100.0%), whereas the industries that tend to have a higher number of women are Arts, Entertainment & Recreation (100.0%), Educational Services (90.7%), and Health Care & Social Assistance (67.3%).
| Industry | Male | Female |
| Agriculture, Fishing & Hunting | 25 (100.0%) | 0 (0.0%) |
| Mining, Quarrying, & Extraction | 0 (0.0%) | 0 (0.0%) |
| Construction | 19 (100.0%) | 0 (0.0%) |
| Manufacturing | 10 (37.0%) | 17 (63.0%) |
| Wholesale Trade | 17 (100.0%) | 0 (0.0%) |
| Retail Trade | 30 (68.2%) | 14 (31.8%) |
| Transportation & Warehousing | 16 (100.0%) | 0 (0.0%) |
| Utilities | 0 (0.0%) | 0 (0.0%) |
| Information | 6 (100.0%) | 0 (0.0%) |
| Finance & Insurance | 0 (0.0%) | 0 (0.0%) |
| Real Estate, Rental & Leasing | 0 (0.0%) | 0 (0.0%) |
| Professional & Scientific | 0 (0.0%) | 0 (0.0%) |
| Enterprise Management | 0 (0.0%) | 0 (0.0%) |
| Administrative & Support | 24 (45.3%) | 29 (54.7%) |
| Educational Services | 8 (9.3%) | 78 (90.7%) |
| Health Care & Social Assistance | 18 (32.7%) | 37 (67.3%) |
| Arts, Entertainment & Recreation | 0 (0.0%) | 13 (100.0%) |
| Accommodation & Food Services | 0 (0.0%) | 0 (0.0%) |
| Public Administration | 87 (100.0%) | 0 (0.0%) |
| Total | 270 (59.0%) | 188 (41.0%) |
Education in Rocky Point
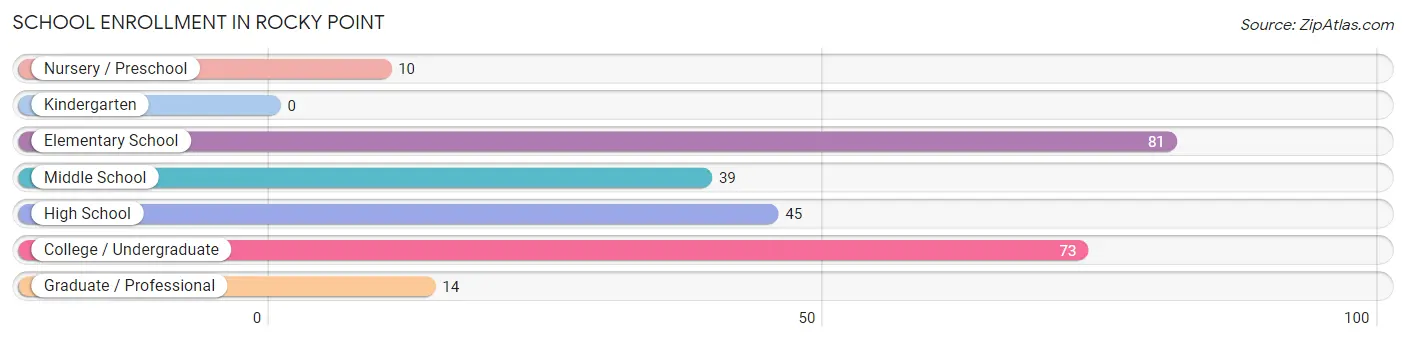
School Enrollment in Rocky Point
The most common levels of schooling among the 262 students in Rocky Point are elementary school (81 | 30.9%), college / undergraduate (73 | 27.9%), and high school (45 | 17.2%).
| School Level | # Students | % Students |
| Nursery / Preschool | 10 | 3.8% |
| Kindergarten | 0 | 0.0% |
| Elementary School | 81 | 30.9% |
| Middle School | 39 | 14.9% |
| High School | 45 | 17.2% |
| College / Undergraduate | 73 | 27.9% |
| Graduate / Professional | 14 | 5.3% |
| Total | 262 | 100.0% |
School Enrollment by Age by Funding Source in Rocky Point
Out of a total of 262 students who are enrolled in schools in Rocky Point, 34 (13.0%) attend a private institution, while the remaining 228 (87.0%) are enrolled in public schools. The age group of 35 years and over has the highest likelihood of being enrolled in private schools, with 24 (100.0% in the age bracket) enrolled. Conversely, the age group of 10 to 14 year olds has the lowest likelihood of being enrolled in a private school, with 39 (100.0% in the age bracket) attending a public institution.
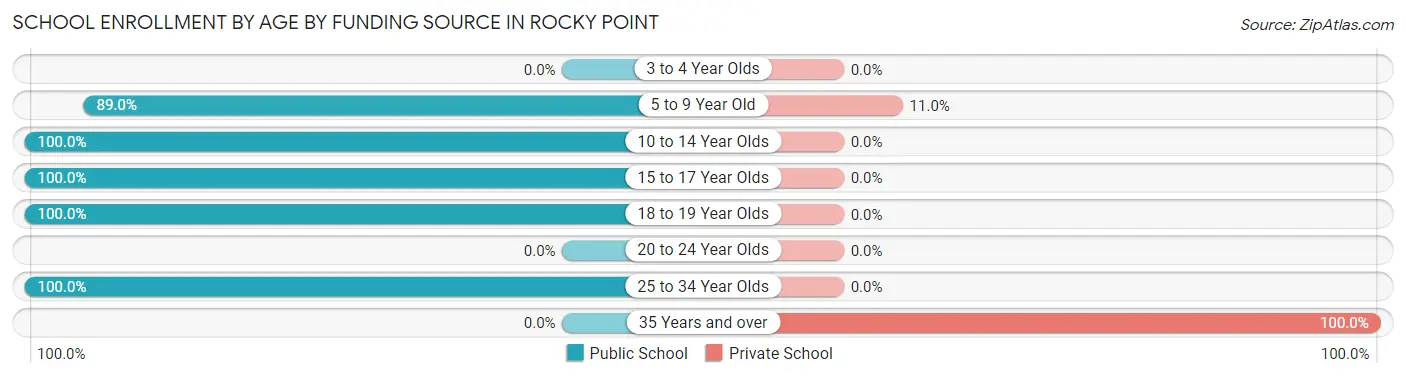
| Age Bracket | Public School | Private School |
| 3 to 4 Year Olds | 0 (0.0%) | 0 (0.0%) |
| 5 to 9 Year Old | 81 (89.0%) | 10 (11.0%) |
| 10 to 14 Year Olds | 39 (100.0%) | 0 (0.0%) |
| 15 to 17 Year Olds | 28 (100.0%) | 0 (0.0%) |
| 18 to 19 Year Olds | 53 (100.0%) | 0 (0.0%) |
| 20 to 24 Year Olds | 0 (0.0%) | 0 (0.0%) |
| 25 to 34 Year Olds | 27 (100.0%) | 0 (0.0%) |
| 35 Years and over | 0 (0.0%) | 24 (100.0%) |
| Total | 228 (87.0%) | 34 (13.0%) |
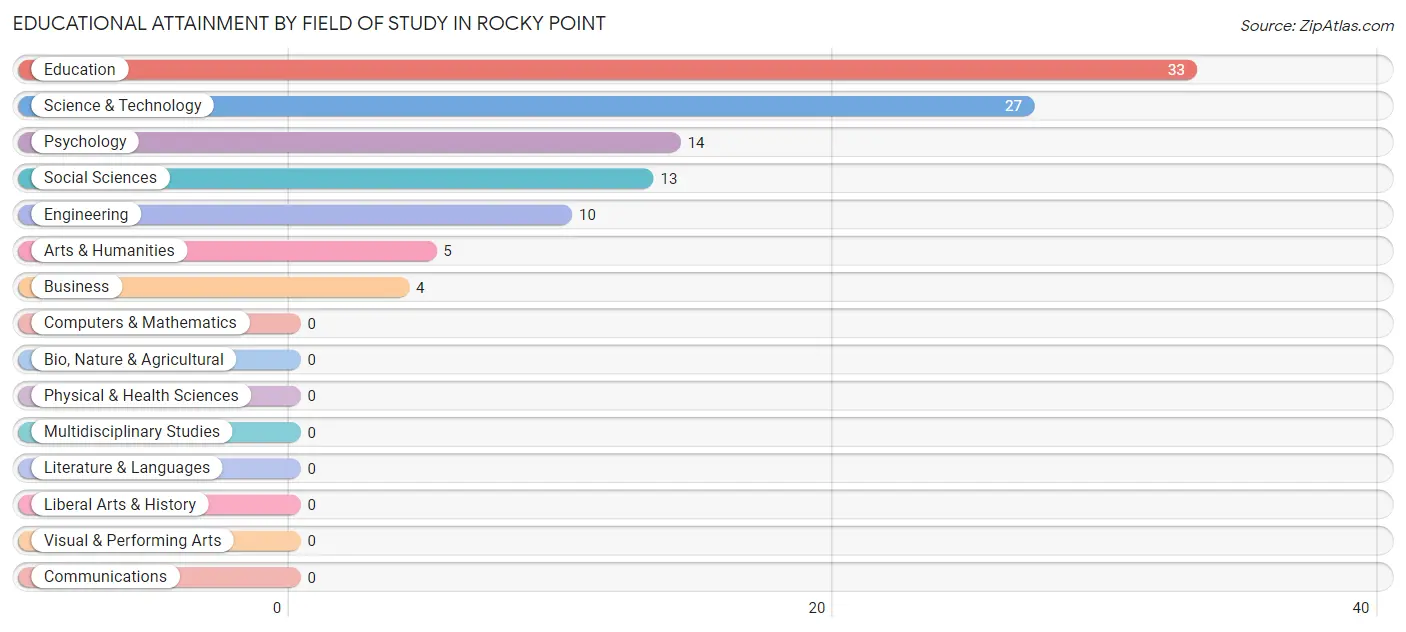
Educational Attainment by Field of Study in Rocky Point
Education (33 | 31.1%), science & technology (27 | 25.5%), psychology (14 | 13.2%), social sciences (13 | 12.3%), and engineering (10 | 9.4%) are the most common fields of study among 106 individuals in Rocky Point who have obtained a bachelor's degree or higher.
| Field of Study | # Graduates | % Graduates |
| Computers & Mathematics | 0 | 0.0% |
| Bio, Nature & Agricultural | 0 | 0.0% |
| Physical & Health Sciences | 0 | 0.0% |
| Psychology | 14 | 13.2% |
| Social Sciences | 13 | 12.3% |
| Engineering | 10 | 9.4% |
| Multidisciplinary Studies | 0 | 0.0% |
| Science & Technology | 27 | 25.5% |
| Business | 4 | 3.8% |
| Education | 33 | 31.1% |
| Literature & Languages | 0 | 0.0% |
| Liberal Arts & History | 0 | 0.0% |
| Visual & Performing Arts | 0 | 0.0% |
| Communications | 0 | 0.0% |
| Arts & Humanities | 5 | 4.7% |
| Total | 106 | 100.0% |
Transportation & Commute in Rocky Point
Vehicle Availability by Sex in Rocky Point
The most prevalent vehicle ownership categories in Rocky Point are males with 2 vehicles (175, accounting for 64.8%) and females with 2 vehicles (115, making up 93.1%).
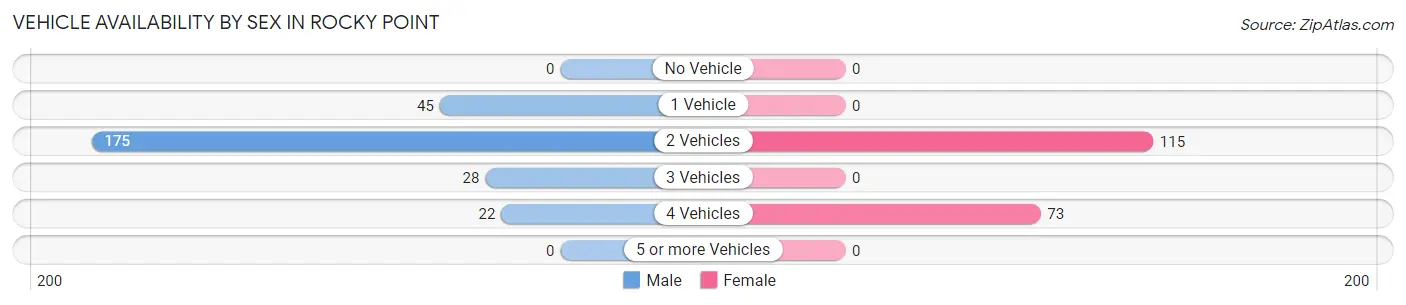
| Vehicles Available | Male | Female |
| No Vehicle | 0 (0.0%) | 0 (0.0%) |
| 1 Vehicle | 45 (16.7%) | 0 (0.0%) |
| 2 Vehicles | 175 (64.8%) | 115 (61.2%) |
| 3 Vehicles | 28 (10.4%) | 0 (0.0%) |
| 4 Vehicles | 22 (8.2%) | 73 (38.8%) |
| 5 or more Vehicles | 0 (0.0%) | 0 (0.0%) |
| Total | 270 (100.0%) | 188 (100.0%) |
Commute Time in Rocky Point
The most frequently occuring commute durations in Rocky Point are 30 to 34 minutes (111 commuters, 24.9%), 20 to 24 minutes (87 commuters, 19.6%), and 10 to 14 minutes (54 commuters, 12.1%).
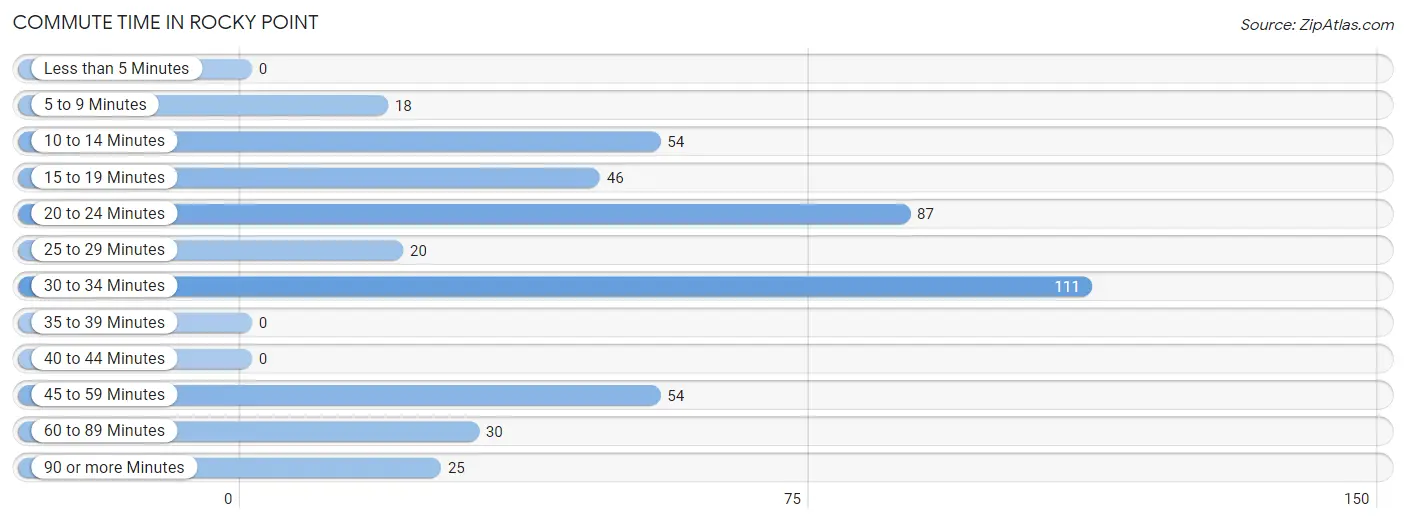
| Commute Time | # Commuters | % Commuters |
| Less than 5 Minutes | 0 | 0.0% |
| 5 to 9 Minutes | 18 | 4.0% |
| 10 to 14 Minutes | 54 | 12.1% |
| 15 to 19 Minutes | 46 | 10.3% |
| 20 to 24 Minutes | 87 | 19.6% |
| 25 to 29 Minutes | 20 | 4.5% |
| 30 to 34 Minutes | 111 | 24.9% |
| 35 to 39 Minutes | 0 | 0.0% |
| 40 to 44 Minutes | 0 | 0.0% |
| 45 to 59 Minutes | 54 | 12.1% |
| 60 to 89 Minutes | 30 | 6.7% |
| 90 or more Minutes | 25 | 5.6% |
Commute Time by Sex in Rocky Point
The most common commute times in Rocky Point are 20 to 24 minutes (73 commuters, 27.0%) for males and 30 to 34 minutes (85 commuters, 48.6%) for females.
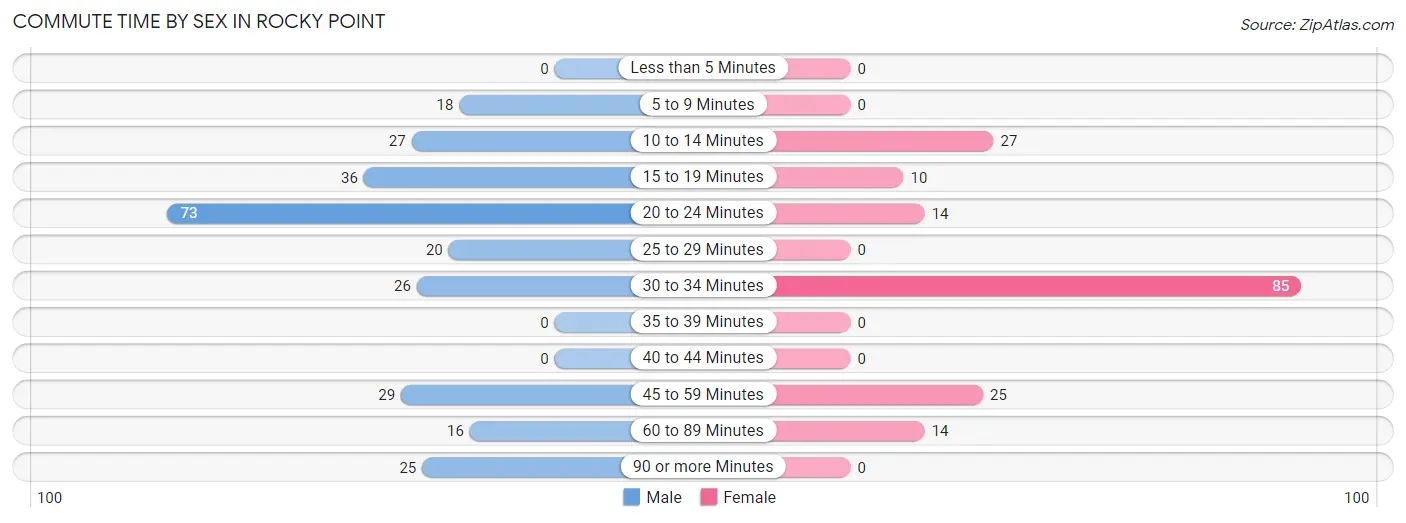
| Commute Time | Male | Female |
| Less than 5 Minutes | 0 (0.0%) | 0 (0.0%) |
| 5 to 9 Minutes | 18 (6.7%) | 0 (0.0%) |
| 10 to 14 Minutes | 27 (10.0%) | 27 (15.4%) |
| 15 to 19 Minutes | 36 (13.3%) | 10 (5.7%) |
| 20 to 24 Minutes | 73 (27.0%) | 14 (8.0%) |
| 25 to 29 Minutes | 20 (7.4%) | 0 (0.0%) |
| 30 to 34 Minutes | 26 (9.6%) | 85 (48.6%) |
| 35 to 39 Minutes | 0 (0.0%) | 0 (0.0%) |
| 40 to 44 Minutes | 0 (0.0%) | 0 (0.0%) |
| 45 to 59 Minutes | 29 (10.7%) | 25 (14.3%) |
| 60 to 89 Minutes | 16 (5.9%) | 14 (8.0%) |
| 90 or more Minutes | 25 (9.3%) | 0 (0.0%) |
Time of Departure to Work by Sex in Rocky Point
The most frequent times of departure to work in Rocky Point are 6:30 AM to 6:59 AM (67, 24.8%) for males and 6:30 AM to 6:59 AM (57, 32.6%) for females.
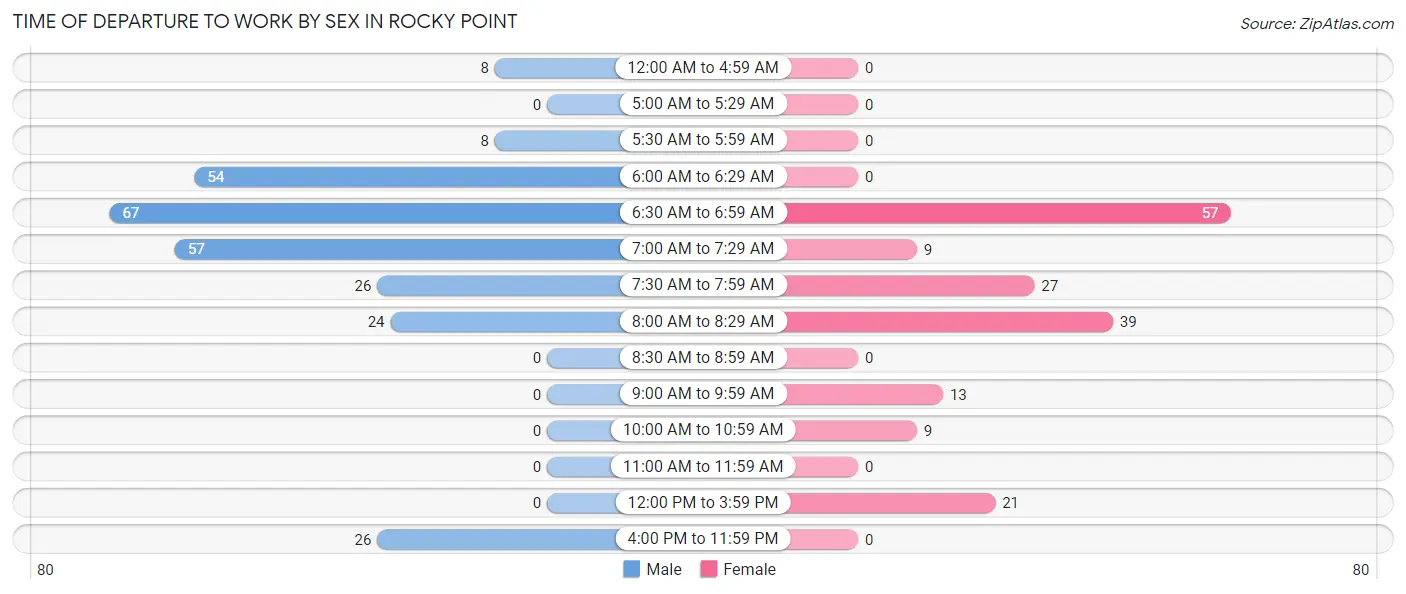
| Time of Departure | Male | Female |
| 12:00 AM to 4:59 AM | 8 (3.0%) | 0 (0.0%) |
| 5:00 AM to 5:29 AM | 0 (0.0%) | 0 (0.0%) |
| 5:30 AM to 5:59 AM | 8 (3.0%) | 0 (0.0%) |
| 6:00 AM to 6:29 AM | 54 (20.0%) | 0 (0.0%) |
| 6:30 AM to 6:59 AM | 67 (24.8%) | 57 (32.6%) |
| 7:00 AM to 7:29 AM | 57 (21.1%) | 9 (5.1%) |
| 7:30 AM to 7:59 AM | 26 (9.6%) | 27 (15.4%) |
| 8:00 AM to 8:29 AM | 24 (8.9%) | 39 (22.3%) |
| 8:30 AM to 8:59 AM | 0 (0.0%) | 0 (0.0%) |
| 9:00 AM to 9:59 AM | 0 (0.0%) | 13 (7.4%) |
| 10:00 AM to 10:59 AM | 0 (0.0%) | 9 (5.1%) |
| 11:00 AM to 11:59 AM | 0 (0.0%) | 0 (0.0%) |
| 12:00 PM to 3:59 PM | 0 (0.0%) | 21 (12.0%) |
| 4:00 PM to 11:59 PM | 26 (9.6%) | 0 (0.0%) |
| Total | 270 (100.0%) | 175 (100.0%) |
Housing Occupancy in Rocky Point
Occupancy by Ownership in Rocky Point
Of the total 412 dwellings in Rocky Point, owner-occupied units account for 299 (72.6%), while renter-occupied units make up 113 (27.4%).
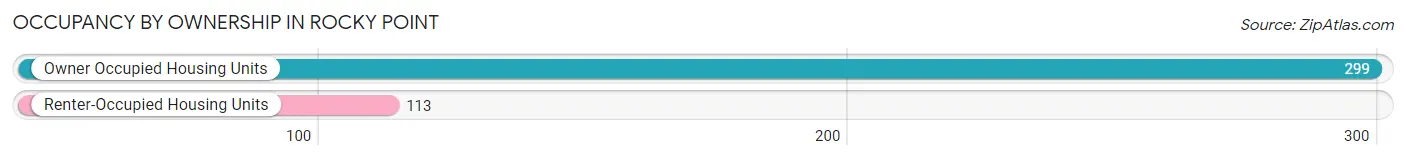
| Occupancy | # Housing Units | % Housing Units |
| Owner Occupied Housing Units | 299 | 72.6% |
| Renter-Occupied Housing Units | 113 | 27.4% |
| Total Occupied Housing Units | 412 | 100.0% |
Occupancy by Household Size in Rocky Point
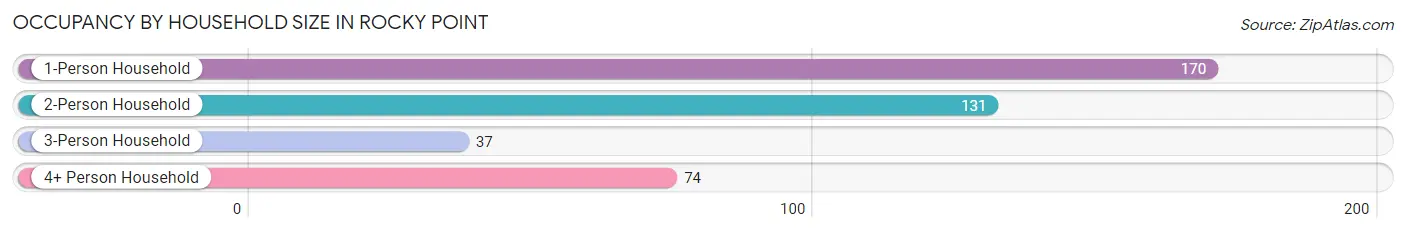
| Household Size | # Housing Units | % Housing Units |
| 1-Person Household | 170 | 41.3% |
| 2-Person Household | 131 | 31.8% |
| 3-Person Household | 37 | 9.0% |
| 4+ Person Household | 74 | 18.0% |
| Total Housing Units | 412 | 100.0% |
Occupancy by Ownership by Household Size in Rocky Point
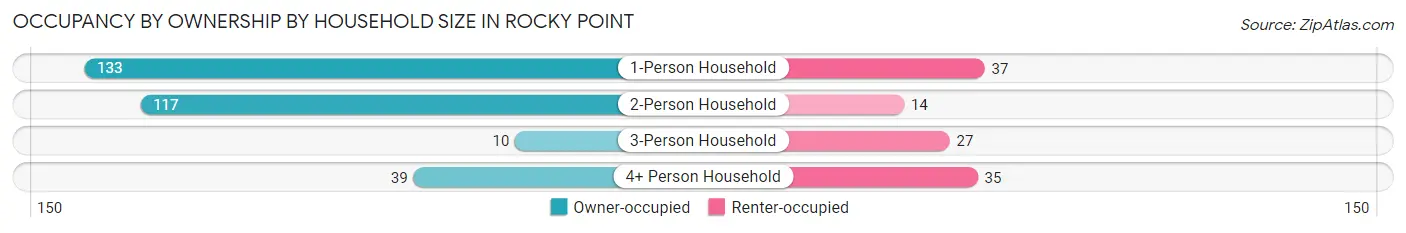
| Household Size | Owner-occupied | Renter-occupied |
| 1-Person Household | 133 (78.2%) | 37 (21.8%) |
| 2-Person Household | 117 (89.3%) | 14 (10.7%) |
| 3-Person Household | 10 (27.0%) | 27 (73.0%) |
| 4+ Person Household | 39 (52.7%) | 35 (47.3%) |
| Total Housing Units | 299 (72.6%) | 113 (27.4%) |
Occupancy by Educational Attainment in Rocky Point
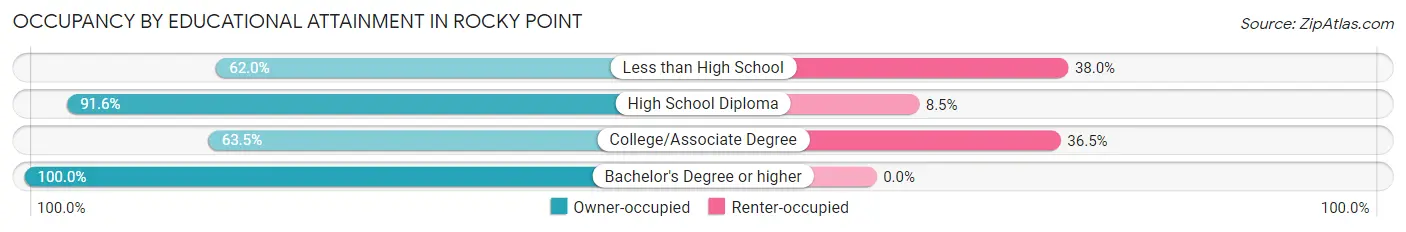
| Household Size | Owner-occupied | Renter-occupied |
| Less than High School | 75 (62.0%) | 46 (38.0%) |
| High School Diploma | 65 (91.5%) | 6 (8.5%) |
| College/Associate Degree | 106 (63.5%) | 61 (36.5%) |
| Bachelor's Degree or higher | 53 (100.0%) | 0 (0.0%) |
Occupancy by Age of Householder in Rocky Point
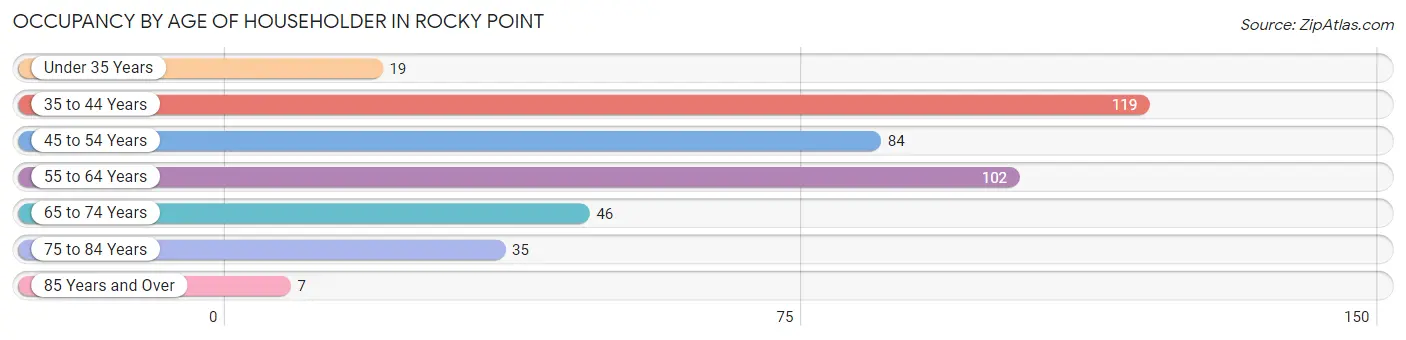
| Age Bracket | # Households | % Households |
| Under 35 Years | 19 | 4.6% |
| 35 to 44 Years | 119 | 28.9% |
| 45 to 54 Years | 84 | 20.4% |
| 55 to 64 Years | 102 | 24.8% |
| 65 to 74 Years | 46 | 11.2% |
| 75 to 84 Years | 35 | 8.5% |
| 85 Years and Over | 7 | 1.7% |
| Total | 412 | 100.0% |
Housing Finances in Rocky Point
Median Income by Occupancy in Rocky Point
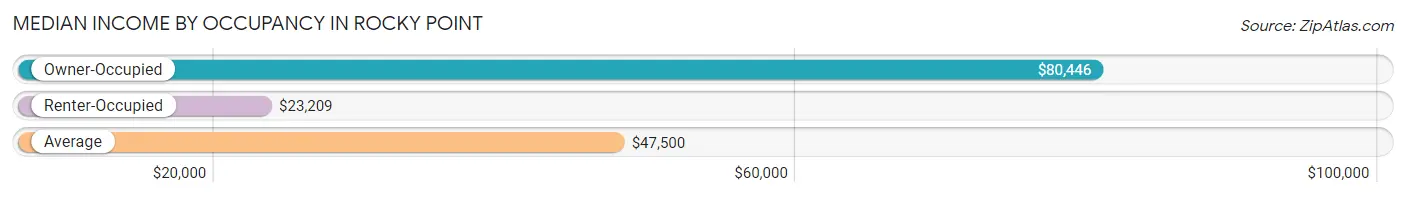
| Occupancy Type | # Households | Median Income |
| Owner-Occupied | 299 (72.6%) | $80,446 |
| Renter-Occupied | 113 (27.4%) | $23,209 |
| Average | 412 (100.0%) | $47,500 |
Occupancy by Householder Income Bracket in Rocky Point
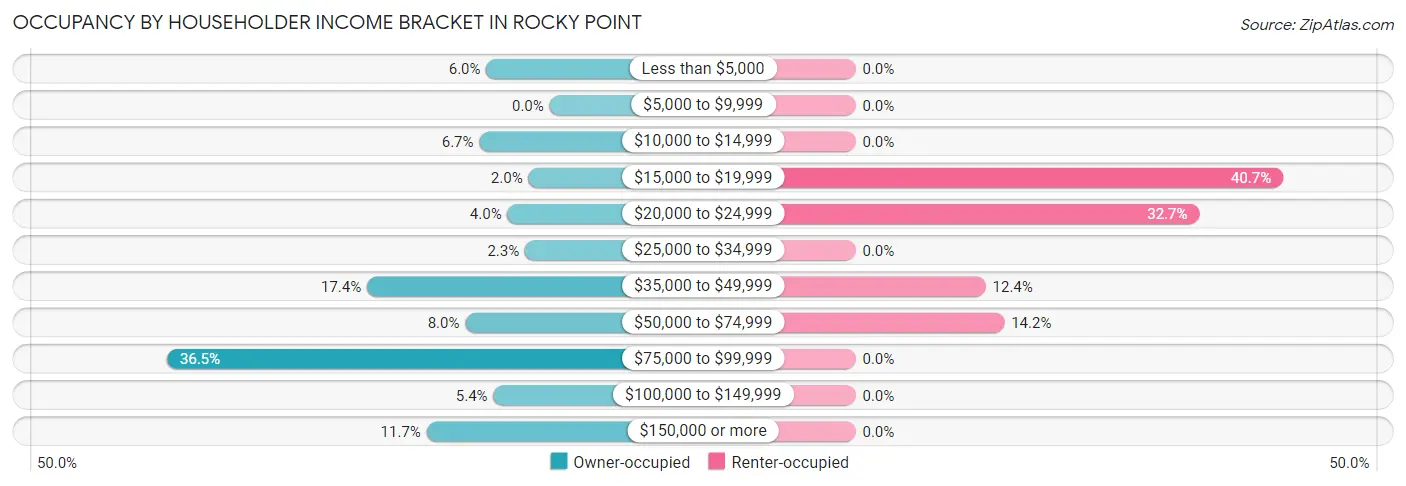
| Income Bracket | Owner-occupied | Renter-occupied |
| Less than $5,000 | 18 (6.0%) | 0 (0.0%) |
| $5,000 to $9,999 | 0 (0.0%) | 0 (0.0%) |
| $10,000 to $14,999 | 20 (6.7%) | 0 (0.0%) |
| $15,000 to $19,999 | 6 (2.0%) | 46 (40.7%) |
| $20,000 to $24,999 | 12 (4.0%) | 37 (32.7%) |
| $25,000 to $34,999 | 7 (2.3%) | 0 (0.0%) |
| $35,000 to $49,999 | 52 (17.4%) | 14 (12.4%) |
| $50,000 to $74,999 | 24 (8.0%) | 16 (14.2%) |
| $75,000 to $99,999 | 109 (36.4%) | 0 (0.0%) |
| $100,000 to $149,999 | 16 (5.3%) | 0 (0.0%) |
| $150,000 or more | 35 (11.7%) | 0 (0.0%) |
| Total | 299 (100.0%) | 113 (100.0%) |
Monthly Housing Cost Tiers in Rocky Point
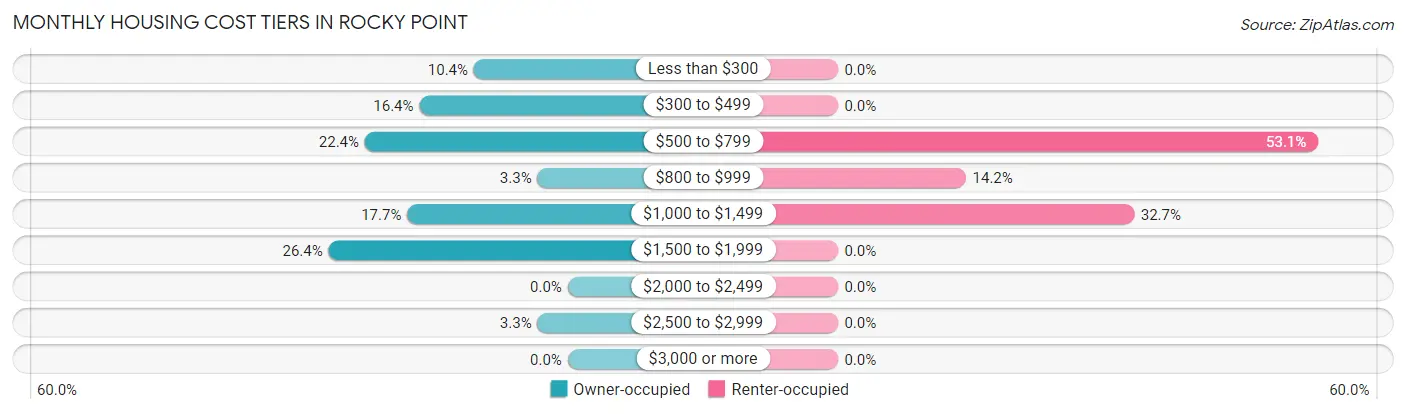
| Monthly Cost | Owner-occupied | Renter-occupied |
| Less than $300 | 31 (10.4%) | 0 (0.0%) |
| $300 to $499 | 49 (16.4%) | 0 (0.0%) |
| $500 to $799 | 67 (22.4%) | 60 (53.1%) |
| $800 to $999 | 10 (3.3%) | 16 (14.2%) |
| $1,000 to $1,499 | 53 (17.7%) | 37 (32.7%) |
| $1,500 to $1,999 | 79 (26.4%) | 0 (0.0%) |
| $2,000 to $2,499 | 0 (0.0%) | 0 (0.0%) |
| $2,500 to $2,999 | 10 (3.3%) | 0 (0.0%) |
| $3,000 or more | 0 (0.0%) | 0 (0.0%) |
| Total | 299 (100.0%) | 113 (100.0%) |
Physical Housing Characteristics in Rocky Point
Housing Structures in Rocky Point
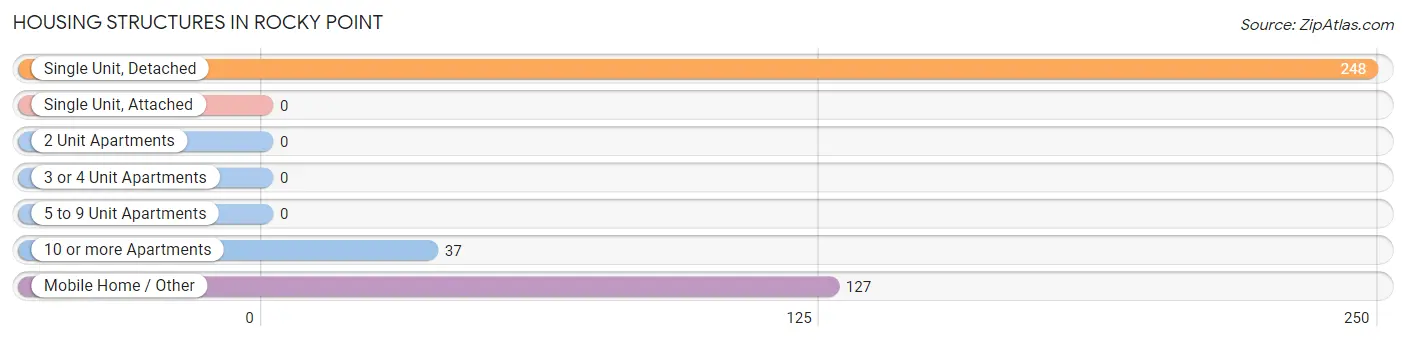
| Structure Type | # Housing Units | % Housing Units |
| Single Unit, Detached | 248 | 60.2% |
| Single Unit, Attached | 0 | 0.0% |
| 2 Unit Apartments | 0 | 0.0% |
| 3 or 4 Unit Apartments | 0 | 0.0% |
| 5 to 9 Unit Apartments | 0 | 0.0% |
| 10 or more Apartments | 37 | 9.0% |
| Mobile Home / Other | 127 | 30.8% |
| Total | 412 | 100.0% |
Housing Structures by Occupancy in Rocky Point
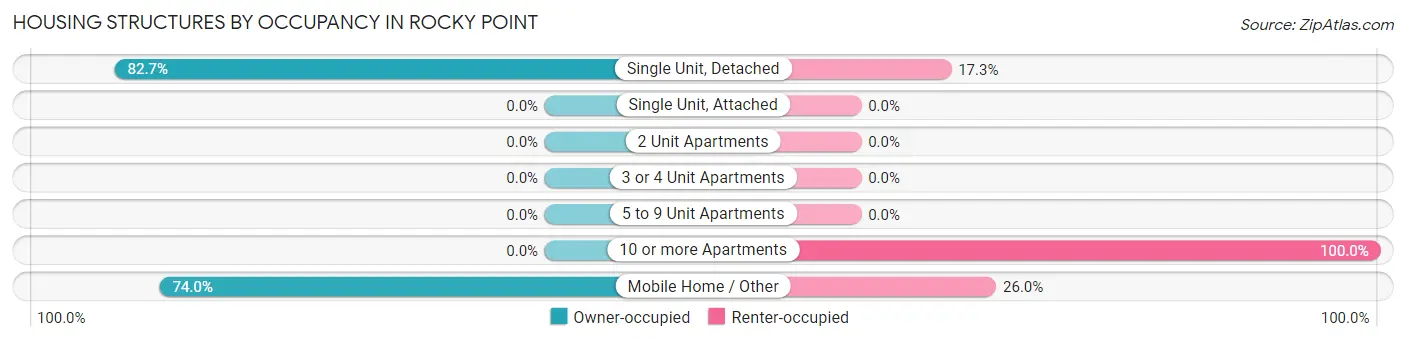
| Structure Type | Owner-occupied | Renter-occupied |
| Single Unit, Detached | 205 (82.7%) | 43 (17.3%) |
| Single Unit, Attached | 0 (0.0%) | 0 (0.0%) |
| 2 Unit Apartments | 0 (0.0%) | 0 (0.0%) |
| 3 or 4 Unit Apartments | 0 (0.0%) | 0 (0.0%) |
| 5 to 9 Unit Apartments | 0 (0.0%) | 0 (0.0%) |
| 10 or more Apartments | 0 (0.0%) | 37 (100.0%) |
| Mobile Home / Other | 94 (74.0%) | 33 (26.0%) |
| Total | 299 (72.6%) | 113 (27.4%) |
Housing Structures by Number of Rooms in Rocky Point
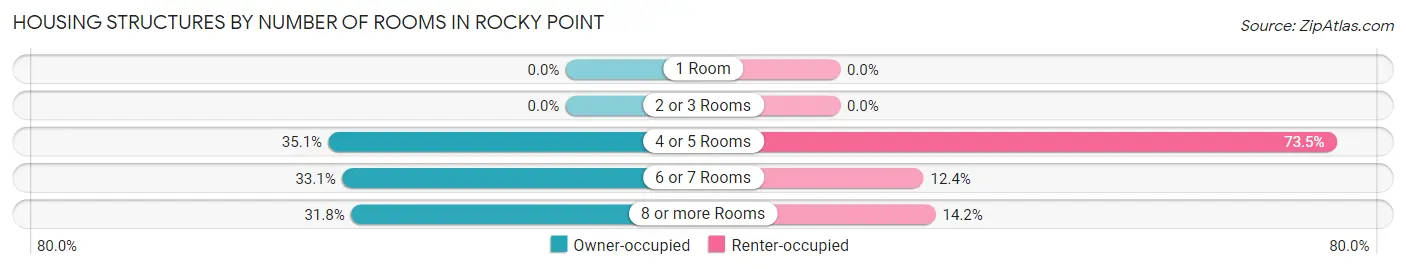
| Number of Rooms | Owner-occupied | Renter-occupied |
| 1 Room | 0 (0.0%) | 0 (0.0%) |
| 2 or 3 Rooms | 0 (0.0%) | 0 (0.0%) |
| 4 or 5 Rooms | 105 (35.1%) | 83 (73.5%) |
| 6 or 7 Rooms | 99 (33.1%) | 14 (12.4%) |
| 8 or more Rooms | 95 (31.8%) | 16 (14.2%) |
| Total | 299 (100.0%) | 113 (100.0%) |
Housing Structure by Heating Type in Rocky Point
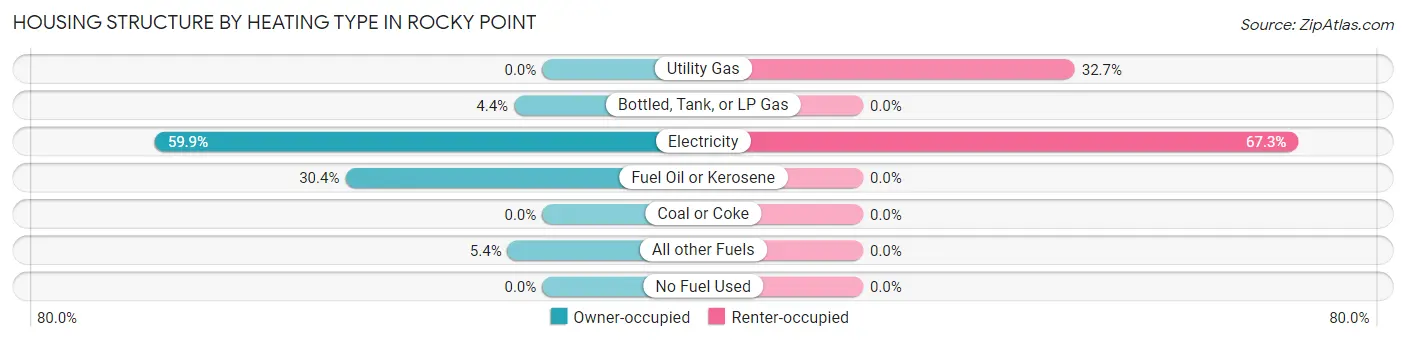
| Heating Type | Owner-occupied | Renter-occupied |
| Utility Gas | 0 (0.0%) | 37 (32.7%) |
| Bottled, Tank, or LP Gas | 13 (4.3%) | 0 (0.0%) |
| Electricity | 179 (59.9%) | 76 (67.3%) |
| Fuel Oil or Kerosene | 91 (30.4%) | 0 (0.0%) |
| Coal or Coke | 0 (0.0%) | 0 (0.0%) |
| All other Fuels | 16 (5.3%) | 0 (0.0%) |
| No Fuel Used | 0 (0.0%) | 0 (0.0%) |
| Total | 299 (100.0%) | 113 (100.0%) |
Household Vehicle Usage in Rocky Point
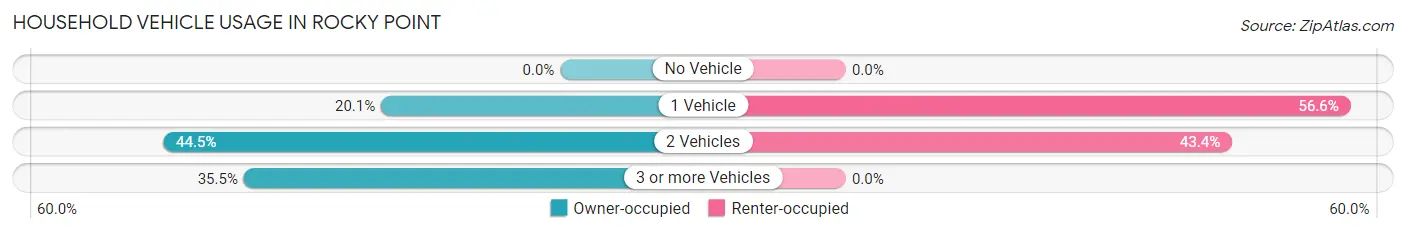
| Vehicles per Household | Owner-occupied | Renter-occupied |
| No Vehicle | 0 (0.0%) | 0 (0.0%) |
| 1 Vehicle | 60 (20.1%) | 64 (56.6%) |
| 2 Vehicles | 133 (44.5%) | 49 (43.4%) |
| 3 or more Vehicles | 106 (35.4%) | 0 (0.0%) |
| Total | 299 (100.0%) | 113 (100.0%) |
Real Estate & Mortgages in Rocky Point
Real Estate and Mortgage Overview in Rocky Point
| Characteristic | Without Mortgage | With Mortgage |
| Housing Units | 117 | 182 |
| Median Property Value | $169,300 | $191,900 |
| Median Household Income | $45,670 | $35 |
| Monthly Housing Costs | $480 | $0 |
| Real Estate Taxes | $1,110 | $36 |
Property Value by Mortgage Status in Rocky Point
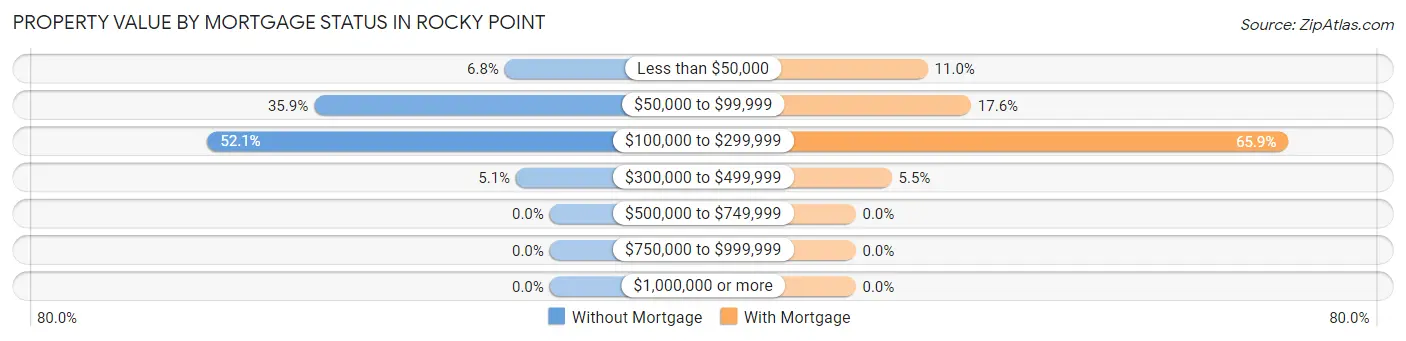
| Property Value | Without Mortgage | With Mortgage |
| Less than $50,000 | 8 (6.8%) | 20 (11.0%) |
| $50,000 to $99,999 | 42 (35.9%) | 32 (17.6%) |
| $100,000 to $299,999 | 61 (52.1%) | 120 (65.9%) |
| $300,000 to $499,999 | 6 (5.1%) | 10 (5.5%) |
| $500,000 to $749,999 | 0 (0.0%) | 0 (0.0%) |
| $750,000 to $999,999 | 0 (0.0%) | 0 (0.0%) |
| $1,000,000 or more | 0 (0.0%) | 0 (0.0%) |
| Total | 117 (100.0%) | 182 (100.0%) |
Household Income by Mortgage Status in Rocky Point
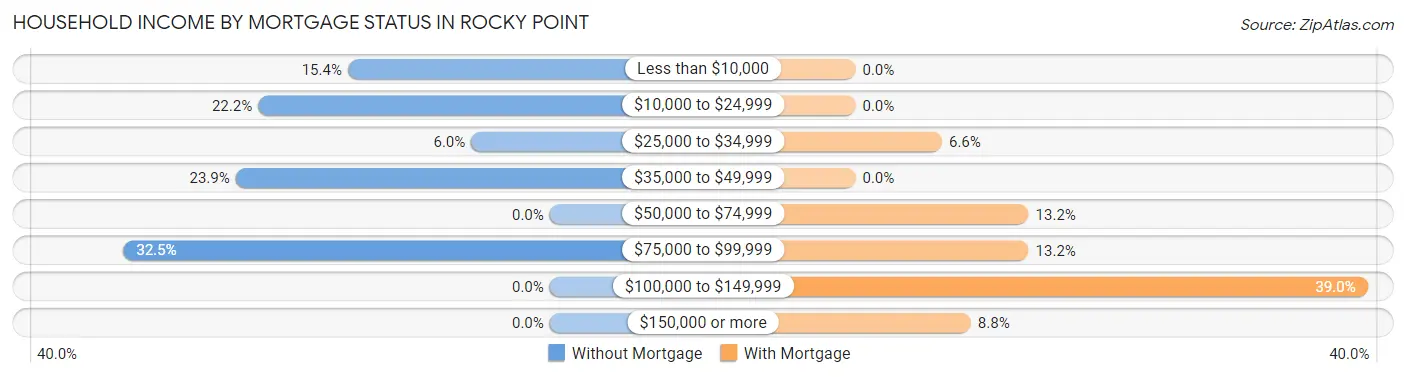
| Household Income | Without Mortgage | With Mortgage |
| Less than $10,000 | 18 (15.4%) | 0 (0.0%) |
| $10,000 to $24,999 | 26 (22.2%) | 0 (0.0%) |
| $25,000 to $34,999 | 7 (6.0%) | 12 (6.6%) |
| $35,000 to $49,999 | 28 (23.9%) | 0 (0.0%) |
| $50,000 to $74,999 | 0 (0.0%) | 24 (13.2%) |
| $75,000 to $99,999 | 38 (32.5%) | 24 (13.2%) |
| $100,000 to $149,999 | 0 (0.0%) | 71 (39.0%) |
| $150,000 or more | 0 (0.0%) | 16 (8.8%) |
| Total | 117 (100.0%) | 182 (100.0%) |
Property Value to Household Income Ratio in Rocky Point
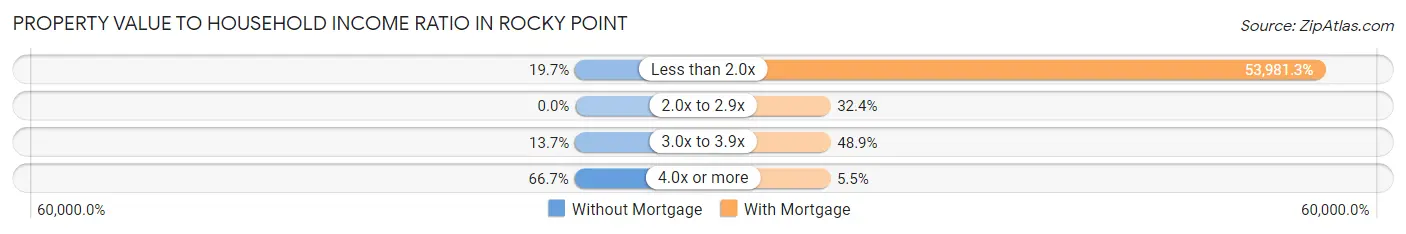
| Value-to-Income Ratio | Without Mortgage | With Mortgage |
| Less than 2.0x | 23 (19.7%) | 98,246 (53,981.3%) |
| 2.0x to 2.9x | 0 (0.0%) | 59 (32.4%) |
| 3.0x to 3.9x | 16 (13.7%) | 89 (48.9%) |
| 4.0x or more | 78 (66.7%) | 10 (5.5%) |
| Total | 117 (100.0%) | 182 (100.0%) |
Real Estate Taxes by Mortgage Status in Rocky Point
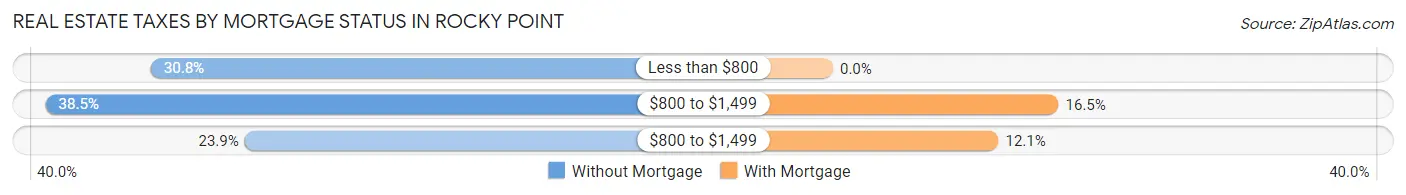
| Property Taxes | Without Mortgage | With Mortgage |
| Less than $800 | 36 (30.8%) | 0 (0.0%) |
| $800 to $1,499 | 45 (38.5%) | 30 (16.5%) |
| $800 to $1,499 | 28 (23.9%) | 22 (12.1%) |
| Total | 117 (100.0%) | 182 (100.0%) |
Health & Disability in Rocky Point
Health Insurance Coverage by Age in Rocky Point
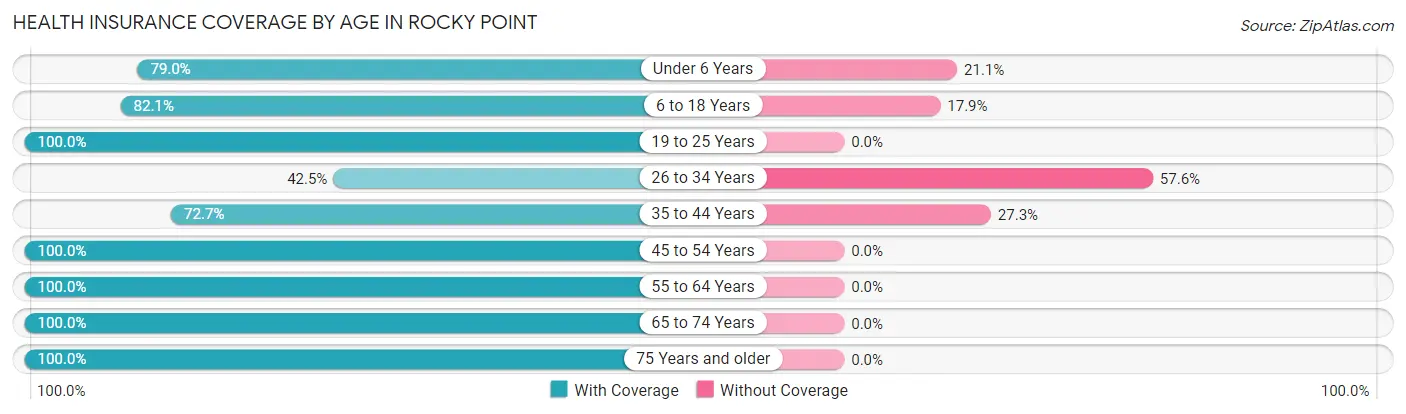
| Age Bracket | With Coverage | Without Coverage |
| Under 6 Years | 45 (78.9%) | 12 (21.0%) |
| 6 to 18 Years | 165 (82.1%) | 36 (17.9%) |
| 19 to 25 Years | 13 (100.0%) | 0 (0.0%) |
| 26 to 34 Years | 45 (42.4%) | 61 (57.6%) |
| 35 to 44 Years | 101 (72.7%) | 38 (27.3%) |
| 45 to 54 Years | 164 (100.0%) | 0 (0.0%) |
| 55 to 64 Years | 131 (100.0%) | 0 (0.0%) |
| 65 to 74 Years | 66 (100.0%) | 0 (0.0%) |
| 75 Years and older | 63 (100.0%) | 0 (0.0%) |
| Total | 793 (84.4%) | 147 (15.6%) |
Health Insurance Coverage by Citizenship Status in Rocky Point
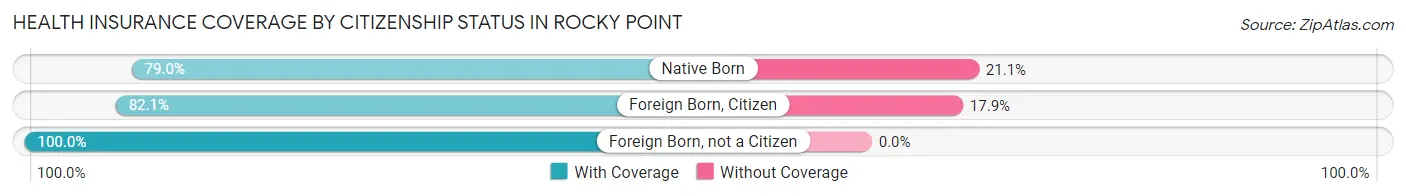
| Citizenship Status | With Coverage | Without Coverage |
| Native Born | 45 (78.9%) | 12 (21.0%) |
| Foreign Born, Citizen | 165 (82.1%) | 36 (17.9%) |
| Foreign Born, not a Citizen | 13 (100.0%) | 0 (0.0%) |
Health Insurance Coverage by Household Income in Rocky Point
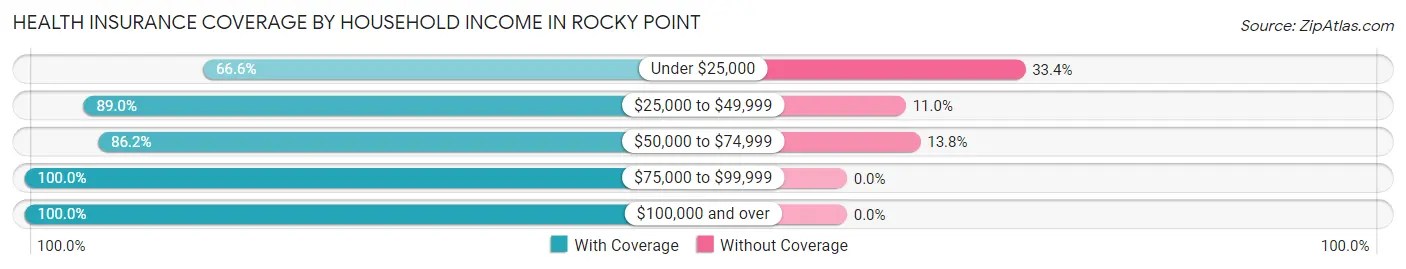
| Household Income | With Coverage | Without Coverage |
| Under $25,000 | 221 (66.6%) | 111 (33.4%) |
| $25,000 to $49,999 | 137 (89.0%) | 17 (11.0%) |
| $50,000 to $74,999 | 119 (86.2%) | 19 (13.8%) |
| $75,000 to $99,999 | 212 (100.0%) | 0 (0.0%) |
| $100,000 and over | 104 (100.0%) | 0 (0.0%) |
Public vs Private Health Insurance Coverage by Age in Rocky Point
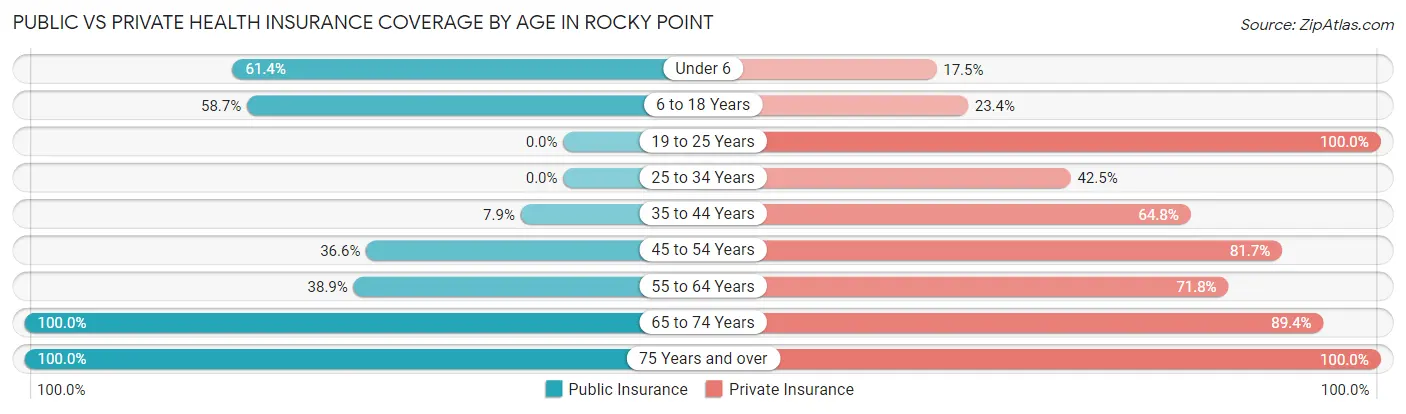
| Age Bracket | Public Insurance | Private Insurance |
| Under 6 | 35 (61.4%) | 10 (17.5%) |
| 6 to 18 Years | 118 (58.7%) | 47 (23.4%) |
| 19 to 25 Years | 0 (0.0%) | 13 (100.0%) |
| 25 to 34 Years | 0 (0.0%) | 45 (42.4%) |
| 35 to 44 Years | 11 (7.9%) | 90 (64.7%) |
| 45 to 54 Years | 60 (36.6%) | 134 (81.7%) |
| 55 to 64 Years | 51 (38.9%) | 94 (71.8%) |
| 65 to 74 Years | 66 (100.0%) | 59 (89.4%) |
| 75 Years and over | 63 (100.0%) | 63 (100.0%) |
| Total | 404 (43.0%) | 555 (59.0%) |
Disability Status by Sex by Age in Rocky Point
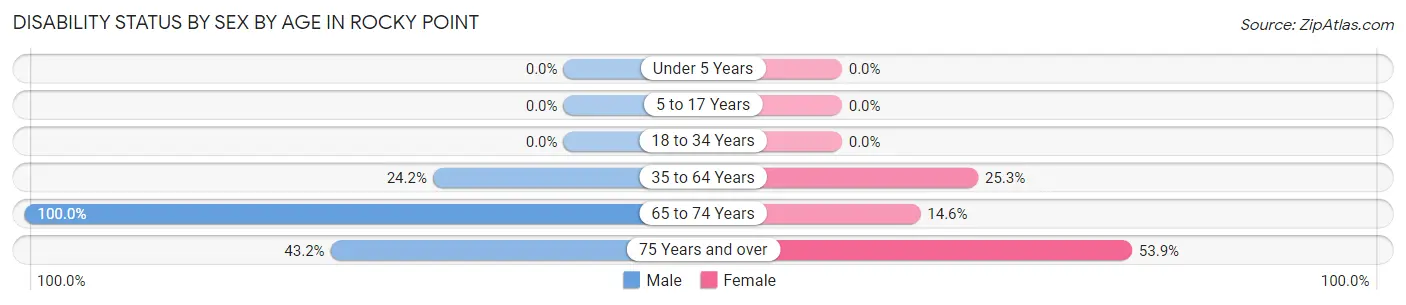
| Age Bracket | Male | Female |
| Under 5 Years | 0 (0.0%) | 0 (0.0%) |
| 5 to 17 Years | 0 (0.0%) | 0 (0.0%) |
| 18 to 34 Years | 0 (0.0%) | 0 (0.0%) |
| 35 to 64 Years | 64 (24.2%) | 43 (25.3%) |
| 65 to 74 Years | 18 (100.0%) | 7 (14.6%) |
| 75 Years and over | 16 (43.2%) | 14 (53.8%) |
Disability Class by Sex by Age in Rocky Point
Disability Class: Hearing Difficulty
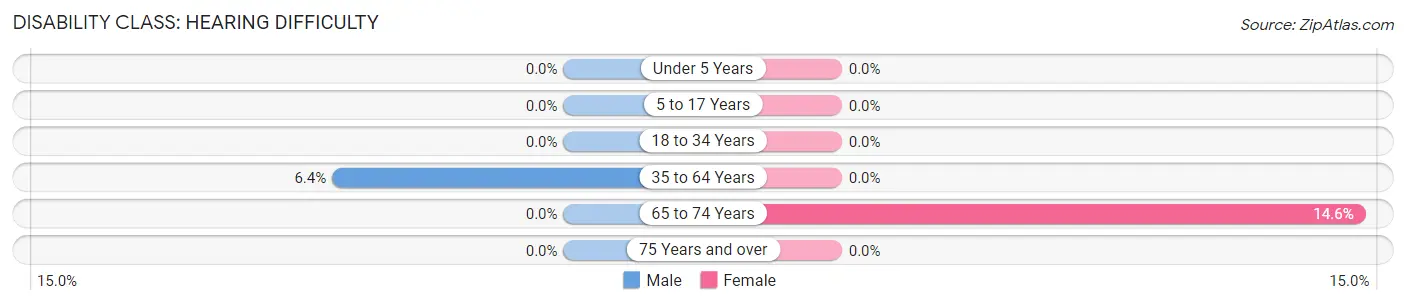
| Age Bracket | Male | Female |
| Under 5 Years | 0 (0.0%) | 0 (0.0%) |
| 5 to 17 Years | 0 (0.0%) | 0 (0.0%) |
| 18 to 34 Years | 0 (0.0%) | 0 (0.0%) |
| 35 to 64 Years | 17 (6.4%) | 0 (0.0%) |
| 65 to 74 Years | 0 (0.0%) | 7 (14.6%) |
| 75 Years and over | 0 (0.0%) | 0 (0.0%) |
Disability Class: Vision Difficulty
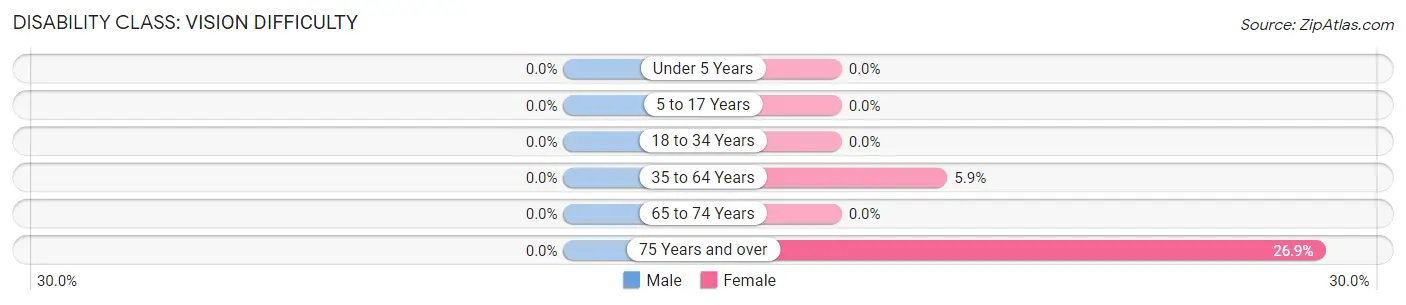
| Age Bracket | Male | Female |
| Under 5 Years | 0 (0.0%) | 0 (0.0%) |
| 5 to 17 Years | 0 (0.0%) | 0 (0.0%) |
| 18 to 34 Years | 0 (0.0%) | 0 (0.0%) |
| 35 to 64 Years | 0 (0.0%) | 10 (5.9%) |
| 65 to 74 Years | 0 (0.0%) | 0 (0.0%) |
| 75 Years and over | 0 (0.0%) | 7 (26.9%) |
Disability Class: Cognitive Difficulty
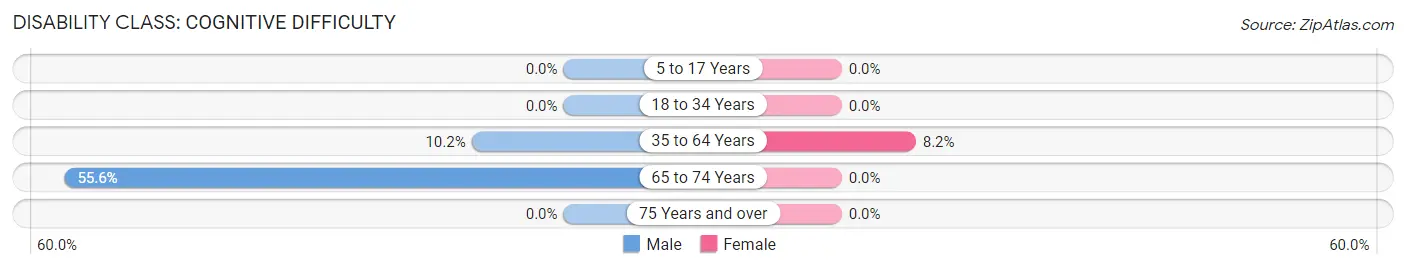
| Age Bracket | Male | Female |
| 5 to 17 Years | 0 (0.0%) | 0 (0.0%) |
| 18 to 34 Years | 0 (0.0%) | 0 (0.0%) |
| 35 to 64 Years | 27 (10.2%) | 14 (8.2%) |
| 65 to 74 Years | 10 (55.6%) | 0 (0.0%) |
| 75 Years and over | 0 (0.0%) | 0 (0.0%) |
Disability Class: Ambulatory Difficulty
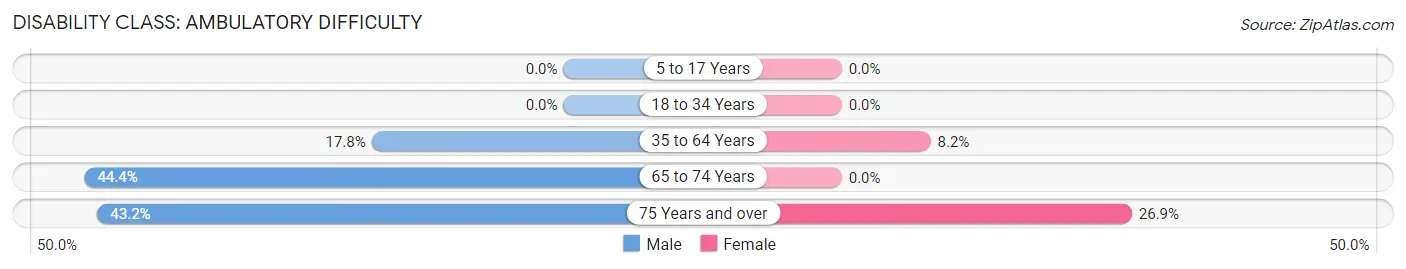
| Age Bracket | Male | Female |
| 5 to 17 Years | 0 (0.0%) | 0 (0.0%) |
| 18 to 34 Years | 0 (0.0%) | 0 (0.0%) |
| 35 to 64 Years | 47 (17.8%) | 14 (8.2%) |
| 65 to 74 Years | 8 (44.4%) | 0 (0.0%) |
| 75 Years and over | 16 (43.2%) | 7 (26.9%) |
Disability Class: Self-Care Difficulty
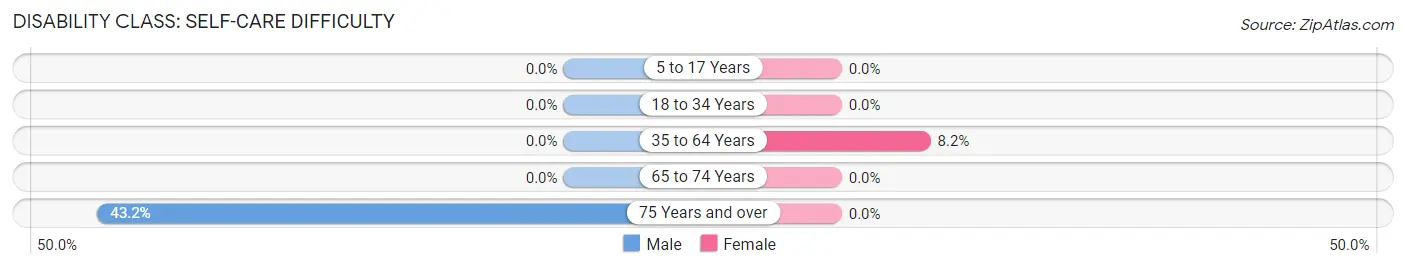
| Age Bracket | Male | Female |
| 5 to 17 Years | 0 (0.0%) | 0 (0.0%) |
| 18 to 34 Years | 0 (0.0%) | 0 (0.0%) |
| 35 to 64 Years | 0 (0.0%) | 14 (8.2%) |
| 65 to 74 Years | 0 (0.0%) | 0 (0.0%) |
| 75 Years and over | 16 (43.2%) | 0 (0.0%) |
Technology Access in Rocky Point
Computing Device Access in Rocky Point
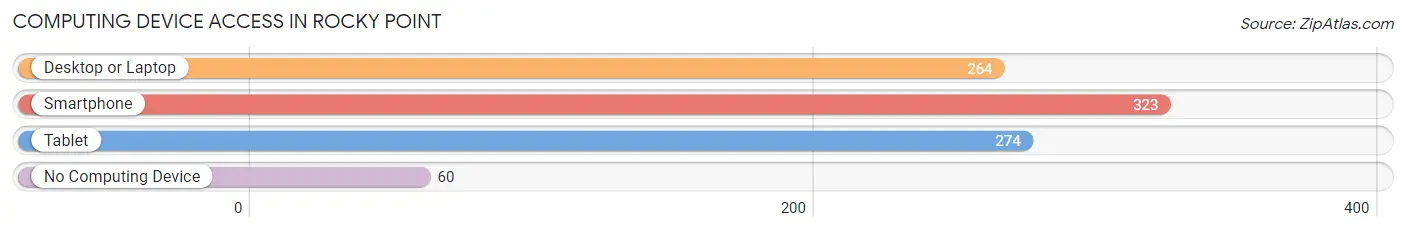
| Device Type | # Households | % Households |
| Desktop or Laptop | 264 | 64.1% |
| Smartphone | 323 | 78.4% |
| Tablet | 274 | 66.5% |
| No Computing Device | 60 | 14.6% |
| Total | 412 | 100.0% |
Internet Access in Rocky Point
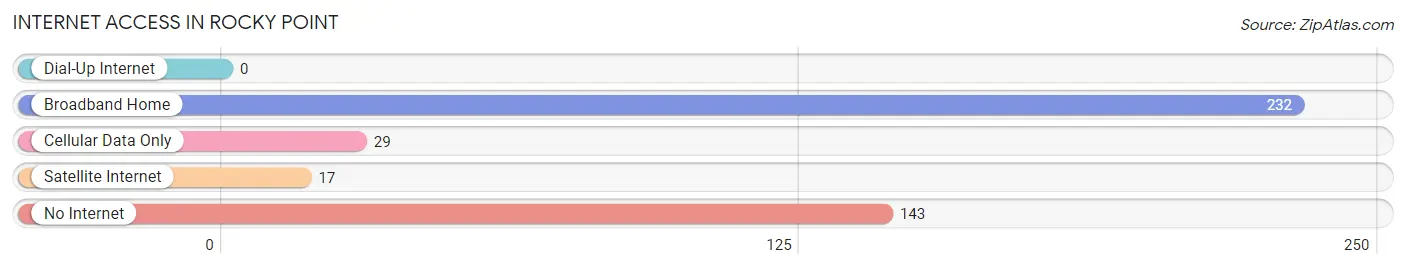
| Internet Type | # Households | % Households |
| Dial-Up Internet | 0 | 0.0% |
| Broadband Home | 232 | 56.3% |
| Cellular Data Only | 29 | 7.0% |
| Satellite Internet | 17 | 4.1% |
| No Internet | 143 | 34.7% |
| Total | 412 | 100.0% |
Rocky Point Summary
Rocky Point is a small town located in Pender County, North Carolina. It is situated on the banks of the Northeast Cape Fear River, approximately 25 miles north of Wilmington. The town was founded in the late 1800s and has a population of approximately 1,500 people.
History
Rocky Point was first settled in the late 1800s by a group of settlers from Scotland. The town was originally called “McRae’s Landing” after the first settler, John McRae. The town was renamed Rocky Point in 1891, after the rocky point of land that jutted out into the river.
The town grew slowly over the years, and by the early 1900s, it had become a popular destination for fishing and hunting. The town was also known for its oyster beds, which were harvested for their pearls.
In the 1920s, Rocky Point began to experience a period of growth and development. The town was incorporated in 1925, and the first mayor was elected in 1926. The town also saw the construction of a new school, a post office, and a number of businesses.
Geography
Rocky Point is located in Pender County, North Carolina. It is situated on the banks of the Northeast Cape Fear River, approximately 25 miles north of Wilmington. The town is surrounded by a number of small towns and villages, including Burgaw, Atkinson, and Willard.
The town is located in a rural area, and the landscape is mostly flat. The town is located in a humid subtropical climate zone, and the average temperature in the summer is around 80 degrees Fahrenheit.
Economy
The economy of Rocky Point is largely based on agriculture and fishing. The town is home to a number of farms, and the surrounding area is known for its production of tobacco, cotton, and soybeans. The town is also home to a number of seafood processing plants, which process and package seafood for sale in local markets.
The town is also home to a number of small businesses, including restaurants, convenience stores, and gas stations. The town is also home to a number of antique stores, which attract visitors from all over the region.
Demographics
As of the 2010 census, the population of Rocky Point was 1,500 people. The town is predominantly white, with a small African American population. The median household income in the town is $37,000, and the median age is 42 years old.
The town is home to a number of churches, including Baptist, Methodist, and Presbyterian. The town is also home to a number of schools, including Rocky Point Elementary School and Rocky Point High School.
Conclusion
Rocky Point is a small town located in Pender County, North Carolina. It is situated on the banks of the Northeast Cape Fear River, approximately 25 miles north of Wilmington. The town was founded in the late 1800s and has a population of approximately 1,500 people. The economy of Rocky Point is largely based on agriculture and fishing, and the town is home to a number of small businesses. The town is predominantly white, with a small African American population. The median household income in the town is $37,000, and the median age is 42 years old.
Common Questions
What is Per Capita Income in Rocky Point?
Per Capita income in Rocky Point is $29,029.
What is the Median Family Income in Rocky Point?
Median Family Income in Rocky Point is $50,500.
What is the Median Household income in Rocky Point?
Median Household Income in Rocky Point is $47,500.
What is Inequality or Gini Index in Rocky Point?
Inequality or Gini Index in Rocky Point is 0.43.
What is the Total Population of Rocky Point?
Total Population of Rocky Point is 940.
What is the Total Male Population of Rocky Point?
Total Male Population of Rocky Point is 551.
What is the Total Female Population of Rocky Point?
Total Female Population of Rocky Point is 389.
What is the Ratio of Males per 100 Females in Rocky Point?
There are 141.65 Males per 100 Females in Rocky Point.
What is the Ratio of Females per 100 Males in Rocky Point?
There are 70.60 Females per 100 Males in Rocky Point.
What is the Median Population Age in Rocky Point?
Median Population Age in Rocky Point is 40.3 Years.
What is the Average Family Size in Rocky Point
Average Family Size in Rocky Point is 3.2 People.
What is the Average Household Size in Rocky Point
Average Household Size in Rocky Point is 2.3 People.
How Large is the Labor Force in Rocky Point?
There are 495 People in the Labor Forcein in Rocky Point.
What is the Percentage of People in the Labor Force in Rocky Point?
66.4% of People are in the Labor Force in Rocky Point.
What is the Unemployment Rate in Rocky Point?
Unemployment Rate in Rocky Point is 7.5%.