Murphy, NC Map & Demographics
Murphy Map
Murphy Overview
$26,935
PER CAPITA INCOME
$55,089
AVG FAMILY INCOME
$34,283
AVG HOUSEHOLD INCOME
26.8%
WAGE / INCOME GAP [ % ]
73.2¢/ $1
WAGE / INCOME GAP [ $ ]
$6,807
FAMILY INCOME DEFICIT
0.46
INEQUALITY / GINI INDEX
1,549
TOTAL POPULATION
772
MALE POPULATION
777
FEMALE POPULATION
99.36
MALES / 100 FEMALES
100.65
FEMALES / 100 MALES
37.0
MEDIAN AGE
2.8
AVG FAMILY SIZE
1.9
AVG HOUSEHOLD SIZE
607
LABOR FORCE [ PEOPLE ]
44.6%
PERCENT IN LABOR FORCE
7.7%
UNEMPLOYMENT RATE
Murphy Zip Codes
Murphy Area Codes
Income in Murphy
Income Overview in Murphy
Per Capita Income in Murphy is $26,935, while median incomes of families and households are $55,089 and $34,283 respectively.
| Characteristic | Number | Measure |
| Per Capita Income | 1,549 | $26,935 |
| Median Family Income | 329 | $55,089 |
| Mean Family Income | 329 | $70,381 |
| Median Household Income | 754 | $34,283 |
| Mean Household Income | 754 | $53,193 |
| Income Deficit | 329 | $6,807 |
| Wage / Income Gap (%) | 1,549 | 26.77% |
| Wage / Income Gap ($) | 1,549 | 73.23¢ per $1 |
| Gini / Inequality Index | 1,549 | 0.46 |
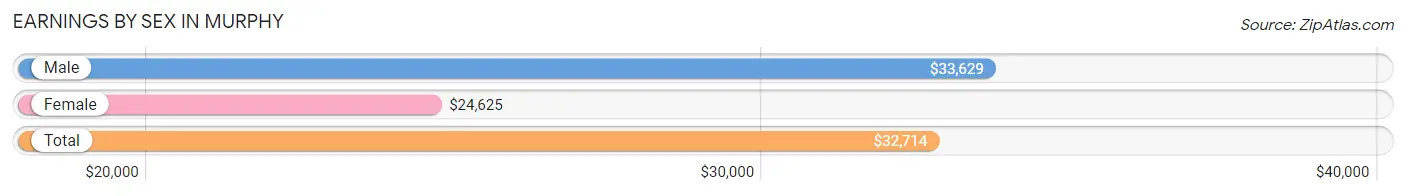
Earnings by Sex in Murphy
Average Earnings in Murphy are $32,714, $33,629 for men and $24,625 for women, a difference of 26.8%.
| Sex | Number | Average Earnings |
| Male | 419 (62.5%) | $33,629 |
| Female | 251 (37.5%) | $24,625 |
| Total | 670 (100.0%) | $32,714 |
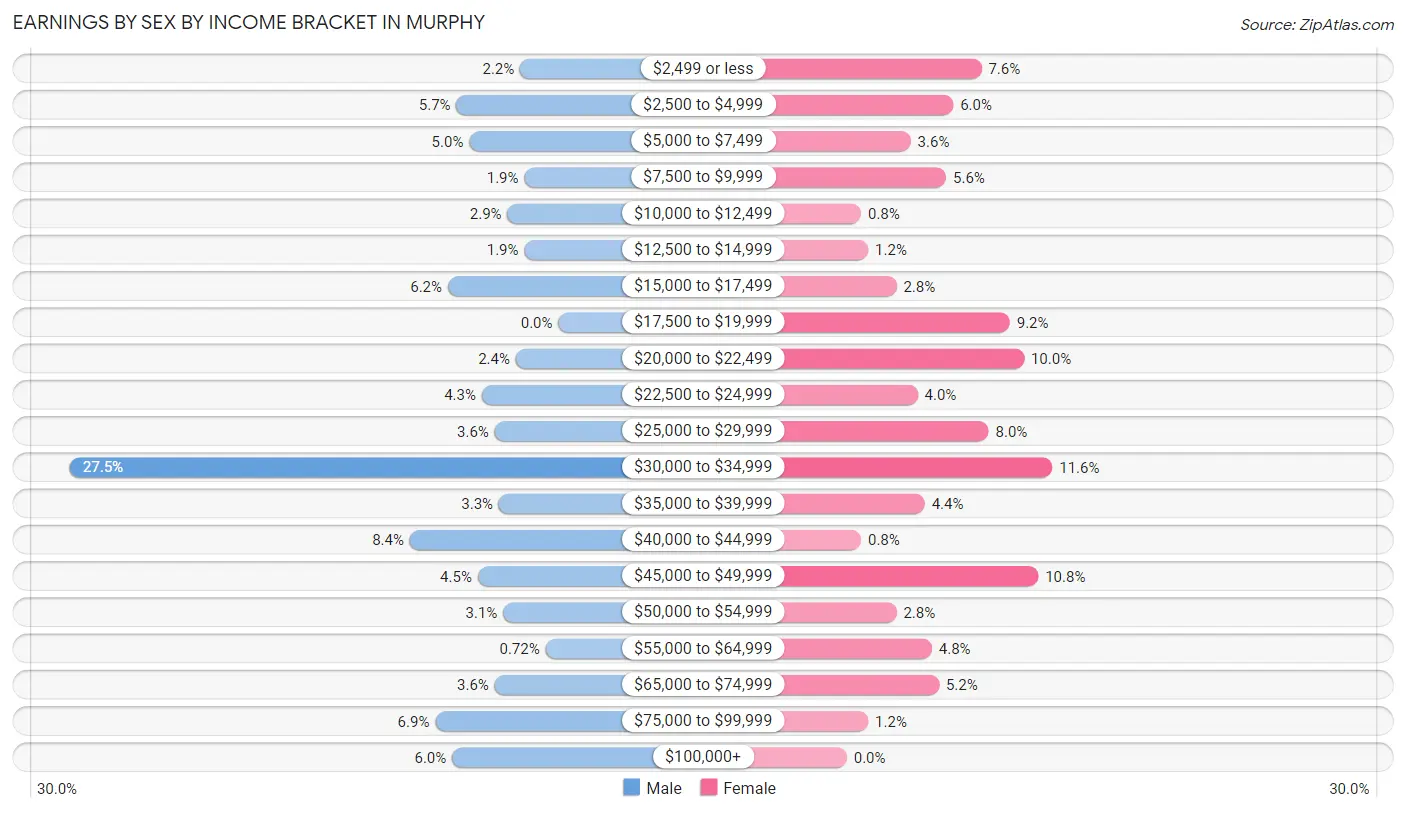
Earnings by Sex by Income Bracket in Murphy
The most common earnings brackets in Murphy are $30,000 to $34,999 for men (115 | 27.5%) and $30,000 to $34,999 for women (29 | 11.6%).
| Income | Male | Female |
| $2,499 or less | 9 (2.1%) | 19 (7.6%) |
| $2,500 to $4,999 | 24 (5.7%) | 15 (6.0%) |
| $5,000 to $7,499 | 21 (5.0%) | 9 (3.6%) |
| $7,500 to $9,999 | 8 (1.9%) | 14 (5.6%) |
| $10,000 to $12,499 | 12 (2.9%) | 2 (0.8%) |
| $12,500 to $14,999 | 8 (1.9%) | 3 (1.2%) |
| $15,000 to $17,499 | 26 (6.2%) | 7 (2.8%) |
| $17,500 to $19,999 | 0 (0.0%) | 23 (9.2%) |
| $20,000 to $22,499 | 10 (2.4%) | 25 (10.0%) |
| $22,500 to $24,999 | 18 (4.3%) | 10 (4.0%) |
| $25,000 to $29,999 | 15 (3.6%) | 20 (8.0%) |
| $30,000 to $34,999 | 115 (27.5%) | 29 (11.6%) |
| $35,000 to $39,999 | 14 (3.3%) | 11 (4.4%) |
| $40,000 to $44,999 | 35 (8.4%) | 2 (0.8%) |
| $45,000 to $49,999 | 19 (4.5%) | 27 (10.8%) |
| $50,000 to $54,999 | 13 (3.1%) | 7 (2.8%) |
| $55,000 to $64,999 | 3 (0.7%) | 12 (4.8%) |
| $65,000 to $74,999 | 15 (3.6%) | 13 (5.2%) |
| $75,000 to $99,999 | 29 (6.9%) | 3 (1.2%) |
| $100,000+ | 25 (6.0%) | 0 (0.0%) |
| Total | 419 (100.0%) | 251 (100.0%) |
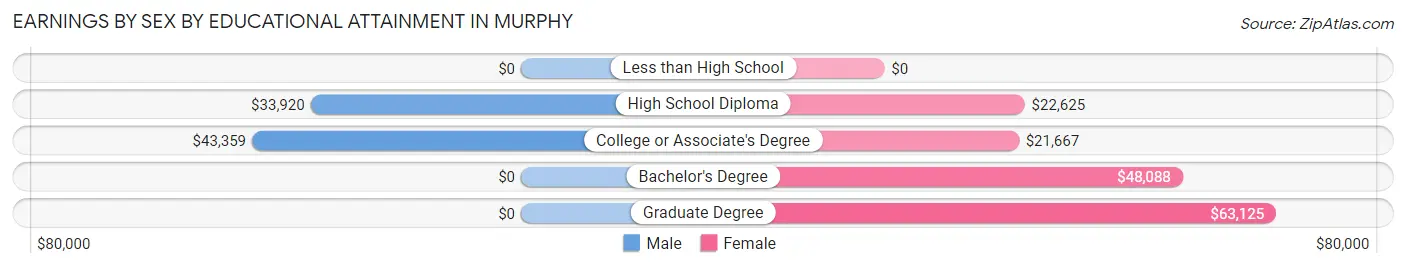
Earnings by Sex by Educational Attainment in Murphy
Average earnings in Murphy are $34,478 for men and $26,667 for women, a difference of 22.7%. Men with an educational attainment of college or associate's degree enjoy the highest average annual earnings of $43,359, while those with high school diploma education earn the least with $33,920. Women with an educational attainment of graduate degree earn the most with the average annual earnings of $63,125, while those with college or associate's degree education have the smallest earnings of $21,667.
| Educational Attainment | Male Income | Female Income |
| Less than High School | - | - |
| High School Diploma | $33,920 | $22,625 |
| College or Associate's Degree | $43,359 | $21,667 |
| Bachelor's Degree | - | - |
| Graduate Degree | - | - |
| Total | $34,478 | $26,667 |
Family Income in Murphy
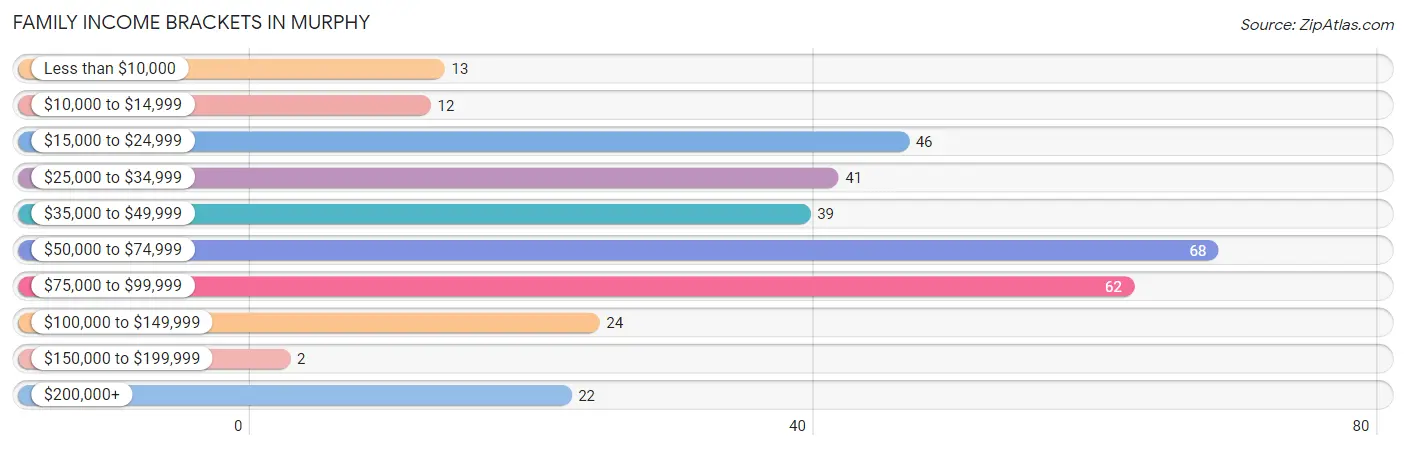
Family Income Brackets in Murphy
According to the Murphy family income data, there are 68 families falling into the $50,000 to $74,999 income range, which is the most common income bracket and makes up 20.7% of all families. Conversely, the $150,000 to $199,999 income bracket is the least frequent group with only 2 families (0.6%) belonging to this category.
| Income Bracket | # Families | % Families |
| Less than $10,000 | 13 | 4.0% |
| $10,000 to $14,999 | 12 | 3.6% |
| $15,000 to $24,999 | 46 | 14.0% |
| $25,000 to $34,999 | 41 | 12.5% |
| $35,000 to $49,999 | 39 | 11.9% |
| $50,000 to $74,999 | 68 | 20.7% |
| $75,000 to $99,999 | 62 | 18.8% |
| $100,000 to $149,999 | 24 | 7.3% |
| $150,000 to $199,999 | 2 | 0.6% |
| $200,000+ | 22 | 6.7% |
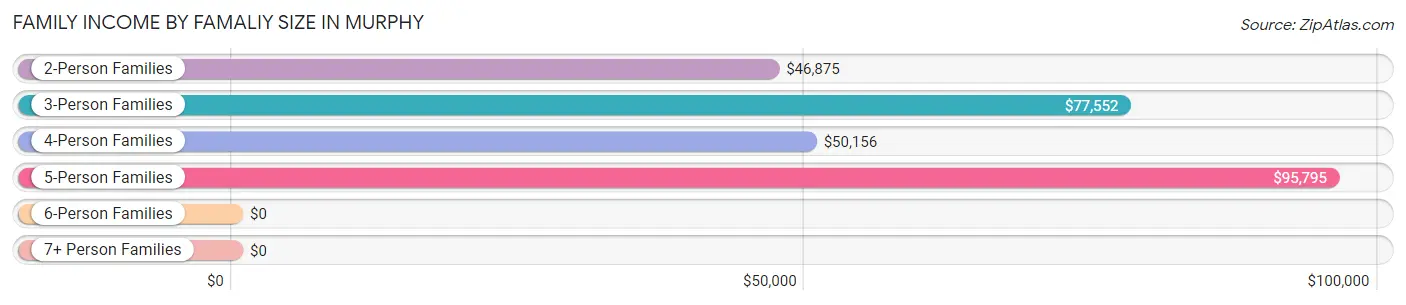
Family Income by Famaliy Size in Murphy
5-person families (21 | 6.4%) account for the highest median family income in Murphy with $95,795 per family, while 3-person families (73 | 22.2%) have the highest median income of $25,851 per family member.
| Income Bracket | # Families | Median Income |
| 2-Person Families | 190 (57.8%) | $46,875 |
| 3-Person Families | 73 (22.2%) | $77,552 |
| 4-Person Families | 45 (13.7%) | $50,156 |
| 5-Person Families | 21 (6.4%) | $95,795 |
| 6-Person Families | 0 (0.0%) | $0 |
| 7+ Person Families | 0 (0.0%) | $0 |
| Total | 329 (100.0%) | $55,089 |
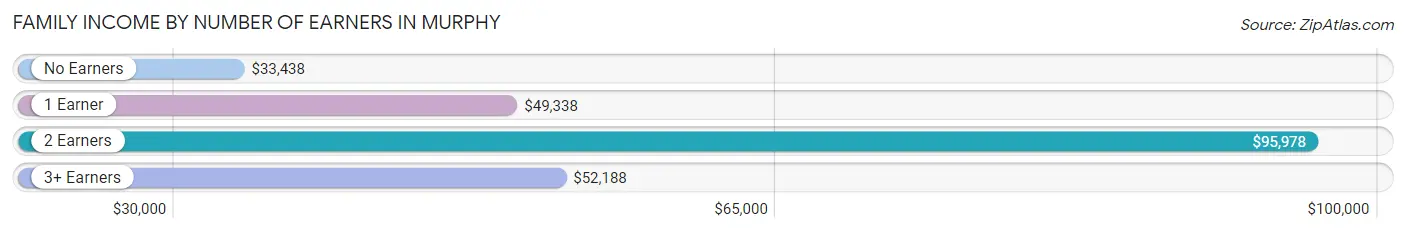
Family Income by Number of Earners in Murphy
The median family income in Murphy is $55,089, with families comprising 2 earners (82) having the highest median family income of $95,978, while families with no earners (92) have the lowest median family income of $33,438, accounting for 24.9% and 28.0% of families, respectively.
| Number of Earners | # Families | Median Income |
| No Earners | 92 (28.0%) | $33,438 |
| 1 Earner | 137 (41.6%) | $49,338 |
| 2 Earners | 82 (24.9%) | $95,978 |
| 3+ Earners | 18 (5.5%) | $52,188 |
| Total | 329 (100.0%) | $55,089 |
Household Income in Murphy
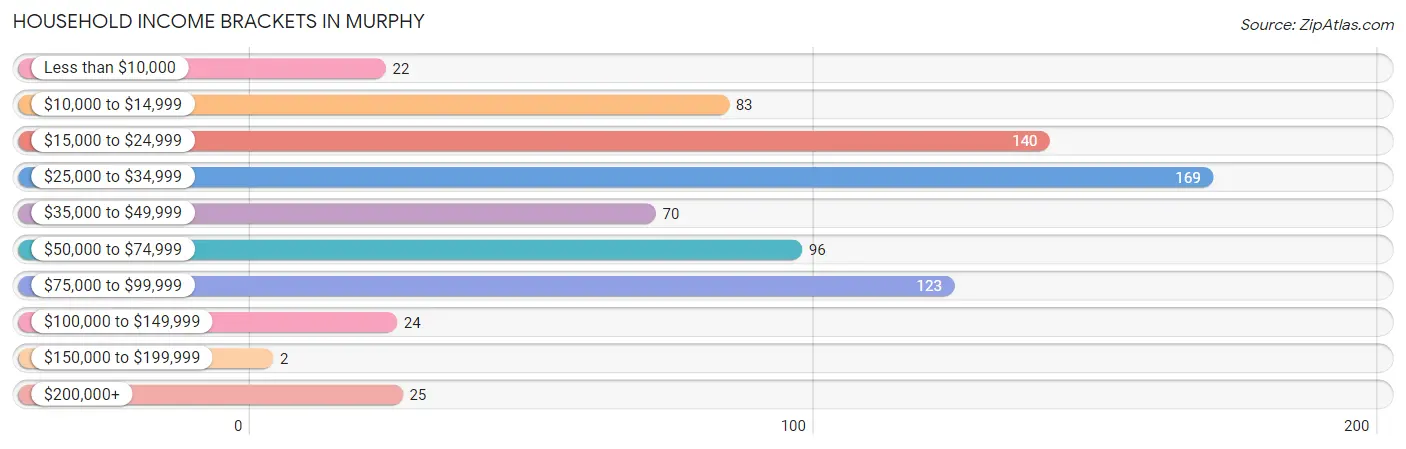
Household Income Brackets in Murphy
With 169 households falling in the category, the $25,000 to $34,999 income range is the most frequent in Murphy, accounting for 22.4% of all households. In contrast, only 2 households (0.3%) fall into the $150,000 to $199,999 income bracket, making it the least populous group.
| Income Bracket | # Households | % Households |
| Less than $10,000 | 22 | 2.9% |
| $10,000 to $14,999 | 83 | 11.0% |
| $15,000 to $24,999 | 140 | 18.6% |
| $25,000 to $34,999 | 169 | 22.4% |
| $35,000 to $49,999 | 70 | 9.3% |
| $50,000 to $74,999 | 96 | 12.7% |
| $75,000 to $99,999 | 123 | 16.3% |
| $100,000 to $149,999 | 24 | 3.2% |
| $150,000 to $199,999 | 2 | 0.3% |
| $200,000+ | 25 | 3.3% |
Household Income by Householder Age in Murphy
The median household income in Murphy is $34,283, with the highest median household income of $37,361 found in the 45 to 64 years age bracket for the primary householder. A total of 137 households (18.2%) fall into this category. Meanwhile, the 15 to 24 years age bracket for the primary householder has the lowest median household income of $0, with 31 households (4.1%) in this group.
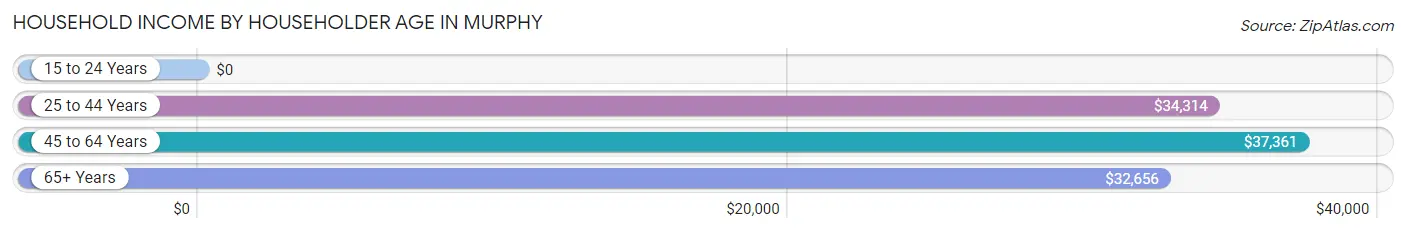
| Income Bracket | # Households | Median Income |
| 15 to 24 Years | 31 (4.1%) | $0 |
| 25 to 44 Years | 268 (35.5%) | $34,314 |
| 45 to 64 Years | 137 (18.2%) | $37,361 |
| 65+ Years | 318 (42.2%) | $32,656 |
| Total | 754 (100.0%) | $34,283 |
Poverty in Murphy
Income Below Poverty by Sex and Age in Murphy
With 15.3% poverty level for males and 27.6% for females among the residents of Murphy, 45 to 54 year old males and under 5 year old females are the most vulnerable to poverty, with 33 males (54.1%) and 10 females (71.4%) in their respective age groups living below the poverty level.
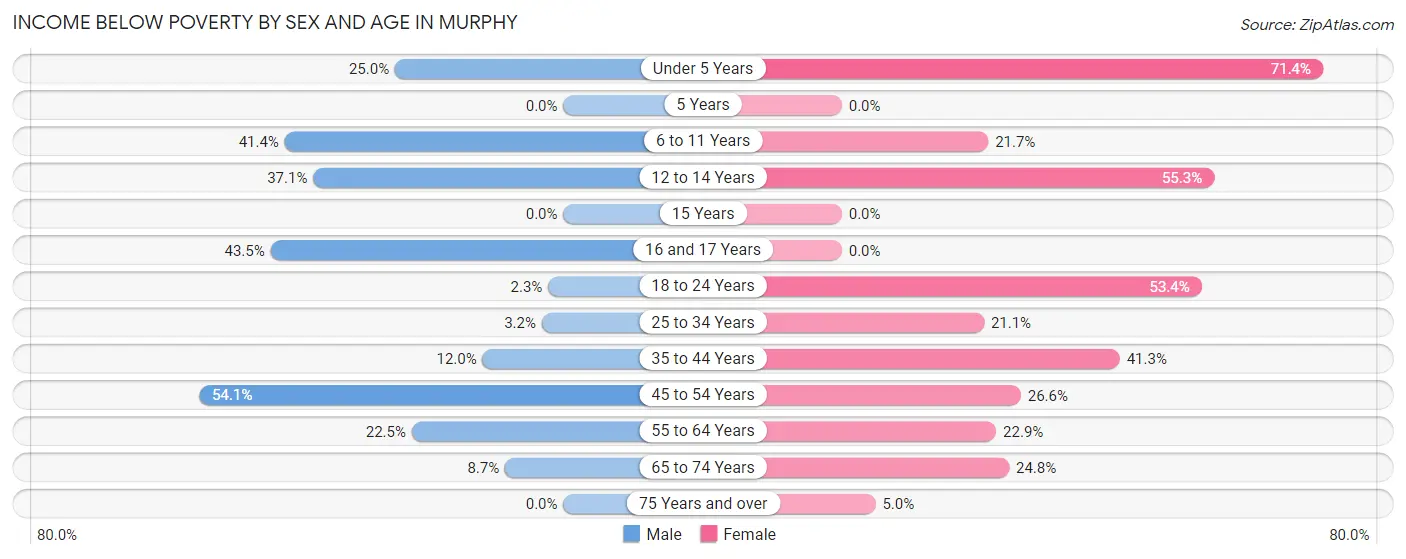
| Age Bracket | Male | Female |
| Under 5 Years | 10 (25.0%) | 10 (71.4%) |
| 5 Years | 0 (0.0%) | 0 (0.0%) |
| 6 to 11 Years | 12 (41.4%) | 5 (21.7%) |
| 12 to 14 Years | 13 (37.1%) | 21 (55.3%) |
| 15 Years | 0 (0.0%) | 0 (0.0%) |
| 16 and 17 Years | 10 (43.5%) | 0 (0.0%) |
| 18 to 24 Years | 2 (2.2%) | 39 (53.4%) |
| 25 to 34 Years | 7 (3.2%) | 19 (21.1%) |
| 35 to 44 Years | 3 (12.0%) | 26 (41.3%) |
| 45 to 54 Years | 33 (54.1%) | 21 (26.6%) |
| 55 to 64 Years | 9 (22.5%) | 11 (22.9%) |
| 65 to 74 Years | 11 (8.7%) | 38 (24.8%) |
| 75 Years and over | 0 (0.0%) | 6 (5.0%) |
| Total | 110 (15.3%) | 196 (27.6%) |
Income Above Poverty by Sex and Age in Murphy
According to the poverty statistics in Murphy, males aged 75 years and over and females aged 5 years are the age groups that are most secure financially, with 100.0% of males and 100.0% of females in these age groups living above the poverty line.
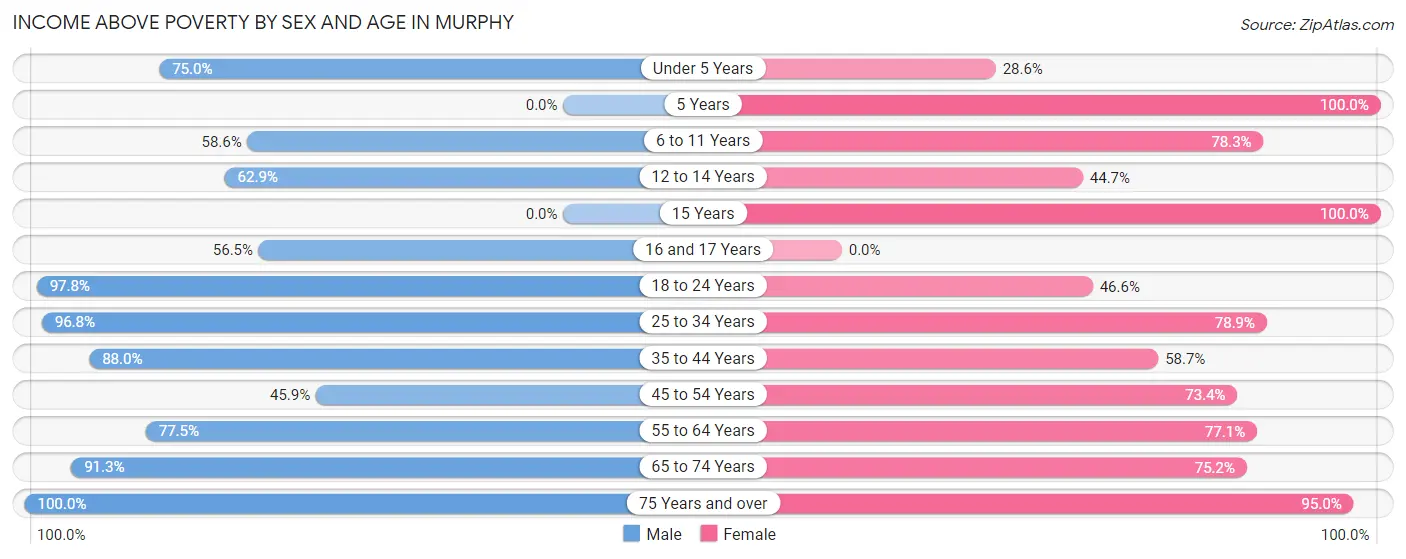
| Age Bracket | Male | Female |
| Under 5 Years | 30 (75.0%) | 4 (28.6%) |
| 5 Years | 0 (0.0%) | 6 (100.0%) |
| 6 to 11 Years | 17 (58.6%) | 18 (78.3%) |
| 12 to 14 Years | 22 (62.9%) | 17 (44.7%) |
| 15 Years | 0 (0.0%) | 2 (100.0%) |
| 16 and 17 Years | 13 (56.5%) | 0 (0.0%) |
| 18 to 24 Years | 87 (97.8%) | 34 (46.6%) |
| 25 to 34 Years | 212 (96.8%) | 71 (78.9%) |
| 35 to 44 Years | 22 (88.0%) | 37 (58.7%) |
| 45 to 54 Years | 28 (45.9%) | 58 (73.4%) |
| 55 to 64 Years | 31 (77.5%) | 37 (77.1%) |
| 65 to 74 Years | 116 (91.3%) | 115 (75.2%) |
| 75 Years and over | 29 (100.0%) | 114 (95.0%) |
| Total | 607 (84.7%) | 513 (72.4%) |
Income Below Poverty Among Married-Couple Families in Murphy
The poverty statistics for married-couple families in Murphy show that 7.7% or 17 of the total 220 families live below the poverty line. Families with no children have the highest poverty rate of 8.7%, comprising of 12 families. On the other hand, families with 3 or 4 children have the lowest poverty rate of 0.0%, which includes 0 families.
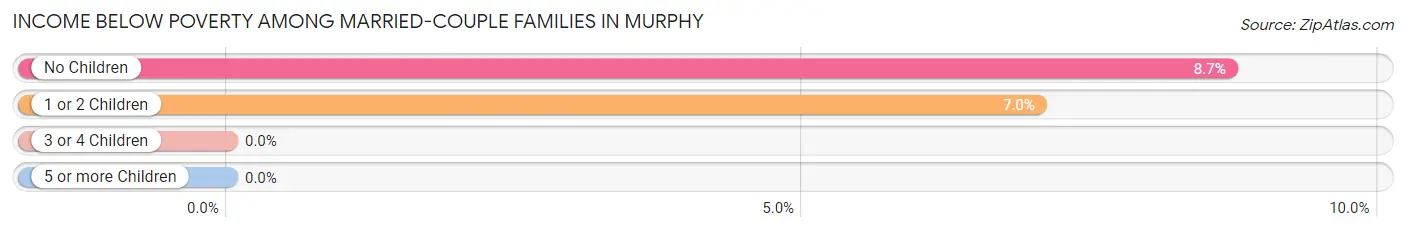
| Children | Above Poverty | Below Poverty |
| No Children | 126 (91.3%) | 12 (8.7%) |
| 1 or 2 Children | 66 (93.0%) | 5 (7.0%) |
| 3 or 4 Children | 11 (100.0%) | 0 (0.0%) |
| 5 or more Children | 0 (0.0%) | 0 (0.0%) |
| Total | 203 (92.3%) | 17 (7.7%) |
Income Below Poverty Among Single-Parent Households in Murphy
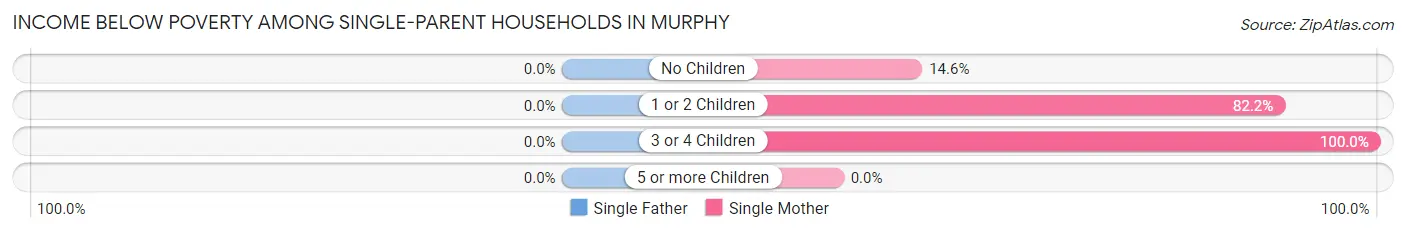
| Children | Single Father | Single Mother |
| No Children | 0 (0.0%) | 6 (14.6%) |
| 1 or 2 Children | 0 (0.0%) | 37 (82.2%) |
| 3 or 4 Children | 0 (0.0%) | 11 (100.0%) |
| 5 or more Children | 0 (0.0%) | 0 (0.0%) |
| Total | 0 (0.0%) | 54 (55.7%) |
Income Below Poverty Among Married-Couple vs Single-Parent Households in Murphy
The poverty data for Murphy shows that 17 of the married-couple family households (7.7%) and 54 of the single-parent households (49.5%) are living below the poverty level. Within the married-couple family households, those with no children have the highest poverty rate, with 12 households (8.7%) falling below the poverty line. Among the single-parent households, those with 3 or 4 children have the highest poverty rate, with 11 household (100.0%) living below poverty.
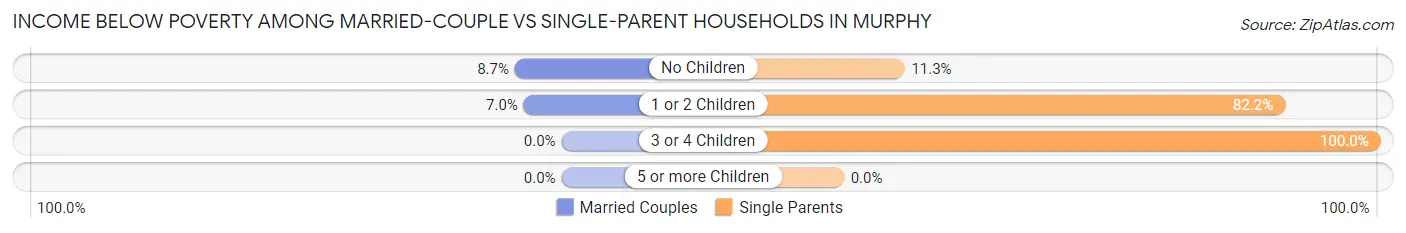
| Children | Married-Couple Families | Single-Parent Households |
| No Children | 12 (8.7%) | 6 (11.3%) |
| 1 or 2 Children | 5 (7.0%) | 37 (82.2%) |
| 3 or 4 Children | 0 (0.0%) | 11 (100.0%) |
| 5 or more Children | 0 (0.0%) | 0 (0.0%) |
| Total | 17 (7.7%) | 54 (49.5%) |
Race in Murphy
The most populous races in Murphy are White / Caucasian (1,265 | 81.7%), Two or more Races (149 | 9.6%), and Hispanic or Latino (105 | 6.8%).
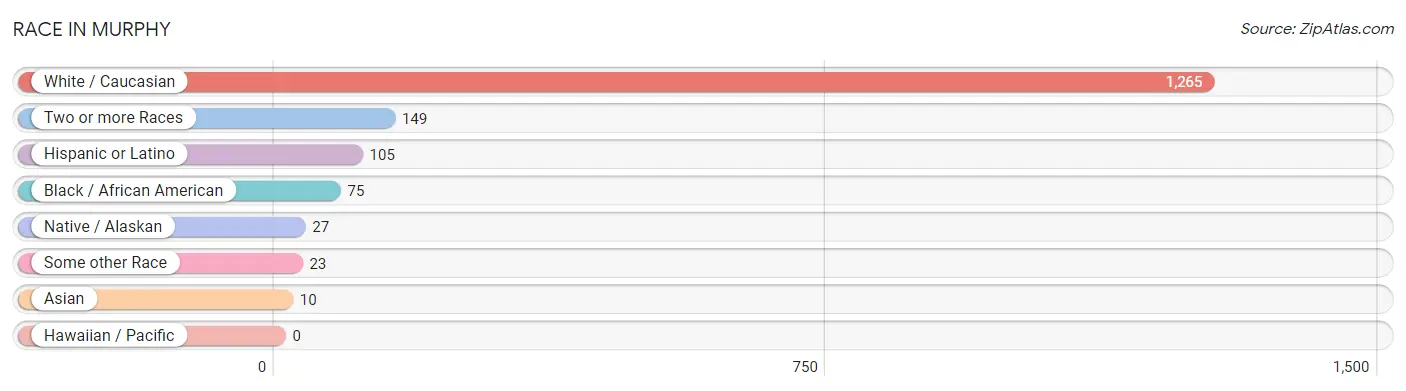
| Race | # Population | % Population |
| Asian | 10 | 0.6% |
| Black / African American | 75 | 4.8% |
| Hawaiian / Pacific | 0 | 0.0% |
| Hispanic or Latino | 105 | 6.8% |
| Native / Alaskan | 27 | 1.7% |
| White / Caucasian | 1,265 | 81.7% |
| Two or more Races | 149 | 9.6% |
| Some other Race | 23 | 1.5% |
| Total | 1,549 | 100.0% |
Ancestry in Murphy
The most populous ancestries reported in Murphy are American (240 | 15.5%), German (209 | 13.5%), English (139 | 9.0%), Irish (116 | 7.5%), and Mexican (85 | 5.5%), together accounting for 50.9% of all Murphy residents.
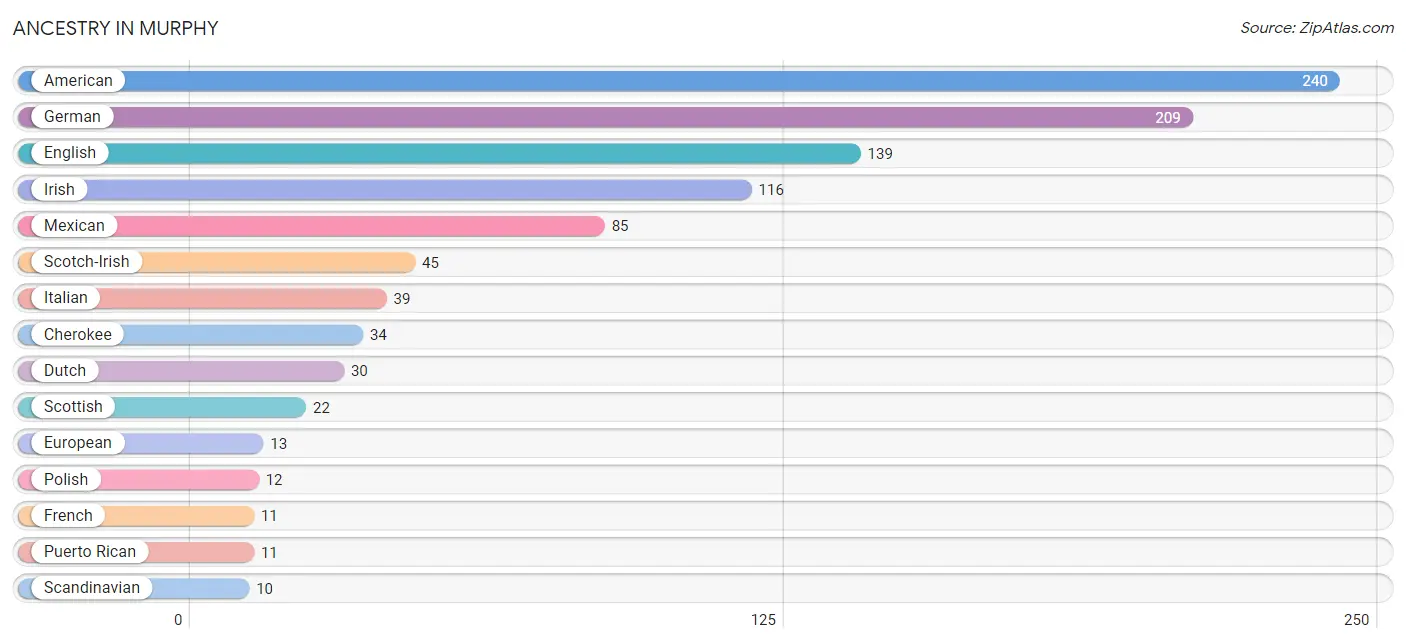
| Ancestry | # Population | % Population |
| American | 240 | 15.5% |
| Bangladeshi | 4 | 0.3% |
| Bhutanese | 3 | 0.2% |
| Cherokee | 34 | 2.2% |
| Danish | 2 | 0.1% |
| Dutch | 30 | 1.9% |
| English | 139 | 9.0% |
| European | 13 | 0.8% |
| French | 11 | 0.7% |
| German | 209 | 13.5% |
| Indian (Asian) | 6 | 0.4% |
| Inupiat | 3 | 0.2% |
| Irish | 116 | 7.5% |
| Italian | 39 | 2.5% |
| Lumbee | 3 | 0.2% |
| Mexican | 85 | 5.5% |
| Norwegian | 6 | 0.4% |
| Polish | 12 | 0.8% |
| Puerto Rican | 11 | 0.7% |
| Scandinavian | 10 | 0.6% |
| Scotch-Irish | 45 | 2.9% |
| Scottish | 22 | 1.4% |
| Welsh | 3 | 0.2% |
| Yakama | 2 | 0.1% | View All 24 Rows |
Immigrants in Murphy
The most numerous immigrant groups reported in Murphy came from Europe (7 | 0.4%), Italy (7 | 0.4%), Southern Europe (7 | 0.4%), Asia (6 | 0.4%), and South Eastern Asia (6 | 0.4%), together accounting for 2.1% of all Murphy residents.
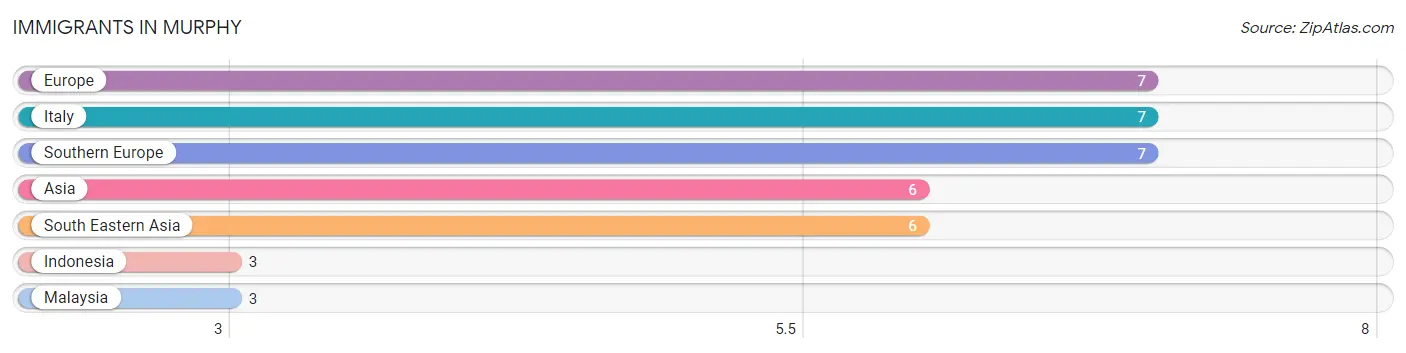
| Immigration Origin | # Population | % Population |
| Asia | 6 | 0.4% |
| Europe | 7 | 0.4% |
| Indonesia | 3 | 0.2% |
| Italy | 7 | 0.4% |
| Malaysia | 3 | 0.2% |
| South Eastern Asia | 6 | 0.4% |
| Southern Europe | 7 | 0.4% | View All 7 Rows |
Sex and Age in Murphy
Sex and Age in Murphy
The most populous age groups in Murphy are 25 to 29 Years (189 | 24.5%) for men and 65 to 69 Years (106 | 13.6%) for women.
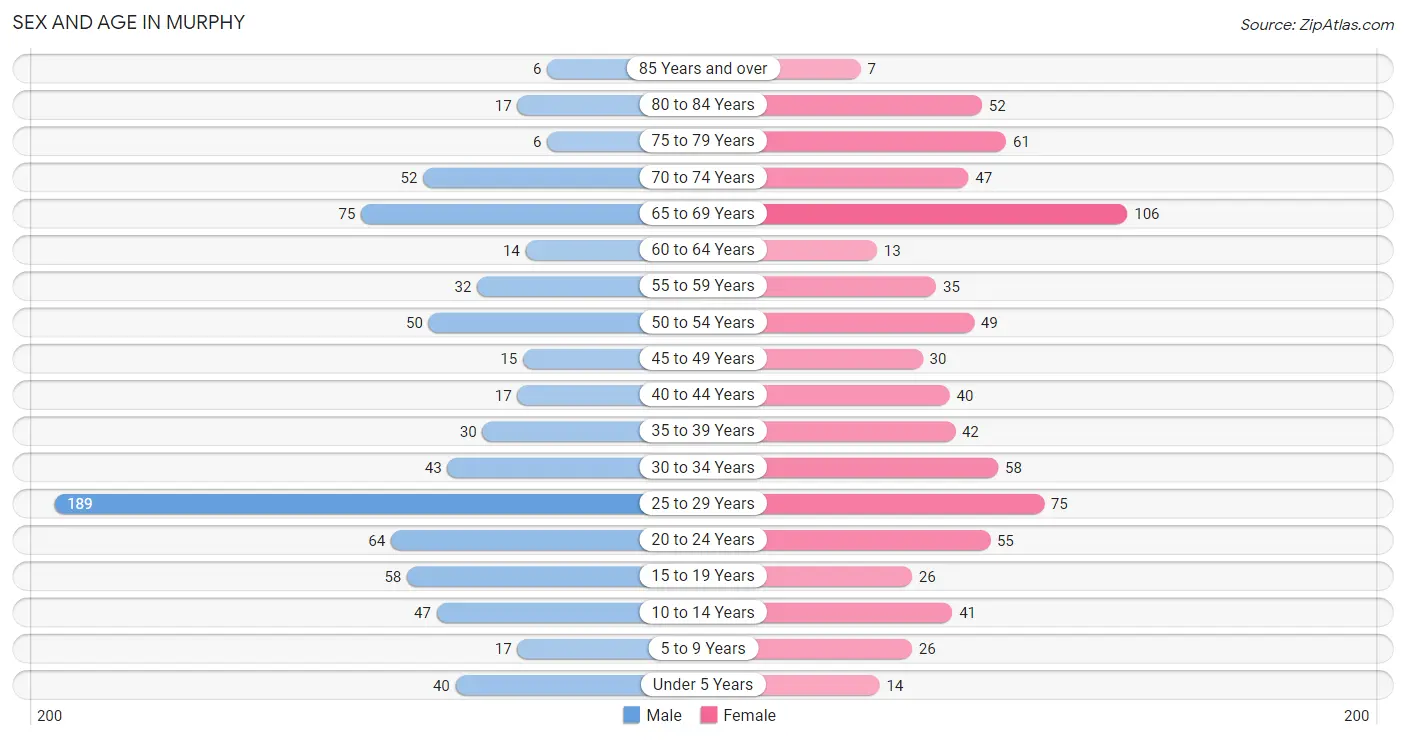
| Age Bracket | Male | Female |
| Under 5 Years | 40 (5.2%) | 14 (1.8%) |
| 5 to 9 Years | 17 (2.2%) | 26 (3.4%) |
| 10 to 14 Years | 47 (6.1%) | 41 (5.3%) |
| 15 to 19 Years | 58 (7.5%) | 26 (3.4%) |
| 20 to 24 Years | 64 (8.3%) | 55 (7.1%) |
| 25 to 29 Years | 189 (24.5%) | 75 (9.7%) |
| 30 to 34 Years | 43 (5.6%) | 58 (7.5%) |
| 35 to 39 Years | 30 (3.9%) | 42 (5.4%) |
| 40 to 44 Years | 17 (2.2%) | 40 (5.1%) |
| 45 to 49 Years | 15 (1.9%) | 30 (3.9%) |
| 50 to 54 Years | 50 (6.5%) | 49 (6.3%) |
| 55 to 59 Years | 32 (4.2%) | 35 (4.5%) |
| 60 to 64 Years | 14 (1.8%) | 13 (1.7%) |
| 65 to 69 Years | 75 (9.7%) | 106 (13.6%) |
| 70 to 74 Years | 52 (6.7%) | 47 (6.0%) |
| 75 to 79 Years | 6 (0.8%) | 61 (7.9%) |
| 80 to 84 Years | 17 (2.2%) | 52 (6.7%) |
| 85 Years and over | 6 (0.8%) | 7 (0.9%) |
| Total | 772 (100.0%) | 777 (100.0%) |
Families and Households in Murphy
Median Family Size in Murphy
The median family size in Murphy is 2.81 persons per family, with married-couple families (220 | 66.9%) accounting for the largest median family size of 2.97 persons per family. On the other hand, single male/father families (12 | 3.6%) represent the smallest median family size with 1.83 persons per family.
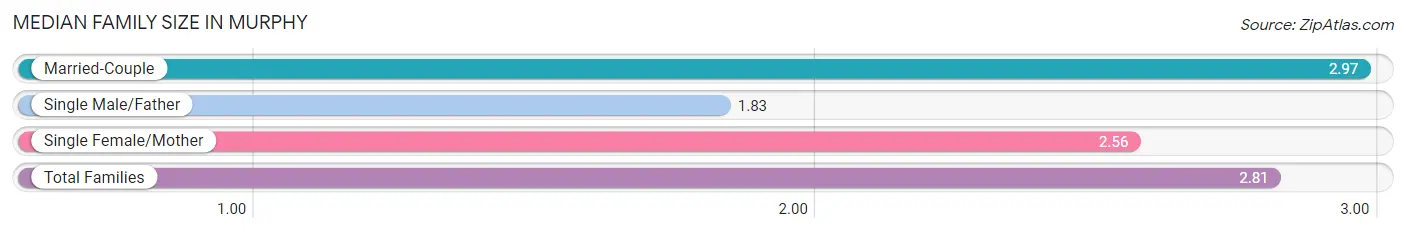
| Family Type | # Families | Family Size |
| Married-Couple | 220 (66.9%) | 2.97 |
| Single Male/Father | 12 (3.6%) | 1.83 |
| Single Female/Mother | 97 (29.5%) | 2.56 |
| Total Families | 329 (100.0%) | 2.81 |
Median Household Size in Murphy
The median household size in Murphy is 1.89 persons per household, with married-couple households (220 | 29.2%) accounting for the largest median household size of 3.07 persons per household. non-family households (425 | 56.4%) represent the smallest median household size with 1.11 persons per household.
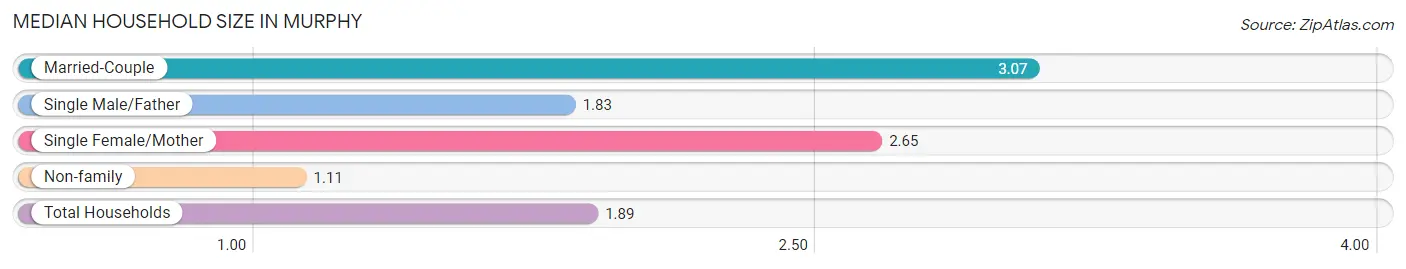
| Household Type | # Households | Household Size |
| Married-Couple | 220 (29.2%) | 3.07 |
| Single Male/Father | 12 (1.6%) | 1.83 |
| Single Female/Mother | 97 (12.9%) | 2.65 |
| Non-family | 425 (56.4%) | 1.11 |
| Total Households | 754 (100.0%) | 1.89 |
Household Size by Marriage Status in Murphy
Out of a total of 754 households in Murphy, 329 (43.6%) are family households, while 425 (56.4%) are nonfamily households. The most numerous type of family households are 2-person households, comprising 186, and the most common type of nonfamily households are 1-person households, comprising 389.
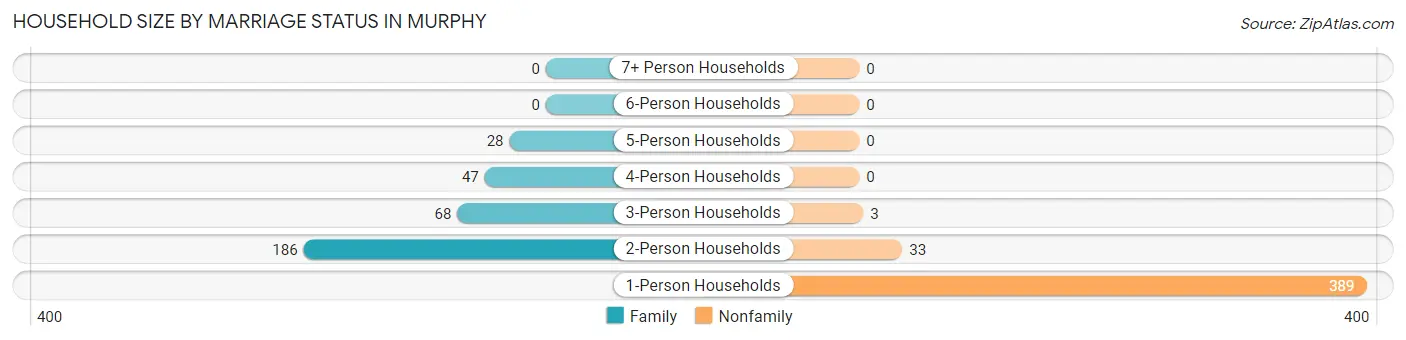
| Household Size | Family Households | Nonfamily Households |
| 1-Person Households | - | 389 (51.6%) |
| 2-Person Households | 186 (24.7%) | 33 (4.4%) |
| 3-Person Households | 68 (9.0%) | 3 (0.4%) |
| 4-Person Households | 47 (6.2%) | 0 (0.0%) |
| 5-Person Households | 28 (3.7%) | 0 (0.0%) |
| 6-Person Households | 0 (0.0%) | 0 (0.0%) |
| 7+ Person Households | 0 (0.0%) | 0 (0.0%) |
| Total | 329 (43.6%) | 425 (56.4%) |
Female Fertility in Murphy
Fertility by Age in Murphy
| Age Bracket | Women with Births | Births / 1,000 Women |
| 15 to 19 years | 0 (0.0%) | 0.0 |
| 20 to 34 years | 0 (0.0%) | 0.0 |
| 35 to 50 years | 0 (0.0%) | 0.0 |
| Total | 0 (0.0%) | 0.0 |
Fertility by Age by Marriage Status in Murphy
| Age Bracket | Married | Unmarried |
| 15 to 19 years | 0 (0.0%) | 0 (0.0%) |
| 20 to 34 years | 0 (0.0%) | 0 (0.0%) |
| 35 to 50 years | 0 (0.0%) | 0 (0.0%) |
| Total | 0 (0.0%) | 0 (0.0%) |
Fertility by Education in Murphy
| Educational Attainment | Women with Births | Births / 1,000 Women |
| Less than High School | 0 (0.0%) | 0.0 |
| High School Diploma | 0 (0.0%) | 0.0 |
| College or Associate's Degree | 0 (0.0%) | 0.0 |
| Bachelor's Degree | 0 (0.0%) | 0.0 |
| Graduate Degree | 0 (0.0%) | 0.0 |
| Total | 0 (0.0%) | 0.0 |
Fertility by Education by Marriage Status in Murphy
| Educational Attainment | Married | Unmarried |
| Less than High School | 0 (0.0%) | 0 (0.0%) |
| High School Diploma | 0 (0.0%) | 0 (0.0%) |
| College or Associate's Degree | 0 (0.0%) | 0 (0.0%) |
| Bachelor's Degree | 0 (0.0%) | 0 (0.0%) |
| Graduate Degree | 0 (0.0%) | 0 (0.0%) |
| Total | 0 (0.0%) | 0 (0.0%) |
Employment Characteristics in Murphy
Employment by Class of Employer in Murphy
Among the 558 employed individuals in Murphy, private company employees (427 | 76.5%), self-employed (not incorporated) (37 | 6.6%), and self-employed (incorporated) (28 | 5.0%) make up the most common classes of employment.
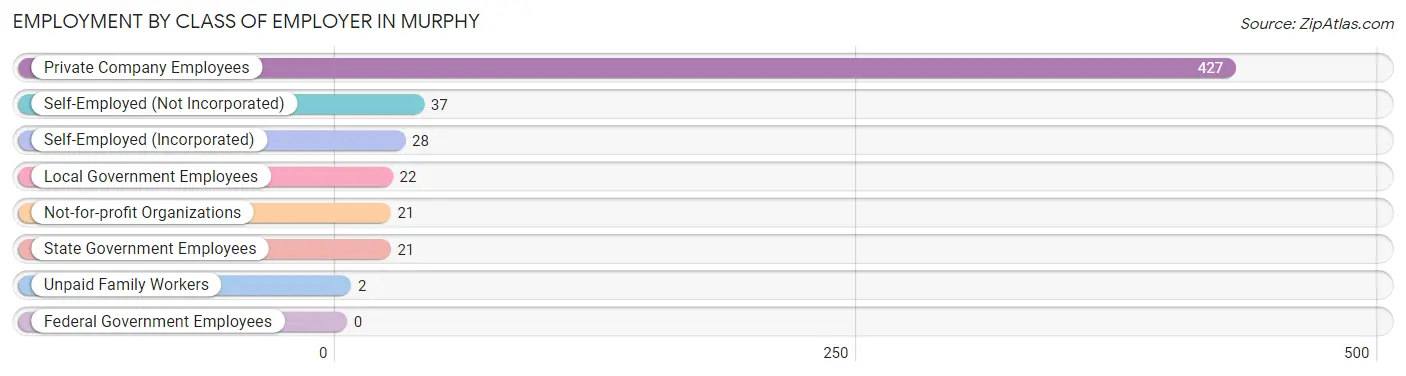
| Employer Class | # Employees | % Employees |
| Private Company Employees | 427 | 76.5% |
| Self-Employed (Incorporated) | 28 | 5.0% |
| Self-Employed (Not Incorporated) | 37 | 6.6% |
| Not-for-profit Organizations | 21 | 3.8% |
| Local Government Employees | 22 | 3.9% |
| State Government Employees | 21 | 3.8% |
| Federal Government Employees | 0 | 0.0% |
| Unpaid Family Workers | 2 | 0.4% |
| Total | 558 | 100.0% |
Employment Status by Age in Murphy
According to the labor force statistics for Murphy, out of the total population over 16 years of age (1,362), 44.6% or 607 individuals are in the labor force, with 7.7% or 47 of them unemployed. The age group with the highest labor force participation rate is 25 to 29 years, with 78.0% or 206 individuals in the labor force. Within the labor force, the 65 to 74 years age range has the highest percentage of unemployed individuals, with 22.6% or 7 of them being unemployed.
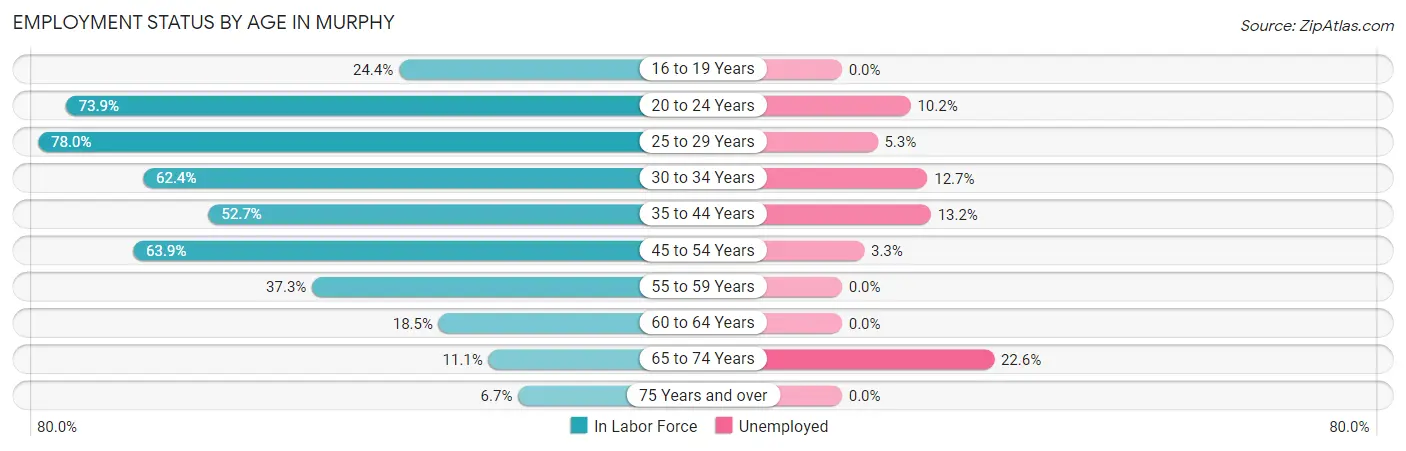
| Age Bracket | In Labor Force | Unemployed |
| 16 to 19 Years | 20 (24.4%) | 0 (0.0%) |
| 20 to 24 Years | 88 (73.9%) | 9 (10.2%) |
| 25 to 29 Years | 206 (78.0%) | 11 (5.3%) |
| 30 to 34 Years | 63 (62.4%) | 8 (12.7%) |
| 35 to 44 Years | 68 (52.7%) | 9 (13.2%) |
| 45 to 54 Years | 92 (63.9%) | 3 (3.3%) |
| 55 to 59 Years | 25 (37.3%) | 0 (0.0%) |
| 60 to 64 Years | 5 (18.5%) | 0 (0.0%) |
| 65 to 74 Years | 31 (11.1%) | 7 (22.6%) |
| 75 Years and over | 10 (6.7%) | 0 (0.0%) |
| Total | 607 (44.6%) | 47 (7.7%) |
Employment Status by Educational Attainment in Murphy
According to labor force statistics for Murphy, 62.7% of individuals (459) out of the total population between 25 and 64 years of age (732) are in the labor force, with 6.8% or 31 of them being unemployed. The group with the highest labor force participation rate are those with the educational attainment of bachelor's degree or higher, with 86.6% or 103 individuals in the labor force. Within the labor force, individuals with less than high school education have the highest percentage of unemployment, with 84.2% or 16 of them being unemployed.
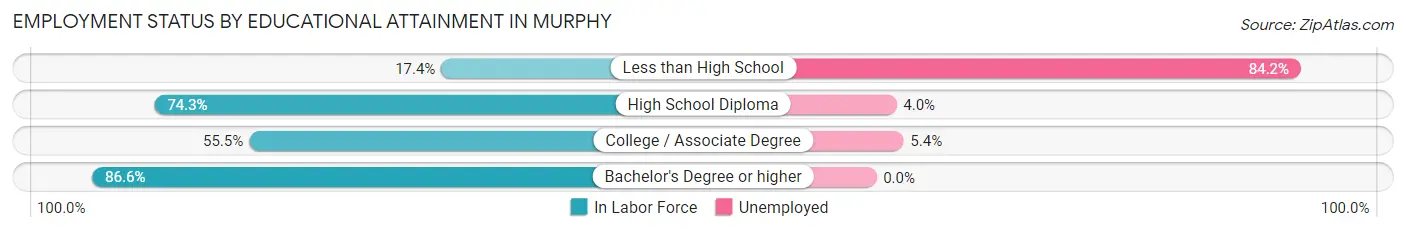
| Educational Attainment | In Labor Force | Unemployed |
| Less than High School | 19 (17.4%) | 92 (84.2%) |
| High School Diploma | 226 (74.3%) | 12 (4.0%) |
| College / Associate Degree | 111 (55.5%) | 11 (5.4%) |
| Bachelor's Degree or higher | 103 (86.6%) | 0 (0.0%) |
| Total | 459 (62.7%) | 50 (6.8%) |
Employment Occupations by Sex in Murphy
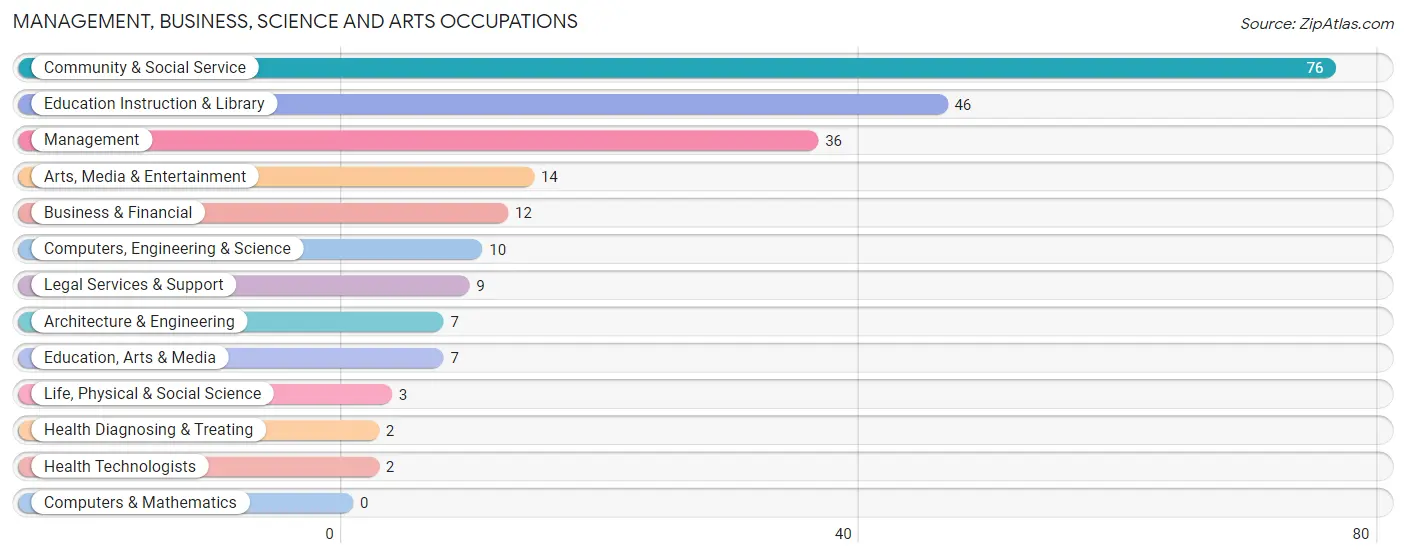
Management, Business, Science and Arts Occupations
The most common Management, Business, Science and Arts occupations in Murphy are Community & Social Service (76 | 13.6%), Education Instruction & Library (46 | 8.2%), Management (36 | 6.4%), Arts, Media & Entertainment (14 | 2.5%), and Business & Financial (12 | 2.1%).
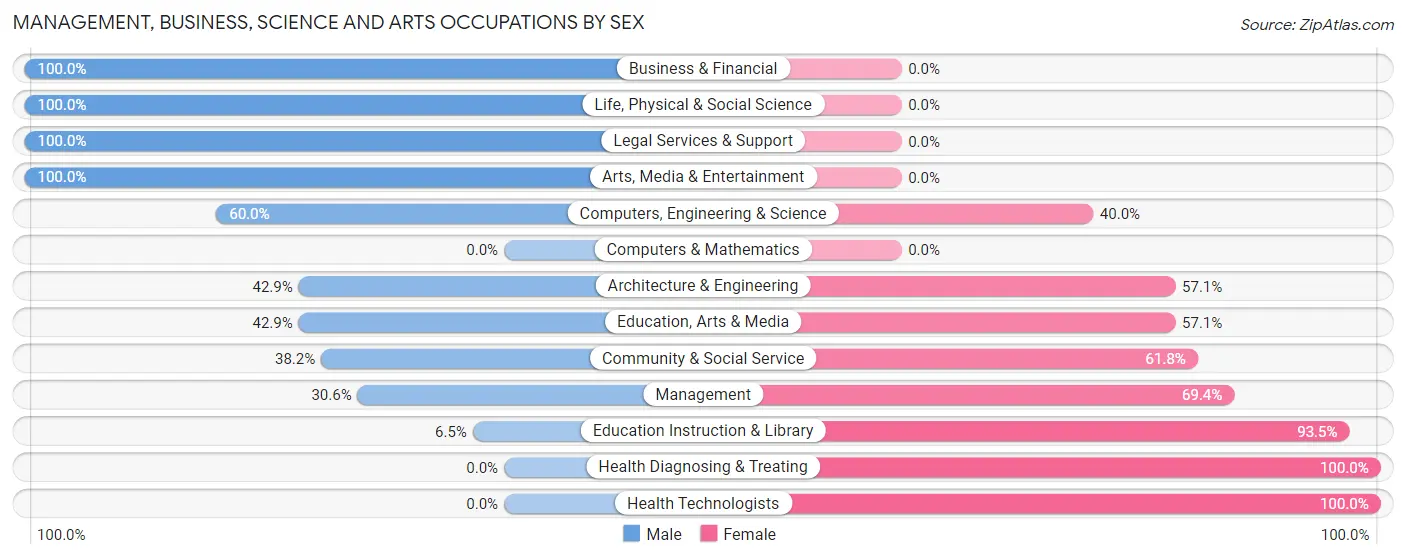
Management, Business, Science and Arts Occupations by Sex
Within the Management, Business, Science and Arts occupations in Murphy, the most male-oriented occupations are Business & Financial (100.0%), Life, Physical & Social Science (100.0%), and Legal Services & Support (100.0%), while the most female-oriented occupations are Health Diagnosing & Treating (100.0%), Health Technologists (100.0%), and Education Instruction & Library (93.5%).
| Occupation | Male | Female |
| Management | 11 (30.6%) | 25 (69.4%) |
| Business & Financial | 12 (100.0%) | 0 (0.0%) |
| Computers, Engineering & Science | 6 (60.0%) | 4 (40.0%) |
| Computers & Mathematics | 0 (0.0%) | 0 (0.0%) |
| Architecture & Engineering | 3 (42.9%) | 4 (57.1%) |
| Life, Physical & Social Science | 3 (100.0%) | 0 (0.0%) |
| Community & Social Service | 29 (38.2%) | 47 (61.8%) |
| Education, Arts & Media | 3 (42.9%) | 4 (57.1%) |
| Legal Services & Support | 9 (100.0%) | 0 (0.0%) |
| Education Instruction & Library | 3 (6.5%) | 43 (93.5%) |
| Arts, Media & Entertainment | 14 (100.0%) | 0 (0.0%) |
| Health Diagnosing & Treating | 0 (0.0%) | 2 (100.0%) |
| Health Technologists | 0 (0.0%) | 2 (100.0%) |
| Total (Category) | 58 (42.6%) | 78 (57.4%) |
| Total (Overall) | 352 (62.7%) | 209 (37.2%) |
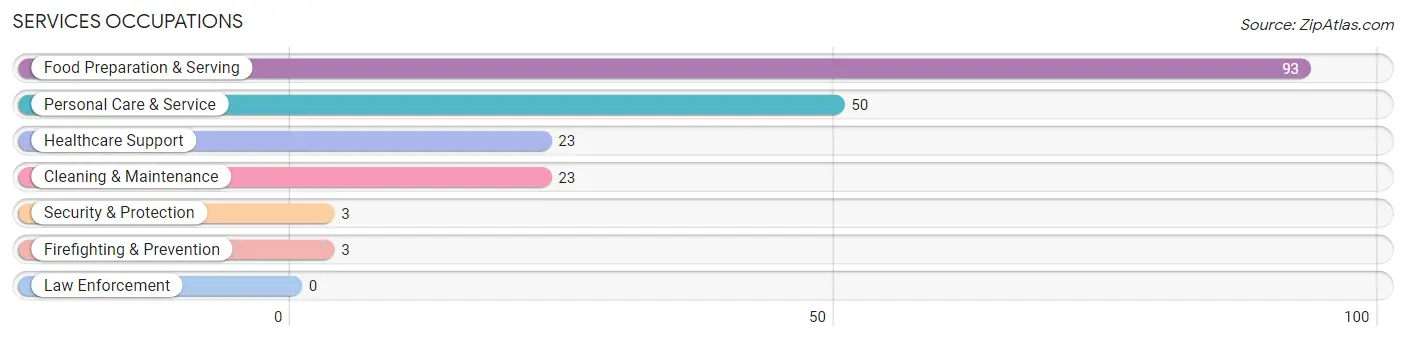
Services Occupations
The most common Services occupations in Murphy are Food Preparation & Serving (93 | 16.6%), Personal Care & Service (50 | 8.9%), Healthcare Support (23 | 4.1%), Cleaning & Maintenance (23 | 4.1%), and Security & Protection (3 | 0.5%).
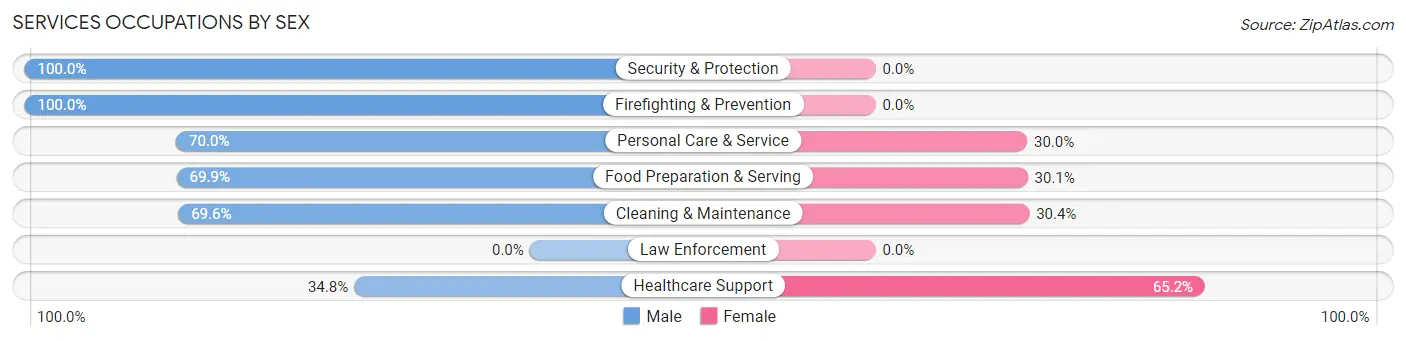
Services Occupations by Sex
Within the Services occupations in Murphy, the most male-oriented occupations are Security & Protection (100.0%), Firefighting & Prevention (100.0%), and Personal Care & Service (70.0%), while the most female-oriented occupations are Healthcare Support (65.2%), Cleaning & Maintenance (30.4%), and Food Preparation & Serving (30.1%).
| Occupation | Male | Female |
| Healthcare Support | 8 (34.8%) | 15 (65.2%) |
| Security & Protection | 3 (100.0%) | 0 (0.0%) |
| Firefighting & Prevention | 3 (100.0%) | 0 (0.0%) |
| Law Enforcement | 0 (0.0%) | 0 (0.0%) |
| Food Preparation & Serving | 65 (69.9%) | 28 (30.1%) |
| Cleaning & Maintenance | 16 (69.6%) | 7 (30.4%) |
| Personal Care & Service | 35 (70.0%) | 15 (30.0%) |
| Total (Category) | 127 (66.1%) | 65 (33.9%) |
| Total (Overall) | 352 (62.7%) | 209 (37.2%) |
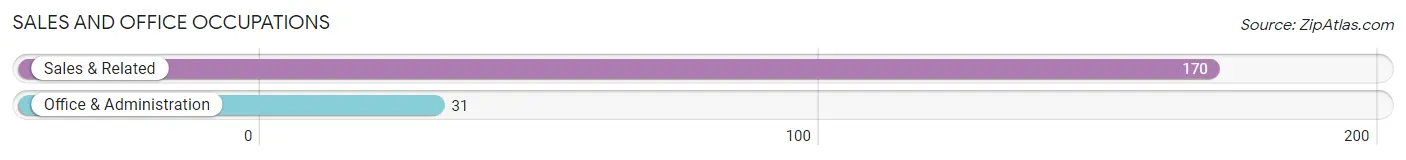
Sales and Office Occupations
The most common Sales and Office occupations in Murphy are Sales & Related (170 | 30.3%), and Office & Administration (31 | 5.5%).
Sales and Office Occupations by Sex
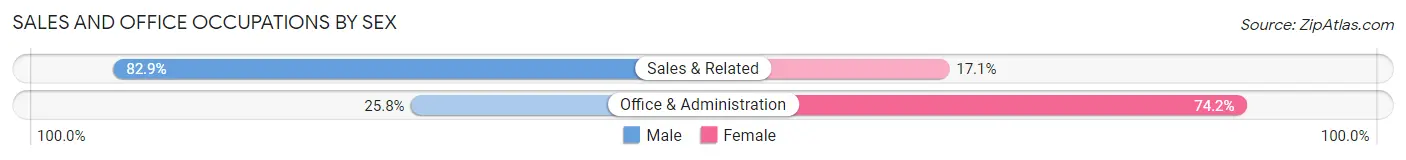
| Occupation | Male | Female |
| Sales & Related | 141 (82.9%) | 29 (17.1%) |
| Office & Administration | 8 (25.8%) | 23 (74.2%) |
| Total (Category) | 149 (74.1%) | 52 (25.9%) |
| Total (Overall) | 352 (62.7%) | 209 (37.2%) |
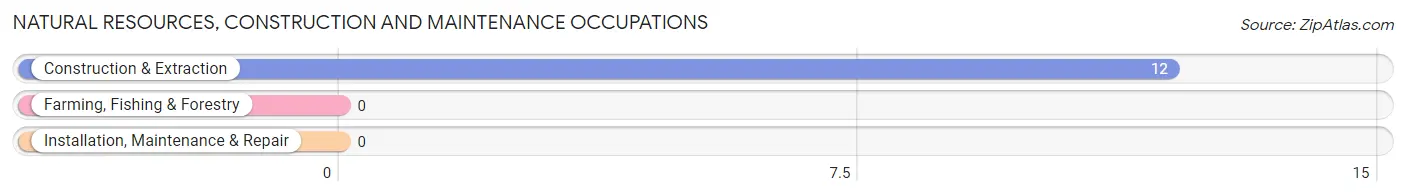
Natural Resources, Construction and Maintenance Occupations
The most common Natural Resources, Construction and Maintenance occupations in Murphy are , and Construction & Extraction (12 | 2.1%).
Natural Resources, Construction and Maintenance Occupations by Sex
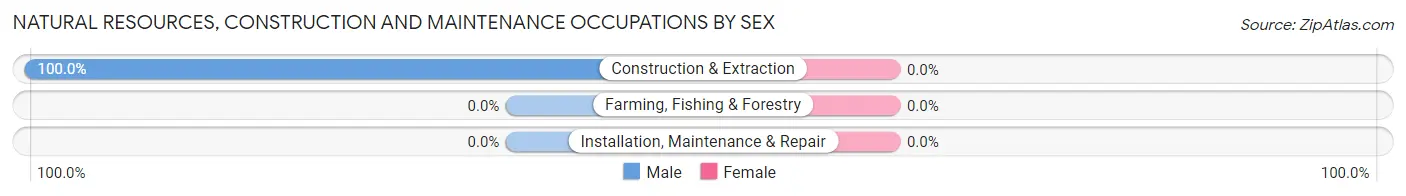
| Occupation | Male | Female |
| Farming, Fishing & Forestry | 0 (0.0%) | 0 (0.0%) |
| Construction & Extraction | 12 (100.0%) | 0 (0.0%) |
| Installation, Maintenance & Repair | 0 (0.0%) | 0 (0.0%) |
| Total (Category) | 12 (100.0%) | 0 (0.0%) |
| Total (Overall) | 352 (62.7%) | 209 (37.2%) |
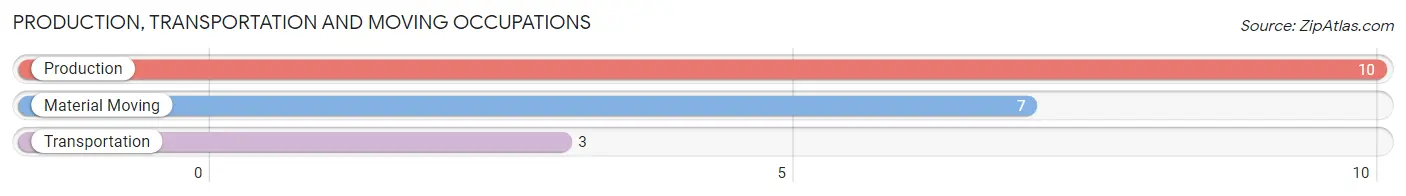
Production, Transportation and Moving Occupations
The most common Production, Transportation and Moving occupations in Murphy are Production (10 | 1.8%), Material Moving (7 | 1.3%), and Transportation (3 | 0.5%).
Production, Transportation and Moving Occupations by Sex
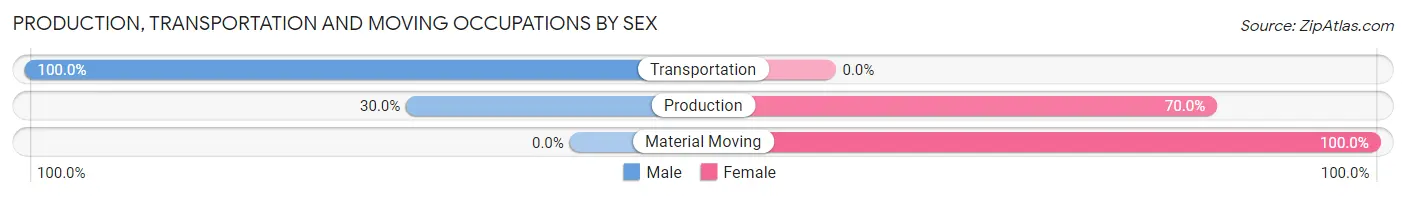
| Occupation | Male | Female |
| Production | 3 (30.0%) | 7 (70.0%) |
| Transportation | 3 (100.0%) | 0 (0.0%) |
| Material Moving | 0 (0.0%) | 7 (100.0%) |
| Total (Category) | 6 (30.0%) | 14 (70.0%) |
| Total (Overall) | 352 (62.7%) | 209 (37.2%) |
Employment Industries by Sex in Murphy
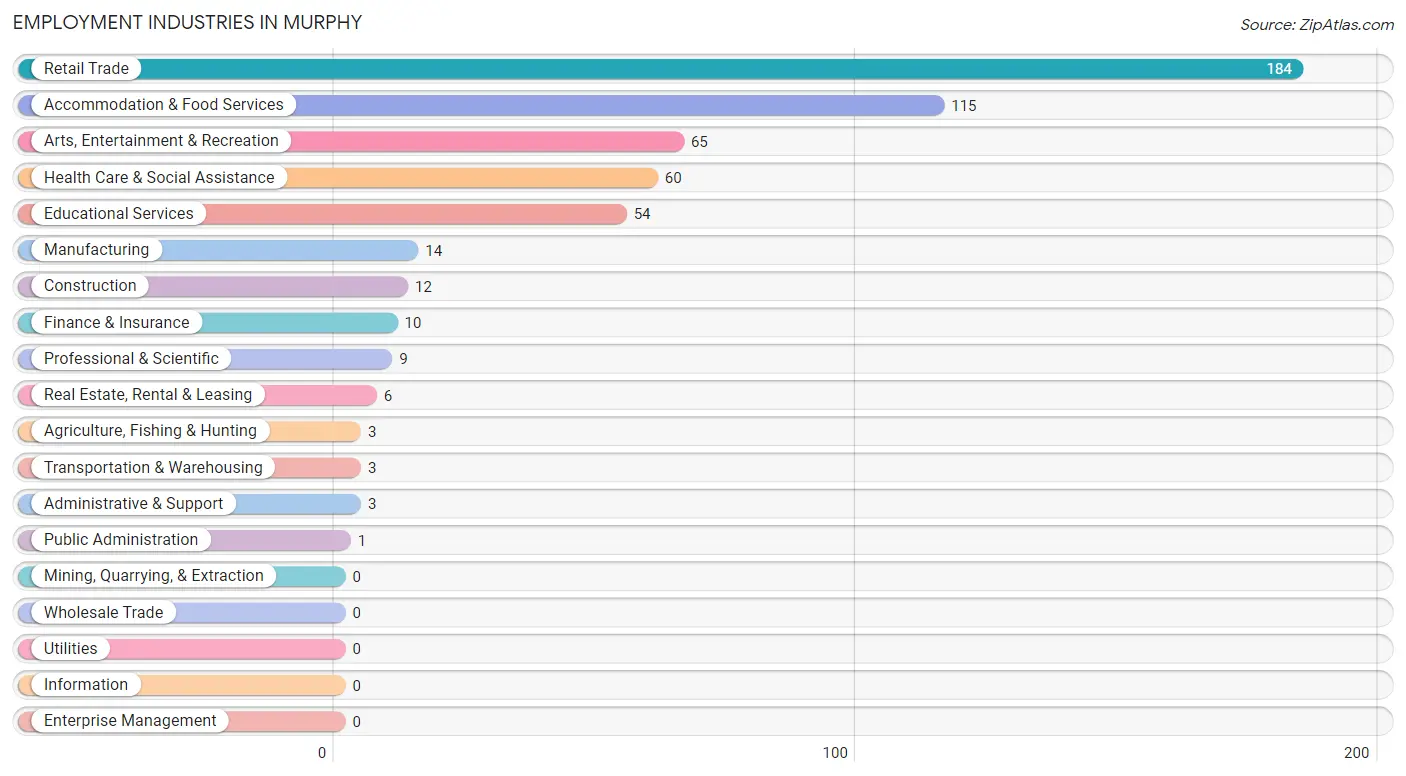
Employment Industries in Murphy
The major employment industries in Murphy include Retail Trade (184 | 32.8%), Accommodation & Food Services (115 | 20.5%), Arts, Entertainment & Recreation (65 | 11.6%), Health Care & Social Assistance (60 | 10.7%), and Educational Services (54 | 9.6%).
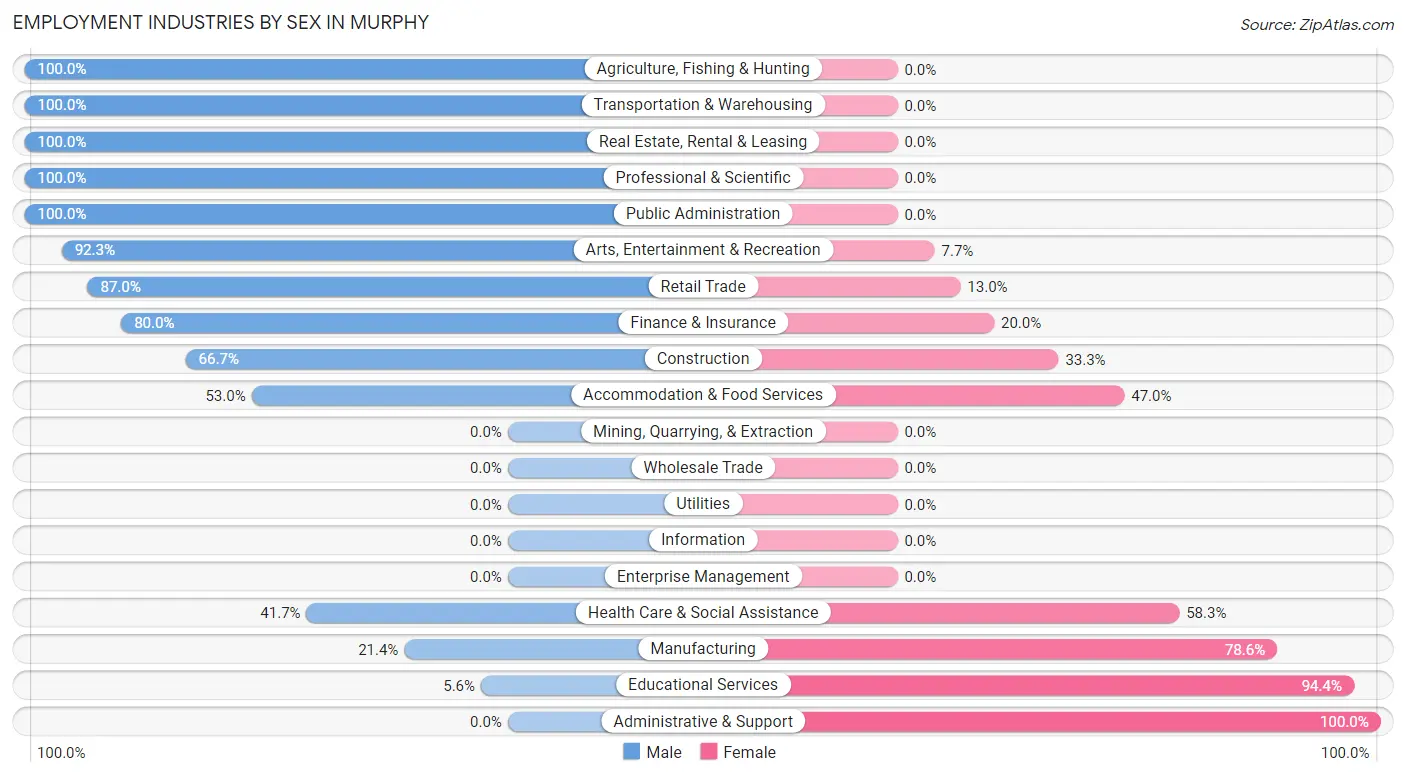
Employment Industries by Sex in Murphy
The Murphy industries that see more men than women are Agriculture, Fishing & Hunting (100.0%), Transportation & Warehousing (100.0%), and Real Estate, Rental & Leasing (100.0%), whereas the industries that tend to have a higher number of women are Administrative & Support (100.0%), Educational Services (94.4%), and Manufacturing (78.6%).
| Industry | Male | Female |
| Agriculture, Fishing & Hunting | 3 (100.0%) | 0 (0.0%) |
| Mining, Quarrying, & Extraction | 0 (0.0%) | 0 (0.0%) |
| Construction | 8 (66.7%) | 4 (33.3%) |
| Manufacturing | 3 (21.4%) | 11 (78.6%) |
| Wholesale Trade | 0 (0.0%) | 0 (0.0%) |
| Retail Trade | 160 (87.0%) | 24 (13.0%) |
| Transportation & Warehousing | 3 (100.0%) | 0 (0.0%) |
| Utilities | 0 (0.0%) | 0 (0.0%) |
| Information | 0 (0.0%) | 0 (0.0%) |
| Finance & Insurance | 8 (80.0%) | 2 (20.0%) |
| Real Estate, Rental & Leasing | 6 (100.0%) | 0 (0.0%) |
| Professional & Scientific | 9 (100.0%) | 0 (0.0%) |
| Enterprise Management | 0 (0.0%) | 0 (0.0%) |
| Administrative & Support | 0 (0.0%) | 3 (100.0%) |
| Educational Services | 3 (5.6%) | 51 (94.4%) |
| Health Care & Social Assistance | 25 (41.7%) | 35 (58.3%) |
| Arts, Entertainment & Recreation | 60 (92.3%) | 5 (7.7%) |
| Accommodation & Food Services | 61 (53.0%) | 54 (47.0%) |
| Public Administration | 1 (100.0%) | 0 (0.0%) |
| Total | 352 (62.7%) | 209 (37.2%) |
Education in Murphy
School Enrollment in Murphy
The most common levels of schooling among the 240 students in Murphy are middle school (76 | 31.7%), college / undergraduate (72 | 30.0%), and elementary school (45 | 18.8%).
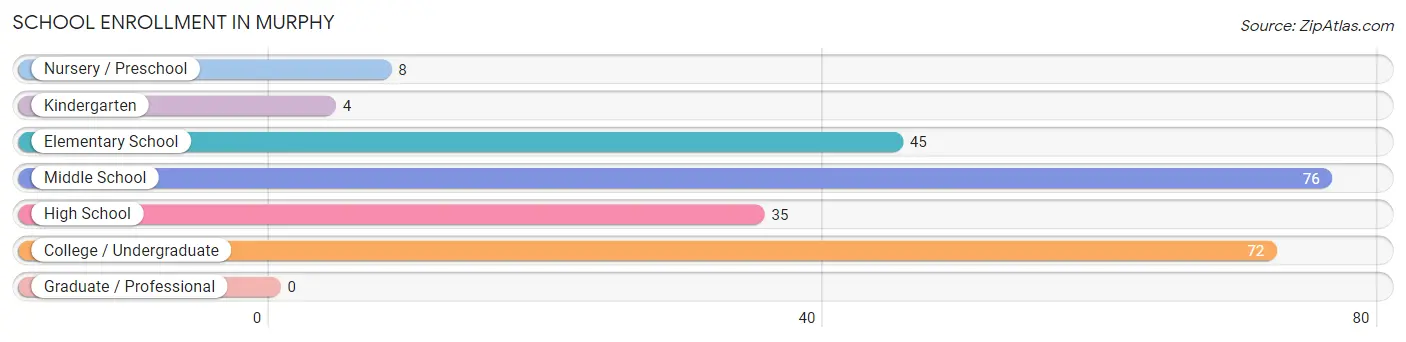
| School Level | # Students | % Students |
| Nursery / Preschool | 8 | 3.3% |
| Kindergarten | 4 | 1.7% |
| Elementary School | 45 | 18.8% |
| Middle School | 76 | 31.7% |
| High School | 35 | 14.6% |
| College / Undergraduate | 72 | 30.0% |
| Graduate / Professional | 0 | 0.0% |
| Total | 240 | 100.0% |
School Enrollment by Age by Funding Source in Murphy
Out of a total of 240 students who are enrolled in schools in Murphy, 79 (32.9%) attend a private institution, while the remaining 161 (67.1%) are enrolled in public schools. The age group of 3 to 4 year olds has the highest likelihood of being enrolled in private schools, with 2 (100.0% in the age bracket) enrolled. Conversely, the age group of 20 to 24 year olds has the lowest likelihood of being enrolled in a private school, with 15 (100.0% in the age bracket) attending a public institution.
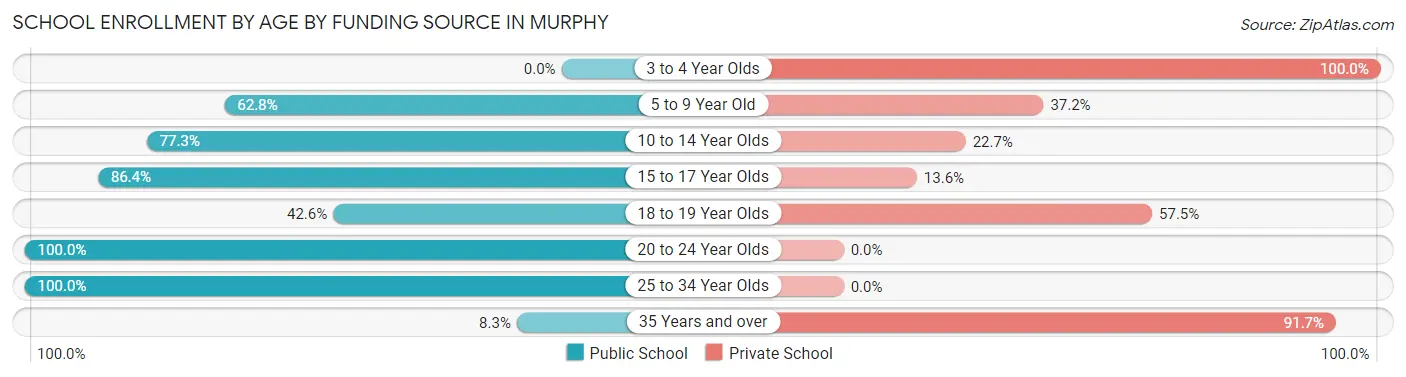
| Age Bracket | Public School | Private School |
| 3 to 4 Year Olds | 0 (0.0%) | 2 (100.0%) |
| 5 to 9 Year Old | 27 (62.8%) | 16 (37.2%) |
| 10 to 14 Year Olds | 68 (77.3%) | 20 (22.7%) |
| 15 to 17 Year Olds | 19 (86.4%) | 3 (13.6%) |
| 18 to 19 Year Olds | 20 (42.5%) | 27 (57.5%) |
| 20 to 24 Year Olds | 15 (100.0%) | 0 (0.0%) |
| 25 to 34 Year Olds | 11 (100.0%) | 0 (0.0%) |
| 35 Years and over | 1 (8.3%) | 11 (91.7%) |
| Total | 161 (67.1%) | 79 (32.9%) |
Educational Attainment by Field of Study in Murphy
Education (78 | 25.2%), business (60 | 19.4%), visual & performing arts (48 | 15.5%), science & technology (29 | 9.4%), and liberal arts & history (23 | 7.4%) are the most common fields of study among 309 individuals in Murphy who have obtained a bachelor's degree or higher.
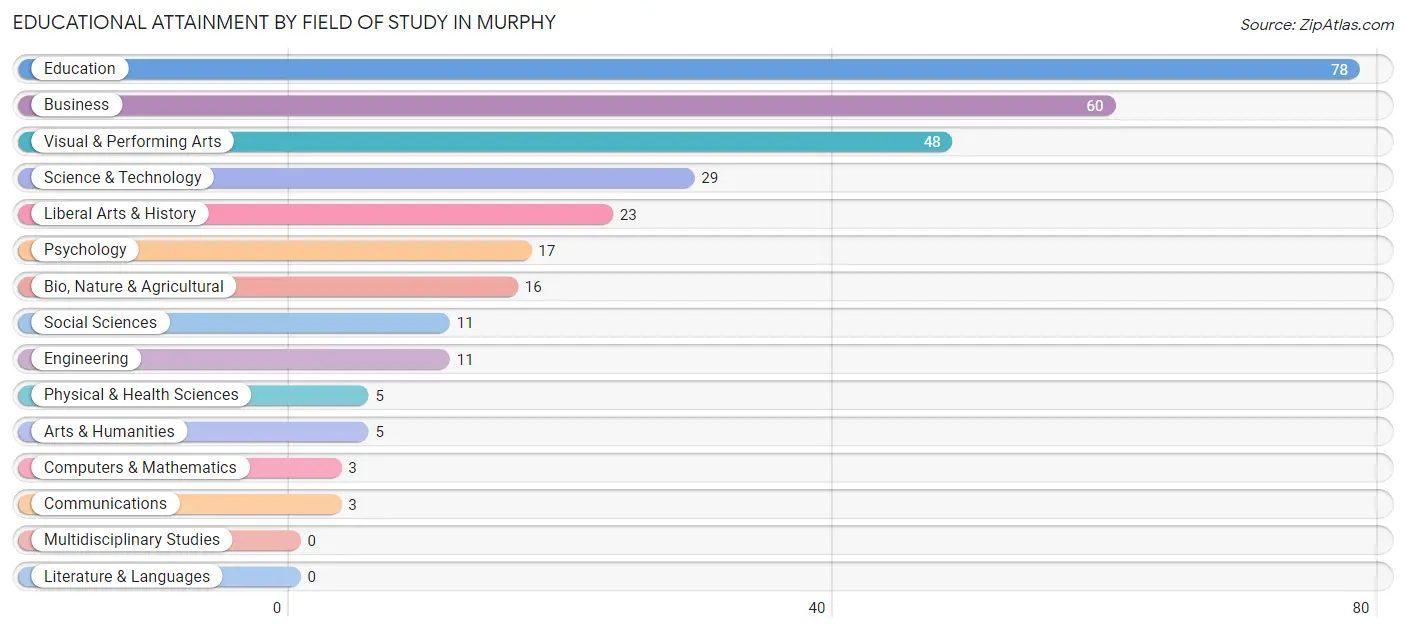
| Field of Study | # Graduates | % Graduates |
| Computers & Mathematics | 3 | 1.0% |
| Bio, Nature & Agricultural | 16 | 5.2% |
| Physical & Health Sciences | 5 | 1.6% |
| Psychology | 17 | 5.5% |
| Social Sciences | 11 | 3.6% |
| Engineering | 11 | 3.6% |
| Multidisciplinary Studies | 0 | 0.0% |
| Science & Technology | 29 | 9.4% |
| Business | 60 | 19.4% |
| Education | 78 | 25.2% |
| Literature & Languages | 0 | 0.0% |
| Liberal Arts & History | 23 | 7.4% |
| Visual & Performing Arts | 48 | 15.5% |
| Communications | 3 | 1.0% |
| Arts & Humanities | 5 | 1.6% |
| Total | 309 | 100.0% |
Transportation & Commute in Murphy
Vehicle Availability by Sex in Murphy
The most prevalent vehicle ownership categories in Murphy are males with 1 vehicle (166, accounting for 47.6%) and females with 1 vehicle (58, making up 79.4%).
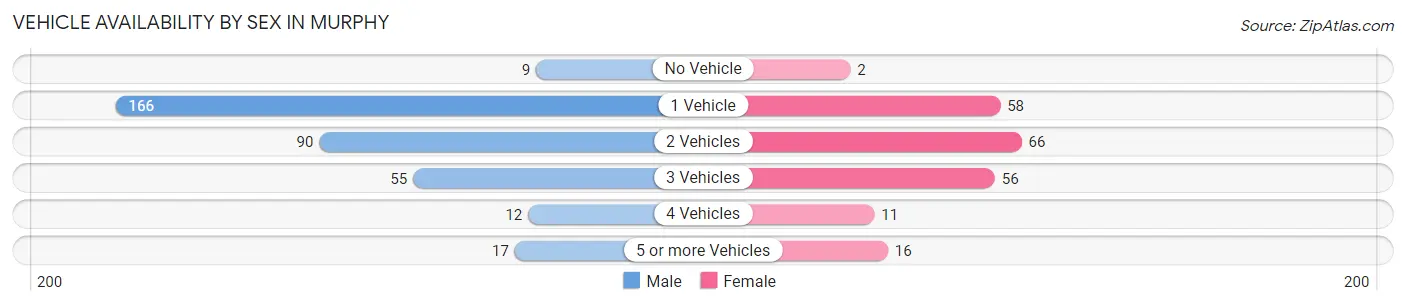
| Vehicles Available | Male | Female |
| No Vehicle | 9 (2.6%) | 2 (1.0%) |
| 1 Vehicle | 166 (47.6%) | 58 (27.8%) |
| 2 Vehicles | 90 (25.8%) | 66 (31.6%) |
| 3 Vehicles | 55 (15.8%) | 56 (26.8%) |
| 4 Vehicles | 12 (3.4%) | 11 (5.3%) |
| 5 or more Vehicles | 17 (4.9%) | 16 (7.7%) |
| Total | 349 (100.0%) | 209 (100.0%) |
Commute Time in Murphy
The most frequently occuring commute durations in Murphy are 5 to 9 minutes (266 commuters, 49.3%), 20 to 24 minutes (56 commuters, 10.4%), and 10 to 14 minutes (54 commuters, 10.0%).
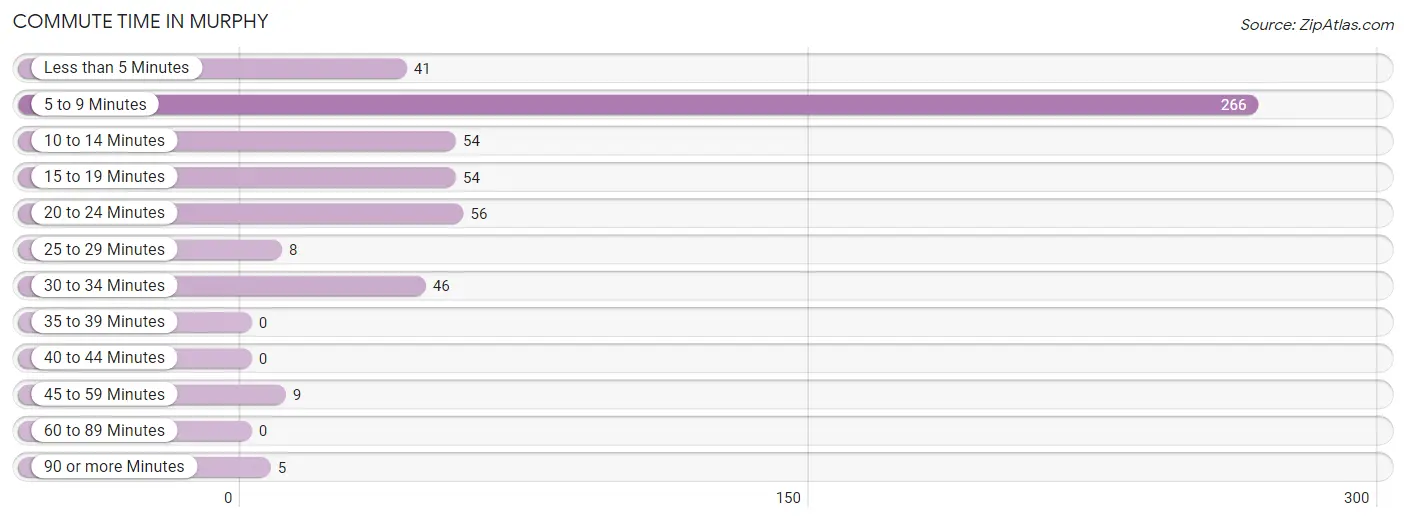
| Commute Time | # Commuters | % Commuters |
| Less than 5 Minutes | 41 | 7.6% |
| 5 to 9 Minutes | 266 | 49.3% |
| 10 to 14 Minutes | 54 | 10.0% |
| 15 to 19 Minutes | 54 | 10.0% |
| 20 to 24 Minutes | 56 | 10.4% |
| 25 to 29 Minutes | 8 | 1.5% |
| 30 to 34 Minutes | 46 | 8.5% |
| 35 to 39 Minutes | 0 | 0.0% |
| 40 to 44 Minutes | 0 | 0.0% |
| 45 to 59 Minutes | 9 | 1.7% |
| 60 to 89 Minutes | 0 | 0.0% |
| 90 or more Minutes | 5 | 0.9% |
Commute Time by Sex in Murphy
The most common commute times in Murphy are 5 to 9 minutes (188 commuters, 53.9%) for males and 5 to 9 minutes (78 commuters, 41.0%) for females.
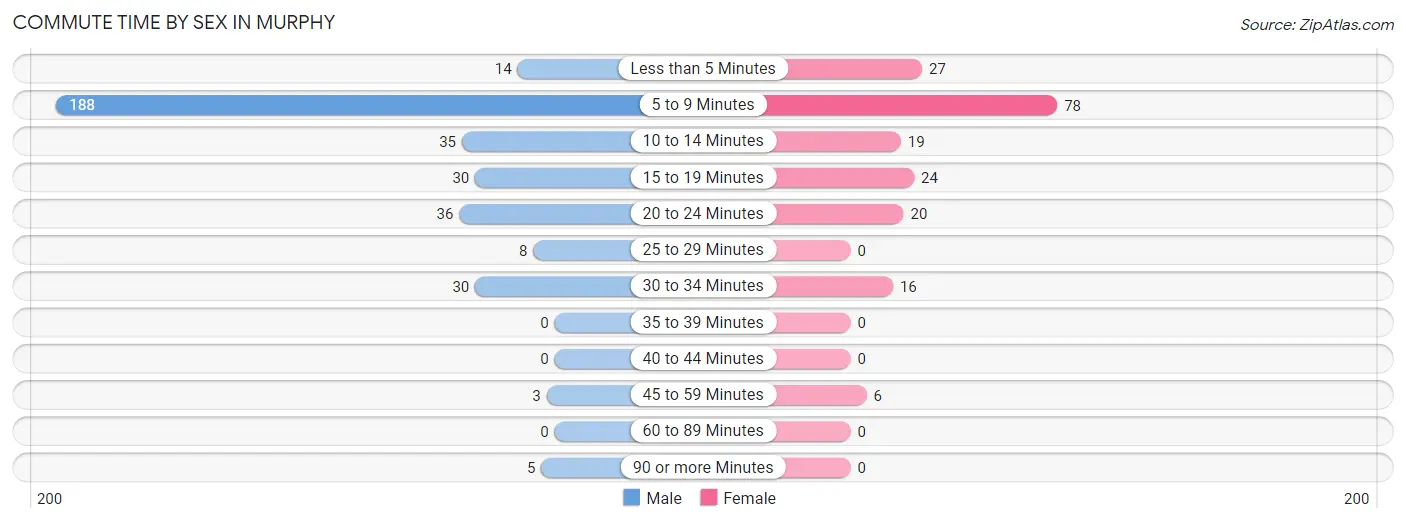
| Commute Time | Male | Female |
| Less than 5 Minutes | 14 (4.0%) | 27 (14.2%) |
| 5 to 9 Minutes | 188 (53.9%) | 78 (41.0%) |
| 10 to 14 Minutes | 35 (10.0%) | 19 (10.0%) |
| 15 to 19 Minutes | 30 (8.6%) | 24 (12.6%) |
| 20 to 24 Minutes | 36 (10.3%) | 20 (10.5%) |
| 25 to 29 Minutes | 8 (2.3%) | 0 (0.0%) |
| 30 to 34 Minutes | 30 (8.6%) | 16 (8.4%) |
| 35 to 39 Minutes | 0 (0.0%) | 0 (0.0%) |
| 40 to 44 Minutes | 0 (0.0%) | 0 (0.0%) |
| 45 to 59 Minutes | 3 (0.9%) | 6 (3.2%) |
| 60 to 89 Minutes | 0 (0.0%) | 0 (0.0%) |
| 90 or more Minutes | 5 (1.4%) | 0 (0.0%) |
Time of Departure to Work by Sex in Murphy
The most frequent times of departure to work in Murphy are 4:00 PM to 11:59 PM (118, 33.8%) for males and 7:00 AM to 7:29 AM (34, 17.9%) for females.
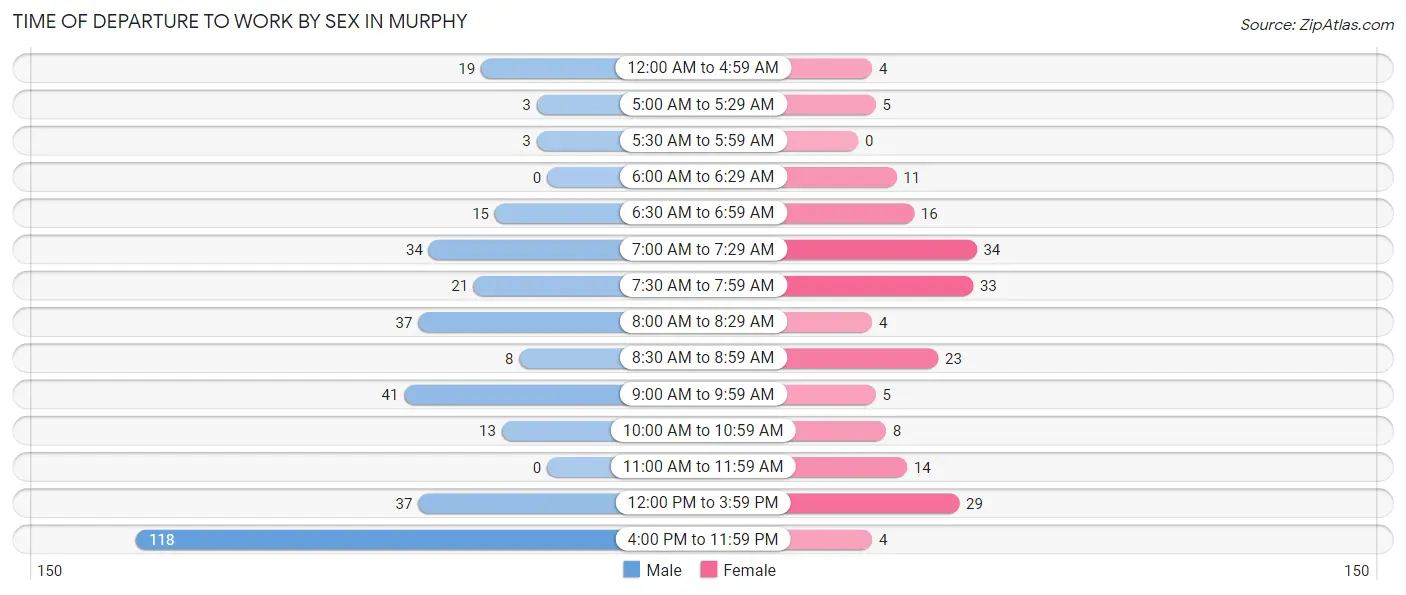
| Time of Departure | Male | Female |
| 12:00 AM to 4:59 AM | 19 (5.4%) | 4 (2.1%) |
| 5:00 AM to 5:29 AM | 3 (0.9%) | 5 (2.6%) |
| 5:30 AM to 5:59 AM | 3 (0.9%) | 0 (0.0%) |
| 6:00 AM to 6:29 AM | 0 (0.0%) | 11 (5.8%) |
| 6:30 AM to 6:59 AM | 15 (4.3%) | 16 (8.4%) |
| 7:00 AM to 7:29 AM | 34 (9.7%) | 34 (17.9%) |
| 7:30 AM to 7:59 AM | 21 (6.0%) | 33 (17.4%) |
| 8:00 AM to 8:29 AM | 37 (10.6%) | 4 (2.1%) |
| 8:30 AM to 8:59 AM | 8 (2.3%) | 23 (12.1%) |
| 9:00 AM to 9:59 AM | 41 (11.7%) | 5 (2.6%) |
| 10:00 AM to 10:59 AM | 13 (3.7%) | 8 (4.2%) |
| 11:00 AM to 11:59 AM | 0 (0.0%) | 14 (7.4%) |
| 12:00 PM to 3:59 PM | 37 (10.6%) | 29 (15.3%) |
| 4:00 PM to 11:59 PM | 118 (33.8%) | 4 (2.1%) |
| Total | 349 (100.0%) | 190 (100.0%) |
Housing Occupancy in Murphy
Occupancy by Ownership in Murphy
Of the total 754 dwellings in Murphy, owner-occupied units account for 319 (42.3%), while renter-occupied units make up 435 (57.7%).
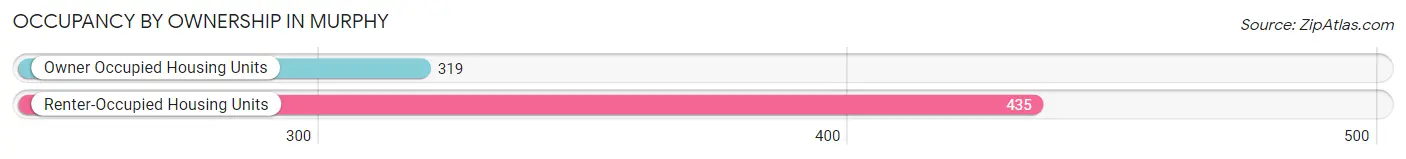
| Occupancy | # Housing Units | % Housing Units |
| Owner Occupied Housing Units | 319 | 42.3% |
| Renter-Occupied Housing Units | 435 | 57.7% |
| Total Occupied Housing Units | 754 | 100.0% |
Occupancy by Household Size in Murphy
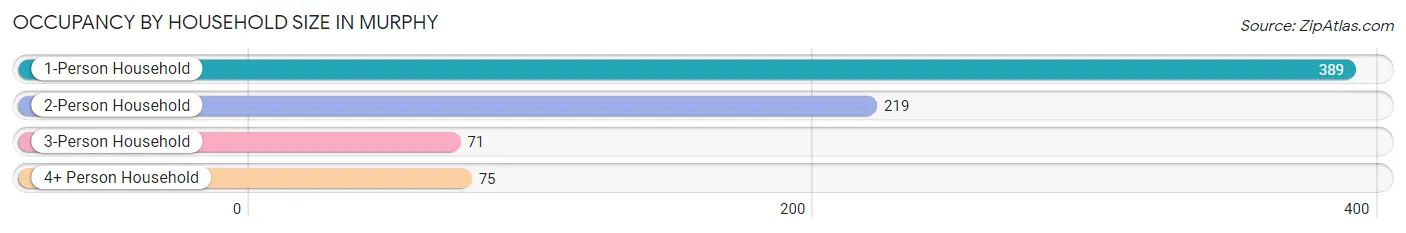
| Household Size | # Housing Units | % Housing Units |
| 1-Person Household | 389 | 51.6% |
| 2-Person Household | 219 | 29.0% |
| 3-Person Household | 71 | 9.4% |
| 4+ Person Household | 75 | 10.0% |
| Total Housing Units | 754 | 100.0% |
Occupancy by Ownership by Household Size in Murphy
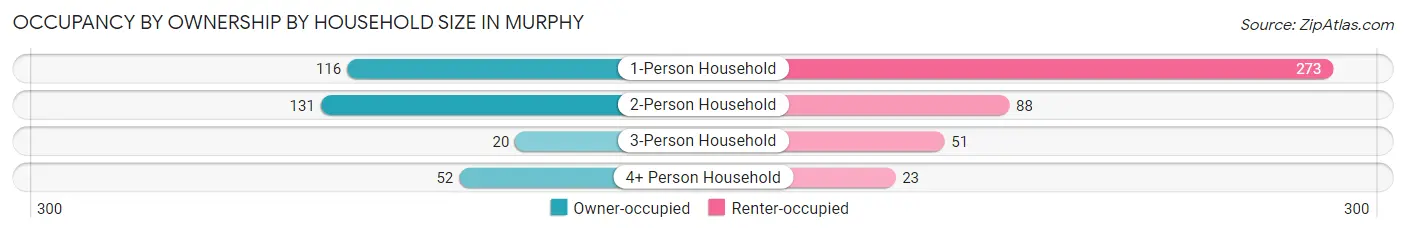
| Household Size | Owner-occupied | Renter-occupied |
| 1-Person Household | 116 (29.8%) | 273 (70.2%) |
| 2-Person Household | 131 (59.8%) | 88 (40.2%) |
| 3-Person Household | 20 (28.2%) | 51 (71.8%) |
| 4+ Person Household | 52 (69.3%) | 23 (30.7%) |
| Total Housing Units | 319 (42.3%) | 435 (57.7%) |
Occupancy by Educational Attainment in Murphy
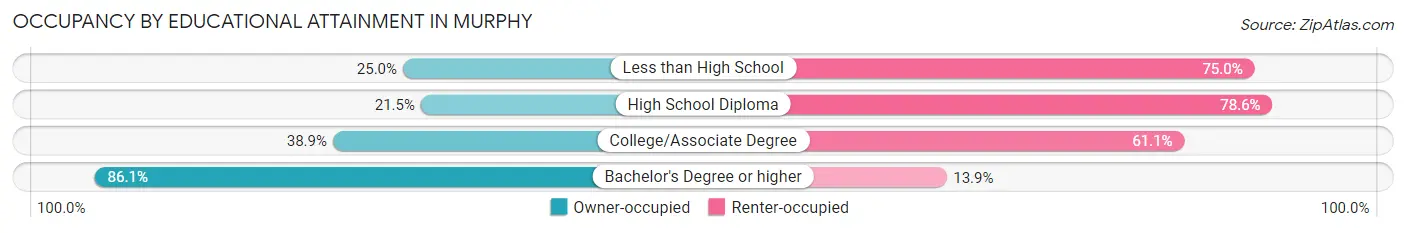
| Household Size | Owner-occupied | Renter-occupied |
| Less than High School | 13 (25.0%) | 39 (75.0%) |
| High School Diploma | 68 (21.4%) | 249 (78.5%) |
| College/Associate Degree | 77 (38.9%) | 121 (61.1%) |
| Bachelor's Degree or higher | 161 (86.1%) | 26 (13.9%) |
Occupancy by Age of Householder in Murphy
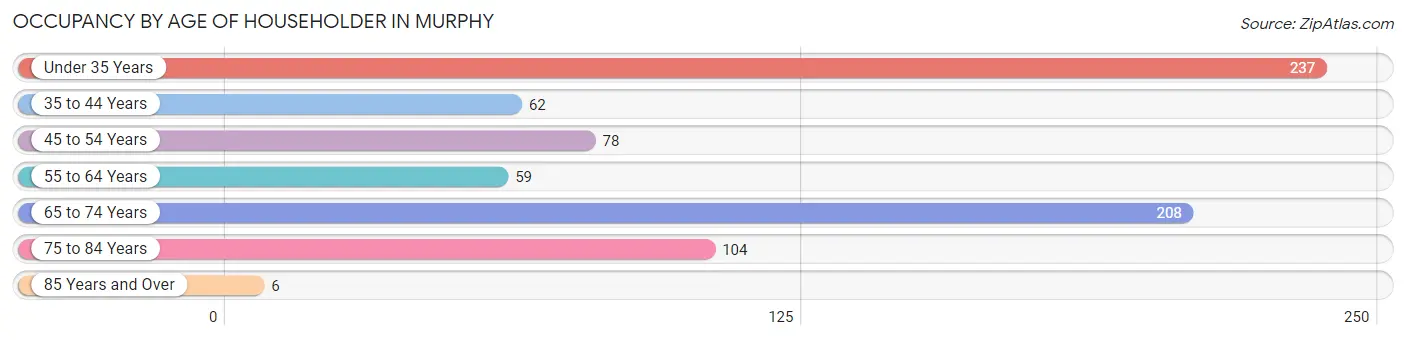
| Age Bracket | # Households | % Households |
| Under 35 Years | 237 | 31.4% |
| 35 to 44 Years | 62 | 8.2% |
| 45 to 54 Years | 78 | 10.3% |
| 55 to 64 Years | 59 | 7.8% |
| 65 to 74 Years | 208 | 27.6% |
| 75 to 84 Years | 104 | 13.8% |
| 85 Years and Over | 6 | 0.8% |
| Total | 754 | 100.0% |
Housing Finances in Murphy
Median Income by Occupancy in Murphy
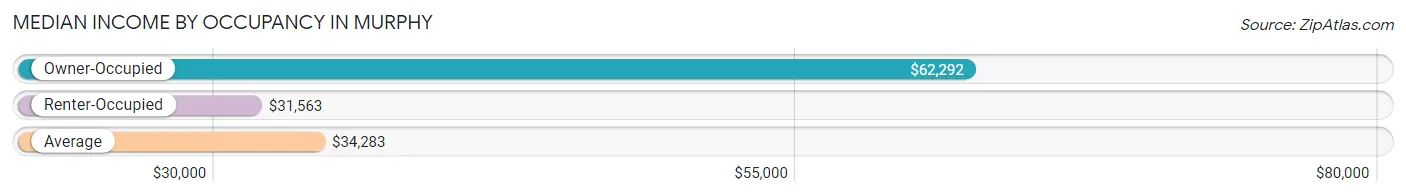
| Occupancy Type | # Households | Median Income |
| Owner-Occupied | 319 (42.3%) | $62,292 |
| Renter-Occupied | 435 (57.7%) | $31,563 |
| Average | 754 (100.0%) | $34,283 |
Occupancy by Householder Income Bracket in Murphy
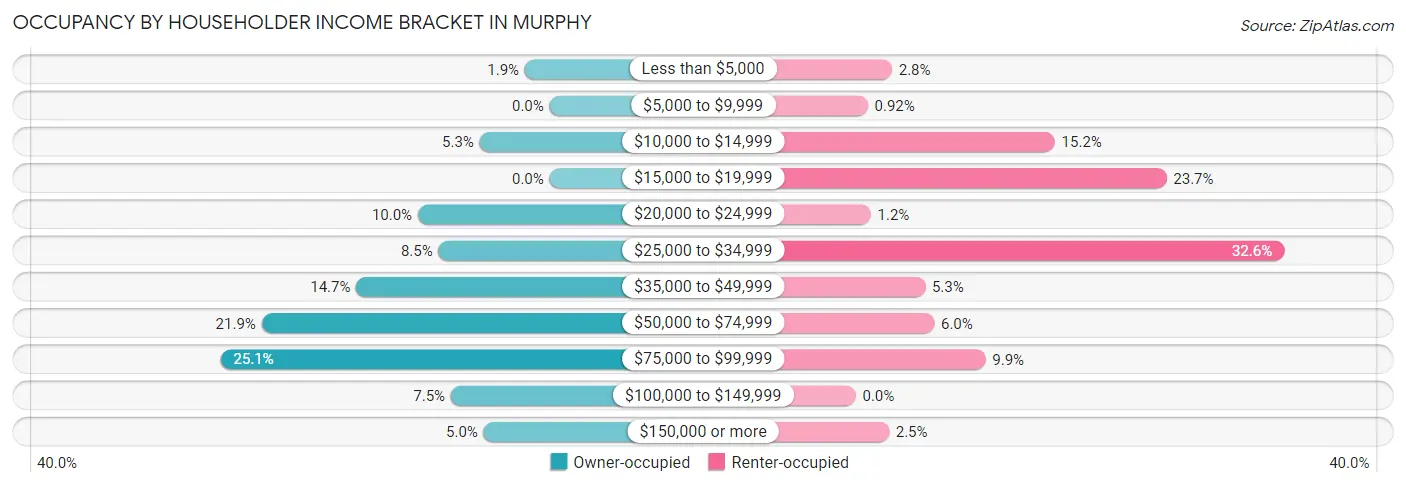
| Income Bracket | Owner-occupied | Renter-occupied |
| Less than $5,000 | 6 (1.9%) | 12 (2.8%) |
| $5,000 to $9,999 | 0 (0.0%) | 4 (0.9%) |
| $10,000 to $14,999 | 17 (5.3%) | 66 (15.2%) |
| $15,000 to $19,999 | 0 (0.0%) | 103 (23.7%) |
| $20,000 to $24,999 | 32 (10.0%) | 5 (1.1%) |
| $25,000 to $34,999 | 27 (8.5%) | 142 (32.6%) |
| $35,000 to $49,999 | 47 (14.7%) | 23 (5.3%) |
| $50,000 to $74,999 | 70 (21.9%) | 26 (6.0%) |
| $75,000 to $99,999 | 80 (25.1%) | 43 (9.9%) |
| $100,000 to $149,999 | 24 (7.5%) | 0 (0.0%) |
| $150,000 or more | 16 (5.0%) | 11 (2.5%) |
| Total | 319 (100.0%) | 435 (100.0%) |
Monthly Housing Cost Tiers in Murphy
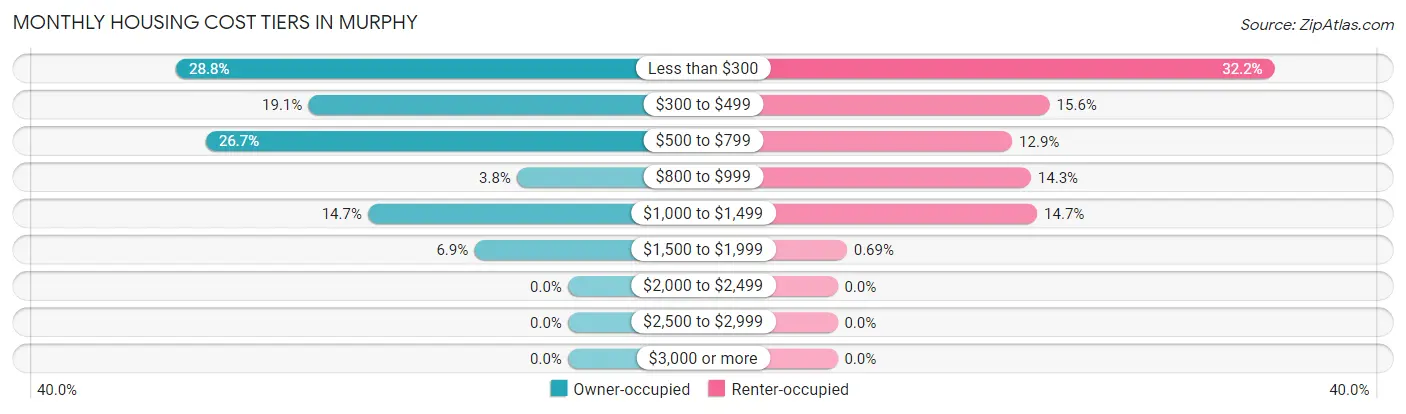
| Monthly Cost | Owner-occupied | Renter-occupied |
| Less than $300 | 92 (28.8%) | 140 (32.2%) |
| $300 to $499 | 61 (19.1%) | 68 (15.6%) |
| $500 to $799 | 85 (26.7%) | 56 (12.9%) |
| $800 to $999 | 12 (3.8%) | 62 (14.2%) |
| $1,000 to $1,499 | 47 (14.7%) | 64 (14.7%) |
| $1,500 to $1,999 | 22 (6.9%) | 3 (0.7%) |
| $2,000 to $2,499 | 0 (0.0%) | 0 (0.0%) |
| $2,500 to $2,999 | 0 (0.0%) | 0 (0.0%) |
| $3,000 or more | 0 (0.0%) | 0 (0.0%) |
| Total | 319 (100.0%) | 435 (100.0%) |
Physical Housing Characteristics in Murphy
Housing Structures in Murphy
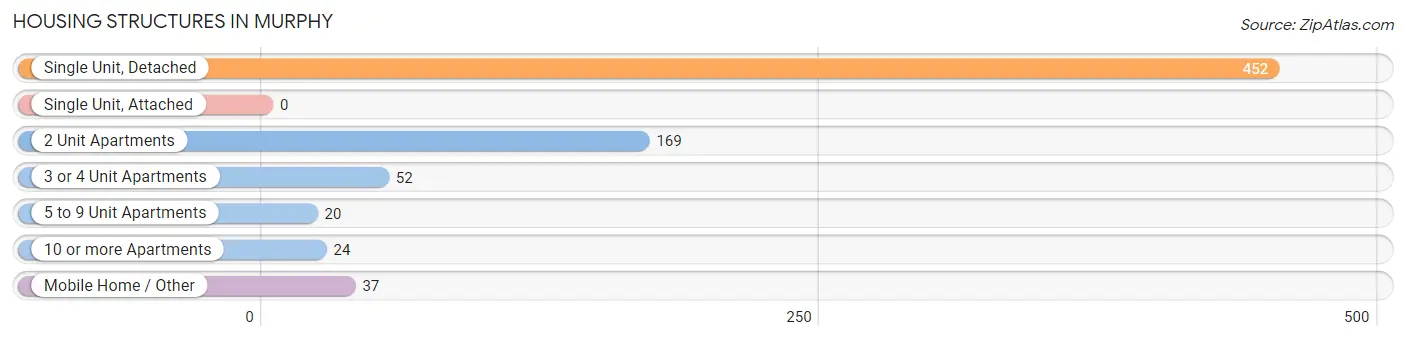
| Structure Type | # Housing Units | % Housing Units |
| Single Unit, Detached | 452 | 60.0% |
| Single Unit, Attached | 0 | 0.0% |
| 2 Unit Apartments | 169 | 22.4% |
| 3 or 4 Unit Apartments | 52 | 6.9% |
| 5 to 9 Unit Apartments | 20 | 2.6% |
| 10 or more Apartments | 24 | 3.2% |
| Mobile Home / Other | 37 | 4.9% |
| Total | 754 | 100.0% |
Housing Structures by Occupancy in Murphy
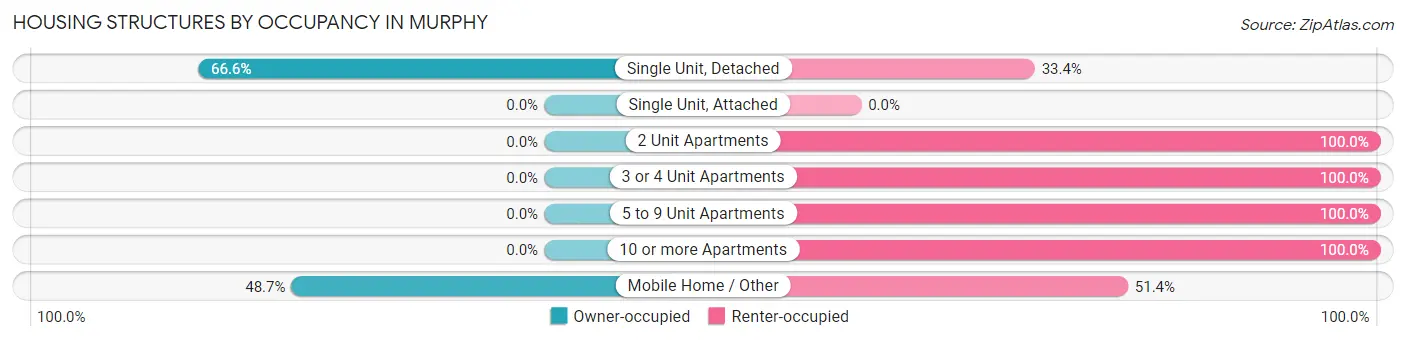
| Structure Type | Owner-occupied | Renter-occupied |
| Single Unit, Detached | 301 (66.6%) | 151 (33.4%) |
| Single Unit, Attached | 0 (0.0%) | 0 (0.0%) |
| 2 Unit Apartments | 0 (0.0%) | 169 (100.0%) |
| 3 or 4 Unit Apartments | 0 (0.0%) | 52 (100.0%) |
| 5 to 9 Unit Apartments | 0 (0.0%) | 20 (100.0%) |
| 10 or more Apartments | 0 (0.0%) | 24 (100.0%) |
| Mobile Home / Other | 18 (48.6%) | 19 (51.3%) |
| Total | 319 (42.3%) | 435 (57.7%) |
Housing Structures by Number of Rooms in Murphy
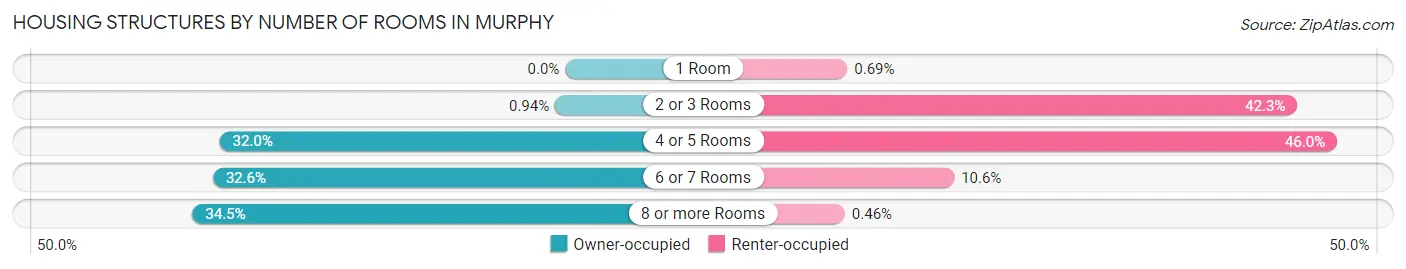
| Number of Rooms | Owner-occupied | Renter-occupied |
| 1 Room | 0 (0.0%) | 3 (0.7%) |
| 2 or 3 Rooms | 3 (0.9%) | 184 (42.3%) |
| 4 or 5 Rooms | 102 (32.0%) | 200 (46.0%) |
| 6 or 7 Rooms | 104 (32.6%) | 46 (10.6%) |
| 8 or more Rooms | 110 (34.5%) | 2 (0.5%) |
| Total | 319 (100.0%) | 435 (100.0%) |
Housing Structure by Heating Type in Murphy
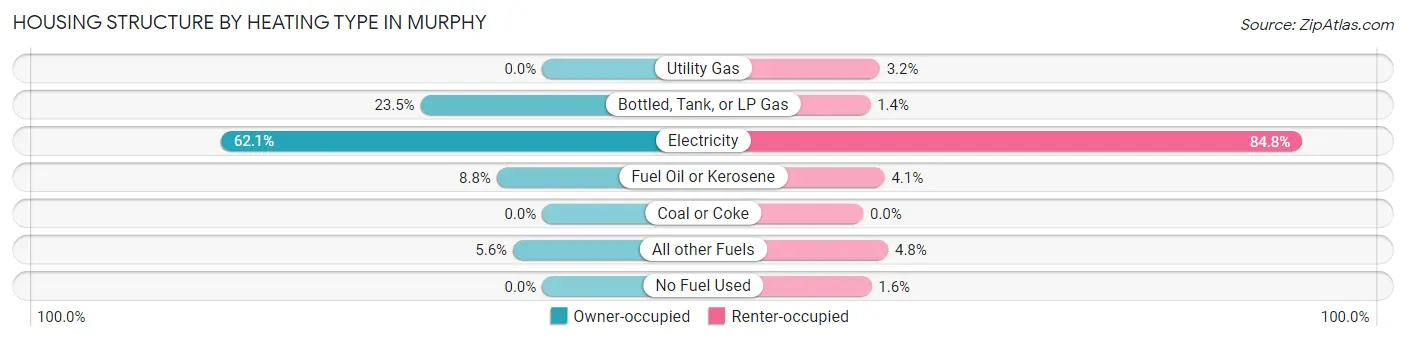
| Heating Type | Owner-occupied | Renter-occupied |
| Utility Gas | 0 (0.0%) | 14 (3.2%) |
| Bottled, Tank, or LP Gas | 75 (23.5%) | 6 (1.4%) |
| Electricity | 198 (62.1%) | 369 (84.8%) |
| Fuel Oil or Kerosene | 28 (8.8%) | 18 (4.1%) |
| Coal or Coke | 0 (0.0%) | 0 (0.0%) |
| All other Fuels | 18 (5.6%) | 21 (4.8%) |
| No Fuel Used | 0 (0.0%) | 7 (1.6%) |
| Total | 319 (100.0%) | 435 (100.0%) |
Household Vehicle Usage in Murphy
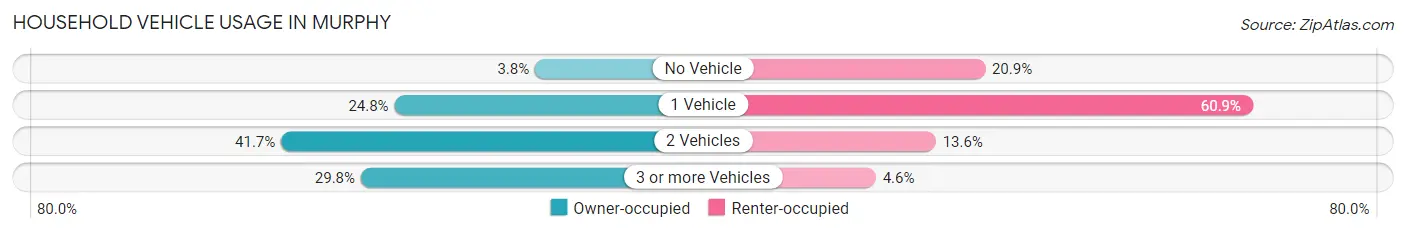
| Vehicles per Household | Owner-occupied | Renter-occupied |
| No Vehicle | 12 (3.8%) | 91 (20.9%) |
| 1 Vehicle | 79 (24.8%) | 265 (60.9%) |
| 2 Vehicles | 133 (41.7%) | 59 (13.6%) |
| 3 or more Vehicles | 95 (29.8%) | 20 (4.6%) |
| Total | 319 (100.0%) | 435 (100.0%) |
Real Estate & Mortgages in Murphy
Real Estate and Mortgage Overview in Murphy
| Characteristic | Without Mortgage | With Mortgage |
| Housing Units | 208 | 111 |
| Median Property Value | $130,400 | $243,500 |
| Median Household Income | $70,357 | $2 |
| Monthly Housing Costs | $343 | $0 |
| Real Estate Taxes | $900 | $0 |
Property Value by Mortgage Status in Murphy
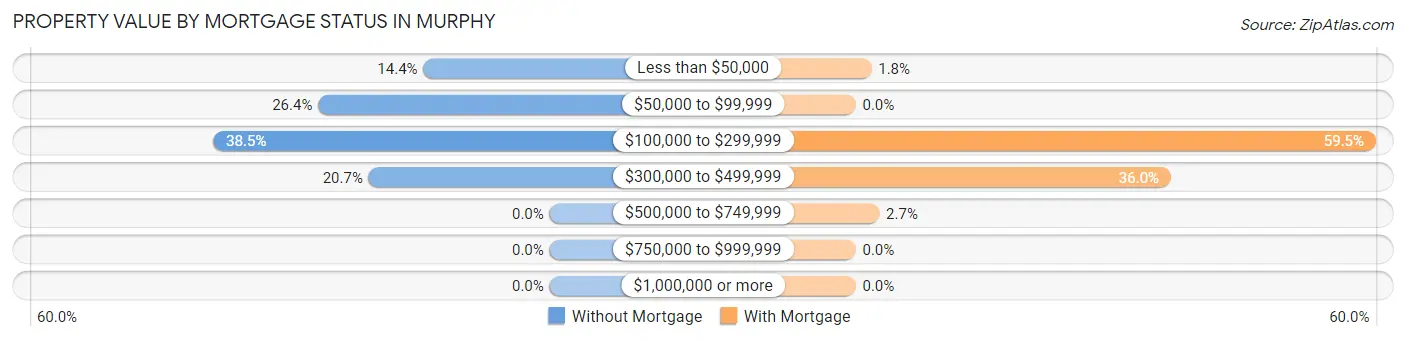
| Property Value | Without Mortgage | With Mortgage |
| Less than $50,000 | 30 (14.4%) | 2 (1.8%) |
| $50,000 to $99,999 | 55 (26.4%) | 0 (0.0%) |
| $100,000 to $299,999 | 80 (38.5%) | 66 (59.5%) |
| $300,000 to $499,999 | 43 (20.7%) | 40 (36.0%) |
| $500,000 to $749,999 | 0 (0.0%) | 3 (2.7%) |
| $750,000 to $999,999 | 0 (0.0%) | 0 (0.0%) |
| $1,000,000 or more | 0 (0.0%) | 0 (0.0%) |
| Total | 208 (100.0%) | 111 (100.0%) |
Household Income by Mortgage Status in Murphy
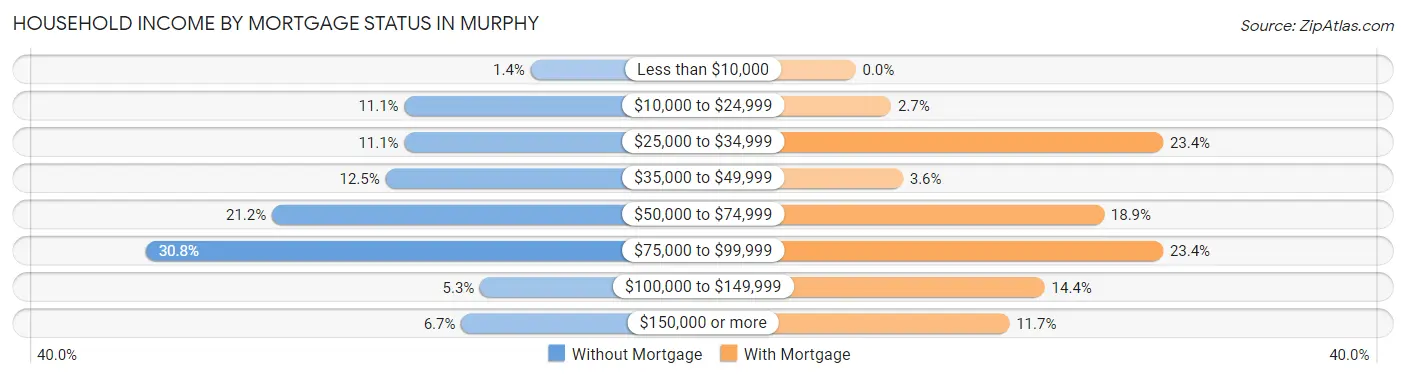
| Household Income | Without Mortgage | With Mortgage |
| Less than $10,000 | 3 (1.4%) | 0 (0.0%) |
| $10,000 to $24,999 | 23 (11.1%) | 3 (2.7%) |
| $25,000 to $34,999 | 23 (11.1%) | 26 (23.4%) |
| $35,000 to $49,999 | 26 (12.5%) | 4 (3.6%) |
| $50,000 to $74,999 | 44 (21.1%) | 21 (18.9%) |
| $75,000 to $99,999 | 64 (30.8%) | 26 (23.4%) |
| $100,000 to $149,999 | 11 (5.3%) | 16 (14.4%) |
| $150,000 or more | 14 (6.7%) | 13 (11.7%) |
| Total | 208 (100.0%) | 111 (100.0%) |
Property Value to Household Income Ratio in Murphy
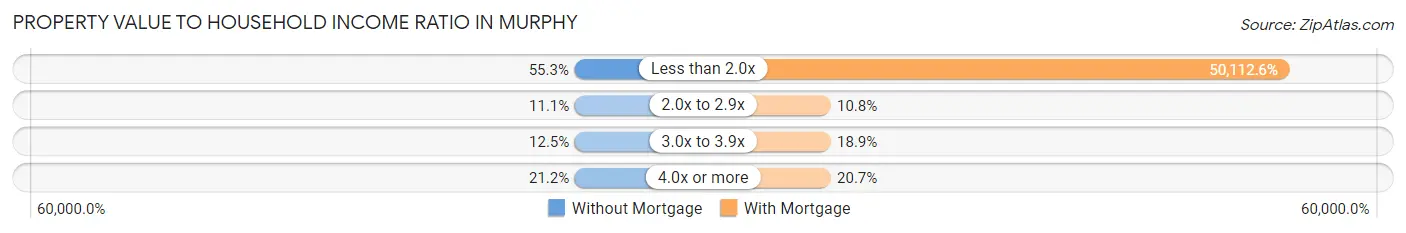
| Value-to-Income Ratio | Without Mortgage | With Mortgage |
| Less than 2.0x | 115 (55.3%) | 55,625 (50,112.6%) |
| 2.0x to 2.9x | 23 (11.1%) | 12 (10.8%) |
| 3.0x to 3.9x | 26 (12.5%) | 21 (18.9%) |
| 4.0x or more | 44 (21.1%) | 23 (20.7%) |
| Total | 208 (100.0%) | 111 (100.0%) |
Real Estate Taxes by Mortgage Status in Murphy
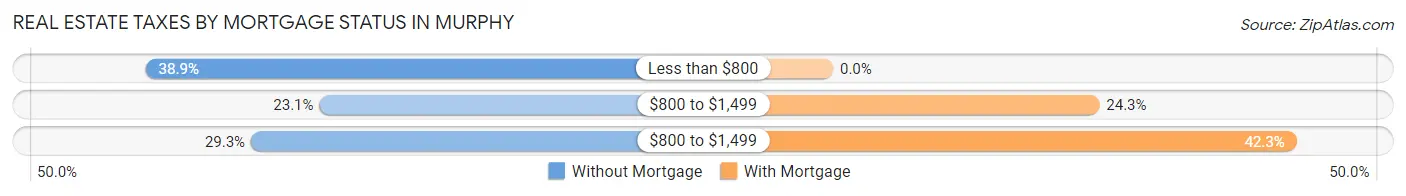
| Property Taxes | Without Mortgage | With Mortgage |
| Less than $800 | 81 (38.9%) | 0 (0.0%) |
| $800 to $1,499 | 48 (23.1%) | 27 (24.3%) |
| $800 to $1,499 | 61 (29.3%) | 47 (42.3%) |
| Total | 208 (100.0%) | 111 (100.0%) |
Health & Disability in Murphy
Health Insurance Coverage by Age in Murphy
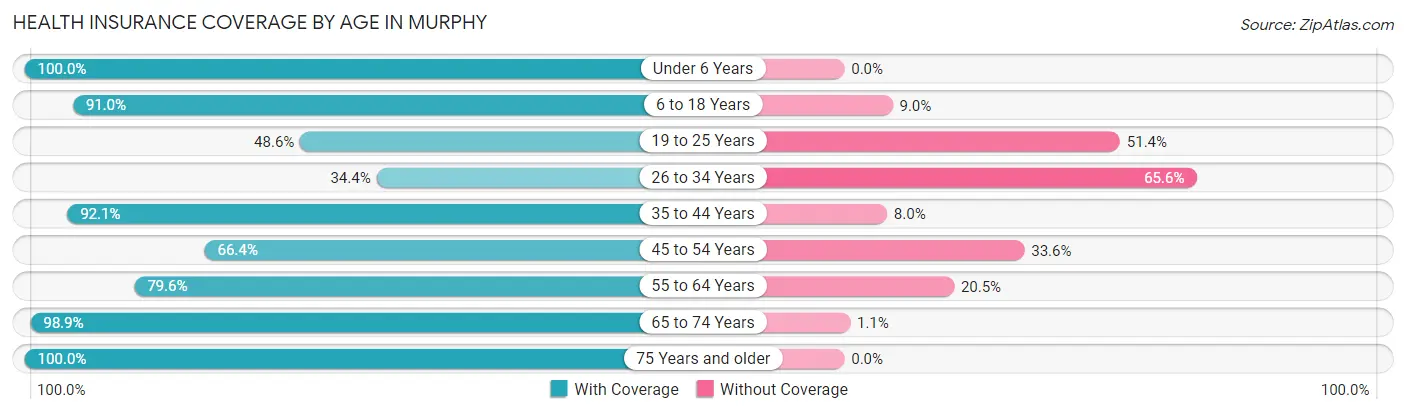
| Age Bracket | With Coverage | Without Coverage |
| Under 6 Years | 60 (100.0%) | 0 (0.0%) |
| 6 to 18 Years | 172 (91.0%) | 17 (9.0%) |
| 19 to 25 Years | 70 (48.6%) | 74 (51.4%) |
| 26 to 34 Years | 99 (34.4%) | 189 (65.6%) |
| 35 to 44 Years | 81 (92.0%) | 7 (8.0%) |
| 45 to 54 Years | 93 (66.4%) | 47 (33.6%) |
| 55 to 64 Years | 70 (79.5%) | 18 (20.4%) |
| 65 to 74 Years | 277 (98.9%) | 3 (1.1%) |
| 75 Years and older | 149 (100.0%) | 0 (0.0%) |
| Total | 1,071 (75.1%) | 355 (24.9%) |
Health Insurance Coverage by Citizenship Status in Murphy
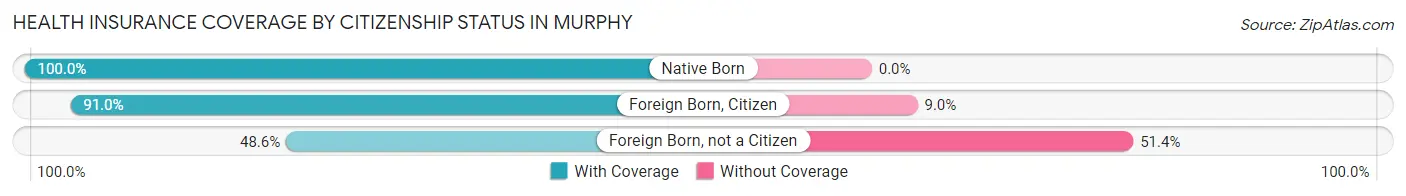
| Citizenship Status | With Coverage | Without Coverage |
| Native Born | 60 (100.0%) | 0 (0.0%) |
| Foreign Born, Citizen | 172 (91.0%) | 17 (9.0%) |
| Foreign Born, not a Citizen | 70 (48.6%) | 74 (51.4%) |
Health Insurance Coverage by Household Income in Murphy
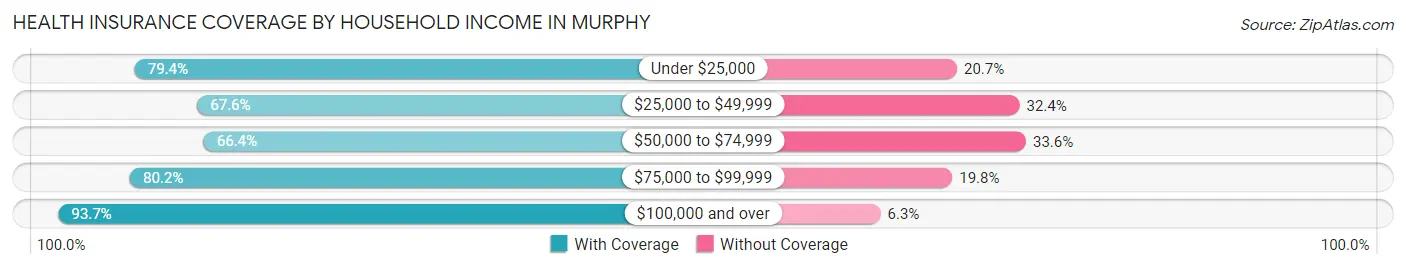
| Household Income | With Coverage | Without Coverage |
| Under $25,000 | 269 (79.3%) | 70 (20.6%) |
| $25,000 to $49,999 | 280 (67.6%) | 134 (32.4%) |
| $50,000 to $74,999 | 178 (66.4%) | 90 (33.6%) |
| $75,000 to $99,999 | 211 (80.2%) | 52 (19.8%) |
| $100,000 and over | 133 (93.7%) | 9 (6.3%) |
Public vs Private Health Insurance Coverage by Age in Murphy
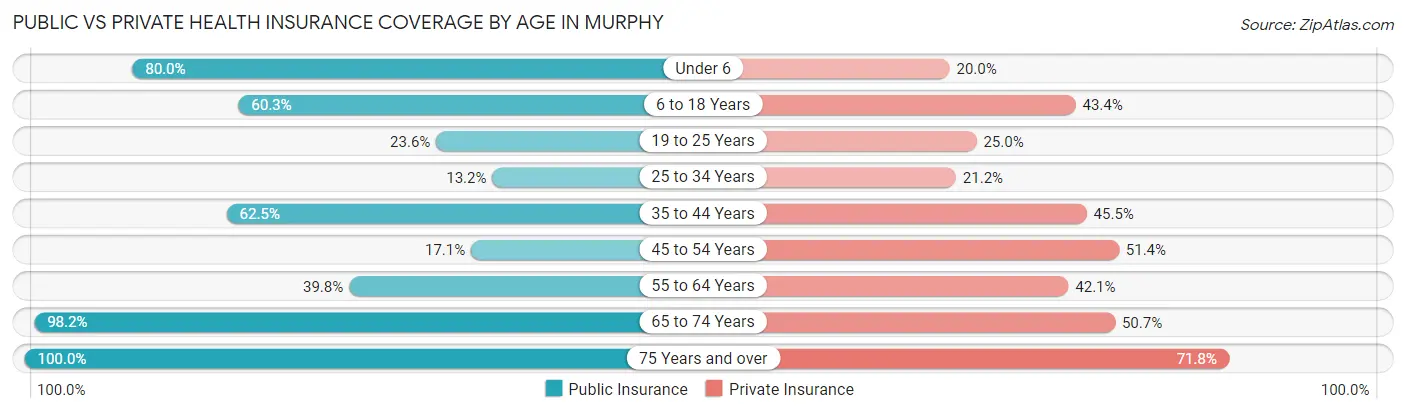
| Age Bracket | Public Insurance | Private Insurance |
| Under 6 | 48 (80.0%) | 12 (20.0%) |
| 6 to 18 Years | 114 (60.3%) | 82 (43.4%) |
| 19 to 25 Years | 34 (23.6%) | 36 (25.0%) |
| 25 to 34 Years | 38 (13.2%) | 61 (21.2%) |
| 35 to 44 Years | 55 (62.5%) | 40 (45.5%) |
| 45 to 54 Years | 24 (17.1%) | 72 (51.4%) |
| 55 to 64 Years | 35 (39.8%) | 37 (42.0%) |
| 65 to 74 Years | 275 (98.2%) | 142 (50.7%) |
| 75 Years and over | 149 (100.0%) | 107 (71.8%) |
| Total | 772 (54.1%) | 589 (41.3%) |
Disability Status by Sex by Age in Murphy
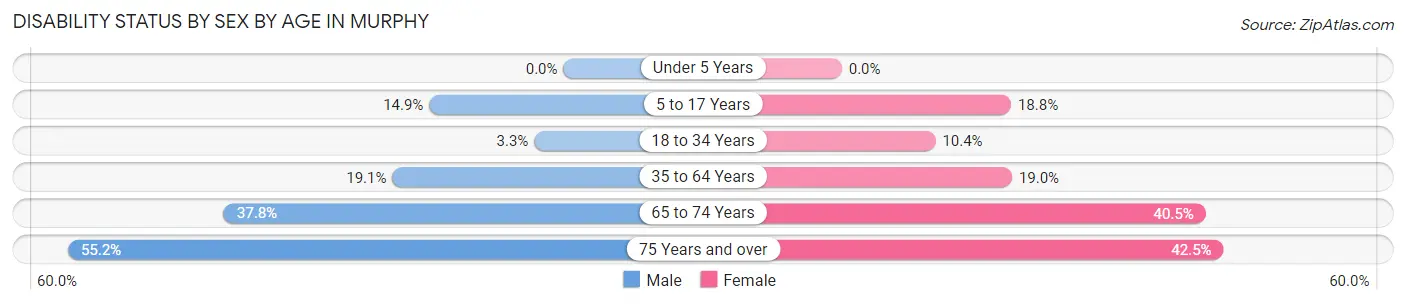
| Age Bracket | Male | Female |
| Under 5 Years | 0 (0.0%) | 0 (0.0%) |
| 5 to 17 Years | 13 (14.9%) | 13 (18.8%) |
| 18 to 34 Years | 10 (3.3%) | 17 (10.4%) |
| 35 to 64 Years | 24 (19.1%) | 36 (19.0%) |
| 65 to 74 Years | 48 (37.8%) | 62 (40.5%) |
| 75 Years and over | 16 (55.2%) | 51 (42.5%) |
Disability Class by Sex by Age in Murphy
Disability Class: Hearing Difficulty
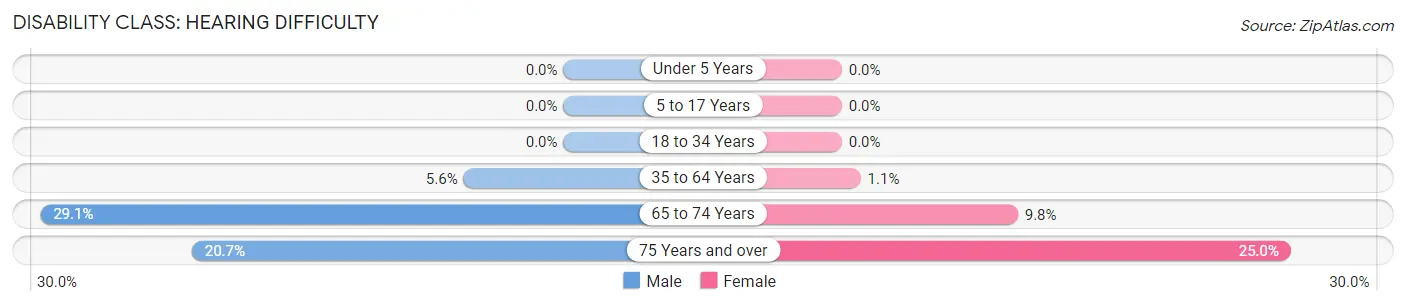
| Age Bracket | Male | Female |
| Under 5 Years | 0 (0.0%) | 0 (0.0%) |
| 5 to 17 Years | 0 (0.0%) | 0 (0.0%) |
| 18 to 34 Years | 0 (0.0%) | 0 (0.0%) |
| 35 to 64 Years | 7 (5.6%) | 2 (1.1%) |
| 65 to 74 Years | 37 (29.1%) | 15 (9.8%) |
| 75 Years and over | 6 (20.7%) | 30 (25.0%) |
Disability Class: Vision Difficulty
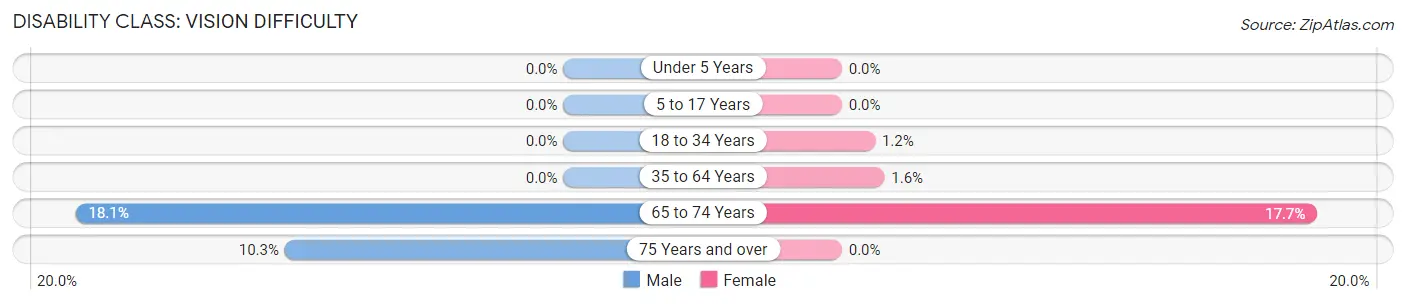
| Age Bracket | Male | Female |
| Under 5 Years | 0 (0.0%) | 0 (0.0%) |
| 5 to 17 Years | 0 (0.0%) | 0 (0.0%) |
| 18 to 34 Years | 0 (0.0%) | 2 (1.2%) |
| 35 to 64 Years | 0 (0.0%) | 3 (1.6%) |
| 65 to 74 Years | 23 (18.1%) | 27 (17.6%) |
| 75 Years and over | 3 (10.3%) | 0 (0.0%) |
Disability Class: Cognitive Difficulty
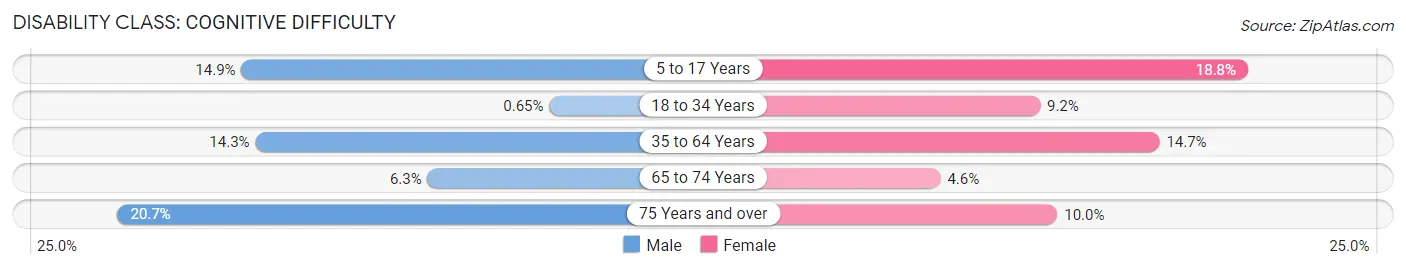
| Age Bracket | Male | Female |
| 5 to 17 Years | 13 (14.9%) | 13 (18.8%) |
| 18 to 34 Years | 2 (0.6%) | 15 (9.2%) |
| 35 to 64 Years | 18 (14.3%) | 28 (14.7%) |
| 65 to 74 Years | 8 (6.3%) | 7 (4.6%) |
| 75 Years and over | 6 (20.7%) | 12 (10.0%) |
Disability Class: Ambulatory Difficulty
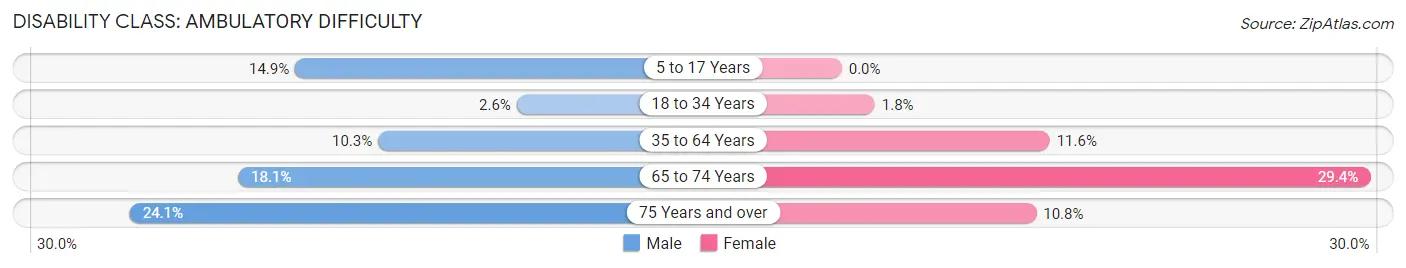
| Age Bracket | Male | Female |
| 5 to 17 Years | 13 (14.9%) | 0 (0.0%) |
| 18 to 34 Years | 8 (2.6%) | 3 (1.8%) |
| 35 to 64 Years | 13 (10.3%) | 22 (11.6%) |
| 65 to 74 Years | 23 (18.1%) | 45 (29.4%) |
| 75 Years and over | 7 (24.1%) | 13 (10.8%) |
Disability Class: Self-Care Difficulty
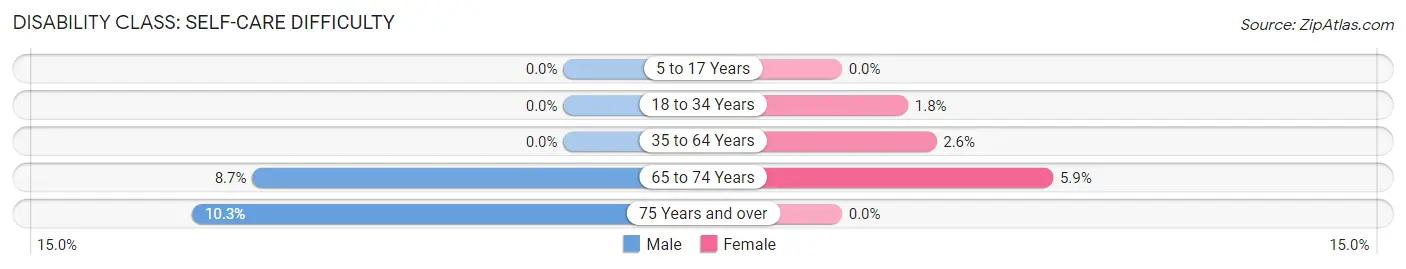
| Age Bracket | Male | Female |
| 5 to 17 Years | 0 (0.0%) | 0 (0.0%) |
| 18 to 34 Years | 0 (0.0%) | 3 (1.8%) |
| 35 to 64 Years | 0 (0.0%) | 5 (2.6%) |
| 65 to 74 Years | 11 (8.7%) | 9 (5.9%) |
| 75 Years and over | 3 (10.3%) | 0 (0.0%) |
Technology Access in Murphy
Computing Device Access in Murphy
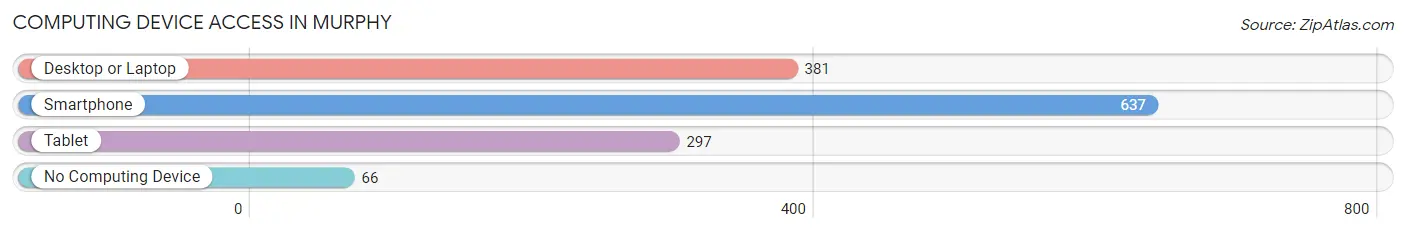
| Device Type | # Households | % Households |
| Desktop or Laptop | 381 | 50.5% |
| Smartphone | 637 | 84.5% |
| Tablet | 297 | 39.4% |
| No Computing Device | 66 | 8.7% |
| Total | 754 | 100.0% |
Internet Access in Murphy
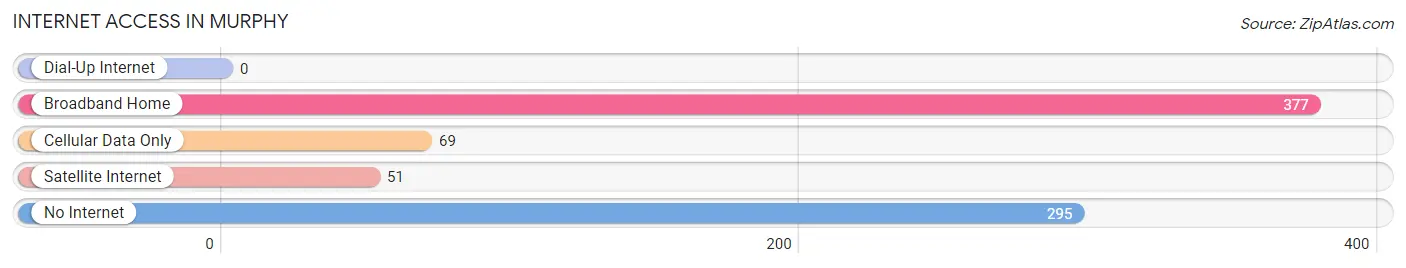
| Internet Type | # Households | % Households |
| Dial-Up Internet | 0 | 0.0% |
| Broadband Home | 377 | 50.0% |
| Cellular Data Only | 69 | 9.1% |
| Satellite Internet | 51 | 6.8% |
| No Internet | 295 | 39.1% |
| Total | 754 | 100.0% |
Murphy Summary
Murphy, North Carolina is a small town located in the Appalachian Mountains of western North Carolina. It is the county seat of Cherokee County and is situated along the Hiwassee River. The town was founded in 1839 and named after Archibald Murphy, a prominent local politician. Murphy is known for its scenic beauty, outdoor recreation, and friendly people.
Geography
Murphy is located in the Appalachian Mountains of western North Carolina, in the foothills of the Blue Ridge Mountains. The town is situated along the Hiwassee River, which flows through the center of town. The town is surrounded by the Nantahala National Forest, which provides a variety of outdoor activities such as hiking, camping, fishing, and whitewater rafting. The town is also close to the Great Smoky Mountains National Park, which is the most visited national park in the United States.
The town of Murphy has a total area of 4.2 square miles, all of which is land. The town is located at an elevation of 1,890 feet above sea level. The climate in Murphy is mild, with temperatures ranging from the low 30s in the winter to the mid-80s in the summer.
Economy
The economy of Murphy is largely based on tourism and outdoor recreation. The town is home to several tourist attractions, including the Cherokee County Historical Museum, the John C. Campbell Folk School, and the Hiwassee River Rail Adventure. The town is also home to several outdoor recreation businesses, such as whitewater rafting companies, fishing guides, and hiking outfitters.
The town is also home to several manufacturing companies, including a furniture factory, a textile mill, and a paper mill. The town is also home to several retail stores, restaurants, and other businesses.
Demographics
As of the 2010 census, the town of Murphy had a population of 1,627. The racial makeup of the town was 95.3% White, 0.9% African American, 0.7% Native American, 0.3% Asian, 0.1% Pacific Islander, and 2.7% from other races. The median household income in Murphy was $30,938, and the median family income was $37,813.
The town is home to several churches, including the First Baptist Church, the First United Methodist Church, and the Church of God. The town is also home to several schools, including Murphy Elementary School, Murphy Middle School, and Murphy High School.
Conclusion
Murphy, North Carolina is a small town located in the Appalachian Mountains of western North Carolina. It is the county seat of Cherokee County and is situated along the Hiwassee River. The town was founded in 1839 and named after Archibald Murphy, a prominent local politician. Murphy is known for its scenic beauty, outdoor recreation, and friendly people. The economy of Murphy is largely based on tourism and outdoor recreation, and the town is home to several manufacturing companies, retail stores, restaurants, and other businesses. As of the 2010 census, the town of Murphy had a population of 1,627. The town is home to several churches, schools, and other amenities.
Common Questions
What is Per Capita Income in Murphy?
Per Capita income in Murphy is $26,935.
What is the Median Family Income in Murphy?
Median Family Income in Murphy is $55,089.
What is the Median Household income in Murphy?
Median Household Income in Murphy is $34,283.
What is Income or Wage Gap in Murphy?
Income or Wage Gap in Murphy is 26.8%.
Women in Murphy earn 73.2 cents for every dollar earned by a man.
What is Family Income Deficit in Murphy?
Family Income Deficit in Murphy is $6,807.
Families that are below poverty line in Murphy earn $6,807 less on average than the poverty threshold level.
What is Inequality or Gini Index in Murphy?
Inequality or Gini Index in Murphy is 0.46.
What is the Total Population of Murphy?
Total Population of Murphy is 1,549.
What is the Total Male Population of Murphy?
Total Male Population of Murphy is 772.
What is the Total Female Population of Murphy?
Total Female Population of Murphy is 777.
What is the Ratio of Males per 100 Females in Murphy?
There are 99.36 Males per 100 Females in Murphy.
What is the Ratio of Females per 100 Males in Murphy?
There are 100.65 Females per 100 Males in Murphy.
What is the Median Population Age in Murphy?
Median Population Age in Murphy is 37.0 Years.
What is the Average Family Size in Murphy
Average Family Size in Murphy is 2.8 People.
What is the Average Household Size in Murphy
Average Household Size in Murphy is 1.9 People.
How Large is the Labor Force in Murphy?
There are 607 People in the Labor Forcein in Murphy.
What is the Percentage of People in the Labor Force in Murphy?
44.6% of People are in the Labor Force in Murphy.
What is the Unemployment Rate in Murphy?
Unemployment Rate in Murphy is 7.7%.