Moncure, NC Map & Demographics
Moncure Map
Moncure Overview
$25,004
PER CAPITA INCOME
$51,896
AVG HOUSEHOLD INCOME
0.30
INEQUALITY / GINI INDEX
775
TOTAL POPULATION
429
MALE POPULATION
346
FEMALE POPULATION
123.99
MALES / 100 FEMALES
80.65
FEMALES / 100 MALES
58.2
MEDIAN AGE
3.0
AVG FAMILY SIZE
3.1
AVG HOUSEHOLD SIZE
387
LABOR FORCE [ PEOPLE ]
58.1%
PERCENT IN LABOR FORCE
Moncure Zip Codes
Income in Moncure
Income Overview in Moncure
| Characteristic | Number | Measure |
| Per Capita Income | 775 | $25,004 |
| Median Family Income | 207 | $0 |
| Mean Family Income | 207 | $52,844 |
| Median Household Income | 246 | $51,896 |
| Mean Household Income | 246 | $63,355 |
| Income Deficit | 207 | $0 |
| Wage / Income Gap (%) | 775 | 0.00% |
| Wage / Income Gap ($) | 775 | 100.00¢ per $1 |
| Gini / Inequality Index | 775 | 0.30 |
Earnings by Sex in Moncure
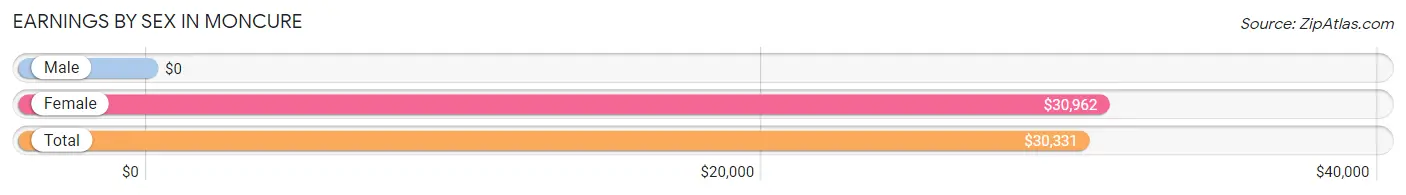
| Sex | Number | Average Earnings |
| Male | 265 (68.5%) | $0 |
| Female | 122 (31.5%) | $30,962 |
| Total | 387 (100.0%) | $30,331 |
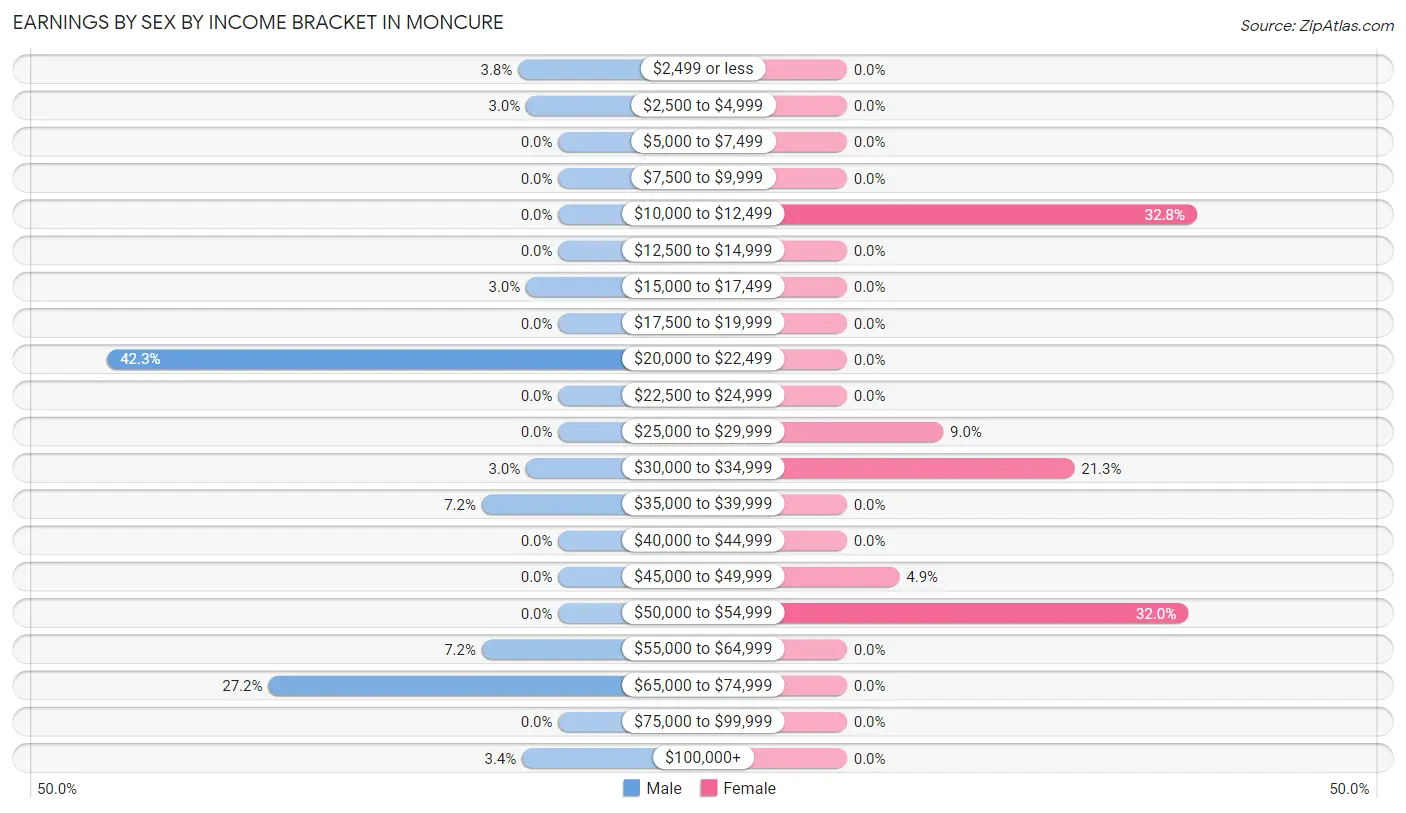
Earnings by Sex by Income Bracket in Moncure
The most common earnings brackets in Moncure are $20,000 to $22,499 for men (112 | 42.3%) and $10,000 to $12,499 for women (40 | 32.8%).
| Income | Male | Female |
| $2,499 or less | 10 (3.8%) | 0 (0.0%) |
| $2,500 to $4,999 | 8 (3.0%) | 0 (0.0%) |
| $5,000 to $7,499 | 0 (0.0%) | 0 (0.0%) |
| $7,500 to $9,999 | 0 (0.0%) | 0 (0.0%) |
| $10,000 to $12,499 | 0 (0.0%) | 40 (32.8%) |
| $12,500 to $14,999 | 0 (0.0%) | 0 (0.0%) |
| $15,000 to $17,499 | 8 (3.0%) | 0 (0.0%) |
| $17,500 to $19,999 | 0 (0.0%) | 0 (0.0%) |
| $20,000 to $22,499 | 112 (42.3%) | 0 (0.0%) |
| $22,500 to $24,999 | 0 (0.0%) | 0 (0.0%) |
| $25,000 to $29,999 | 0 (0.0%) | 11 (9.0%) |
| $30,000 to $34,999 | 8 (3.0%) | 26 (21.3%) |
| $35,000 to $39,999 | 19 (7.2%) | 0 (0.0%) |
| $40,000 to $44,999 | 0 (0.0%) | 0 (0.0%) |
| $45,000 to $49,999 | 0 (0.0%) | 6 (4.9%) |
| $50,000 to $54,999 | 0 (0.0%) | 39 (32.0%) |
| $55,000 to $64,999 | 19 (7.2%) | 0 (0.0%) |
| $65,000 to $74,999 | 72 (27.2%) | 0 (0.0%) |
| $75,000 to $99,999 | 0 (0.0%) | 0 (0.0%) |
| $100,000+ | 9 (3.4%) | 0 (0.0%) |
| Total | 265 (100.0%) | 122 (100.0%) |
Earnings by Sex by Educational Attainment in Moncure
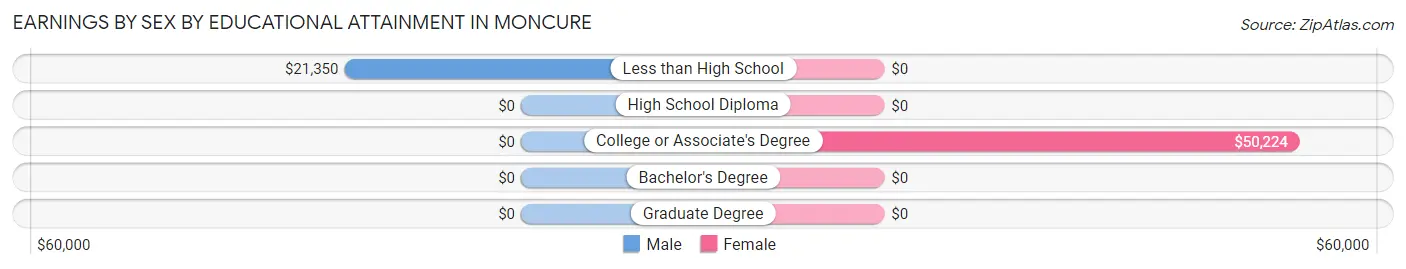
| Educational Attainment | Male Income | Female Income |
| Less than High School | $21,350 | $0 |
| High School Diploma | - | - |
| College or Associate's Degree | - | - |
| Bachelor's Degree | - | - |
| Graduate Degree | - | - |
| Total | - | - |
Family Income in Moncure
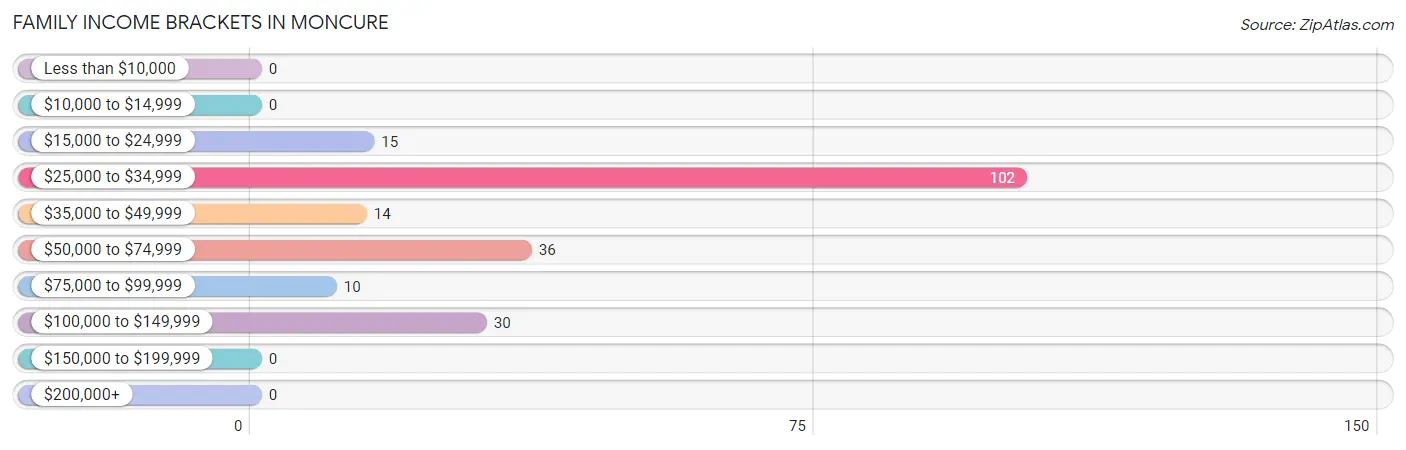
Family Income Brackets in Moncure
According to the Moncure family income data, there are 102 families falling into the $25,000 to $34,999 income range, which is the most common income bracket and makes up 49.3% of all families.
| Income Bracket | # Families | % Families |
| Less than $10,000 | 0 | 0.0% |
| $10,000 to $14,999 | 0 | 0.0% |
| $15,000 to $24,999 | 15 | 7.2% |
| $25,000 to $34,999 | 102 | 49.3% |
| $35,000 to $49,999 | 14 | 6.8% |
| $50,000 to $74,999 | 36 | 17.4% |
| $75,000 to $99,999 | 10 | 4.8% |
| $100,000 to $149,999 | 30 | 14.5% |
| $150,000 to $199,999 | 0 | 0.0% |
| $200,000+ | 0 | 0.0% |
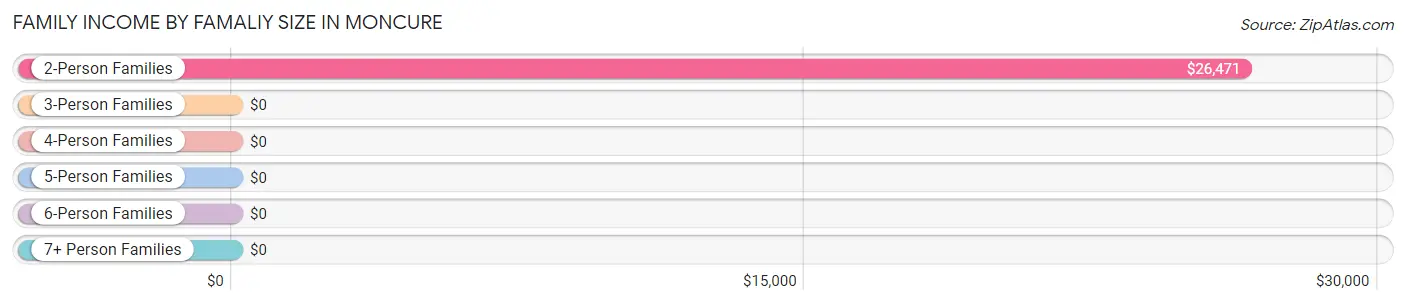
Family Income by Famaliy Size in Moncure
2-person families (150 | 72.5%) account for the highest median family income in Moncure with $26,471 per family, while 2-person families (150 | 72.5%) have the highest median income of $13,236 per family member.
| Income Bracket | # Families | Median Income |
| 2-Person Families | 150 (72.5%) | $26,471 |
| 3-Person Families | 6 (2.9%) | $0 |
| 4-Person Families | 11 (5.3%) | $0 |
| 5-Person Families | 0 (0.0%) | $0 |
| 6-Person Families | 40 (19.3%) | $0 |
| 7+ Person Families | 0 (0.0%) | $0 |
| Total | 207 (100.0%) | $0 |
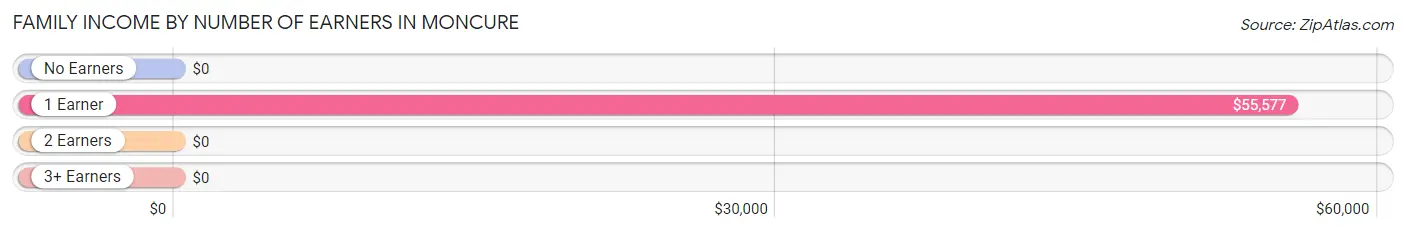
Family Income by Number of Earners in Moncure
| Number of Earners | # Families | Median Income |
| No Earners | 106 (51.2%) | $0 |
| 1 Earner | 44 (21.3%) | $55,577 |
| 2 Earners | 17 (8.2%) | $0 |
| 3+ Earners | 40 (19.3%) | $0 |
| Total | 207 (100.0%) | $0 |
Household Income in Moncure
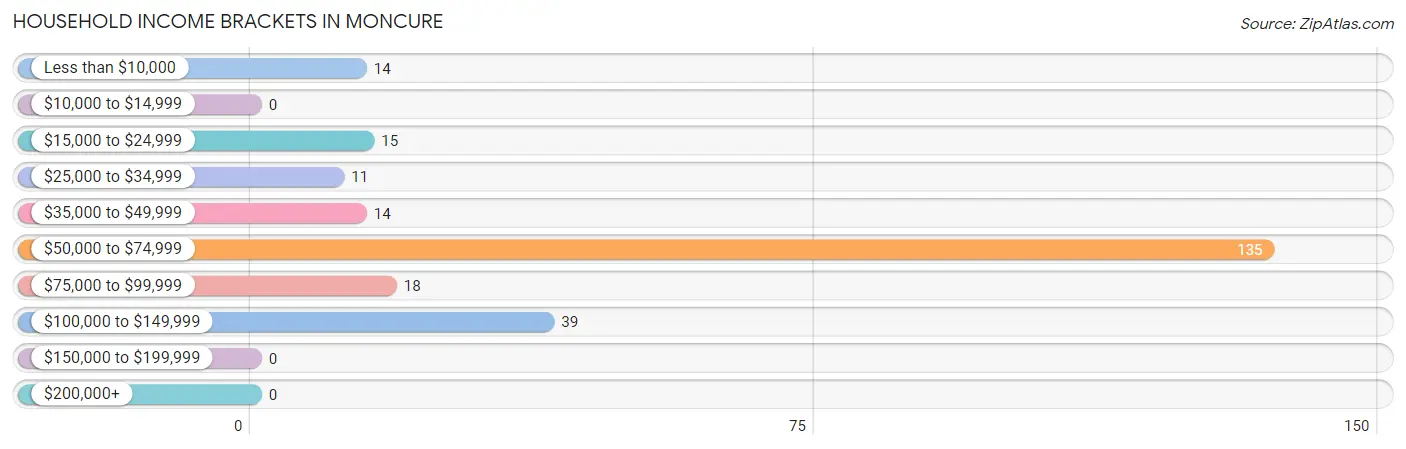
Household Income Brackets in Moncure
With 135 households falling in the category, the $50,000 to $74,999 income range is the most frequent in Moncure, accounting for 54.9% of all households.
| Income Bracket | # Households | % Households |
| Less than $10,000 | 14 | 5.7% |
| $10,000 to $14,999 | 0 | 0.0% |
| $15,000 to $24,999 | 15 | 6.1% |
| $25,000 to $34,999 | 11 | 4.5% |
| $35,000 to $49,999 | 14 | 5.7% |
| $50,000 to $74,999 | 135 | 54.9% |
| $75,000 to $99,999 | 18 | 7.3% |
| $100,000 to $149,999 | 39 | 15.9% |
| $150,000 to $199,999 | 0 | 0.0% |
| $200,000+ | 0 | 0.0% |
Household Income by Householder Age in Moncure
The median household income in Moncure is $51,896, with the highest median household income of $51,429 found in the 45 to 64 years age bracket for the primary householder. A total of 184 households (74.8%) fall into this category.
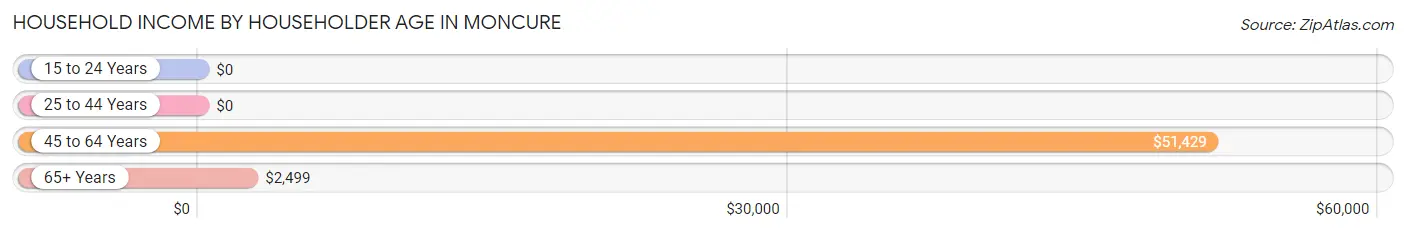
| Income Bracket | # Households | Median Income |
| 15 to 24 Years | 0 (0.0%) | $0 |
| 25 to 44 Years | 38 (15.4%) | $0 |
| 45 to 64 Years | 184 (74.8%) | $51,429 |
| 65+ Years | 24 (9.8%) | $2,499 |
| Total | 246 (100.0%) | $51,896 |
Poverty in Moncure
Income Below Poverty by Sex and Age in Moncure
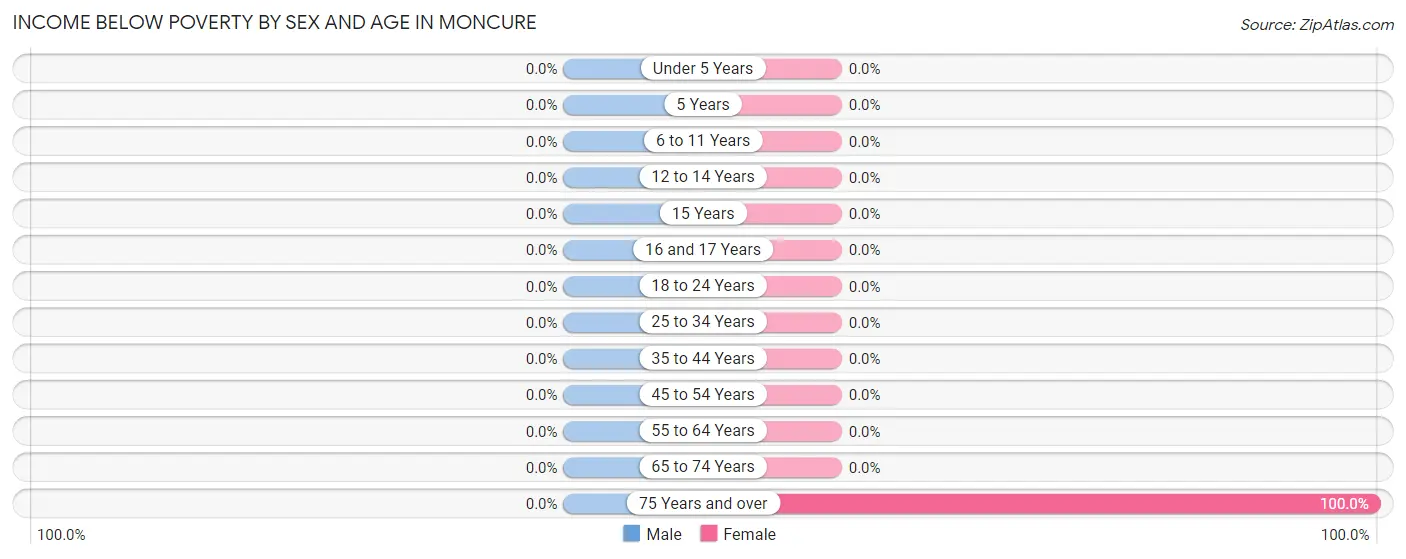
| Age Bracket | Male | Female |
| Under 5 Years | 0 (0.0%) | 0 (0.0%) |
| 5 Years | 0 (0.0%) | 0 (0.0%) |
| 6 to 11 Years | 0 (0.0%) | 0 (0.0%) |
| 12 to 14 Years | 0 (0.0%) | 0 (0.0%) |
| 15 Years | 0 (0.0%) | 0 (0.0%) |
| 16 and 17 Years | 0 (0.0%) | 0 (0.0%) |
| 18 to 24 Years | 0 (0.0%) | 0 (0.0%) |
| 25 to 34 Years | 0 (0.0%) | 0 (0.0%) |
| 35 to 44 Years | 0 (0.0%) | 0 (0.0%) |
| 45 to 54 Years | 0 (0.0%) | 0 (0.0%) |
| 55 to 64 Years | 0 (0.0%) | 0 (0.0%) |
| 65 to 74 Years | 0 (0.0%) | 0 (0.0%) |
| 75 Years and over | 0 (0.0%) | 14 (100.0%) |
| Total | 0 (0.0%) | 14 (4.1%) |
Income Above Poverty by Sex and Age in Moncure
According to the poverty statistics in Moncure, males aged 5 years and females aged 12 to 14 years are the age groups that are most secure financially, with 100.0% of males and 100.0% of females in these age groups living above the poverty line.
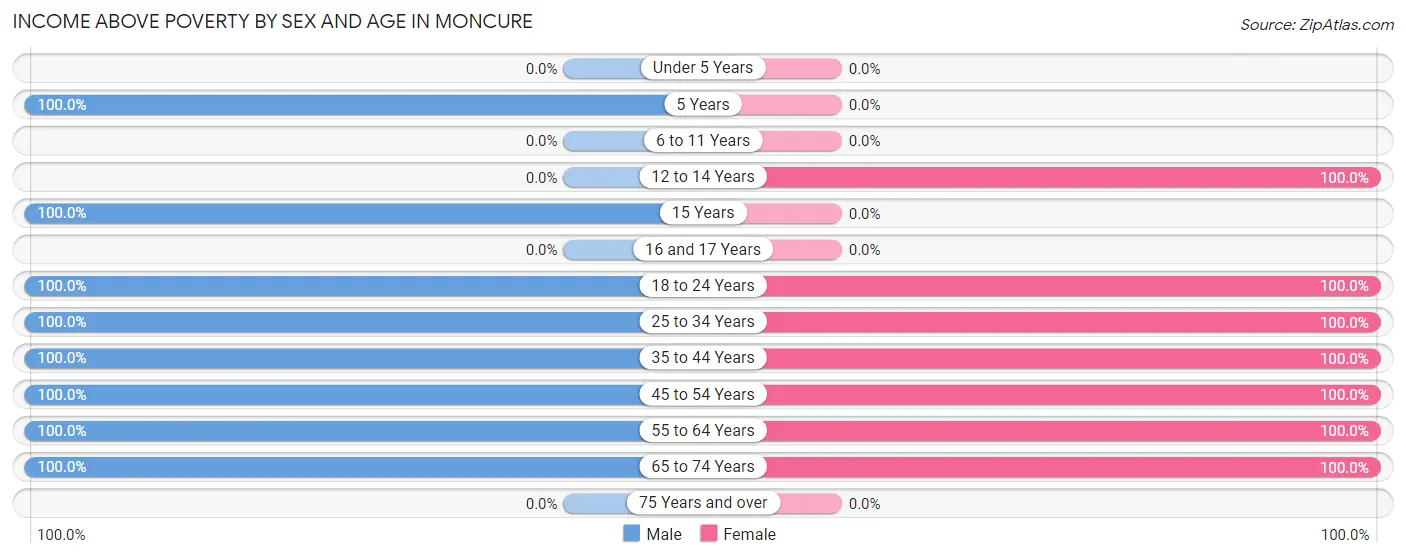
| Age Bracket | Male | Female |
| Under 5 Years | 0 (0.0%) | 0 (0.0%) |
| 5 Years | 7 (100.0%) | 0 (0.0%) |
| 6 to 11 Years | 0 (0.0%) | 0 (0.0%) |
| 12 to 14 Years | 0 (0.0%) | 70 (100.0%) |
| 15 Years | 32 (100.0%) | 0 (0.0%) |
| 16 and 17 Years | 0 (0.0%) | 0 (0.0%) |
| 18 to 24 Years | 41 (100.0%) | 29 (100.0%) |
| 25 to 34 Years | 17 (100.0%) | 7 (100.0%) |
| 35 to 44 Years | 89 (100.0%) | 45 (100.0%) |
| 45 to 54 Years | 11 (100.0%) | 31 (100.0%) |
| 55 to 64 Years | 151 (100.0%) | 141 (100.0%) |
| 65 to 74 Years | 81 (100.0%) | 9 (100.0%) |
| 75 Years and over | 0 (0.0%) | 0 (0.0%) |
| Total | 429 (100.0%) | 332 (96.0%) |
Income Below Poverty Among Married-Couple Families in Moncure
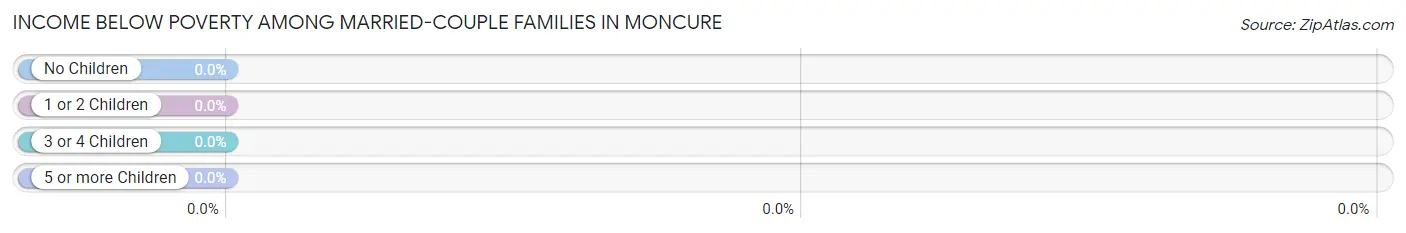
| Children | Above Poverty | Below Poverty |
| No Children | 137 (100.0%) | 0 (0.0%) |
| 1 or 2 Children | 10 (100.0%) | 0 (0.0%) |
| 3 or 4 Children | 30 (100.0%) | 0 (0.0%) |
| 5 or more Children | 0 (0.0%) | 0 (0.0%) |
| Total | 177 (100.0%) | 0 (0.0%) |
Income Below Poverty Among Single-Parent Households in Moncure
| Children | Single Father | Single Mother |
| No Children | 0 (0.0%) | 0 (0.0%) |
| 1 or 2 Children | 0 (0.0%) | 0 (0.0%) |
| 3 or 4 Children | 0 (0.0%) | 0 (0.0%) |
| 5 or more Children | 0 (0.0%) | 0 (0.0%) |
| Total | 0 (0.0%) | 0 (0.0%) |
Income Below Poverty Among Married-Couple vs Single-Parent Households in Moncure
| Children | Married-Couple Families | Single-Parent Households |
| No Children | 0 (0.0%) | 0 (0.0%) |
| 1 or 2 Children | 0 (0.0%) | 0 (0.0%) |
| 3 or 4 Children | 0 (0.0%) | 0 (0.0%) |
| 5 or more Children | 0 (0.0%) | 0 (0.0%) |
| Total | 0 (0.0%) | 0 (0.0%) |
Race in Moncure
The most populous races in Moncure are White / Caucasian (506 | 65.3%), Two or more Races (196 | 25.3%), and Hispanic or Latino (48 | 6.2%).
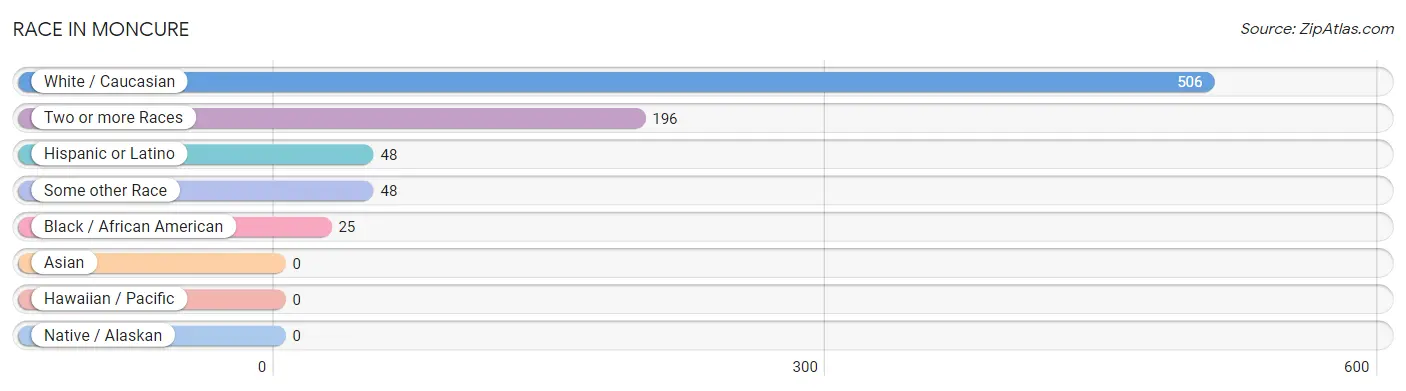
| Race | # Population | % Population |
| Asian | 0 | 0.0% |
| Black / African American | 25 | 3.2% |
| Hawaiian / Pacific | 0 | 0.0% |
| Hispanic or Latino | 48 | 6.2% |
| Native / Alaskan | 0 | 0.0% |
| White / Caucasian | 506 | 65.3% |
| Two or more Races | 196 | 25.3% |
| Some other Race | 48 | 6.2% |
| Total | 775 | 100.0% |
Ancestry in Moncure
The most populous ancestries reported in Moncure are Korean (196 | 25.3%), Irish (165 | 21.3%), Mexican (48 | 6.2%), English (34 | 4.4%), and American (23 | 3.0%), together accounting for 60.1% of all Moncure residents.
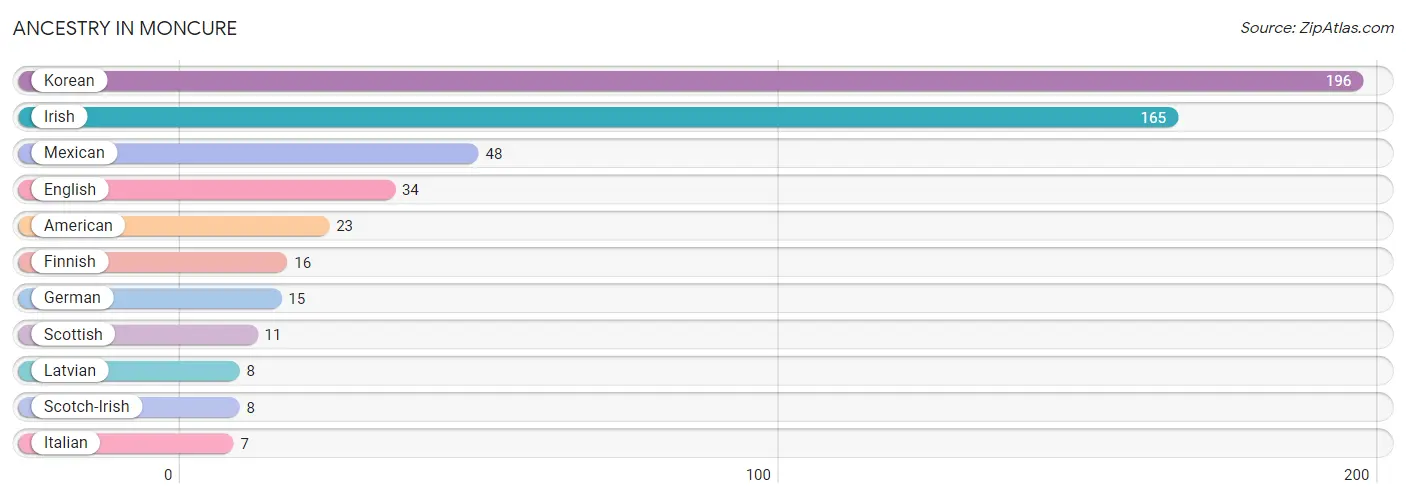
| Ancestry | # Population | % Population |
| American | 23 | 3.0% |
| English | 34 | 4.4% |
| Finnish | 16 | 2.1% |
| German | 15 | 1.9% |
| Irish | 165 | 21.3% |
| Italian | 7 | 0.9% |
| Korean | 196 | 25.3% |
| Latvian | 8 | 1.0% |
| Mexican | 48 | 6.2% |
| Scotch-Irish | 8 | 1.0% |
| Scottish | 11 | 1.4% | View All 11 Rows |
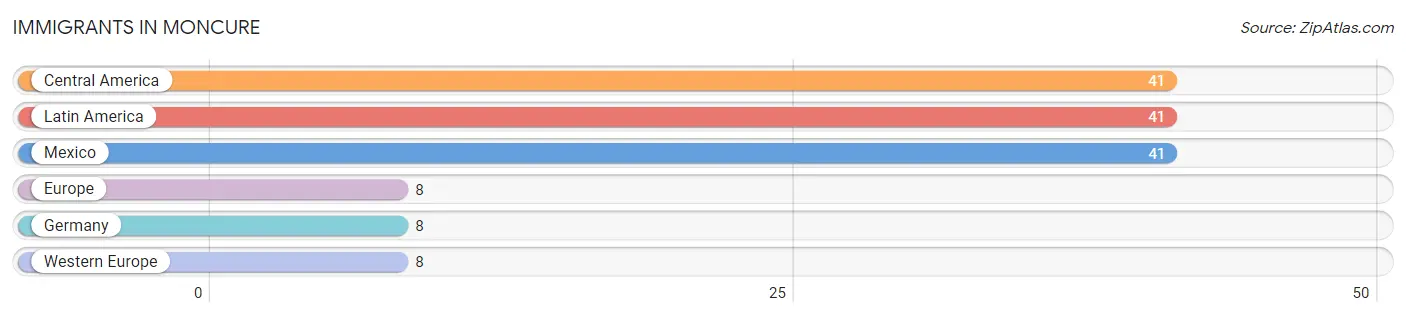
Immigrants in Moncure
The most numerous immigrant groups reported in Moncure came from Central America (41 | 5.3%), Latin America (41 | 5.3%), Mexico (41 | 5.3%), Europe (8 | 1.0%), and Germany (8 | 1.0%), together accounting for 17.9% of all Moncure residents.
| Immigration Origin | # Population | % Population |
| Central America | 41 | 5.3% |
| Europe | 8 | 1.0% |
| Germany | 8 | 1.0% |
| Latin America | 41 | 5.3% |
| Mexico | 41 | 5.3% |
| Western Europe | 8 | 1.0% | View All 6 Rows |
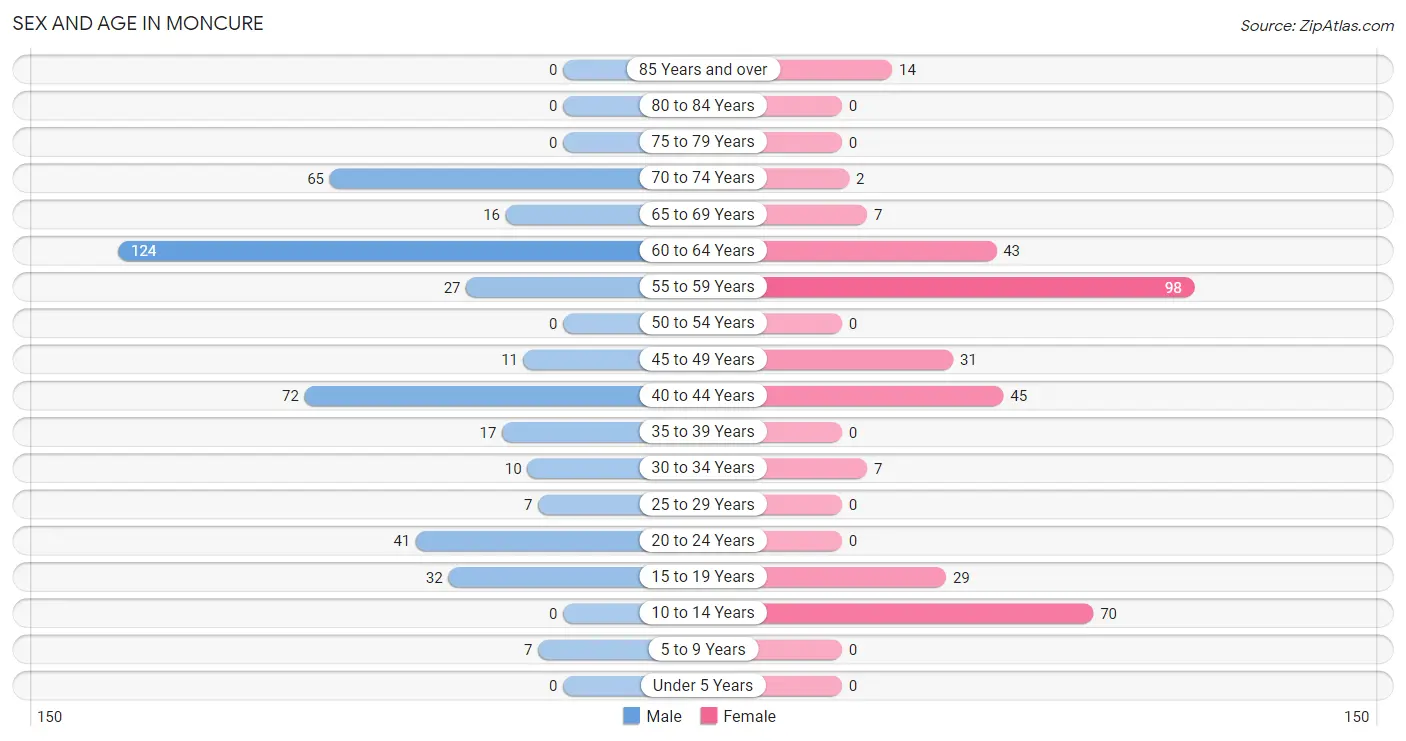
Sex and Age in Moncure
Sex and Age in Moncure
The most populous age groups in Moncure are 60 to 64 Years (124 | 28.9%) for men and 55 to 59 Years (98 | 28.3%) for women.
| Age Bracket | Male | Female |
| Under 5 Years | 0 (0.0%) | 0 (0.0%) |
| 5 to 9 Years | 7 (1.6%) | 0 (0.0%) |
| 10 to 14 Years | 0 (0.0%) | 70 (20.2%) |
| 15 to 19 Years | 32 (7.5%) | 29 (8.4%) |
| 20 to 24 Years | 41 (9.6%) | 0 (0.0%) |
| 25 to 29 Years | 7 (1.6%) | 0 (0.0%) |
| 30 to 34 Years | 10 (2.3%) | 7 (2.0%) |
| 35 to 39 Years | 17 (4.0%) | 0 (0.0%) |
| 40 to 44 Years | 72 (16.8%) | 45 (13.0%) |
| 45 to 49 Years | 11 (2.6%) | 31 (9.0%) |
| 50 to 54 Years | 0 (0.0%) | 0 (0.0%) |
| 55 to 59 Years | 27 (6.3%) | 98 (28.3%) |
| 60 to 64 Years | 124 (28.9%) | 43 (12.4%) |
| 65 to 69 Years | 16 (3.7%) | 7 (2.0%) |
| 70 to 74 Years | 65 (15.1%) | 2 (0.6%) |
| 75 to 79 Years | 0 (0.0%) | 0 (0.0%) |
| 80 to 84 Years | 0 (0.0%) | 0 (0.0%) |
| 85 Years and over | 0 (0.0%) | 14 (4.1%) |
| Total | 429 (100.0%) | 346 (100.0%) |
Families and Households in Moncure
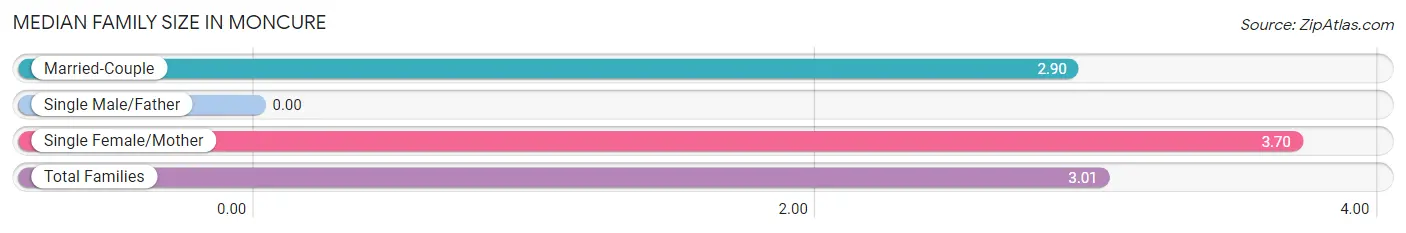
Median Family Size in Moncure
| Family Type | # Families | Family Size |
| Married-Couple | 177 (85.5%) | 2.90 |
| Single Male/Father | 0 (0.0%) | - |
| Single Female/Mother | 30 (14.5%) | 3.70 |
| Total Families | 207 (100.0%) | 3.01 |
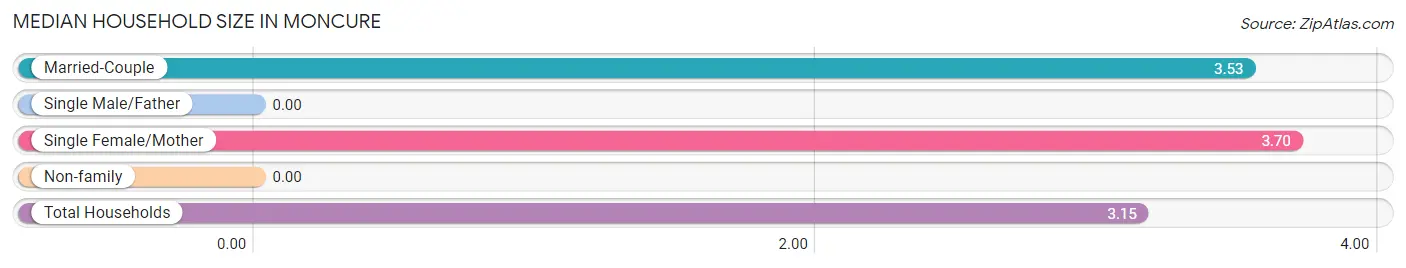
Median Household Size in Moncure
| Household Type | # Households | Household Size |
| Married-Couple | 177 (72.0%) | 3.53 |
| Single Male/Father | 0 (0.0%) | - |
| Single Female/Mother | 30 (12.2%) | 3.70 |
| Non-family | 39 (15.9%) | - |
| Total Households | 246 (100.0%) | 3.15 |
Household Size by Marriage Status in Moncure
Out of a total of 246 households in Moncure, 207 (84.2%) are family households, while 39 (15.9%) are nonfamily households. The most numerous type of family households are 3-person households, comprising 97, and the most common type of nonfamily households are 1-person households, comprising 39.
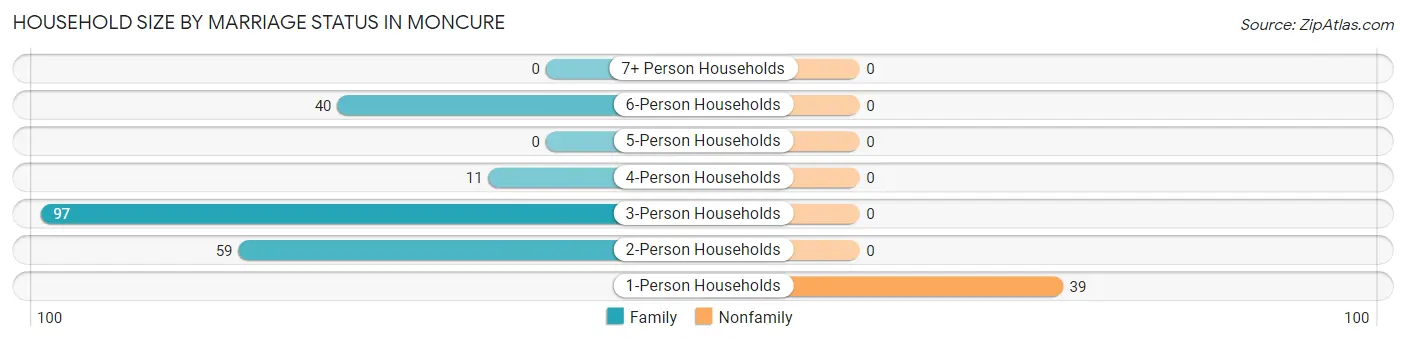
| Household Size | Family Households | Nonfamily Households |
| 1-Person Households | - | 39 (15.9%) |
| 2-Person Households | 59 (24.0%) | 0 (0.0%) |
| 3-Person Households | 97 (39.4%) | 0 (0.0%) |
| 4-Person Households | 11 (4.5%) | 0 (0.0%) |
| 5-Person Households | 0 (0.0%) | 0 (0.0%) |
| 6-Person Households | 40 (16.3%) | 0 (0.0%) |
| 7+ Person Households | 0 (0.0%) | 0 (0.0%) |
| Total | 207 (84.2%) | 39 (15.9%) |
Female Fertility in Moncure
Fertility by Age in Moncure
| Age Bracket | Women with Births | Births / 1,000 Women |
| 15 to 19 years | 0 (0.0%) | 0.0 |
| 20 to 34 years | 0 (0.0%) | 0.0 |
| 35 to 50 years | 0 (0.0%) | 0.0 |
| Total | 0 (0.0%) | 0.0 |
Fertility by Age by Marriage Status in Moncure
| Age Bracket | Married | Unmarried |
| 15 to 19 years | 0 (0.0%) | 0 (0.0%) |
| 20 to 34 years | 0 (0.0%) | 0 (0.0%) |
| 35 to 50 years | 0 (0.0%) | 0 (0.0%) |
| Total | 0 (0.0%) | 0 (0.0%) |
Fertility by Education in Moncure
| Educational Attainment | Women with Births | Births / 1,000 Women |
| Less than High School | 0 (0.0%) | 0.0 |
| High School Diploma | 0 (0.0%) | 0.0 |
| College or Associate's Degree | 0 (0.0%) | 0.0 |
| Bachelor's Degree | 0 (0.0%) | 0.0 |
| Graduate Degree | 0 (0.0%) | 0.0 |
| Total | 0 (0.0%) | 0.0 |
Fertility by Education by Marriage Status in Moncure
| Educational Attainment | Married | Unmarried |
| Less than High School | 0 (0.0%) | 0 (0.0%) |
| High School Diploma | 0 (0.0%) | 0 (0.0%) |
| College or Associate's Degree | 0 (0.0%) | 0 (0.0%) |
| Bachelor's Degree | 0 (0.0%) | 0 (0.0%) |
| Graduate Degree | 0 (0.0%) | 0 (0.0%) |
| Total | 0 (0.0%) | 0 (0.0%) |
Employment Characteristics in Moncure
Employment by Class of Employer in Moncure
Among the 379 employed individuals in Moncure, private company employees (330 | 87.1%), not-for-profit organizations (25 | 6.6%), and self-employed (not incorporated) (24 | 6.3%) make up the most common classes of employment.
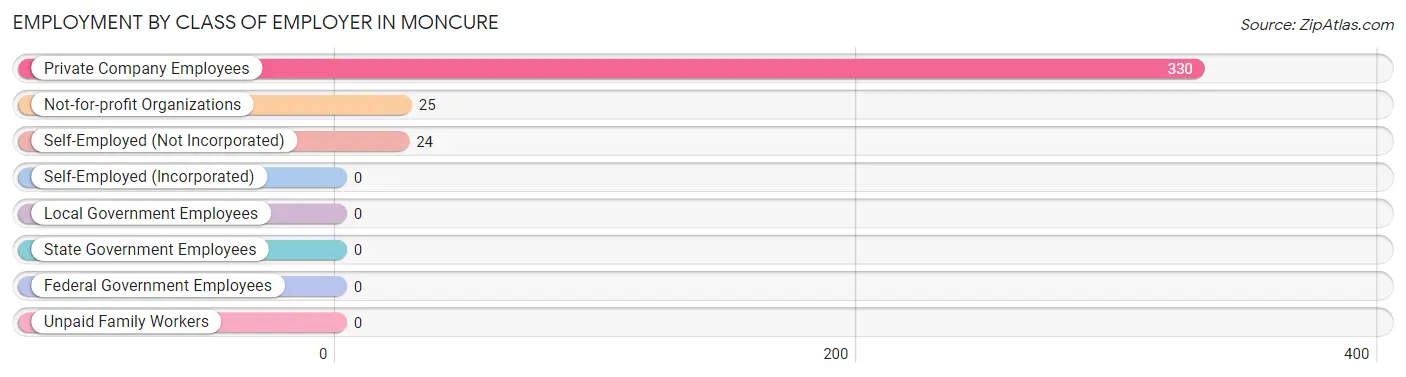
| Employer Class | # Employees | % Employees |
| Private Company Employees | 330 | 87.1% |
| Self-Employed (Incorporated) | 0 | 0.0% |
| Self-Employed (Not Incorporated) | 24 | 6.3% |
| Not-for-profit Organizations | 25 | 6.6% |
| Local Government Employees | 0 | 0.0% |
| State Government Employees | 0 | 0.0% |
| Federal Government Employees | 0 | 0.0% |
| Unpaid Family Workers | 0 | 0.0% |
| Total | 379 | 100.0% |
Employment Status by Age in Moncure
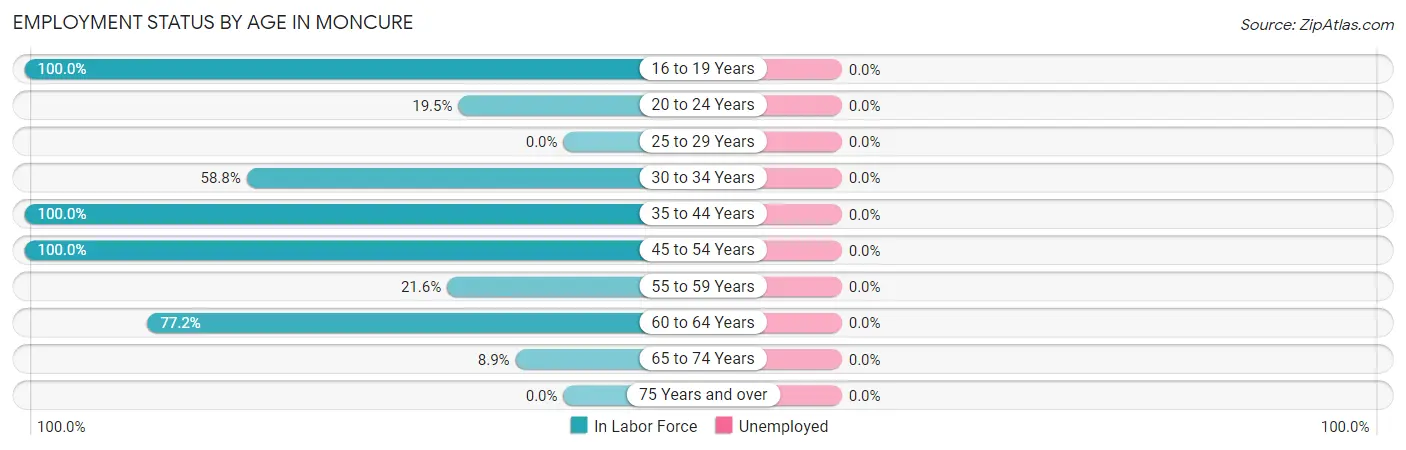
| Age Bracket | In Labor Force | Unemployed |
| 16 to 19 Years | 29 (100.0%) | 0 (0.0%) |
| 20 to 24 Years | 8 (19.5%) | 0 (0.0%) |
| 25 to 29 Years | 0 (0.0%) | 0 (0.0%) |
| 30 to 34 Years | 10 (58.8%) | 0 (0.0%) |
| 35 to 44 Years | 134 (100.0%) | 0 (0.0%) |
| 45 to 54 Years | 42 (100.0%) | 0 (0.0%) |
| 55 to 59 Years | 27 (21.6%) | 0 (0.0%) |
| 60 to 64 Years | 129 (77.2%) | 0 (0.0%) |
| 65 to 74 Years | 8 (8.9%) | 0 (0.0%) |
| 75 Years and over | 0 (0.0%) | 0 (0.0%) |
| Total | 387 (58.1%) | 0 (0.0%) |
Employment Status by Educational Attainment in Moncure
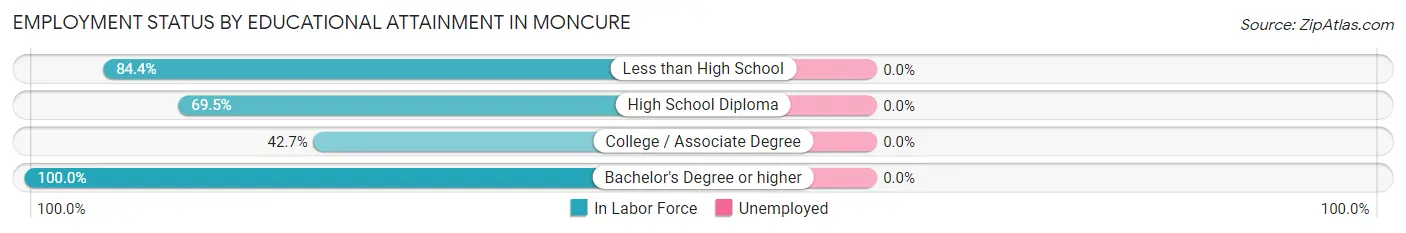
| Educational Attainment | In Labor Force | Unemployed |
| Less than High School | 141 (84.4%) | 0 (0.0%) |
| High School Diploma | 41 (69.5%) | 0 (0.0%) |
| College / Associate Degree | 79 (42.7%) | 0 (0.0%) |
| Bachelor's Degree or higher | 81 (100.0%) | 0 (0.0%) |
| Total | 342 (69.5%) | 0 (0.0%) |
Employment Occupations by Sex in Moncure
Management, Business, Science and Arts Occupations
The most common Management, Business, Science and Arts occupations in Moncure are Business & Financial (80 | 20.7%), Health Diagnosing & Treating (41 | 10.6%), and Management (6 | 1.5%).
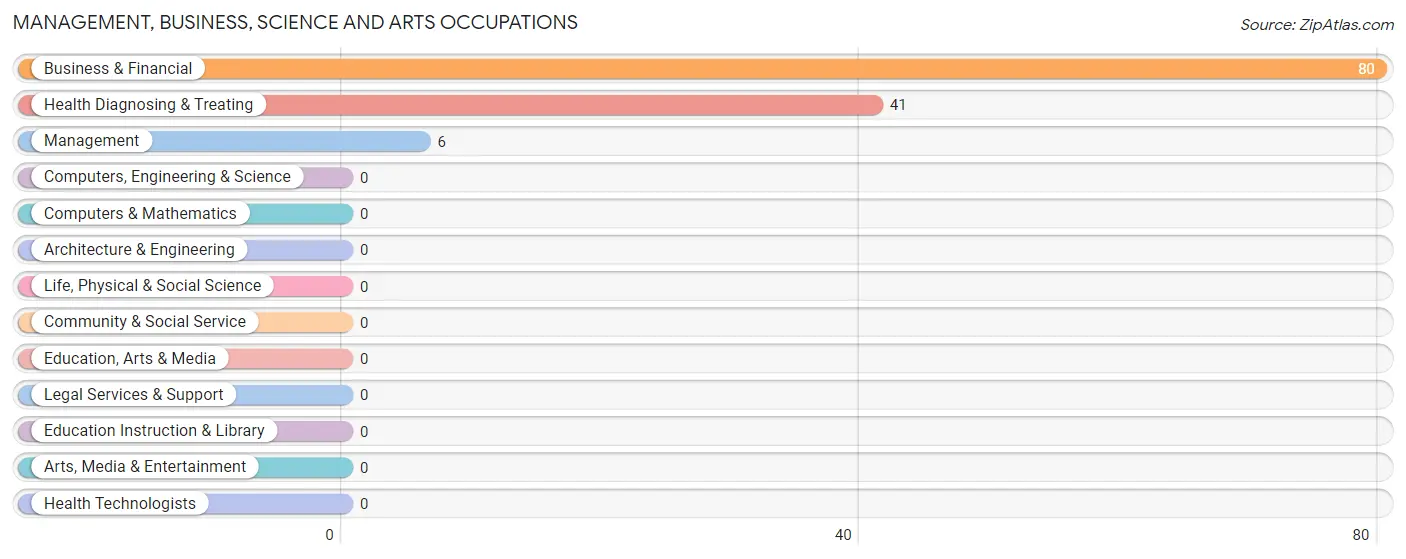
Management, Business, Science and Arts Occupations by Sex
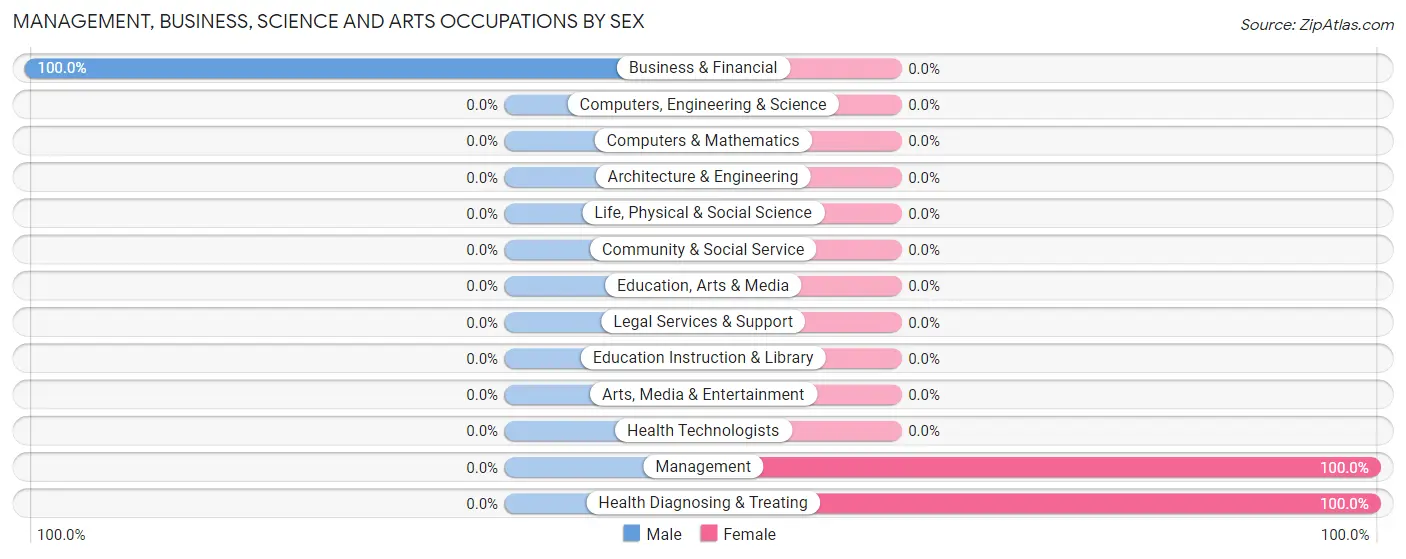
| Occupation | Male | Female |
| Management | 0 (0.0%) | 6 (100.0%) |
| Business & Financial | 80 (100.0%) | 0 (0.0%) |
| Computers, Engineering & Science | 0 (0.0%) | 0 (0.0%) |
| Computers & Mathematics | 0 (0.0%) | 0 (0.0%) |
| Architecture & Engineering | 0 (0.0%) | 0 (0.0%) |
| Life, Physical & Social Science | 0 (0.0%) | 0 (0.0%) |
| Community & Social Service | 0 (0.0%) | 0 (0.0%) |
| Education, Arts & Media | 0 (0.0%) | 0 (0.0%) |
| Legal Services & Support | 0 (0.0%) | 0 (0.0%) |
| Education Instruction & Library | 0 (0.0%) | 0 (0.0%) |
| Arts, Media & Entertainment | 0 (0.0%) | 0 (0.0%) |
| Health Diagnosing & Treating | 0 (0.0%) | 41 (100.0%) |
| Health Technologists | 0 (0.0%) | 0 (0.0%) |
| Total (Category) | 80 (63.0%) | 47 (37.0%) |
| Total (Overall) | 265 (68.5%) | 122 (31.5%) |
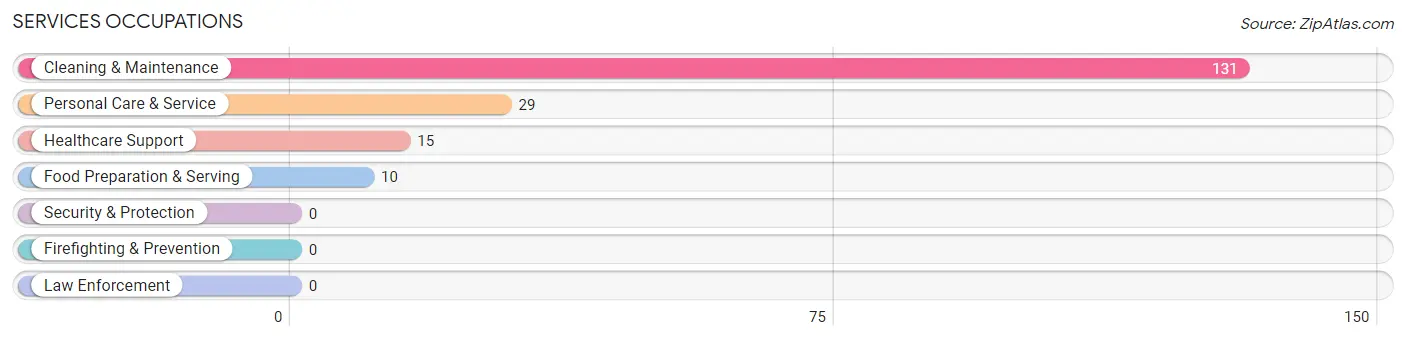
Services Occupations
The most common Services occupations in Moncure are Cleaning & Maintenance (131 | 33.9%), Personal Care & Service (29 | 7.5%), Healthcare Support (15 | 3.9%), and Food Preparation & Serving (10 | 2.6%).
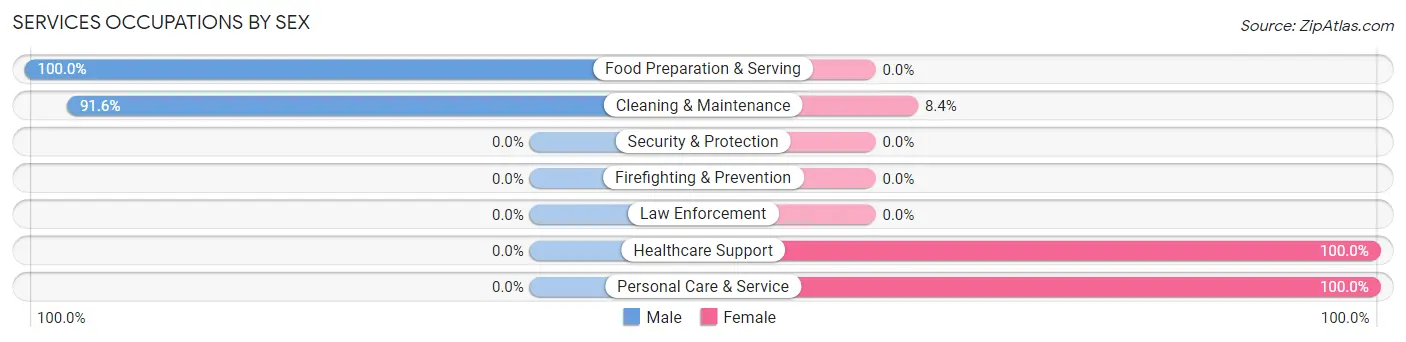
Services Occupations by Sex
Within the Services occupations in Moncure, the most male-oriented occupations are Food Preparation & Serving (100.0%), and Cleaning & Maintenance (91.6%), while the most female-oriented occupations are Healthcare Support (100.0%), Personal Care & Service (100.0%), and Cleaning & Maintenance (8.4%).
| Occupation | Male | Female |
| Healthcare Support | 0 (0.0%) | 15 (100.0%) |
| Security & Protection | 0 (0.0%) | 0 (0.0%) |
| Firefighting & Prevention | 0 (0.0%) | 0 (0.0%) |
| Law Enforcement | 0 (0.0%) | 0 (0.0%) |
| Food Preparation & Serving | 10 (100.0%) | 0 (0.0%) |
| Cleaning & Maintenance | 120 (91.6%) | 11 (8.4%) |
| Personal Care & Service | 0 (0.0%) | 29 (100.0%) |
| Total (Category) | 130 (70.3%) | 55 (29.7%) |
| Total (Overall) | 265 (68.5%) | 122 (31.5%) |
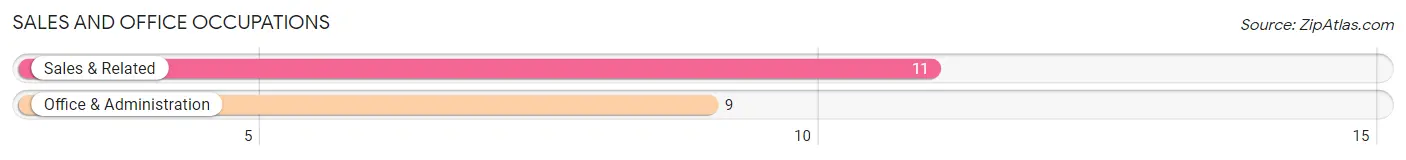
Sales and Office Occupations
The most common Sales and Office occupations in Moncure are Sales & Related (11 | 2.8%), and Office & Administration (9 | 2.3%).
Sales and Office Occupations by Sex
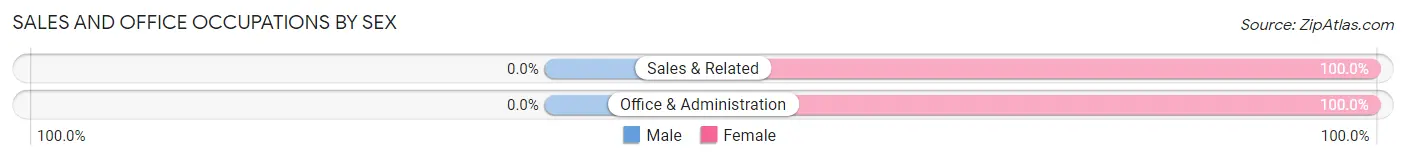
| Occupation | Male | Female |
| Sales & Related | 0 (0.0%) | 11 (100.0%) |
| Office & Administration | 0 (0.0%) | 9 (100.0%) |
| Total (Category) | 0 (0.0%) | 20 (100.0%) |
| Total (Overall) | 265 (68.5%) | 122 (31.5%) |
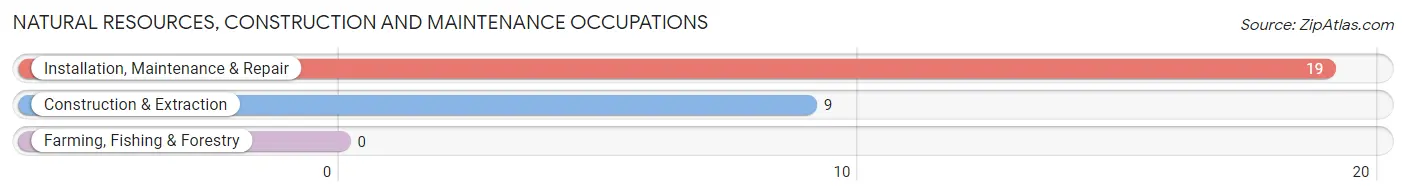
Natural Resources, Construction and Maintenance Occupations
The most common Natural Resources, Construction and Maintenance occupations in Moncure are Installation, Maintenance & Repair (19 | 4.9%), and Construction & Extraction (9 | 2.3%).
Natural Resources, Construction and Maintenance Occupations by Sex
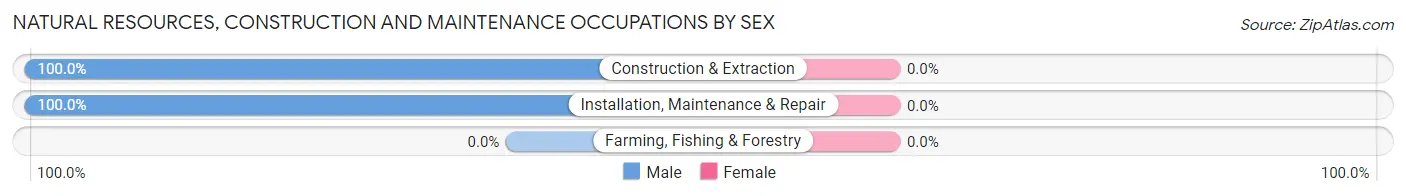
| Occupation | Male | Female |
| Farming, Fishing & Forestry | 0 (0.0%) | 0 (0.0%) |
| Construction & Extraction | 9 (100.0%) | 0 (0.0%) |
| Installation, Maintenance & Repair | 19 (100.0%) | 0 (0.0%) |
| Total (Category) | 28 (100.0%) | 0 (0.0%) |
| Total (Overall) | 265 (68.5%) | 122 (31.5%) |
Production, Transportation and Moving Occupations
The most common Production, Transportation and Moving occupations in Moncure are Material Moving (18 | 4.6%), and Transportation (9 | 2.3%).
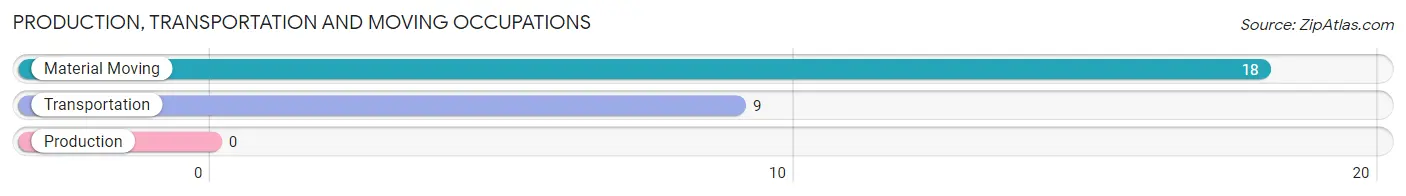
Production, Transportation and Moving Occupations by Sex
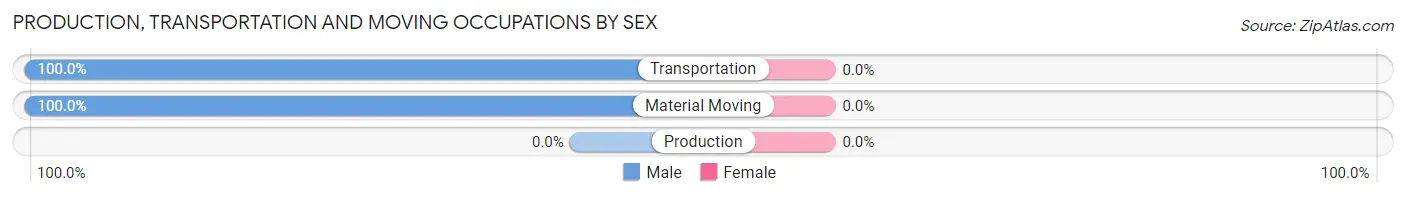
| Occupation | Male | Female |
| Production | 0 (0.0%) | 0 (0.0%) |
| Transportation | 9 (100.0%) | 0 (0.0%) |
| Material Moving | 18 (100.0%) | 0 (0.0%) |
| Total (Category) | 27 (100.0%) | 0 (0.0%) |
| Total (Overall) | 265 (68.5%) | 122 (31.5%) |
Employment Industries by Sex in Moncure
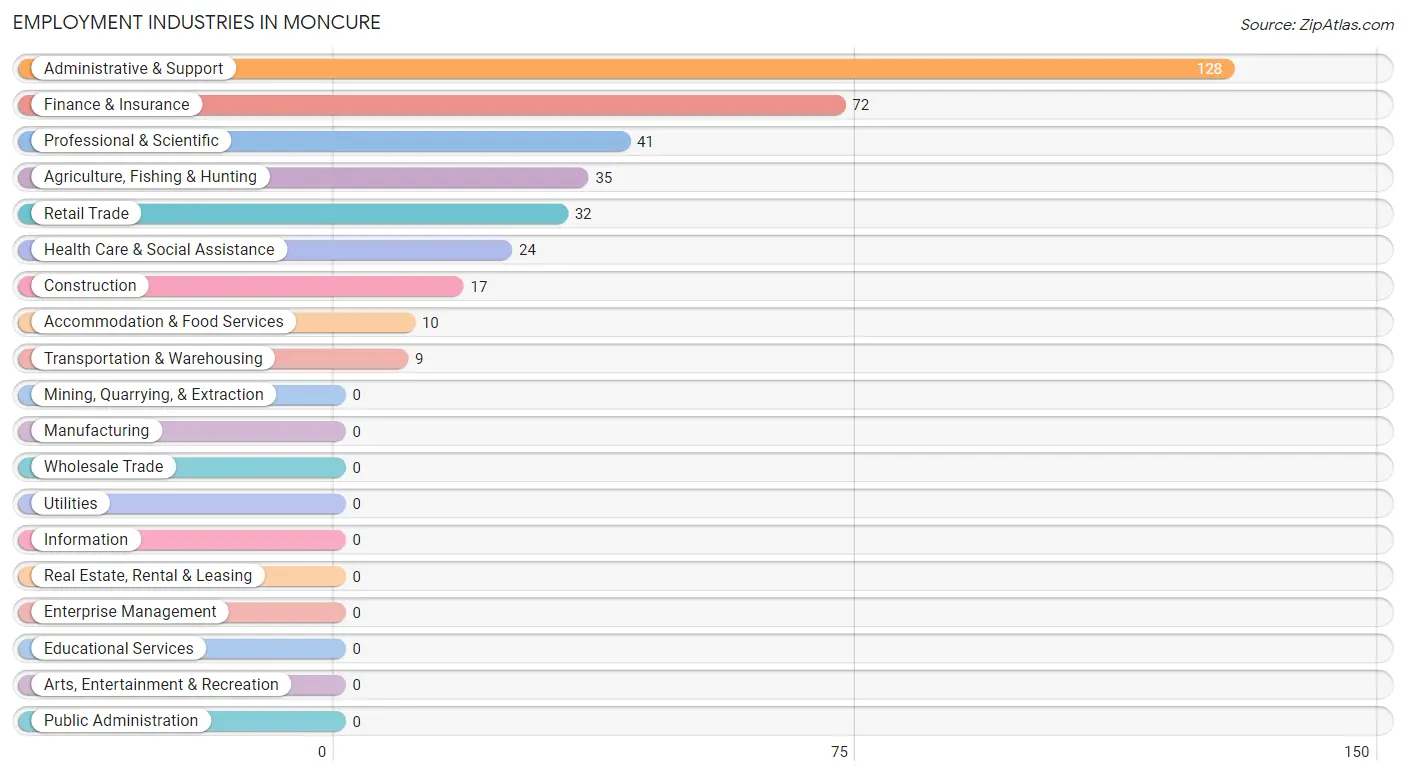
Employment Industries in Moncure
The major employment industries in Moncure include Administrative & Support (128 | 33.1%), Finance & Insurance (72 | 18.6%), Professional & Scientific (41 | 10.6%), Agriculture, Fishing & Hunting (35 | 9.0%), and Retail Trade (32 | 8.3%).
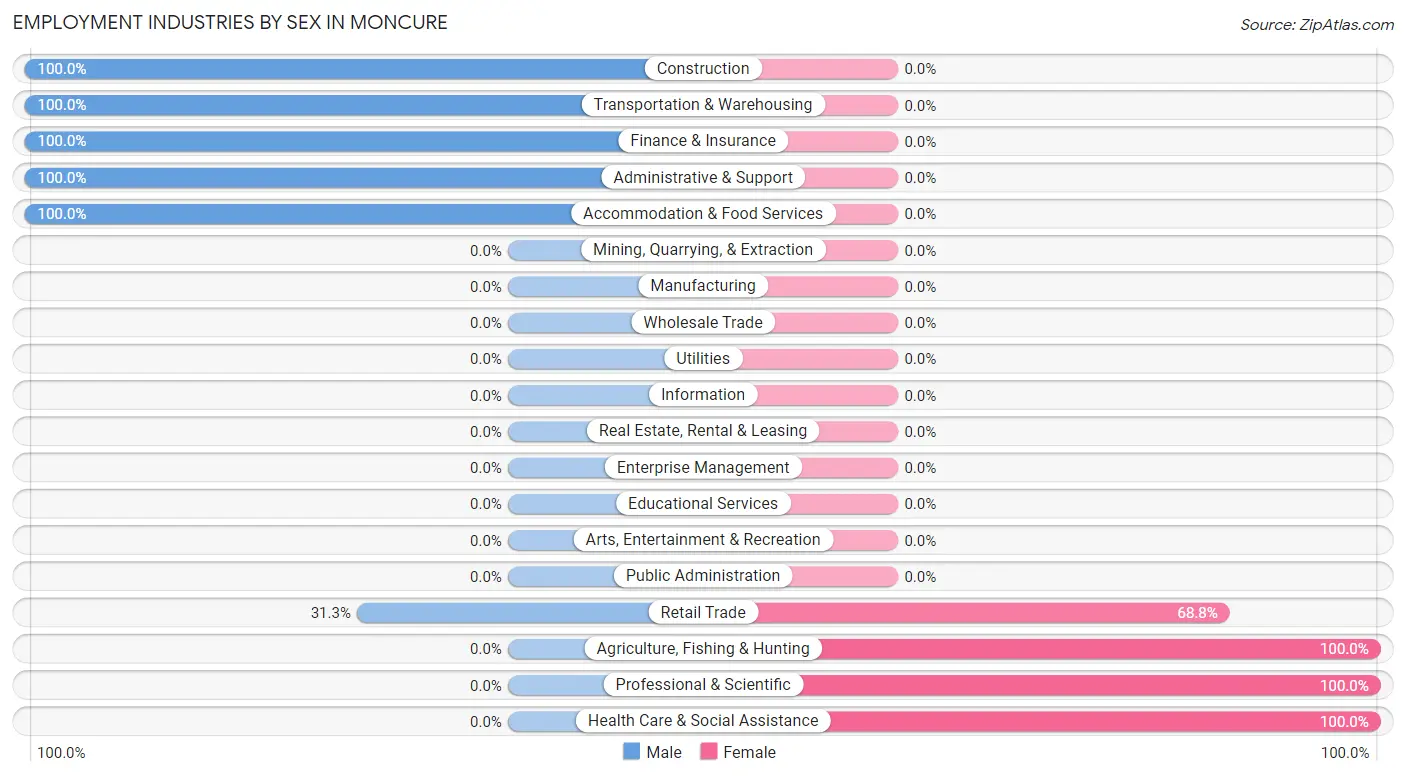
Employment Industries by Sex in Moncure
The Moncure industries that see more men than women are Construction (100.0%), Transportation & Warehousing (100.0%), and Finance & Insurance (100.0%), whereas the industries that tend to have a higher number of women are Agriculture, Fishing & Hunting (100.0%), Professional & Scientific (100.0%), and Health Care & Social Assistance (100.0%).
| Industry | Male | Female |
| Agriculture, Fishing & Hunting | 0 (0.0%) | 35 (100.0%) |
| Mining, Quarrying, & Extraction | 0 (0.0%) | 0 (0.0%) |
| Construction | 17 (100.0%) | 0 (0.0%) |
| Manufacturing | 0 (0.0%) | 0 (0.0%) |
| Wholesale Trade | 0 (0.0%) | 0 (0.0%) |
| Retail Trade | 10 (31.2%) | 22 (68.8%) |
| Transportation & Warehousing | 9 (100.0%) | 0 (0.0%) |
| Utilities | 0 (0.0%) | 0 (0.0%) |
| Information | 0 (0.0%) | 0 (0.0%) |
| Finance & Insurance | 72 (100.0%) | 0 (0.0%) |
| Real Estate, Rental & Leasing | 0 (0.0%) | 0 (0.0%) |
| Professional & Scientific | 0 (0.0%) | 41 (100.0%) |
| Enterprise Management | 0 (0.0%) | 0 (0.0%) |
| Administrative & Support | 128 (100.0%) | 0 (0.0%) |
| Educational Services | 0 (0.0%) | 0 (0.0%) |
| Health Care & Social Assistance | 0 (0.0%) | 24 (100.0%) |
| Arts, Entertainment & Recreation | 0 (0.0%) | 0 (0.0%) |
| Accommodation & Food Services | 10 (100.0%) | 0 (0.0%) |
| Public Administration | 0 (0.0%) | 0 (0.0%) |
| Total | 265 (68.5%) | 122 (31.5%) |
Education in Moncure
School Enrollment in Moncure
The most common levels of schooling among the 155 students in Moncure are middle school (70 | 45.2%), college / undergraduate (46 | 29.7%), and high school (32 | 20.6%).
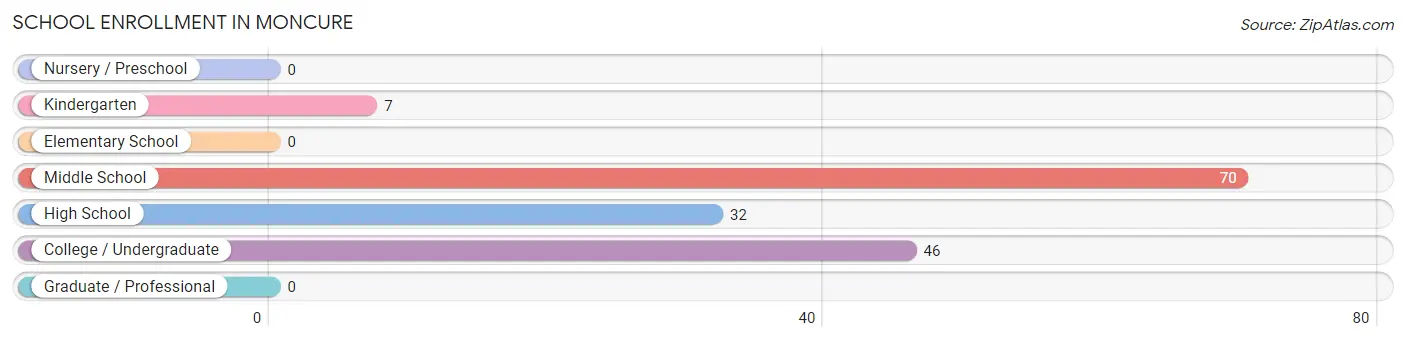
| School Level | # Students | % Students |
| Nursery / Preschool | 0 | 0.0% |
| Kindergarten | 7 | 4.5% |
| Elementary School | 0 | 0.0% |
| Middle School | 70 | 45.2% |
| High School | 32 | 20.6% |
| College / Undergraduate | 46 | 29.7% |
| Graduate / Professional | 0 | 0.0% |
| Total | 155 | 100.0% |
School Enrollment by Age by Funding Source in Moncure
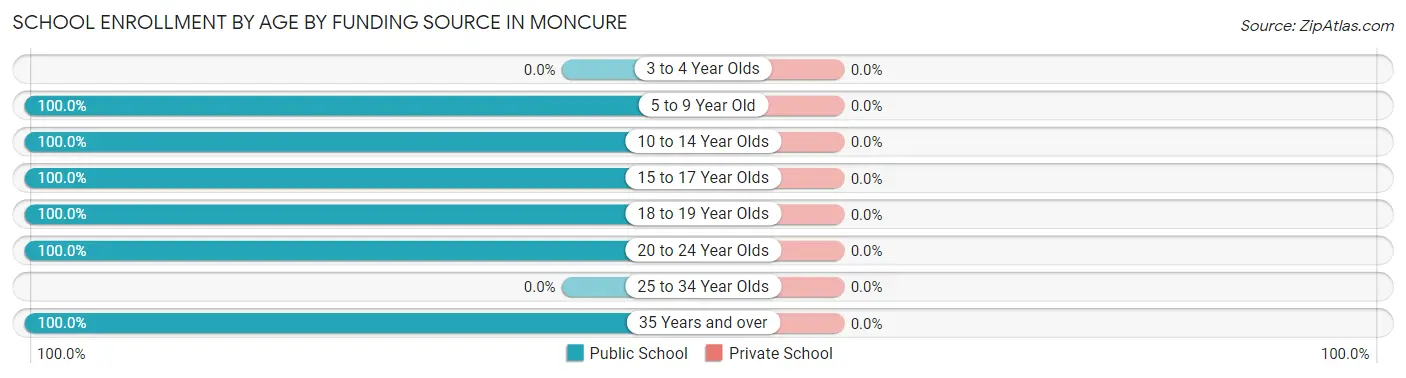
| Age Bracket | Public School | Private School |
| 3 to 4 Year Olds | 0 (0.0%) | 0 (0.0%) |
| 5 to 9 Year Old | 7 (100.0%) | 0 (0.0%) |
| 10 to 14 Year Olds | 70 (100.0%) | 0 (0.0%) |
| 15 to 17 Year Olds | 32 (100.0%) | 0 (0.0%) |
| 18 to 19 Year Olds | 29 (100.0%) | 0 (0.0%) |
| 20 to 24 Year Olds | 8 (100.0%) | 0 (0.0%) |
| 25 to 34 Year Olds | 0 (0.0%) | 0 (0.0%) |
| 35 Years and over | 9 (100.0%) | 0 (0.0%) |
| Total | 155 (100.0%) | 0 (0.0%) |
Educational Attainment by Field of Study in Moncure
, and business (83 | 100.0%) are the most common fields of study among 83 individuals in Moncure who have obtained a bachelor's degree or higher.
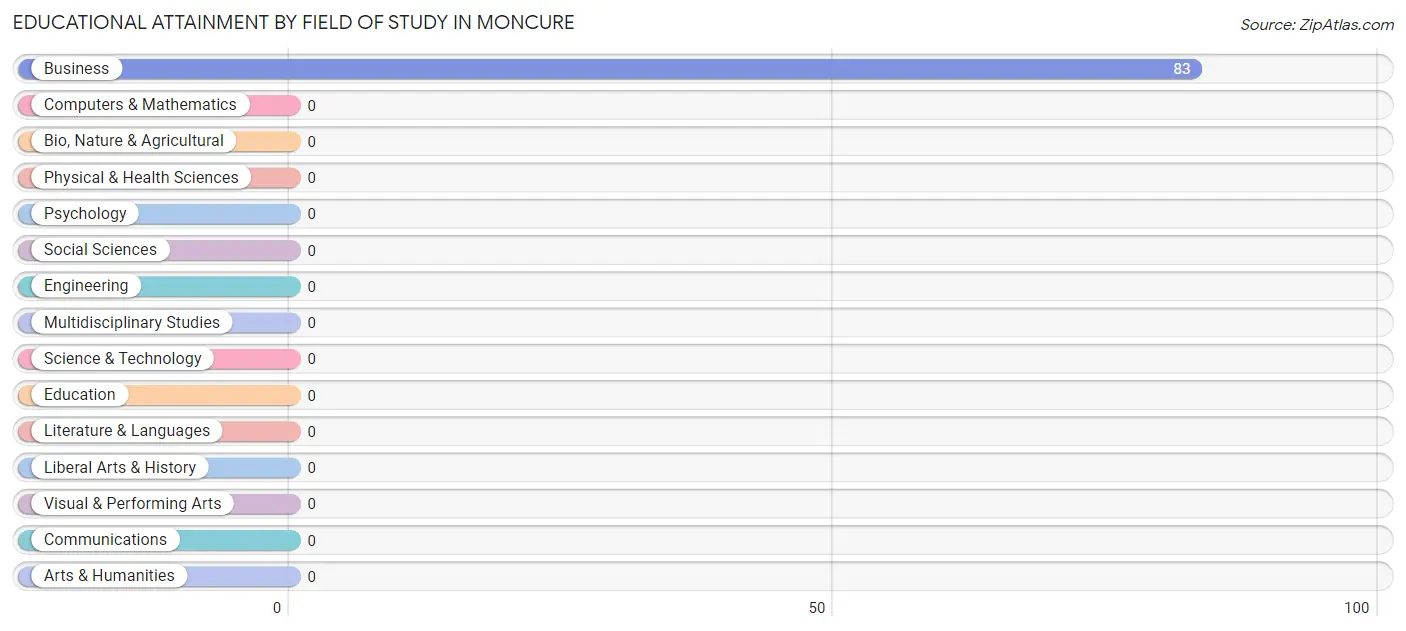
| Field of Study | # Graduates | % Graduates |
| Computers & Mathematics | 0 | 0.0% |
| Bio, Nature & Agricultural | 0 | 0.0% |
| Physical & Health Sciences | 0 | 0.0% |
| Psychology | 0 | 0.0% |
| Social Sciences | 0 | 0.0% |
| Engineering | 0 | 0.0% |
| Multidisciplinary Studies | 0 | 0.0% |
| Science & Technology | 0 | 0.0% |
| Business | 83 | 100.0% |
| Education | 0 | 0.0% |
| Literature & Languages | 0 | 0.0% |
| Liberal Arts & History | 0 | 0.0% |
| Visual & Performing Arts | 0 | 0.0% |
| Communications | 0 | 0.0% |
| Arts & Humanities | 0 | 0.0% |
| Total | 83 | 100.0% |
Transportation & Commute in Moncure
Vehicle Availability by Sex in Moncure
The most prevalent vehicle ownership categories in Moncure are males with 2 vehicles (158, accounting for 61.5%) and females with 2 vehicles (26, making up 129.5%).
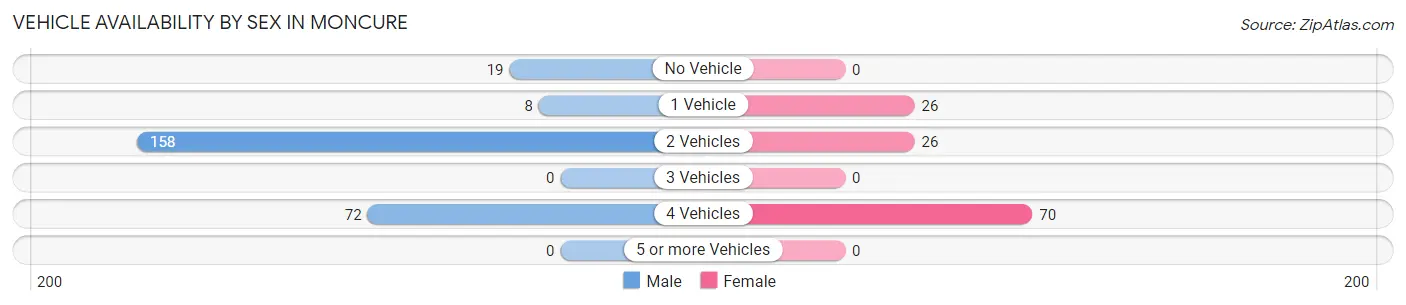
| Vehicles Available | Male | Female |
| No Vehicle | 19 (7.4%) | 0 (0.0%) |
| 1 Vehicle | 8 (3.1%) | 26 (21.3%) |
| 2 Vehicles | 158 (61.5%) | 26 (21.3%) |
| 3 Vehicles | 0 (0.0%) | 0 (0.0%) |
| 4 Vehicles | 72 (28.0%) | 70 (57.4%) |
| 5 or more Vehicles | 0 (0.0%) | 0 (0.0%) |
| Total | 257 (100.0%) | 122 (100.0%) |
Commute Time in Moncure
The most frequently occuring commute durations in Moncure are 30 to 34 minutes (158 commuters, 41.7%), 45 to 59 minutes (121 commuters, 31.9%), and 35 to 39 minutes (25 commuters, 6.6%).
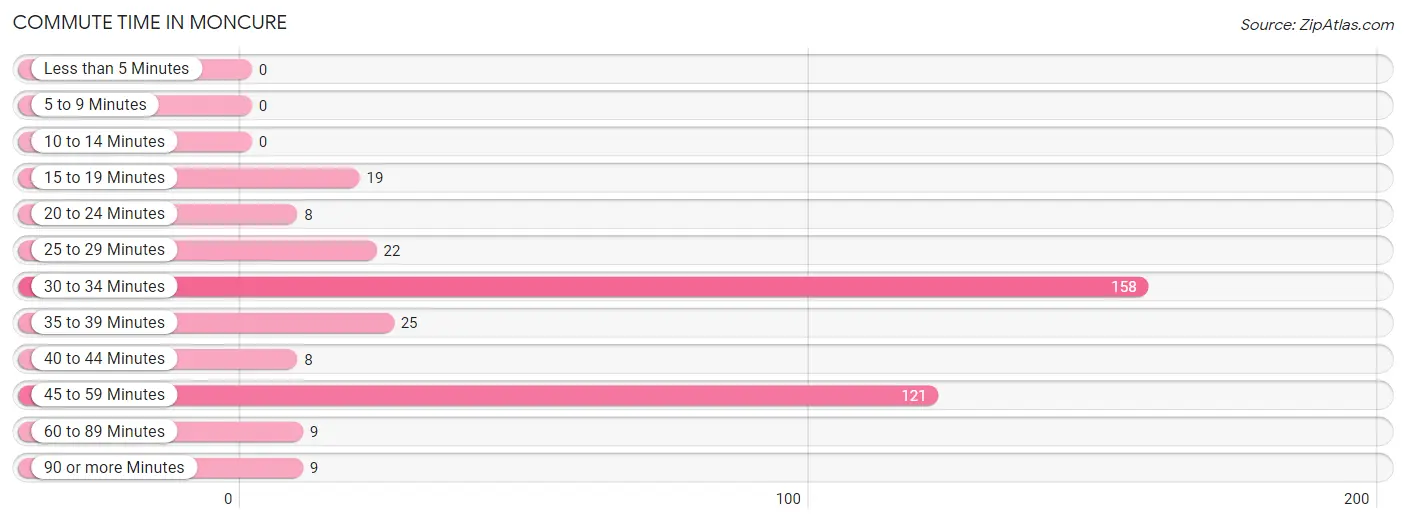
| Commute Time | # Commuters | % Commuters |
| Less than 5 Minutes | 0 | 0.0% |
| 5 to 9 Minutes | 0 | 0.0% |
| 10 to 14 Minutes | 0 | 0.0% |
| 15 to 19 Minutes | 19 | 5.0% |
| 20 to 24 Minutes | 8 | 2.1% |
| 25 to 29 Minutes | 22 | 5.8% |
| 30 to 34 Minutes | 158 | 41.7% |
| 35 to 39 Minutes | 25 | 6.6% |
| 40 to 44 Minutes | 8 | 2.1% |
| 45 to 59 Minutes | 121 | 31.9% |
| 60 to 89 Minutes | 9 | 2.4% |
| 90 or more Minutes | 9 | 2.4% |
Commute Time by Sex in Moncure
The most common commute times in Moncure are 30 to 34 minutes (112 commuters, 43.6%) for males and 30 to 34 minutes (46 commuters, 37.7%) for females.
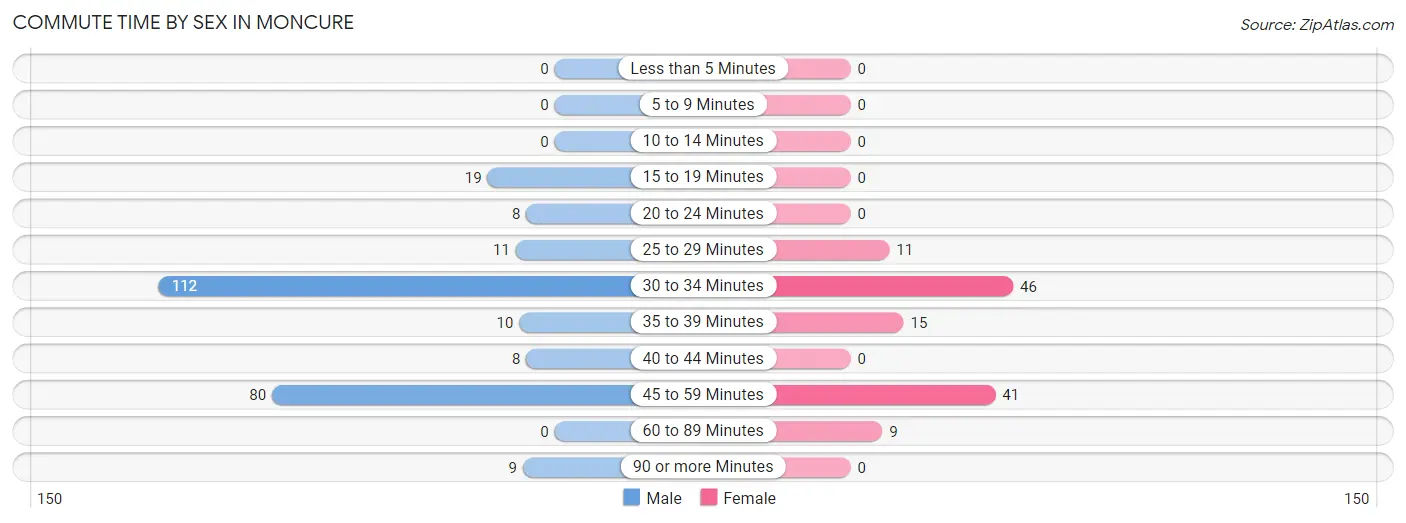
| Commute Time | Male | Female |
| Less than 5 Minutes | 0 (0.0%) | 0 (0.0%) |
| 5 to 9 Minutes | 0 (0.0%) | 0 (0.0%) |
| 10 to 14 Minutes | 0 (0.0%) | 0 (0.0%) |
| 15 to 19 Minutes | 19 (7.4%) | 0 (0.0%) |
| 20 to 24 Minutes | 8 (3.1%) | 0 (0.0%) |
| 25 to 29 Minutes | 11 (4.3%) | 11 (9.0%) |
| 30 to 34 Minutes | 112 (43.6%) | 46 (37.7%) |
| 35 to 39 Minutes | 10 (3.9%) | 15 (12.3%) |
| 40 to 44 Minutes | 8 (3.1%) | 0 (0.0%) |
| 45 to 59 Minutes | 80 (31.1%) | 41 (33.6%) |
| 60 to 89 Minutes | 0 (0.0%) | 9 (7.4%) |
| 90 or more Minutes | 9 (3.5%) | 0 (0.0%) |
Time of Departure to Work by Sex in Moncure
The most frequent times of departure to work in Moncure are 12:00 AM to 4:59 AM (121, 47.1%) for males and 8:00 AM to 8:29 AM (30, 24.6%) for females.
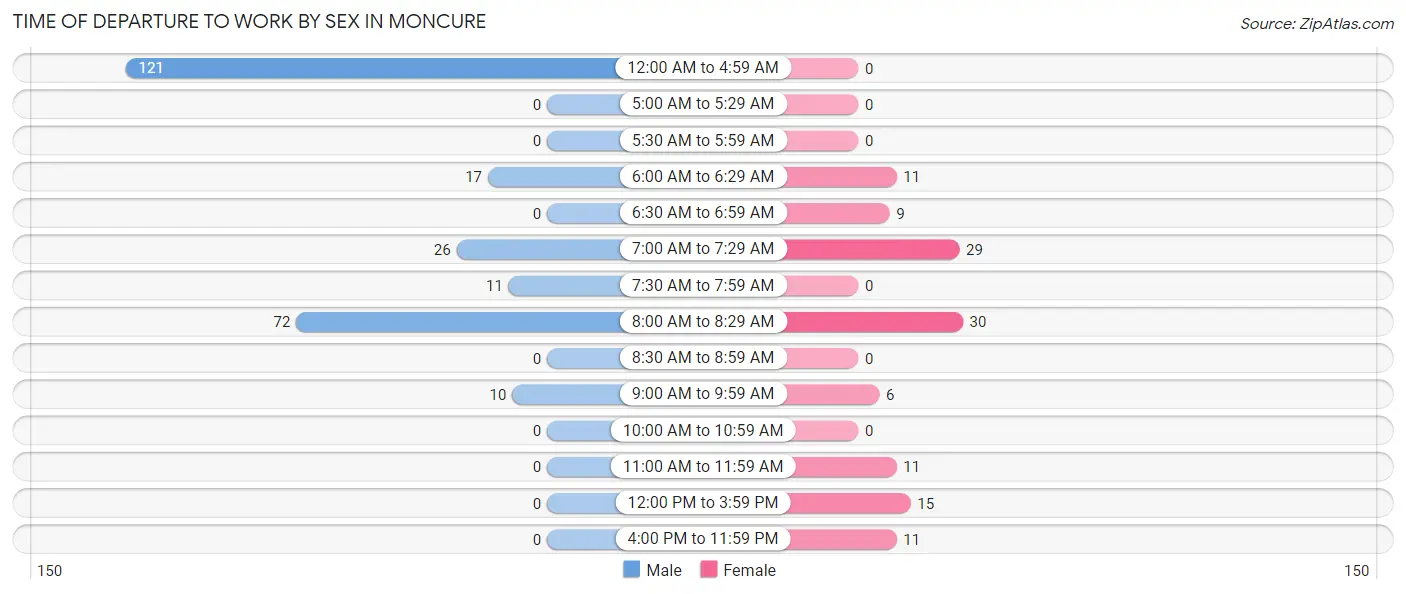
| Time of Departure | Male | Female |
| 12:00 AM to 4:59 AM | 121 (47.1%) | 0 (0.0%) |
| 5:00 AM to 5:29 AM | 0 (0.0%) | 0 (0.0%) |
| 5:30 AM to 5:59 AM | 0 (0.0%) | 0 (0.0%) |
| 6:00 AM to 6:29 AM | 17 (6.6%) | 11 (9.0%) |
| 6:30 AM to 6:59 AM | 0 (0.0%) | 9 (7.4%) |
| 7:00 AM to 7:29 AM | 26 (10.1%) | 29 (23.8%) |
| 7:30 AM to 7:59 AM | 11 (4.3%) | 0 (0.0%) |
| 8:00 AM to 8:29 AM | 72 (28.0%) | 30 (24.6%) |
| 8:30 AM to 8:59 AM | 0 (0.0%) | 0 (0.0%) |
| 9:00 AM to 9:59 AM | 10 (3.9%) | 6 (4.9%) |
| 10:00 AM to 10:59 AM | 0 (0.0%) | 0 (0.0%) |
| 11:00 AM to 11:59 AM | 0 (0.0%) | 11 (9.0%) |
| 12:00 PM to 3:59 PM | 0 (0.0%) | 15 (12.3%) |
| 4:00 PM to 11:59 PM | 0 (0.0%) | 11 (9.0%) |
| Total | 257 (100.0%) | 122 (100.0%) |
Housing Occupancy in Moncure
Occupancy by Ownership in Moncure
Of the total 246 dwellings in Moncure, owner-occupied units account for 229 (93.1%), while renter-occupied units make up 17 (6.9%).
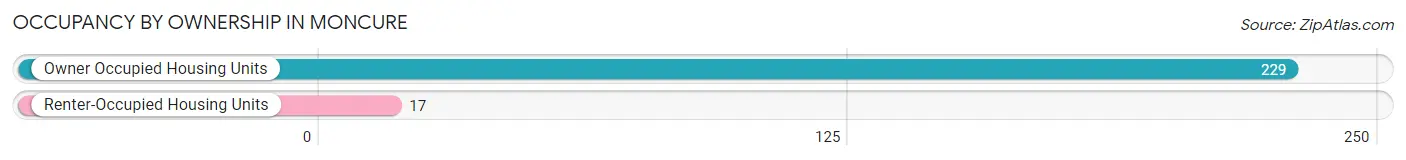
| Occupancy | # Housing Units | % Housing Units |
| Owner Occupied Housing Units | 229 | 93.1% |
| Renter-Occupied Housing Units | 17 | 6.9% |
| Total Occupied Housing Units | 246 | 100.0% |
Occupancy by Household Size in Moncure
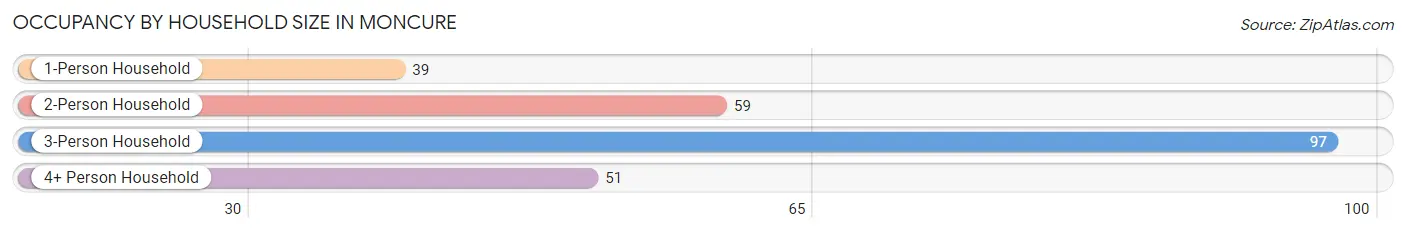
| Household Size | # Housing Units | % Housing Units |
| 1-Person Household | 39 | 15.9% |
| 2-Person Household | 59 | 24.0% |
| 3-Person Household | 97 | 39.4% |
| 4+ Person Household | 51 | 20.7% |
| Total Housing Units | 246 | 100.0% |
Occupancy by Ownership by Household Size in Moncure
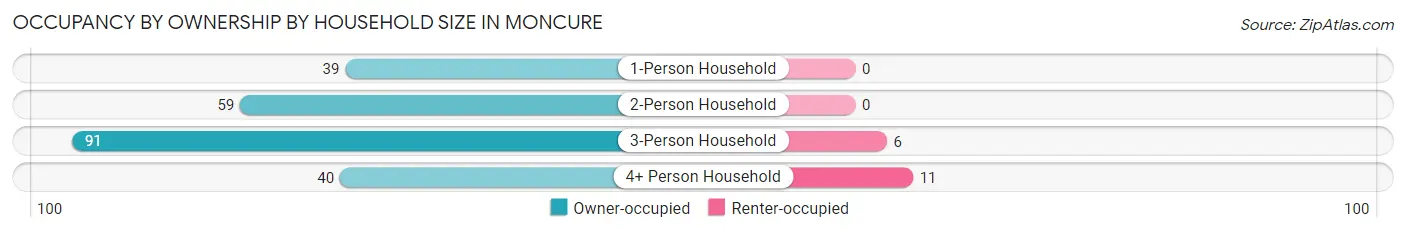
| Household Size | Owner-occupied | Renter-occupied |
| 1-Person Household | 39 (100.0%) | 0 (0.0%) |
| 2-Person Household | 59 (100.0%) | 0 (0.0%) |
| 3-Person Household | 91 (93.8%) | 6 (6.2%) |
| 4+ Person Household | 40 (78.4%) | 11 (21.6%) |
| Total Housing Units | 229 (93.1%) | 17 (6.9%) |
Occupancy by Educational Attainment in Moncure
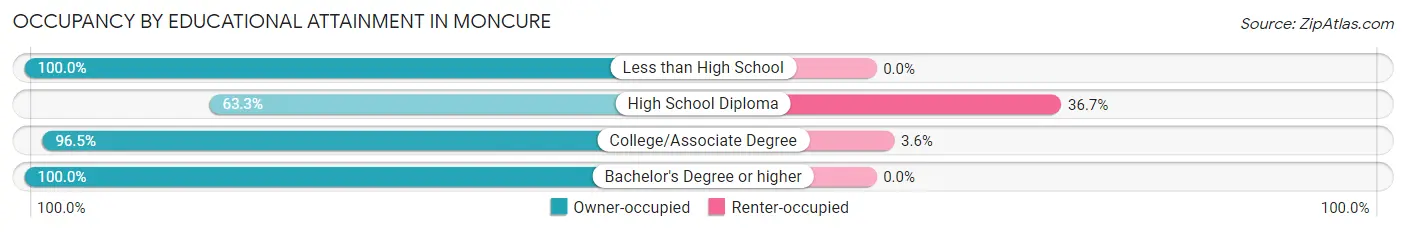
| Household Size | Owner-occupied | Renter-occupied |
| Less than High School | 36 (100.0%) | 0 (0.0%) |
| High School Diploma | 19 (63.3%) | 11 (36.7%) |
| College/Associate Degree | 163 (96.5%) | 6 (3.5%) |
| Bachelor's Degree or higher | 11 (100.0%) | 0 (0.0%) |
Occupancy by Age of Householder in Moncure
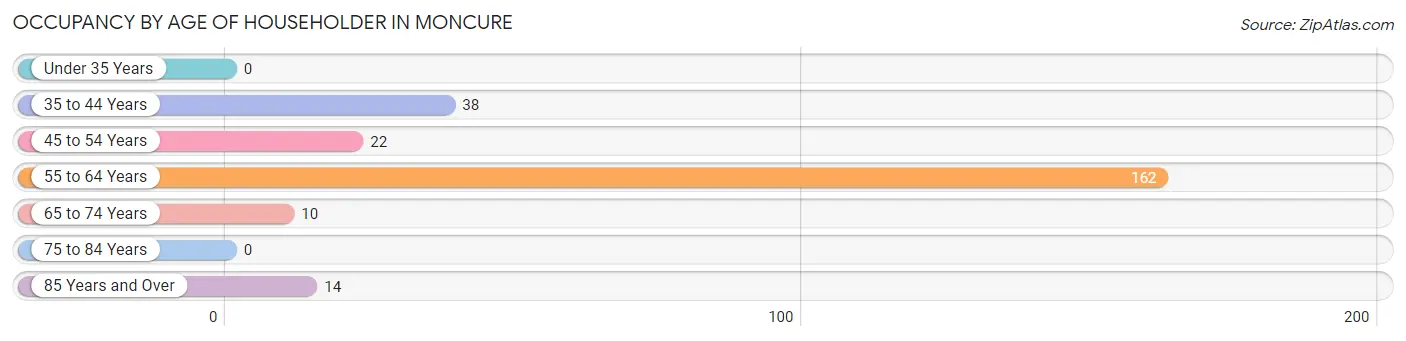
| Age Bracket | # Households | % Households |
| Under 35 Years | 0 | 0.0% |
| 35 to 44 Years | 38 | 15.4% |
| 45 to 54 Years | 22 | 8.9% |
| 55 to 64 Years | 162 | 65.8% |
| 65 to 74 Years | 10 | 4.1% |
| 75 to 84 Years | 0 | 0.0% |
| 85 Years and Over | 14 | 5.7% |
| Total | 246 | 100.0% |
Housing Finances in Moncure
Median Income by Occupancy in Moncure
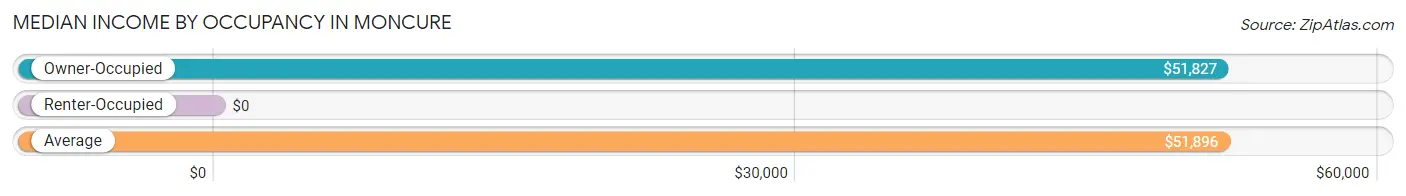
| Occupancy Type | # Households | Median Income |
| Owner-Occupied | 229 (93.1%) | $51,827 |
| Renter-Occupied | 17 (6.9%) | $0 |
| Average | 246 (100.0%) | $51,896 |
Occupancy by Householder Income Bracket in Moncure
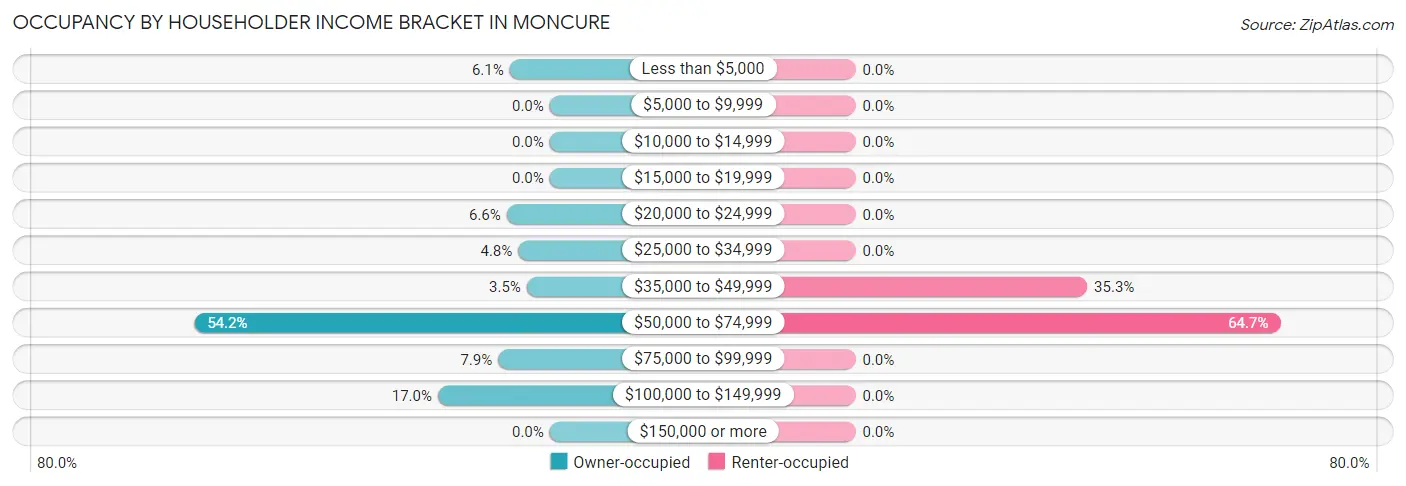
| Income Bracket | Owner-occupied | Renter-occupied |
| Less than $5,000 | 14 (6.1%) | 0 (0.0%) |
| $5,000 to $9,999 | 0 (0.0%) | 0 (0.0%) |
| $10,000 to $14,999 | 0 (0.0%) | 0 (0.0%) |
| $15,000 to $19,999 | 0 (0.0%) | 0 (0.0%) |
| $20,000 to $24,999 | 15 (6.6%) | 0 (0.0%) |
| $25,000 to $34,999 | 11 (4.8%) | 0 (0.0%) |
| $35,000 to $49,999 | 8 (3.5%) | 6 (35.3%) |
| $50,000 to $74,999 | 124 (54.1%) | 11 (64.7%) |
| $75,000 to $99,999 | 18 (7.9%) | 0 (0.0%) |
| $100,000 to $149,999 | 39 (17.0%) | 0 (0.0%) |
| $150,000 or more | 0 (0.0%) | 0 (0.0%) |
| Total | 229 (100.0%) | 17 (100.0%) |
Monthly Housing Cost Tiers in Moncure

| Monthly Cost | Owner-occupied | Renter-occupied |
| Less than $300 | 11 (4.8%) | 0 (0.0%) |
| $300 to $499 | 118 (51.5%) | 0 (0.0%) |
| $500 to $799 | 21 (9.2%) | 0 (0.0%) |
| $800 to $999 | 22 (9.6%) | 6 (35.3%) |
| $1,000 to $1,499 | 8 (3.5%) | 11 (64.7%) |
| $1,500 to $1,999 | 9 (3.9%) | 0 (0.0%) |
| $2,000 to $2,499 | 30 (13.1%) | 0 (0.0%) |
| $2,500 to $2,999 | 0 (0.0%) | 0 (0.0%) |
| $3,000 or more | 10 (4.4%) | 0 (0.0%) |
| Total | 229 (100.0%) | 17 (100.0%) |
Physical Housing Characteristics in Moncure
Housing Structures in Moncure
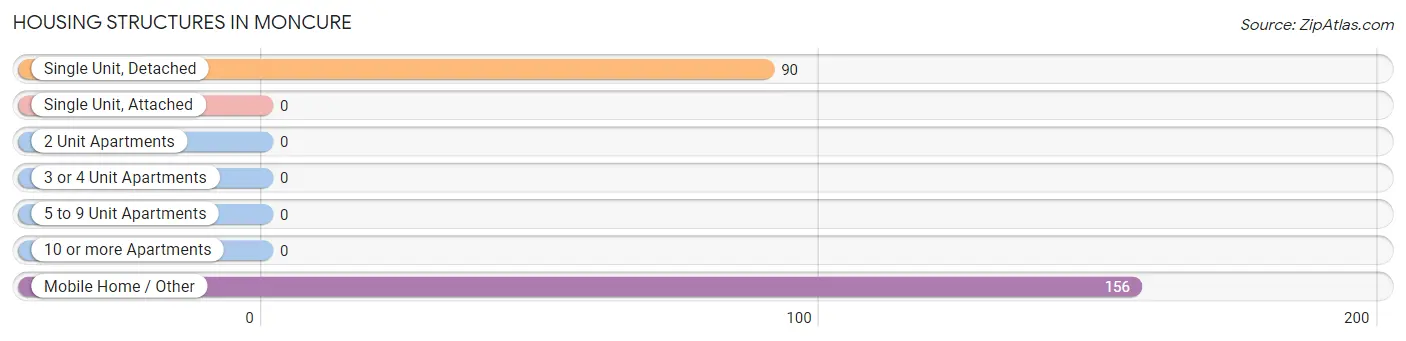
| Structure Type | # Housing Units | % Housing Units |
| Single Unit, Detached | 90 | 36.6% |
| Single Unit, Attached | 0 | 0.0% |
| 2 Unit Apartments | 0 | 0.0% |
| 3 or 4 Unit Apartments | 0 | 0.0% |
| 5 to 9 Unit Apartments | 0 | 0.0% |
| 10 or more Apartments | 0 | 0.0% |
| Mobile Home / Other | 156 | 63.4% |
| Total | 246 | 100.0% |
Housing Structures by Occupancy in Moncure
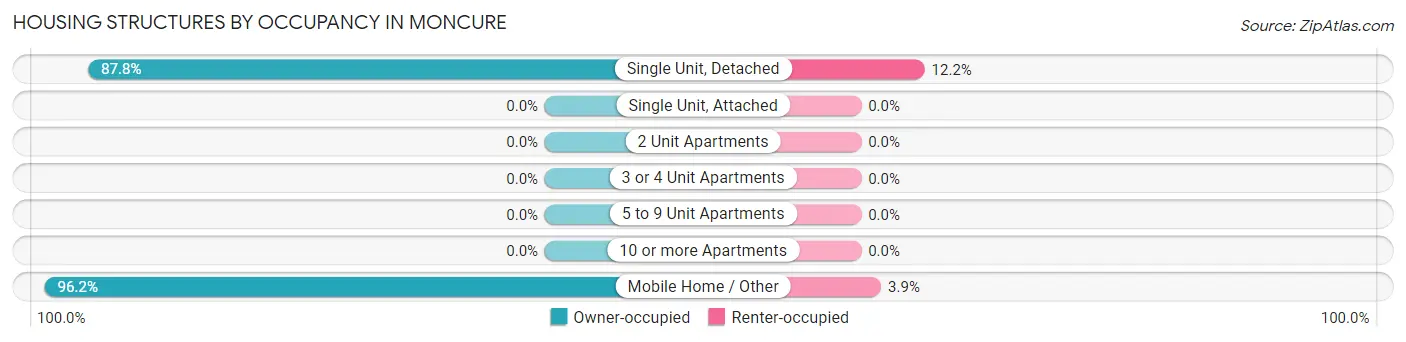
| Structure Type | Owner-occupied | Renter-occupied |
| Single Unit, Detached | 79 (87.8%) | 11 (12.2%) |
| Single Unit, Attached | 0 (0.0%) | 0 (0.0%) |
| 2 Unit Apartments | 0 (0.0%) | 0 (0.0%) |
| 3 or 4 Unit Apartments | 0 (0.0%) | 0 (0.0%) |
| 5 to 9 Unit Apartments | 0 (0.0%) | 0 (0.0%) |
| 10 or more Apartments | 0 (0.0%) | 0 (0.0%) |
| Mobile Home / Other | 150 (96.2%) | 6 (3.8%) |
| Total | 229 (93.1%) | 17 (6.9%) |
Housing Structures by Number of Rooms in Moncure
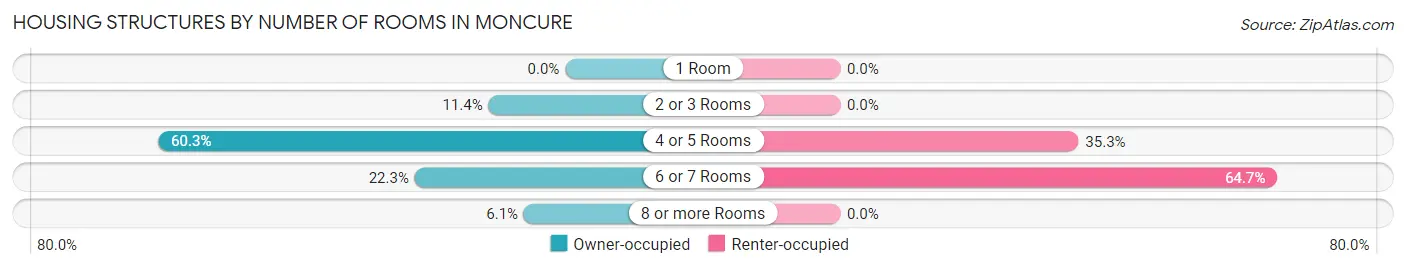
| Number of Rooms | Owner-occupied | Renter-occupied |
| 1 Room | 0 (0.0%) | 0 (0.0%) |
| 2 or 3 Rooms | 26 (11.4%) | 0 (0.0%) |
| 4 or 5 Rooms | 138 (60.3%) | 6 (35.3%) |
| 6 or 7 Rooms | 51 (22.3%) | 11 (64.7%) |
| 8 or more Rooms | 14 (6.1%) | 0 (0.0%) |
| Total | 229 (100.0%) | 17 (100.0%) |
Housing Structure by Heating Type in Moncure
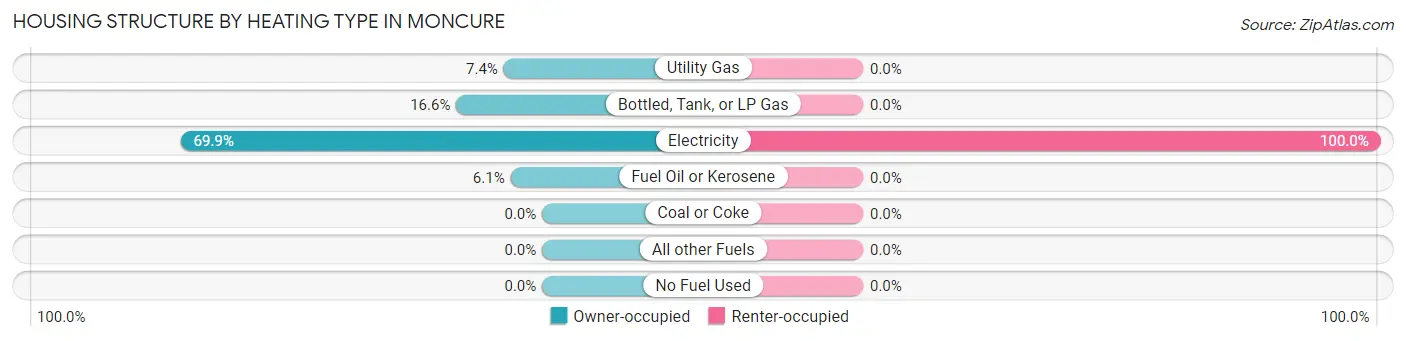
| Heating Type | Owner-occupied | Renter-occupied |
| Utility Gas | 17 (7.4%) | 0 (0.0%) |
| Bottled, Tank, or LP Gas | 38 (16.6%) | 0 (0.0%) |
| Electricity | 160 (69.9%) | 17 (100.0%) |
| Fuel Oil or Kerosene | 14 (6.1%) | 0 (0.0%) |
| Coal or Coke | 0 (0.0%) | 0 (0.0%) |
| All other Fuels | 0 (0.0%) | 0 (0.0%) |
| No Fuel Used | 0 (0.0%) | 0 (0.0%) |
| Total | 229 (100.0%) | 17 (100.0%) |
Household Vehicle Usage in Moncure
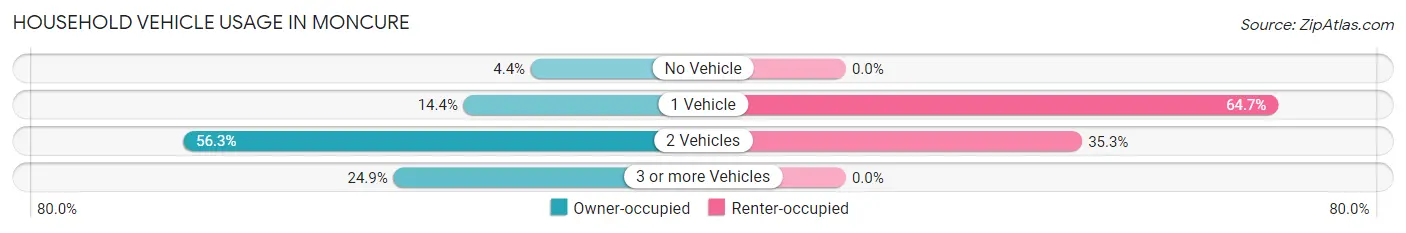
| Vehicles per Household | Owner-occupied | Renter-occupied |
| No Vehicle | 10 (4.4%) | 0 (0.0%) |
| 1 Vehicle | 33 (14.4%) | 11 (64.7%) |
| 2 Vehicles | 129 (56.3%) | 6 (35.3%) |
| 3 or more Vehicles | 57 (24.9%) | 0 (0.0%) |
| Total | 229 (100.0%) | 17 (100.0%) |
Real Estate & Mortgages in Moncure
Real Estate and Mortgage Overview in Moncure
| Characteristic | Without Mortgage | With Mortgage |
| Housing Units | 161 | 68 |
| Median Property Value | $85,600 | $317,900 |
| Median Household Income | $51,113 | $0 |
| Monthly Housing Costs | $376 | $10 |
| Real Estate Taxes | $1,252 | $0 |
Property Value by Mortgage Status in Moncure
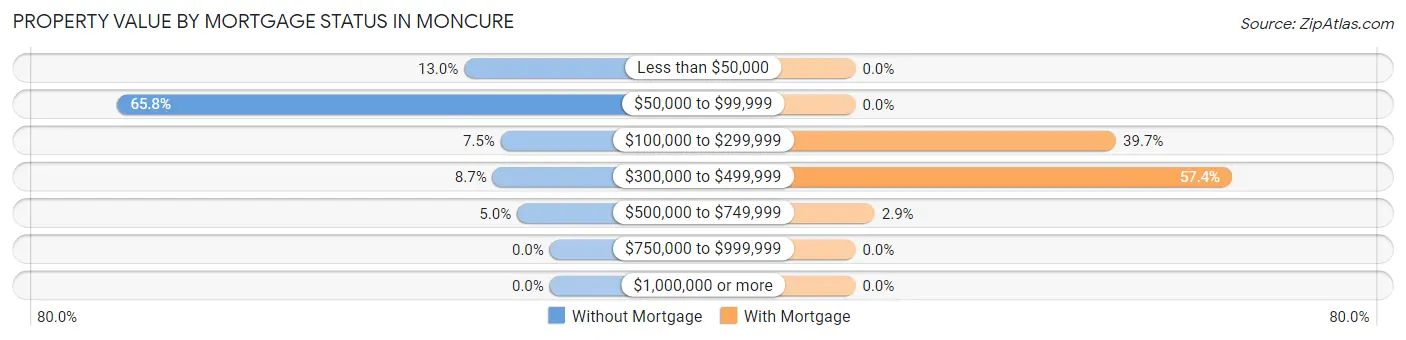
| Property Value | Without Mortgage | With Mortgage |
| Less than $50,000 | 21 (13.0%) | 0 (0.0%) |
| $50,000 to $99,999 | 106 (65.8%) | 0 (0.0%) |
| $100,000 to $299,999 | 12 (7.4%) | 27 (39.7%) |
| $300,000 to $499,999 | 14 (8.7%) | 39 (57.4%) |
| $500,000 to $749,999 | 8 (5.0%) | 2 (2.9%) |
| $750,000 to $999,999 | 0 (0.0%) | 0 (0.0%) |
| $1,000,000 or more | 0 (0.0%) | 0 (0.0%) |
| Total | 161 (100.0%) | 68 (100.0%) |
Household Income by Mortgage Status in Moncure
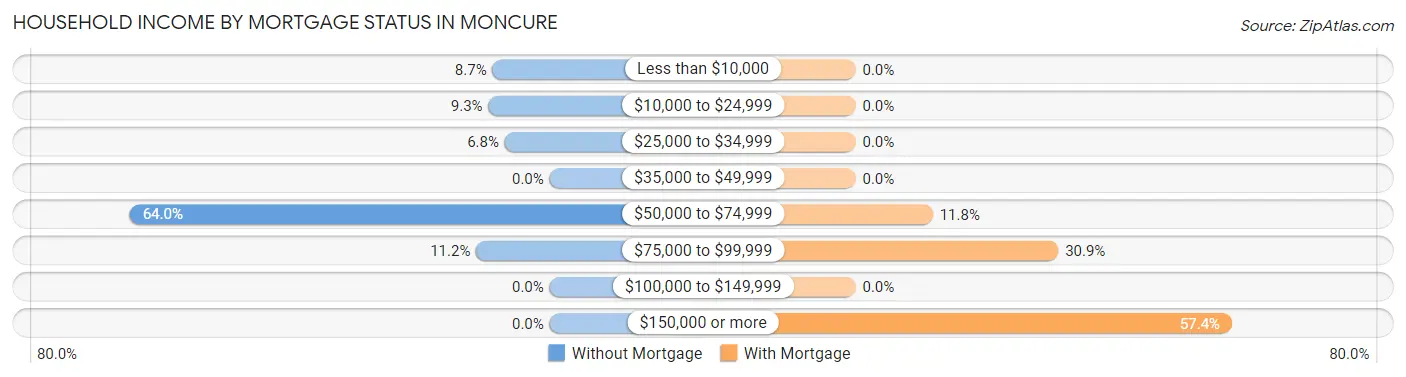
| Household Income | Without Mortgage | With Mortgage |
| Less than $10,000 | 14 (8.7%) | 0 (0.0%) |
| $10,000 to $24,999 | 15 (9.3%) | 0 (0.0%) |
| $25,000 to $34,999 | 11 (6.8%) | 0 (0.0%) |
| $35,000 to $49,999 | 0 (0.0%) | 0 (0.0%) |
| $50,000 to $74,999 | 103 (64.0%) | 8 (11.8%) |
| $75,000 to $99,999 | 18 (11.2%) | 21 (30.9%) |
| $100,000 to $149,999 | 0 (0.0%) | 0 (0.0%) |
| $150,000 or more | 0 (0.0%) | 39 (57.4%) |
| Total | 161 (100.0%) | 68 (100.0%) |
Property Value to Household Income Ratio in Moncure
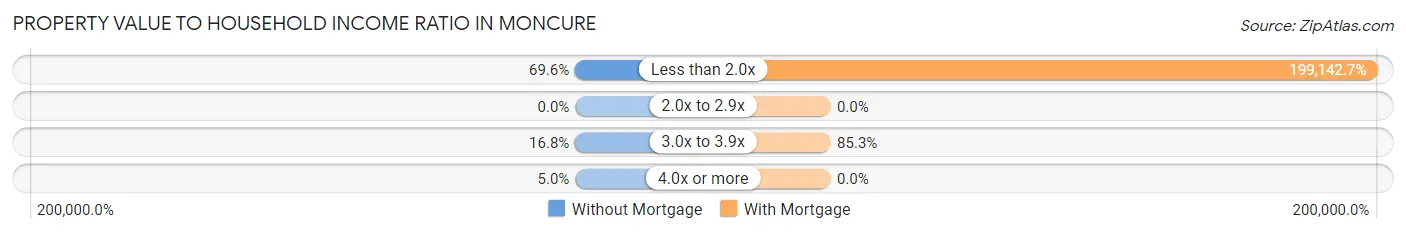
| Value-to-Income Ratio | Without Mortgage | With Mortgage |
| Less than 2.0x | 112 (69.6%) | 135,417 (199,142.7%) |
| 2.0x to 2.9x | 0 (0.0%) | 0 (0.0%) |
| 3.0x to 3.9x | 27 (16.8%) | 58 (85.3%) |
| 4.0x or more | 8 (5.0%) | 0 (0.0%) |
| Total | 161 (100.0%) | 68 (100.0%) |
Real Estate Taxes by Mortgage Status in Moncure
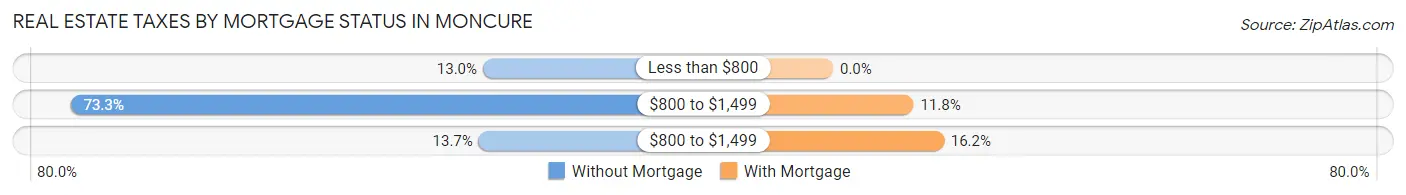
| Property Taxes | Without Mortgage | With Mortgage |
| Less than $800 | 21 (13.0%) | 0 (0.0%) |
| $800 to $1,499 | 118 (73.3%) | 8 (11.8%) |
| $800 to $1,499 | 22 (13.7%) | 11 (16.2%) |
| Total | 161 (100.0%) | 68 (100.0%) |
Health & Disability in Moncure
Health Insurance Coverage by Age in Moncure
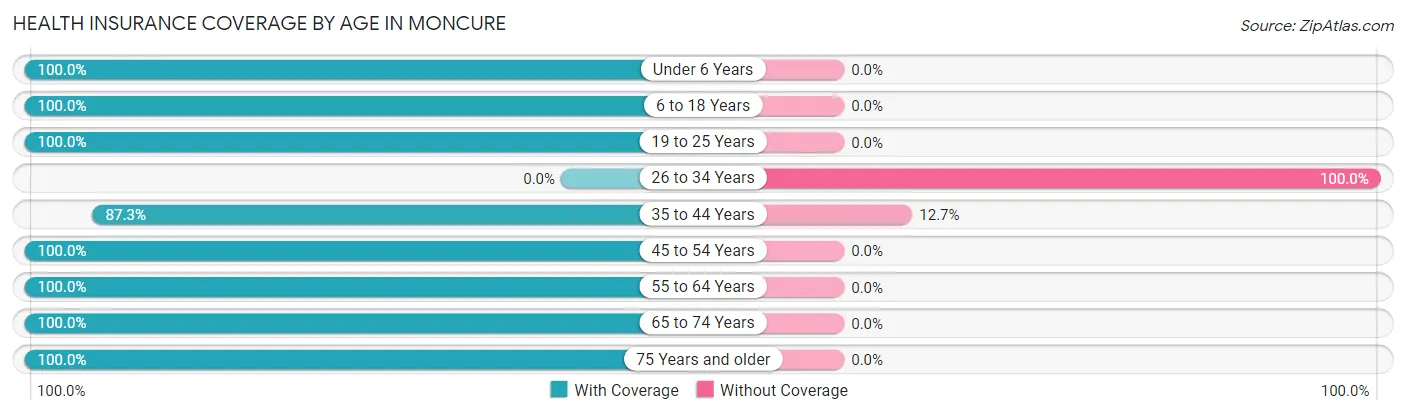
| Age Bracket | With Coverage | Without Coverage |
| Under 6 Years | 7 (100.0%) | 0 (0.0%) |
| 6 to 18 Years | 131 (100.0%) | 0 (0.0%) |
| 19 to 25 Years | 41 (100.0%) | 0 (0.0%) |
| 26 to 34 Years | 0 (0.0%) | 24 (100.0%) |
| 35 to 44 Years | 117 (87.3%) | 17 (12.7%) |
| 45 to 54 Years | 42 (100.0%) | 0 (0.0%) |
| 55 to 64 Years | 292 (100.0%) | 0 (0.0%) |
| 65 to 74 Years | 90 (100.0%) | 0 (0.0%) |
| 75 Years and older | 14 (100.0%) | 0 (0.0%) |
| Total | 734 (94.7%) | 41 (5.3%) |
Health Insurance Coverage by Citizenship Status in Moncure
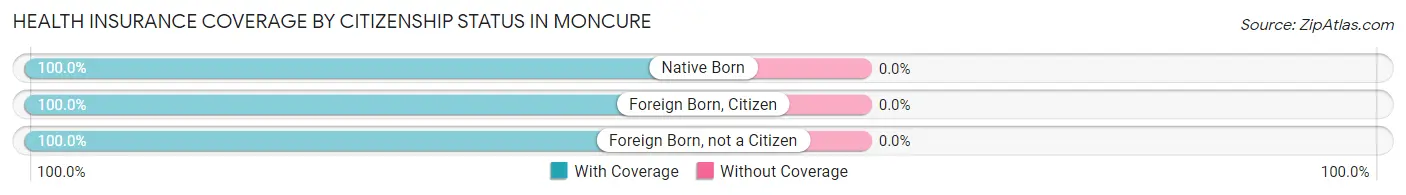
| Citizenship Status | With Coverage | Without Coverage |
| Native Born | 7 (100.0%) | 0 (0.0%) |
| Foreign Born, Citizen | 131 (100.0%) | 0 (0.0%) |
| Foreign Born, not a Citizen | 41 (100.0%) | 0 (0.0%) |
Health Insurance Coverage by Household Income in Moncure
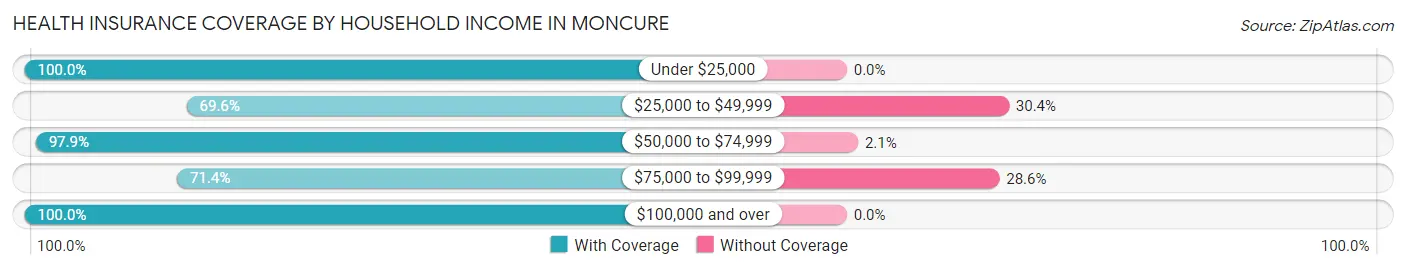
| Household Income | With Coverage | Without Coverage |
| Under $25,000 | 45 (100.0%) | 0 (0.0%) |
| $25,000 to $49,999 | 39 (69.6%) | 17 (30.4%) |
| $50,000 to $74,999 | 375 (97.9%) | 8 (2.1%) |
| $75,000 to $99,999 | 40 (71.4%) | 16 (28.6%) |
| $100,000 and over | 235 (100.0%) | 0 (0.0%) |
Public vs Private Health Insurance Coverage by Age in Moncure
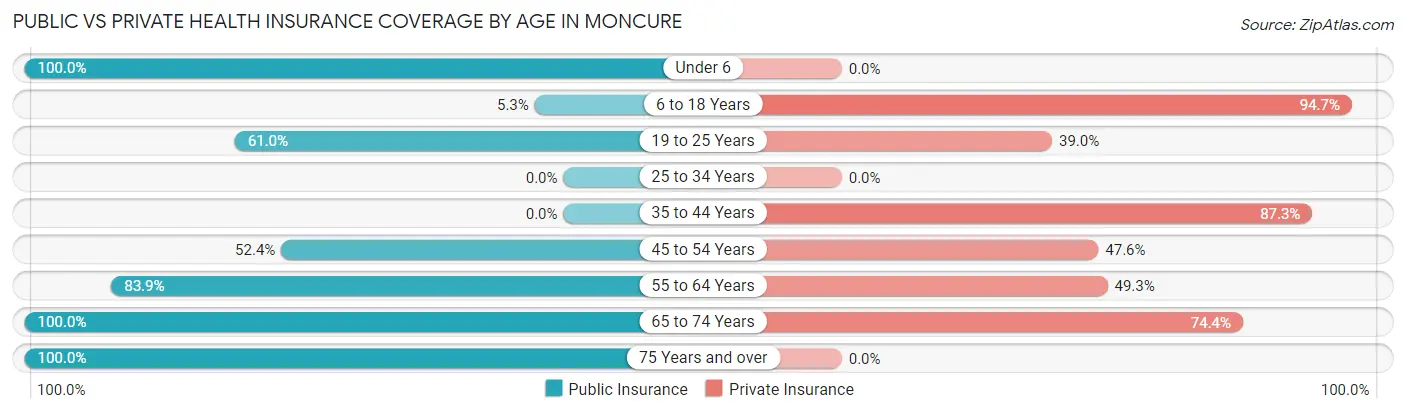
| Age Bracket | Public Insurance | Private Insurance |
| Under 6 | 7 (100.0%) | 0 (0.0%) |
| 6 to 18 Years | 7 (5.3%) | 124 (94.7%) |
| 19 to 25 Years | 25 (61.0%) | 16 (39.0%) |
| 25 to 34 Years | 0 (0.0%) | 0 (0.0%) |
| 35 to 44 Years | 0 (0.0%) | 117 (87.3%) |
| 45 to 54 Years | 22 (52.4%) | 20 (47.6%) |
| 55 to 64 Years | 245 (83.9%) | 144 (49.3%) |
| 65 to 74 Years | 90 (100.0%) | 67 (74.4%) |
| 75 Years and over | 14 (100.0%) | 0 (0.0%) |
| Total | 410 (52.9%) | 488 (63.0%) |
Disability Status by Sex by Age in Moncure
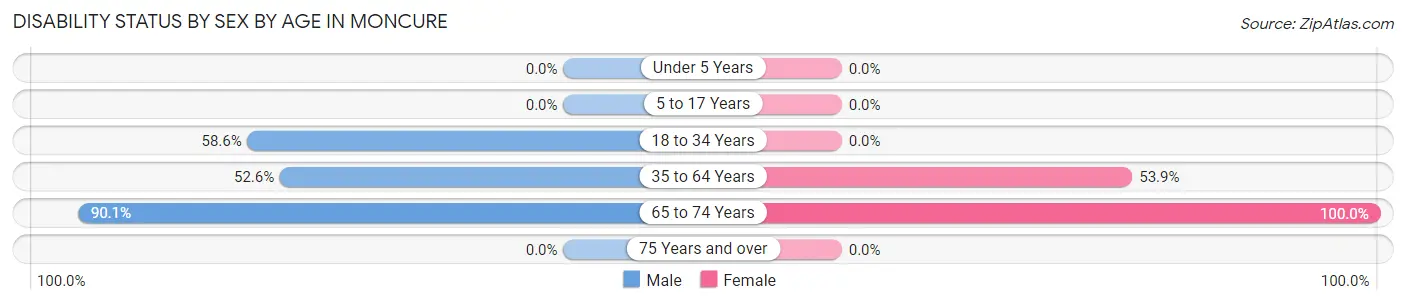
| Age Bracket | Male | Female |
| Under 5 Years | 0 (0.0%) | 0 (0.0%) |
| 5 to 17 Years | 0 (0.0%) | 0 (0.0%) |
| 18 to 34 Years | 34 (58.6%) | 0 (0.0%) |
| 35 to 64 Years | 132 (52.6%) | 117 (53.9%) |
| 65 to 74 Years | 73 (90.1%) | 9 (100.0%) |
| 75 Years and over | 0 (0.0%) | 0 (0.0%) |
Disability Class by Sex by Age in Moncure
Disability Class: Hearing Difficulty
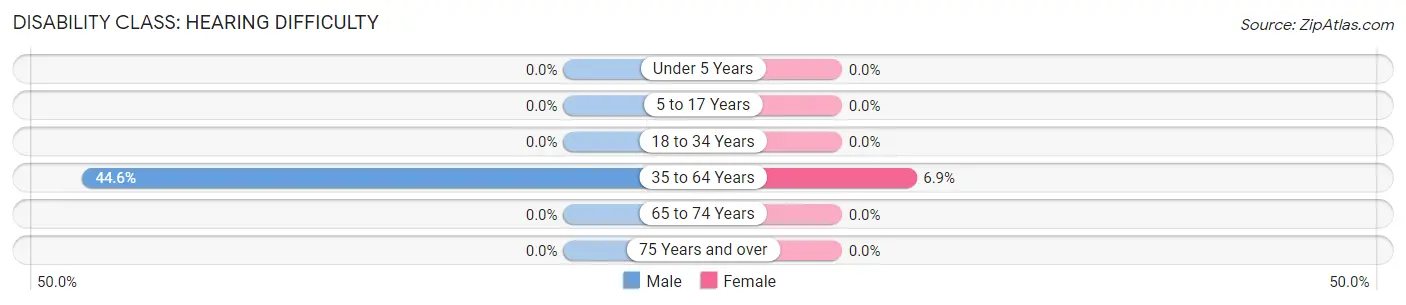
| Age Bracket | Male | Female |
| Under 5 Years | 0 (0.0%) | 0 (0.0%) |
| 5 to 17 Years | 0 (0.0%) | 0 (0.0%) |
| 18 to 34 Years | 0 (0.0%) | 0 (0.0%) |
| 35 to 64 Years | 112 (44.6%) | 15 (6.9%) |
| 65 to 74 Years | 0 (0.0%) | 0 (0.0%) |
| 75 Years and over | 0 (0.0%) | 0 (0.0%) |
Disability Class: Vision Difficulty
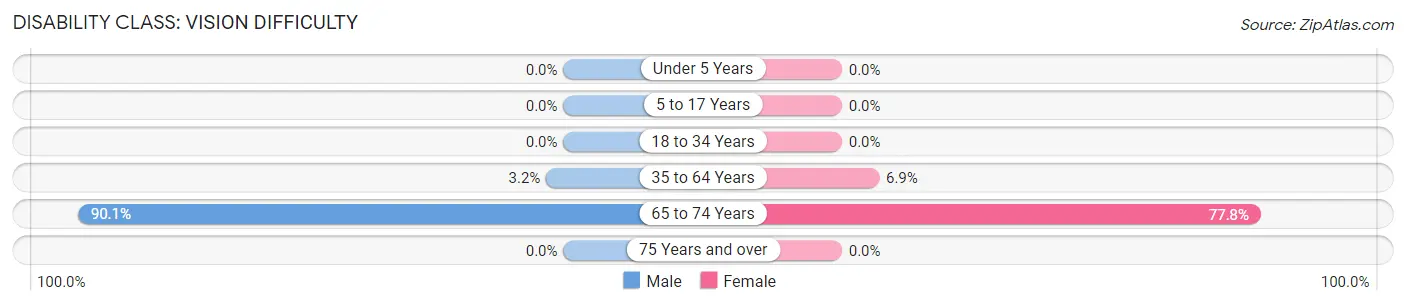
| Age Bracket | Male | Female |
| Under 5 Years | 0 (0.0%) | 0 (0.0%) |
| 5 to 17 Years | 0 (0.0%) | 0 (0.0%) |
| 18 to 34 Years | 0 (0.0%) | 0 (0.0%) |
| 35 to 64 Years | 8 (3.2%) | 15 (6.9%) |
| 65 to 74 Years | 73 (90.1%) | 7 (77.8%) |
| 75 Years and over | 0 (0.0%) | 0 (0.0%) |
Disability Class: Cognitive Difficulty
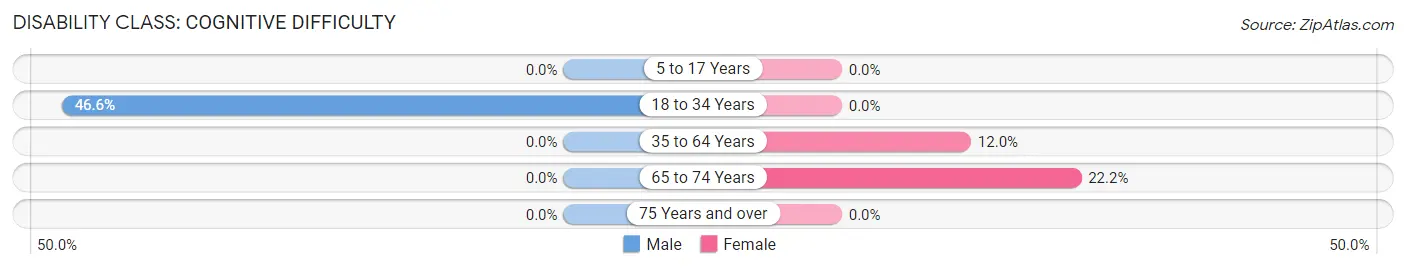
| Age Bracket | Male | Female |
| 5 to 17 Years | 0 (0.0%) | 0 (0.0%) |
| 18 to 34 Years | 27 (46.6%) | 0 (0.0%) |
| 35 to 64 Years | 0 (0.0%) | 26 (12.0%) |
| 65 to 74 Years | 0 (0.0%) | 2 (22.2%) |
| 75 Years and over | 0 (0.0%) | 0 (0.0%) |
Disability Class: Ambulatory Difficulty
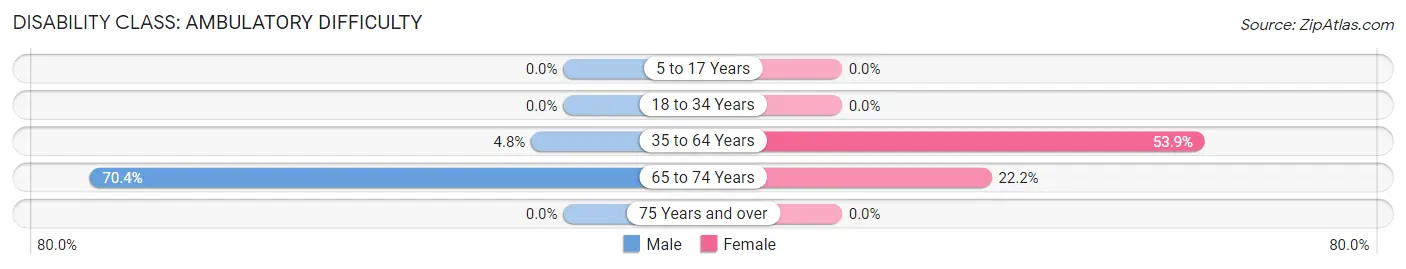
| Age Bracket | Male | Female |
| 5 to 17 Years | 0 (0.0%) | 0 (0.0%) |
| 18 to 34 Years | 0 (0.0%) | 0 (0.0%) |
| 35 to 64 Years | 12 (4.8%) | 117 (53.9%) |
| 65 to 74 Years | 57 (70.4%) | 2 (22.2%) |
| 75 Years and over | 0 (0.0%) | 0 (0.0%) |
Disability Class: Self-Care Difficulty
| Age Bracket | Male | Female |
| 5 to 17 Years | 0 (0.0%) | 0 (0.0%) |
| 18 to 34 Years | 0 (0.0%) | 0 (0.0%) |
| 35 to 64 Years | 0 (0.0%) | 0 (0.0%) |
| 65 to 74 Years | 0 (0.0%) | 0 (0.0%) |
| 75 Years and over | 0 (0.0%) | 0 (0.0%) |
Technology Access in Moncure
Computing Device Access in Moncure
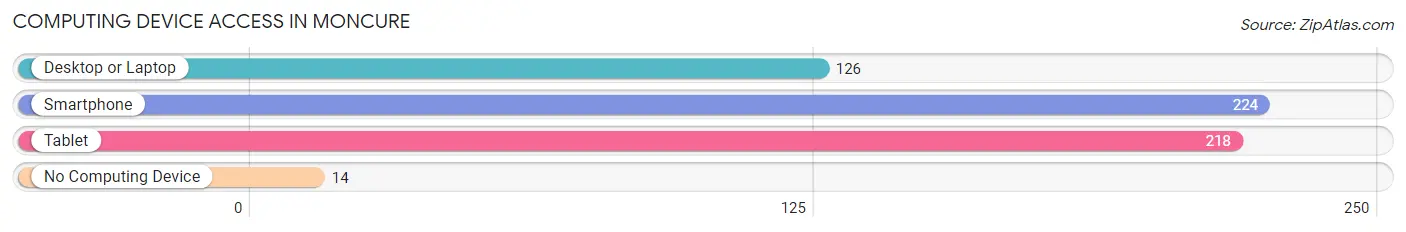
| Device Type | # Households | % Households |
| Desktop or Laptop | 126 | 51.2% |
| Smartphone | 224 | 91.1% |
| Tablet | 218 | 88.6% |
| No Computing Device | 14 | 5.7% |
| Total | 246 | 100.0% |
Internet Access in Moncure
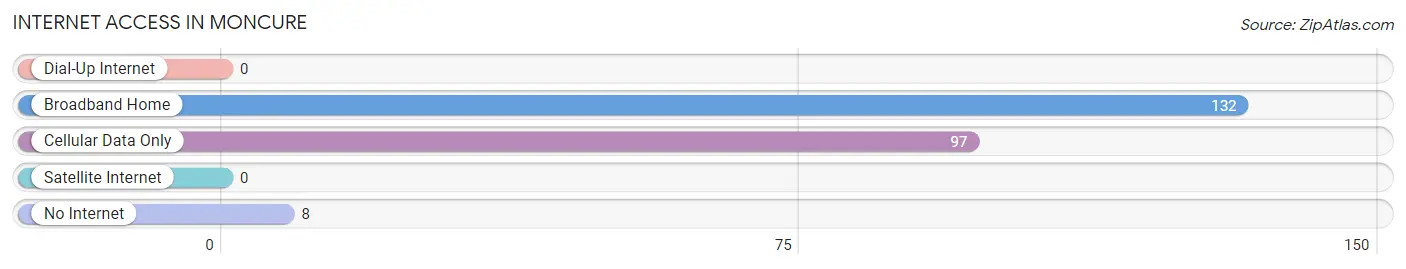
| Internet Type | # Households | % Households |
| Dial-Up Internet | 0 | 0.0% |
| Broadband Home | 132 | 53.7% |
| Cellular Data Only | 97 | 39.4% |
| Satellite Internet | 0 | 0.0% |
| No Internet | 8 | 3.3% |
| Total | 246 | 100.0% |
Moncure Summary
Moncure is a small town located in Chatham County, North Carolina. It is situated on the banks of the Cape Fear River, approximately 25 miles south of Raleigh. The town has a population of approximately 1,000 people and is part of the Pittsboro Micropolitan Statistical Area.
Geography
Moncure is located in the Piedmont region of North Carolina, which is characterized by rolling hills and flat plains. The town is situated on the banks of the Cape Fear River, which is the longest river in the state. The town is surrounded by forests and is home to a variety of wildlife, including deer, foxes, and wild turkeys. The town is also home to a variety of plant life, including oak, hickory, and pine trees.
The town is located in a humid subtropical climate, which is characterized by hot, humid summers and mild winters. The average temperature in the summer is around 80 degrees Fahrenheit, while the average temperature in the winter is around 40 degrees Fahrenheit. The town receives an average of 48 inches of precipitation per year, with most of it falling in the summer months.
Economy
Moncure’s economy is largely based on agriculture and forestry. The town is home to several farms, which produce a variety of crops, including corn, soybeans, and wheat. The town is also home to several timber companies, which harvest and process timber for use in construction and other industries.
The town is also home to several small businesses, including restaurants, retail stores, and service providers. The town is also home to a variety of manufacturing companies, which produce a variety of products, including furniture, textiles, and electronics.
Demographics
As of the 2010 census, the population of Moncure was 1,000 people. The racial makeup of the town was 94.2% White, 2.2% African American, 0.7% Native American, 0.7% Asian, 0.3% from other races, and 2.1% from two or more races. Hispanic or Latino of any race were 1.3% of the population.
The median household income in Moncure was $41,250, and the median family income was $50,000. The per capita income for the town was $20,945. About 11.2% of families and 14.2% of the population were below the poverty line, including 18.2% of those under age 18 and 8.3% of those age 65 or over.
Conclusion
Moncure is a small town located in Chatham County, North Carolina. It is situated on the banks of the Cape Fear River and is home to a population of approximately 1,000 people. The town’s economy is largely based on agriculture and forestry, and it is home to several small businesses. The town has a diverse population, with a median household income of $41,250 and a median family income of $50,000. Moncure is a great place to live and work, and it is a great example of a small town in North Carolina.
Common Questions
What is Per Capita Income in Moncure?
Per Capita income in Moncure is $25,004.
What is the Median Household income in Moncure?
Median Household Income in Moncure is $51,896.
What is Inequality or Gini Index in Moncure?
Inequality or Gini Index in Moncure is 0.30.
What is the Total Population of Moncure?
Total Population of Moncure is 775.
What is the Total Male Population of Moncure?
Total Male Population of Moncure is 429.
What is the Total Female Population of Moncure?
Total Female Population of Moncure is 346.
What is the Ratio of Males per 100 Females in Moncure?
There are 123.99 Males per 100 Females in Moncure.
What is the Ratio of Females per 100 Males in Moncure?
There are 80.65 Females per 100 Males in Moncure.
What is the Median Population Age in Moncure?
Median Population Age in Moncure is 58.2 Years.
What is the Average Family Size in Moncure
Average Family Size in Moncure is 3.0 People.
What is the Average Household Size in Moncure
Average Household Size in Moncure is 3.1 People.
How Large is the Labor Force in Moncure?
There are 387 People in the Labor Forcein in Moncure.
What is the Percentage of People in the Labor Force in Moncure?
58.1% of People are in the Labor Force in Moncure.