McAdenville, NC Map & Demographics
McAdenville Map
McAdenville Overview
$45,861
PER CAPITA INCOME
$123,967
AVG FAMILY INCOME
$102,083
AVG HOUSEHOLD INCOME
20.1%
WAGE / INCOME GAP [ % ]
79.9¢/ $1
WAGE / INCOME GAP [ $ ]
0.37
INEQUALITY / GINI INDEX
1,125
TOTAL POPULATION
502
MALE POPULATION
623
FEMALE POPULATION
80.58
MALES / 100 FEMALES
124.10
FEMALES / 100 MALES
41.2
MEDIAN AGE
2.9
AVG FAMILY SIZE
2.3
AVG HOUSEHOLD SIZE
570
LABOR FORCE [ PEOPLE ]
63.8%
PERCENT IN LABOR FORCE
3.7%
UNEMPLOYMENT RATE
Income in McAdenville
Income Overview in McAdenville
Per Capita Income in McAdenville is $45,861, while median incomes of families and households are $123,967 and $102,083 respectively.
| Characteristic | Number | Measure |
| Per Capita Income | 1,125 | $45,861 |
| Median Family Income | 332 | $123,967 |
| Mean Family Income | 332 | $134,237 |
| Median Household Income | 485 | $102,083 |
| Mean Household Income | 485 | $106,310 |
| Income Deficit | 332 | $0 |
| Wage / Income Gap (%) | 1,125 | 20.14% |
| Wage / Income Gap ($) | 1,125 | 79.86¢ per $1 |
| Gini / Inequality Index | 1,125 | 0.37 |
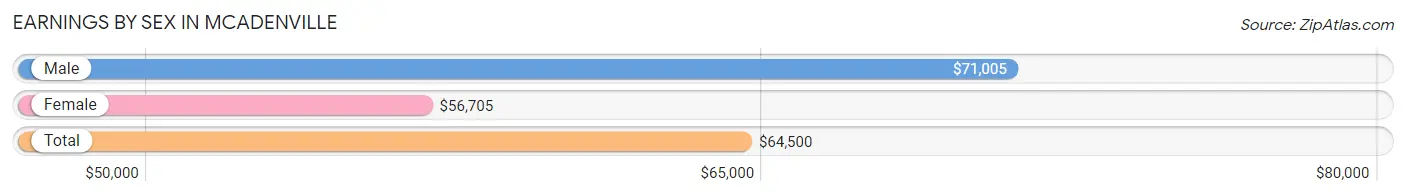
Earnings by Sex in McAdenville
Average Earnings in McAdenville are $64,500, $71,005 for men and $56,705 for women, a difference of 20.1%.
| Sex | Number | Average Earnings |
| Male | 329 (56.1%) | $71,005 |
| Female | 257 (43.9%) | $56,705 |
| Total | 586 (100.0%) | $64,500 |
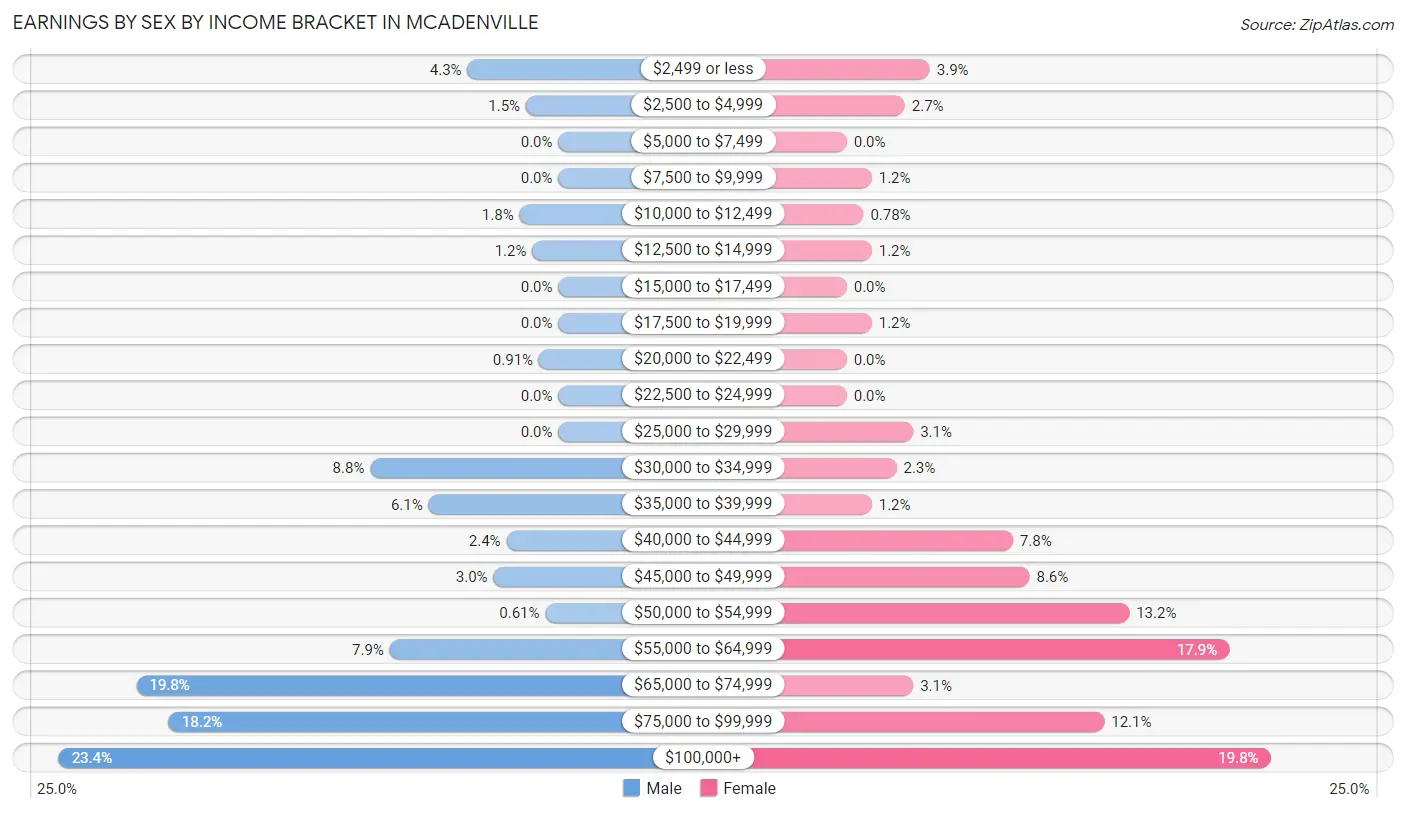
Earnings by Sex by Income Bracket in McAdenville
The most common earnings brackets in McAdenville are $100,000+ for men (77 | 23.4%) and $100,000+ for women (51 | 19.8%).
| Income | Male | Female |
| $2,499 or less | 14 (4.3%) | 10 (3.9%) |
| $2,500 to $4,999 | 5 (1.5%) | 7 (2.7%) |
| $5,000 to $7,499 | 0 (0.0%) | 0 (0.0%) |
| $7,500 to $9,999 | 0 (0.0%) | 3 (1.2%) |
| $10,000 to $12,499 | 6 (1.8%) | 2 (0.8%) |
| $12,500 to $14,999 | 4 (1.2%) | 3 (1.2%) |
| $15,000 to $17,499 | 0 (0.0%) | 0 (0.0%) |
| $17,500 to $19,999 | 0 (0.0%) | 3 (1.2%) |
| $20,000 to $22,499 | 3 (0.9%) | 0 (0.0%) |
| $22,500 to $24,999 | 0 (0.0%) | 0 (0.0%) |
| $25,000 to $29,999 | 0 (0.0%) | 8 (3.1%) |
| $30,000 to $34,999 | 29 (8.8%) | 6 (2.3%) |
| $35,000 to $39,999 | 20 (6.1%) | 3 (1.2%) |
| $40,000 to $44,999 | 8 (2.4%) | 20 (7.8%) |
| $45,000 to $49,999 | 10 (3.0%) | 22 (8.6%) |
| $50,000 to $54,999 | 2 (0.6%) | 34 (13.2%) |
| $55,000 to $64,999 | 26 (7.9%) | 46 (17.9%) |
| $65,000 to $74,999 | 65 (19.8%) | 8 (3.1%) |
| $75,000 to $99,999 | 60 (18.2%) | 31 (12.1%) |
| $100,000+ | 77 (23.4%) | 51 (19.8%) |
| Total | 329 (100.0%) | 257 (100.0%) |
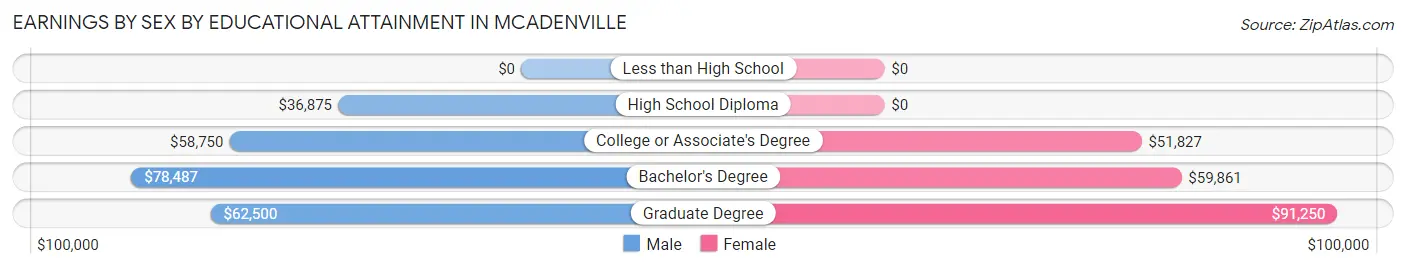
Earnings by Sex by Educational Attainment in McAdenville
Average earnings in McAdenville are $71,658 for men and $57,917 for women, a difference of 19.2%. Men with an educational attainment of bachelor's degree enjoy the highest average annual earnings of $78,487, while those with high school diploma education earn the least with $36,875. Women with an educational attainment of graduate degree earn the most with the average annual earnings of $91,250, while those with college or associate's degree education have the smallest earnings of $51,827.
| Educational Attainment | Male Income | Female Income |
| Less than High School | - | - |
| High School Diploma | $36,875 | $0 |
| College or Associate's Degree | $58,750 | $51,827 |
| Bachelor's Degree | $78,487 | $59,861 |
| Graduate Degree | $62,500 | $91,250 |
| Total | $71,658 | $57,917 |
Family Income in McAdenville
Family Income Brackets in McAdenville
According to the McAdenville family income data, there are 115 families falling into the $100,000 to $149,999 income range, which is the most common income bracket and makes up 34.6% of all families.
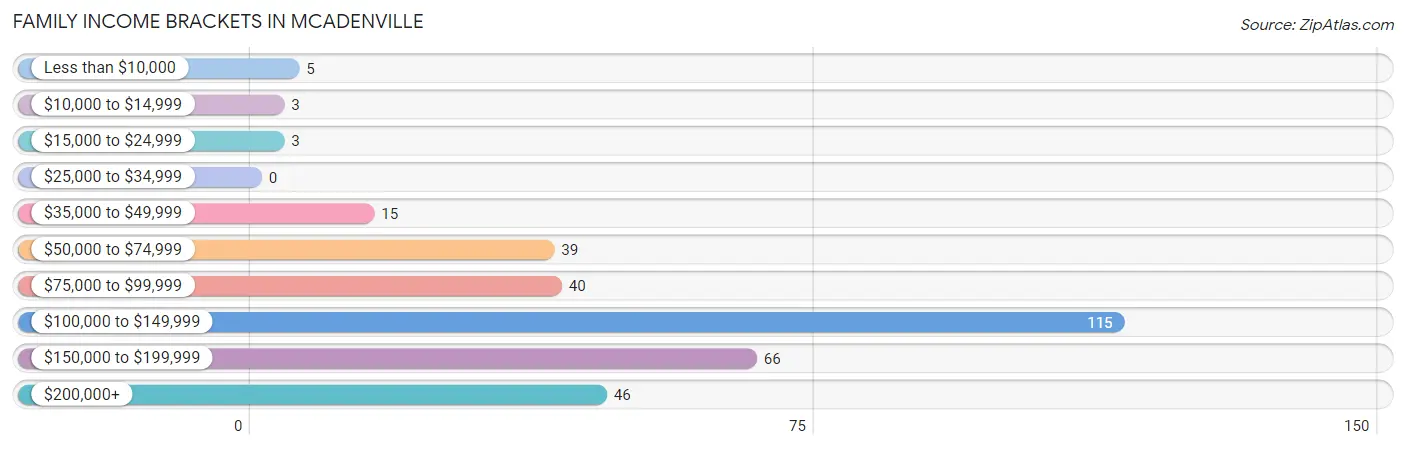
| Income Bracket | # Families | % Families |
| Less than $10,000 | 5 | 1.5% |
| $10,000 to $14,999 | 3 | 0.9% |
| $15,000 to $24,999 | 3 | 0.9% |
| $25,000 to $34,999 | 0 | 0.0% |
| $35,000 to $49,999 | 15 | 4.5% |
| $50,000 to $74,999 | 39 | 11.7% |
| $75,000 to $99,999 | 40 | 12.0% |
| $100,000 to $149,999 | 115 | 34.6% |
| $150,000 to $199,999 | 66 | 19.9% |
| $200,000+ | 46 | 13.9% |
Family Income by Famaliy Size in McAdenville
4-person families (35 | 10.5%) account for the highest median family income in McAdenville with $138,977 per family, while 2-person families (160 | 48.2%) have the highest median income of $60,084 per family member.
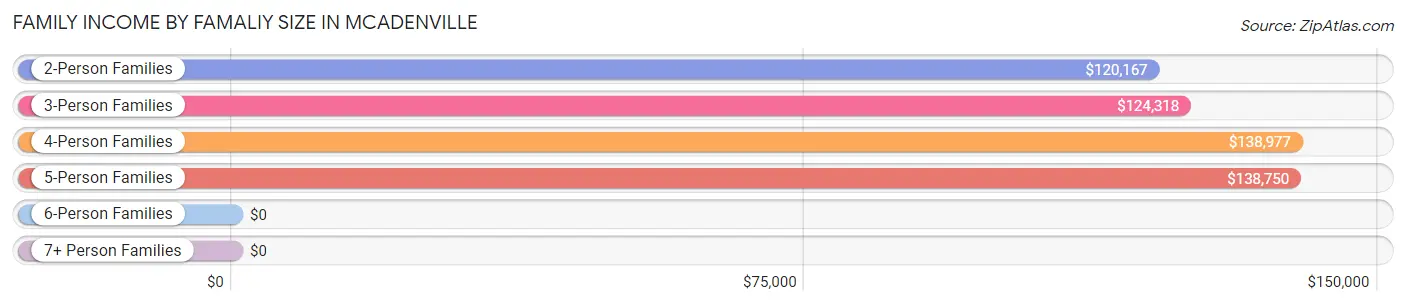
| Income Bracket | # Families | Median Income |
| 2-Person Families | 160 (48.2%) | $120,167 |
| 3-Person Families | 102 (30.7%) | $124,318 |
| 4-Person Families | 35 (10.5%) | $138,977 |
| 5-Person Families | 33 (9.9%) | $138,750 |
| 6-Person Families | 2 (0.6%) | $0 |
| 7+ Person Families | 0 (0.0%) | $0 |
| Total | 332 (100.0%) | $123,967 |
Family Income by Number of Earners in McAdenville
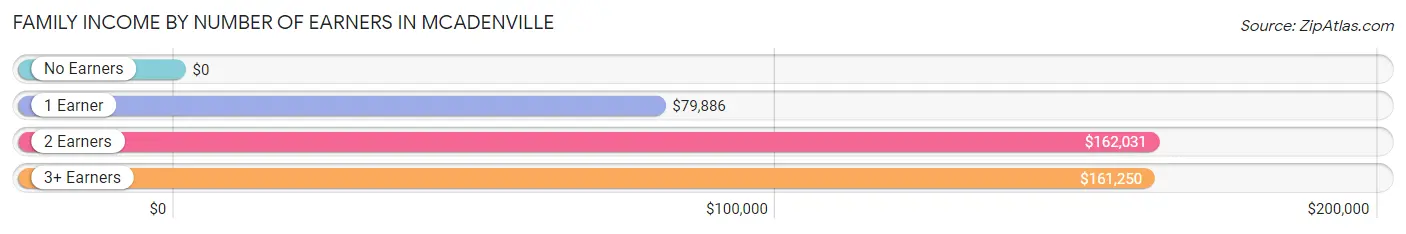
| Number of Earners | # Families | Median Income |
| No Earners | 14 (4.2%) | $0 |
| 1 Earner | 121 (36.4%) | $79,886 |
| 2 Earners | 171 (51.5%) | $162,031 |
| 3+ Earners | 26 (7.8%) | $161,250 |
| Total | 332 (100.0%) | $123,967 |
Household Income in McAdenville
Household Income Brackets in McAdenville
With 128 households falling in the category, the $100,000 to $149,999 income range is the most frequent in McAdenville, accounting for 26.4% of all households. In contrast, only 3 households (0.6%) fall into the $10,000 to $14,999 income bracket, making it the least populous group.
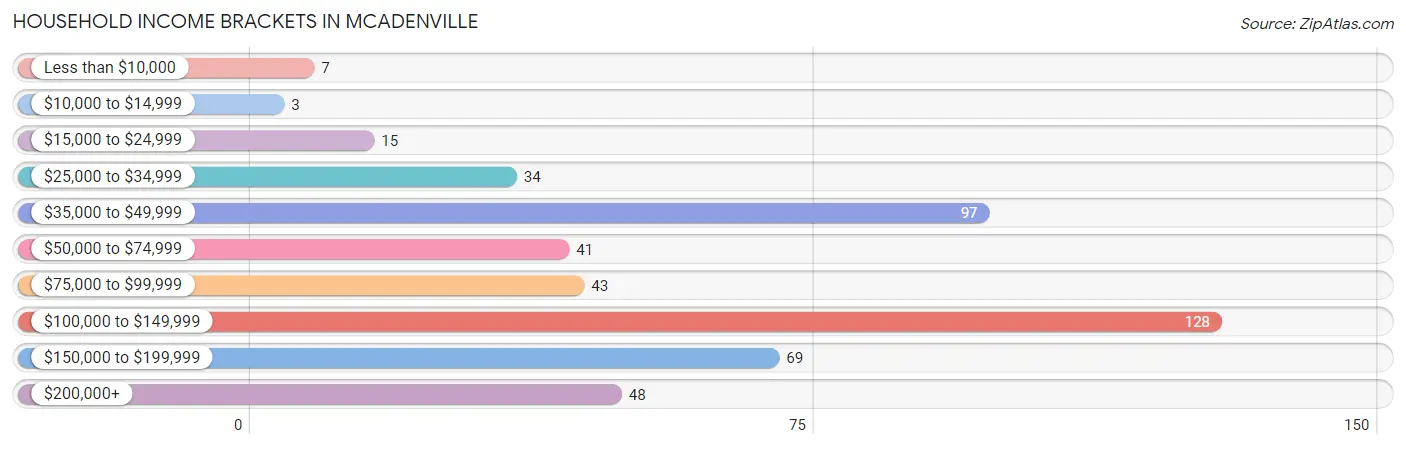
| Income Bracket | # Households | % Households |
| Less than $10,000 | 7 | 1.4% |
| $10,000 to $14,999 | 3 | 0.6% |
| $15,000 to $24,999 | 15 | 3.1% |
| $25,000 to $34,999 | 34 | 7.0% |
| $35,000 to $49,999 | 97 | 20.0% |
| $50,000 to $74,999 | 41 | 8.5% |
| $75,000 to $99,999 | 43 | 8.9% |
| $100,000 to $149,999 | 128 | 26.4% |
| $150,000 to $199,999 | 69 | 14.2% |
| $200,000+ | 48 | 9.9% |
Household Income by Householder Age in McAdenville
The median household income in McAdenville is $102,083, with the highest median household income of $156,250 found in the 25 to 44 years age bracket for the primary householder. A total of 170 households (35.0%) fall into this category. Meanwhile, the 15 to 24 years age bracket for the primary householder has the lowest median household income of $0, with 3 households (0.6%) in this group.
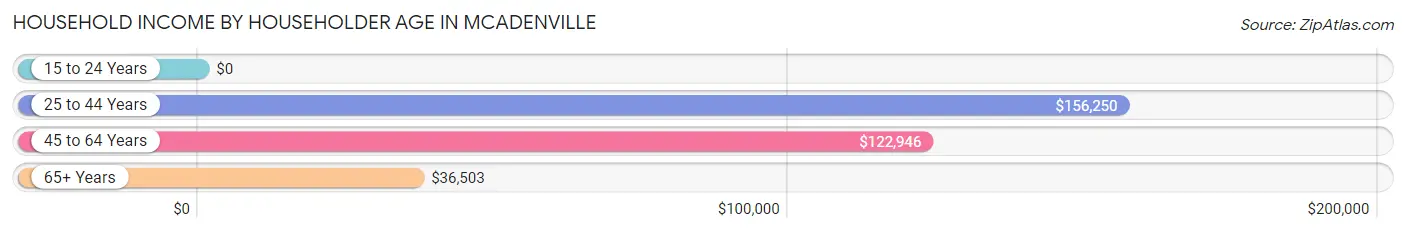
| Income Bracket | # Households | Median Income |
| 15 to 24 Years | 3 (0.6%) | $0 |
| 25 to 44 Years | 170 (35.0%) | $156,250 |
| 45 to 64 Years | 135 (27.8%) | $122,946 |
| 65+ Years | 177 (36.5%) | $36,503 |
| Total | 485 (100.0%) | $102,083 |
Poverty in McAdenville
Income Below Poverty by Sex and Age in McAdenville
With 3.6% poverty level for males and 2.9% for females among the residents of McAdenville, 18 to 24 year old males and 15 year old females are the most vulnerable to poverty, with 3 males (11.5%) and 4 females (44.4%) in their respective age groups living below the poverty level.
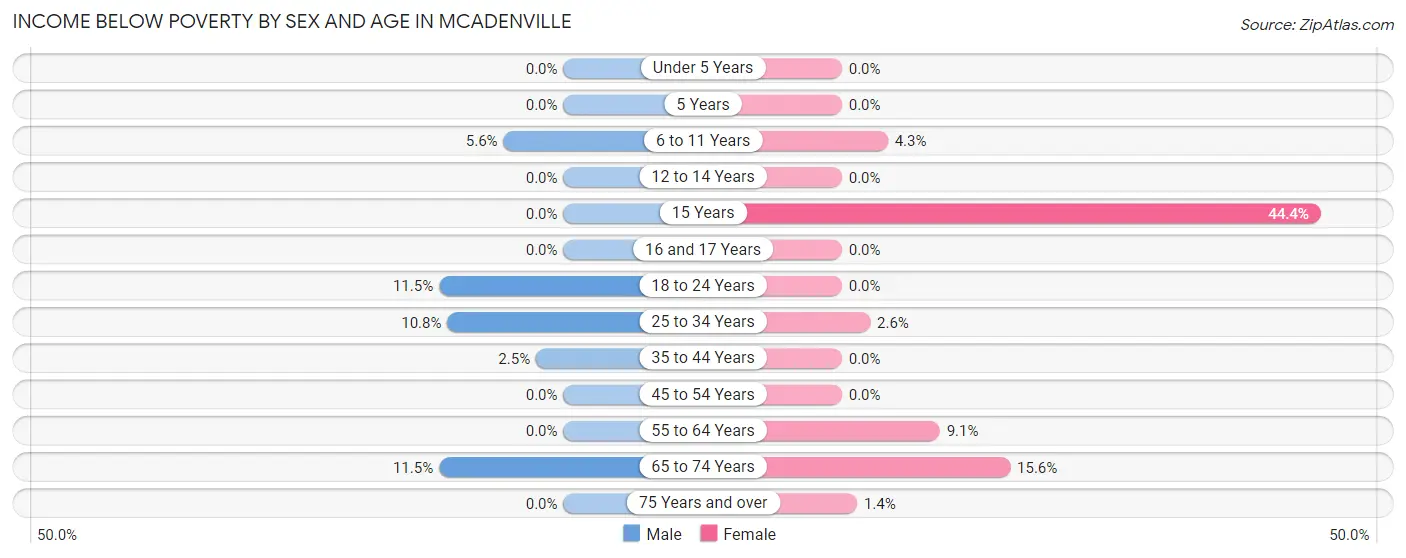
| Age Bracket | Male | Female |
| Under 5 Years | 0 (0.0%) | 0 (0.0%) |
| 5 Years | 0 (0.0%) | 0 (0.0%) |
| 6 to 11 Years | 2 (5.6%) | 2 (4.3%) |
| 12 to 14 Years | 0 (0.0%) | 0 (0.0%) |
| 15 Years | 0 (0.0%) | 4 (44.4%) |
| 16 and 17 Years | 0 (0.0%) | 0 (0.0%) |
| 18 to 24 Years | 3 (11.5%) | 0 (0.0%) |
| 25 to 34 Years | 7 (10.8%) | 2 (2.6%) |
| 35 to 44 Years | 3 (2.5%) | 0 (0.0%) |
| 45 to 54 Years | 0 (0.0%) | 0 (0.0%) |
| 55 to 64 Years | 0 (0.0%) | 3 (9.1%) |
| 65 to 74 Years | 3 (11.5%) | 5 (15.6%) |
| 75 Years and over | 0 (0.0%) | 2 (1.4%) |
| Total | 18 (3.6%) | 18 (2.9%) |
Income Above Poverty by Sex and Age in McAdenville
According to the poverty statistics in McAdenville, males aged under 5 years and females aged under 5 years are the age groups that are most secure financially, with 100.0% of males and 100.0% of females in these age groups living above the poverty line.
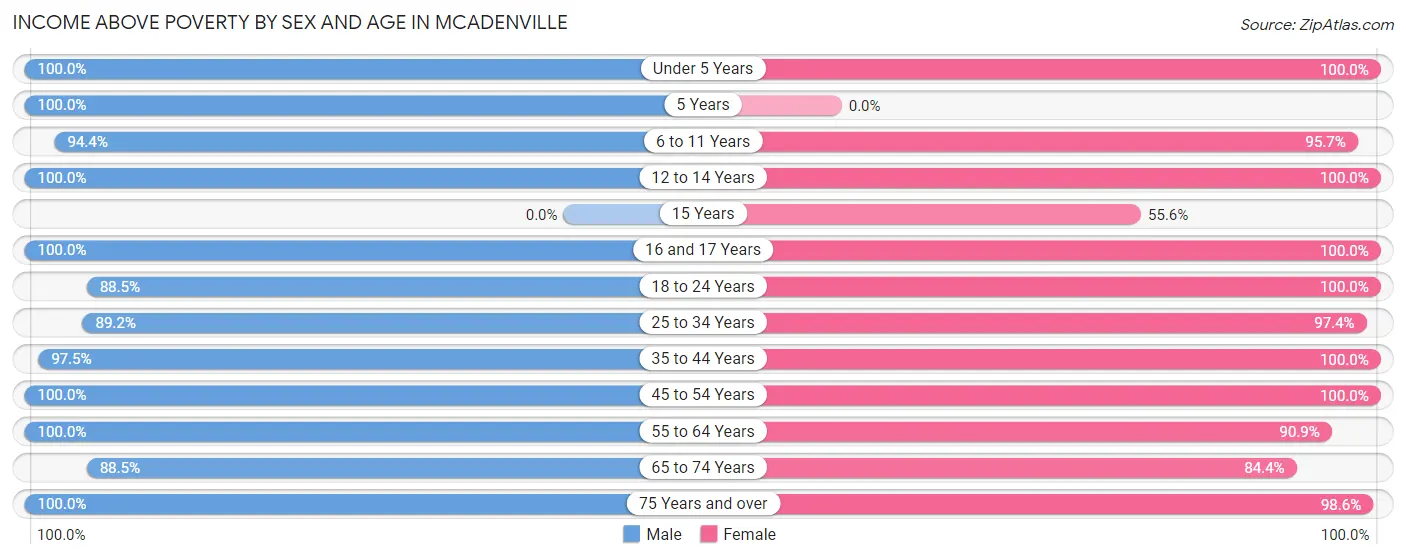
| Age Bracket | Male | Female |
| Under 5 Years | 25 (100.0%) | 38 (100.0%) |
| 5 Years | 7 (100.0%) | 0 (0.0%) |
| 6 to 11 Years | 34 (94.4%) | 45 (95.7%) |
| 12 to 14 Years | 55 (100.0%) | 14 (100.0%) |
| 15 Years | 0 (0.0%) | 5 (55.6%) |
| 16 and 17 Years | 11 (100.0%) | 9 (100.0%) |
| 18 to 24 Years | 23 (88.5%) | 15 (100.0%) |
| 25 to 34 Years | 58 (89.2%) | 74 (97.4%) |
| 35 to 44 Years | 115 (97.5%) | 145 (100.0%) |
| 45 to 54 Years | 96 (100.0%) | 63 (100.0%) |
| 55 to 64 Years | 17 (100.0%) | 30 (90.9%) |
| 65 to 74 Years | 23 (88.5%) | 27 (84.4%) |
| 75 Years and over | 20 (100.0%) | 140 (98.6%) |
| Total | 484 (96.4%) | 605 (97.1%) |
Income Below Poverty Among Married-Couple Families in McAdenville
The poverty statistics for married-couple families in McAdenville show that 2.1% or 6 of the total 284 families live below the poverty line. Families with 1 or 2 children have the highest poverty rate of 2.6%, comprising of 3 families. On the other hand, families with 3 or 4 children have the lowest poverty rate of 0.0%, which includes 0 families.
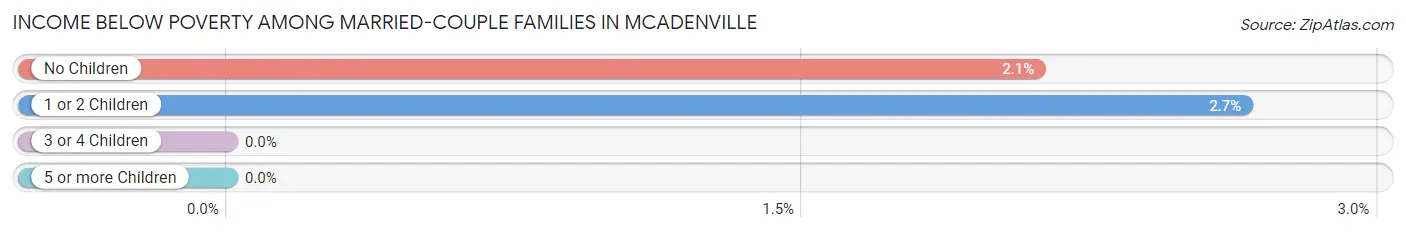
| Children | Above Poverty | Below Poverty |
| No Children | 139 (97.9%) | 3 (2.1%) |
| 1 or 2 Children | 110 (97.4%) | 3 (2.6%) |
| 3 or 4 Children | 29 (100.0%) | 0 (0.0%) |
| 5 or more Children | 0 (0.0%) | 0 (0.0%) |
| Total | 278 (97.9%) | 6 (2.1%) |
Income Below Poverty Among Single-Parent Households in McAdenville
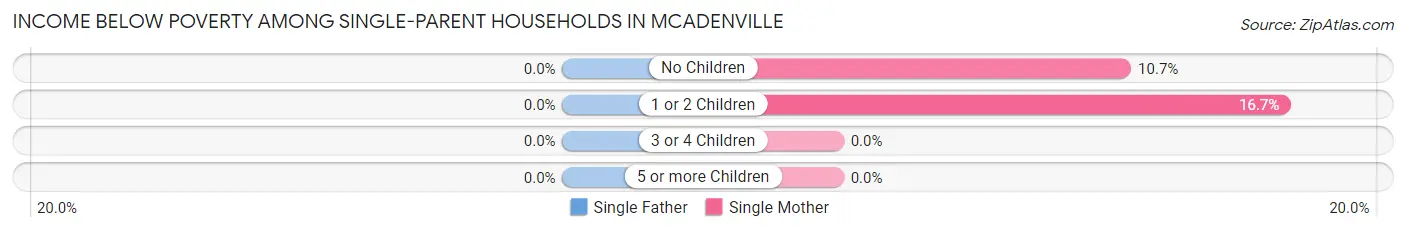
| Children | Single Father | Single Mother |
| No Children | 0 (0.0%) | 3 (10.7%) |
| 1 or 2 Children | 0 (0.0%) | 2 (16.7%) |
| 3 or 4 Children | 0 (0.0%) | 0 (0.0%) |
| 5 or more Children | 0 (0.0%) | 0 (0.0%) |
| Total | 0 (0.0%) | 5 (11.6%) |
Income Below Poverty Among Married-Couple vs Single-Parent Households in McAdenville
The poverty data for McAdenville shows that 6 of the married-couple family households (2.1%) and 5 of the single-parent households (10.4%) are living below the poverty level. Within the married-couple family households, those with 1 or 2 children have the highest poverty rate, with 3 households (2.6%) falling below the poverty line. Among the single-parent households, those with 1 or 2 children have the highest poverty rate, with 2 household (16.7%) living below poverty.
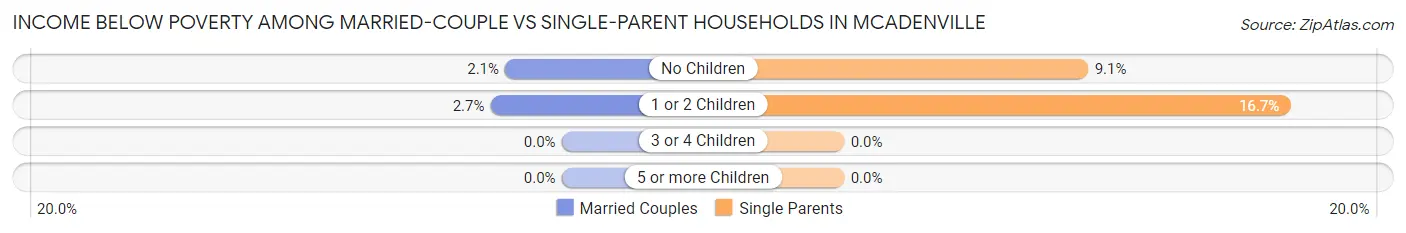
| Children | Married-Couple Families | Single-Parent Households |
| No Children | 3 (2.1%) | 3 (9.1%) |
| 1 or 2 Children | 3 (2.6%) | 2 (16.7%) |
| 3 or 4 Children | 0 (0.0%) | 0 (0.0%) |
| 5 or more Children | 0 (0.0%) | 0 (0.0%) |
| Total | 6 (2.1%) | 5 (10.4%) |
Race in McAdenville
The most populous races in McAdenville are White / Caucasian (1,053 | 93.6%), Black / African American (46 | 4.1%), and Two or more Races (22 | 2.0%).
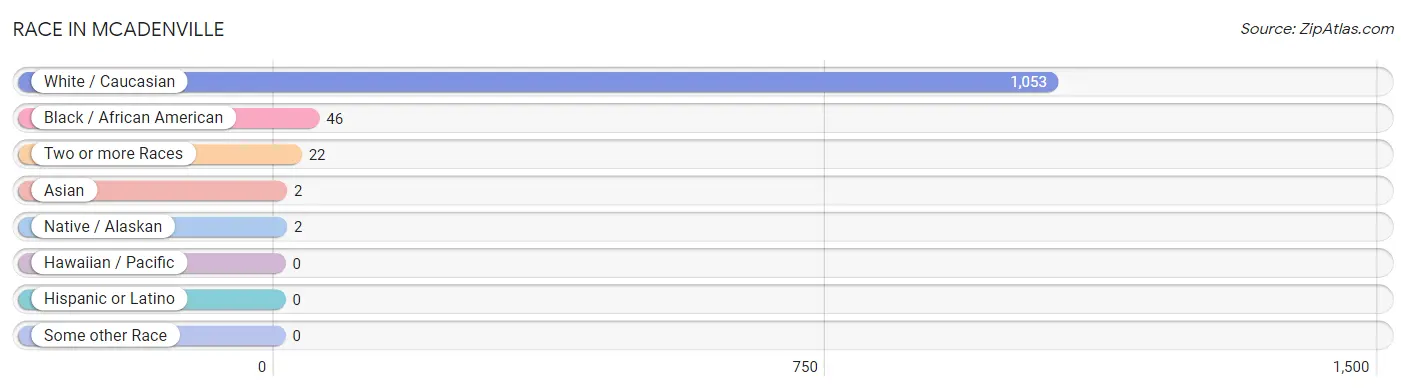
| Race | # Population | % Population |
| Asian | 2 | 0.2% |
| Black / African American | 46 | 4.1% |
| Hawaiian / Pacific | 0 | 0.0% |
| Hispanic or Latino | 0 | 0.0% |
| Native / Alaskan | 2 | 0.2% |
| White / Caucasian | 1,053 | 93.6% |
| Two or more Races | 22 | 2.0% |
| Some other Race | 0 | 0.0% |
| Total | 1,125 | 100.0% |
Ancestry in McAdenville
The most populous ancestries reported in McAdenville are German (287 | 25.5%), English (180 | 16.0%), Irish (136 | 12.1%), American (135 | 12.0%), and European (55 | 4.9%), together accounting for 70.5% of all McAdenville residents.
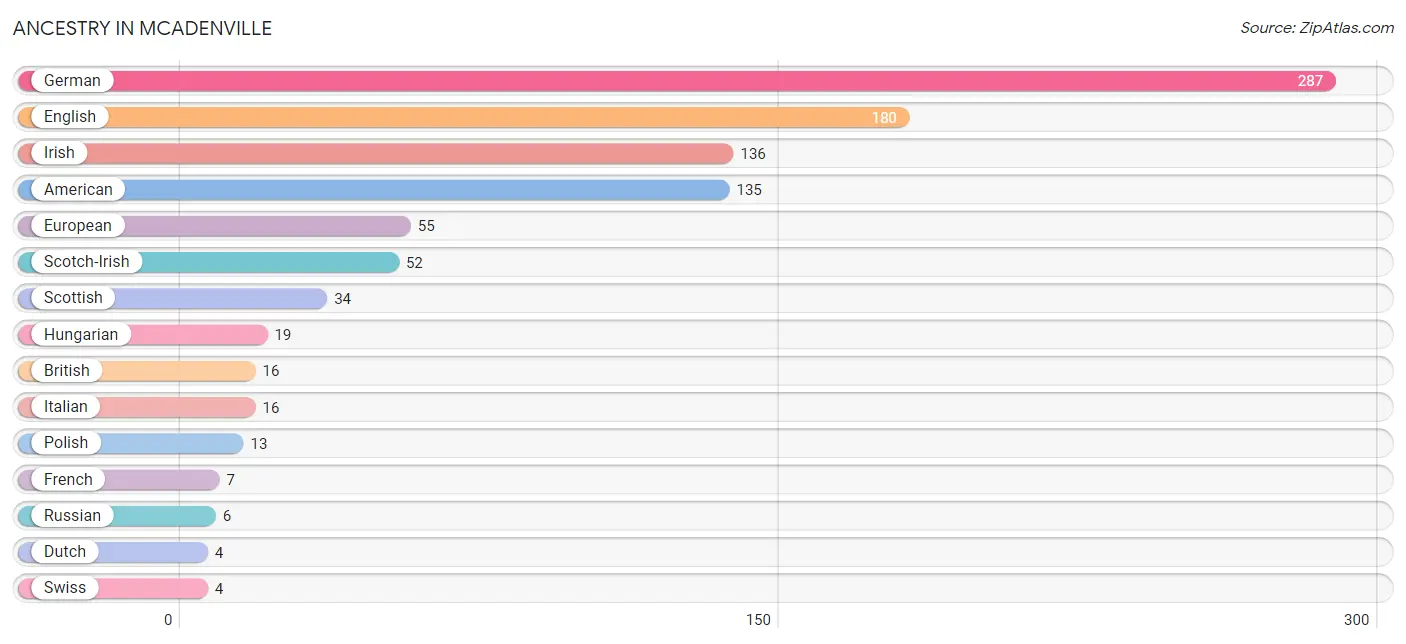
| Ancestry | # Population | % Population |
| American | 135 | 12.0% |
| British | 16 | 1.4% |
| Cherokee | 3 | 0.3% |
| Croatian | 2 | 0.2% |
| Czech | 3 | 0.3% |
| Dutch | 4 | 0.4% |
| English | 180 | 16.0% |
| European | 55 | 4.9% |
| French | 7 | 0.6% |
| French Canadian | 1 | 0.1% |
| German | 287 | 25.5% |
| Hungarian | 19 | 1.7% |
| Irish | 136 | 12.1% |
| Italian | 16 | 1.4% |
| Korean | 2 | 0.2% |
| Osage | 3 | 0.3% |
| Polish | 13 | 1.2% |
| Russian | 6 | 0.5% |
| Scotch-Irish | 52 | 4.6% |
| Scottish | 34 | 3.0% |
| Swedish | 3 | 0.3% |
| Swiss | 4 | 0.4% |
| Ukrainian | 3 | 0.3% |
| Welsh | 2 | 0.2% | View All 24 Rows |
Immigrants in McAdenville
The most numerous immigrant groups reported in McAdenville came from Europe (40 | 3.6%), Eastern Europe (29 | 2.6%), Romania (29 | 2.6%), France (11 | 1.0%), and Western Europe (11 | 1.0%), together accounting for 10.7% of all McAdenville residents.
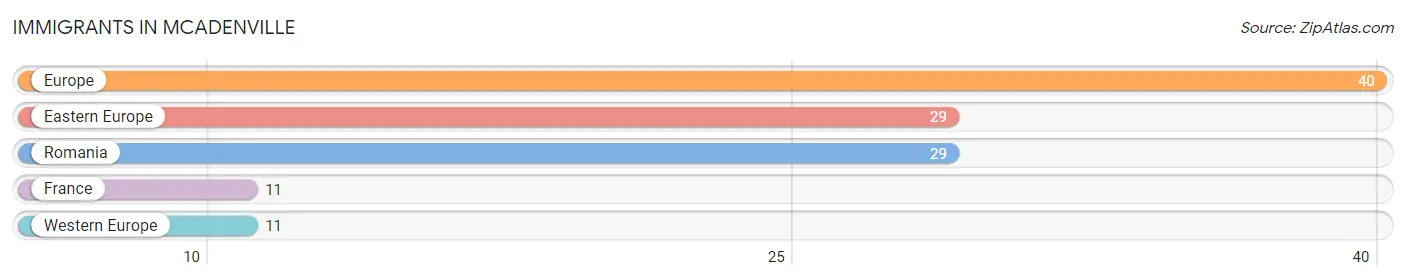
| Immigration Origin | # Population | % Population |
| Eastern Europe | 29 | 2.6% |
| Europe | 40 | 3.6% |
| France | 11 | 1.0% |
| Romania | 29 | 2.6% |
| Western Europe | 11 | 1.0% | View All 5 Rows |
Sex and Age in McAdenville
Sex and Age in McAdenville
The most populous age groups in McAdenville are 10 to 14 Years (69 | 13.8%) for men and 40 to 44 Years (94 | 15.1%) for women.
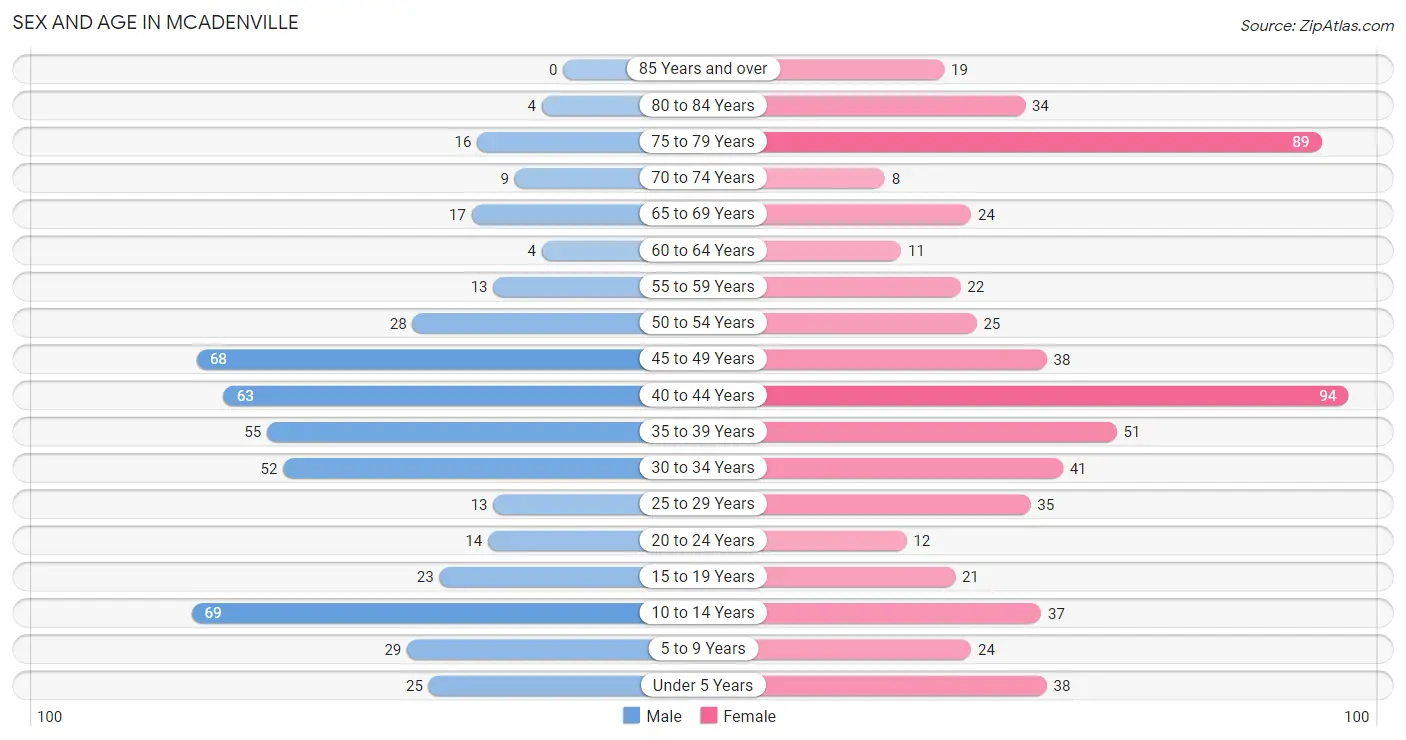
| Age Bracket | Male | Female |
| Under 5 Years | 25 (5.0%) | 38 (6.1%) |
| 5 to 9 Years | 29 (5.8%) | 24 (3.8%) |
| 10 to 14 Years | 69 (13.8%) | 37 (5.9%) |
| 15 to 19 Years | 23 (4.6%) | 21 (3.4%) |
| 20 to 24 Years | 14 (2.8%) | 12 (1.9%) |
| 25 to 29 Years | 13 (2.6%) | 35 (5.6%) |
| 30 to 34 Years | 52 (10.4%) | 41 (6.6%) |
| 35 to 39 Years | 55 (11.0%) | 51 (8.2%) |
| 40 to 44 Years | 63 (12.6%) | 94 (15.1%) |
| 45 to 49 Years | 68 (13.6%) | 38 (6.1%) |
| 50 to 54 Years | 28 (5.6%) | 25 (4.0%) |
| 55 to 59 Years | 13 (2.6%) | 22 (3.5%) |
| 60 to 64 Years | 4 (0.8%) | 11 (1.8%) |
| 65 to 69 Years | 17 (3.4%) | 24 (3.8%) |
| 70 to 74 Years | 9 (1.8%) | 8 (1.3%) |
| 75 to 79 Years | 16 (3.2%) | 89 (14.3%) |
| 80 to 84 Years | 4 (0.8%) | 34 (5.5%) |
| 85 Years and over | 0 (0.0%) | 19 (3.0%) |
| Total | 502 (100.0%) | 623 (100.0%) |
Families and Households in McAdenville
Median Family Size in McAdenville
The median family size in McAdenville is 2.85 persons per family, with married-couple families (284 | 85.5%) accounting for the largest median family size of 2.89 persons per family. On the other hand, single male/father families (5 | 1.5%) represent the smallest median family size with 2.40 persons per family.
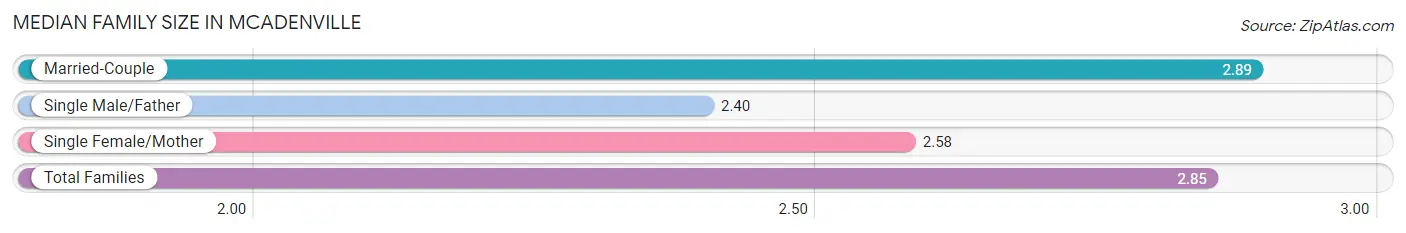
| Family Type | # Families | Family Size |
| Married-Couple | 284 (85.5%) | 2.89 |
| Single Male/Father | 5 (1.5%) | 2.40 |
| Single Female/Mother | 43 (13.0%) | 2.58 |
| Total Families | 332 (100.0%) | 2.85 |
Median Household Size in McAdenville
The median household size in McAdenville is 2.32 persons per household, with married-couple households (284 | 58.6%) accounting for the largest median household size of 2.91 persons per household. non-family households (153 | 31.6%) represent the smallest median household size with 1.07 persons per household.
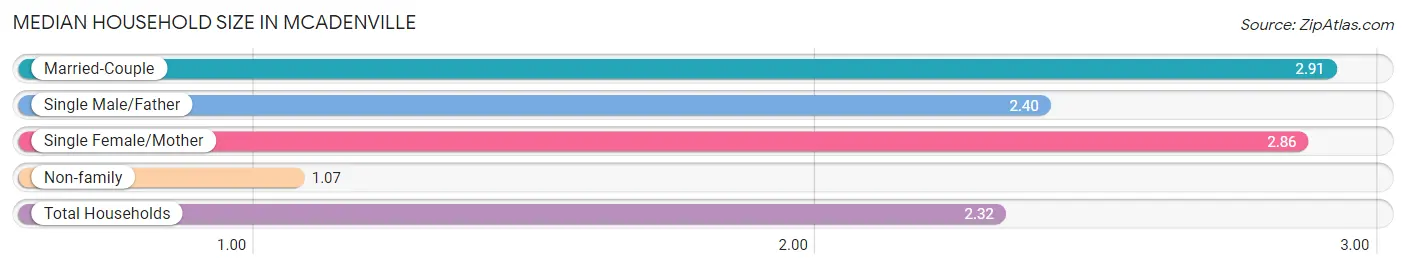
| Household Type | # Households | Household Size |
| Married-Couple | 284 (58.6%) | 2.91 |
| Single Male/Father | 5 (1.0%) | 2.40 |
| Single Female/Mother | 43 (8.9%) | 2.86 |
| Non-family | 153 (31.6%) | 1.07 |
| Total Households | 485 (100.0%) | 2.32 |
Household Size by Marriage Status in McAdenville
Out of a total of 485 households in McAdenville, 332 (68.4%) are family households, while 153 (31.6%) are nonfamily households. The most numerous type of family households are 2-person households, comprising 148, and the most common type of nonfamily households are 1-person households, comprising 141.
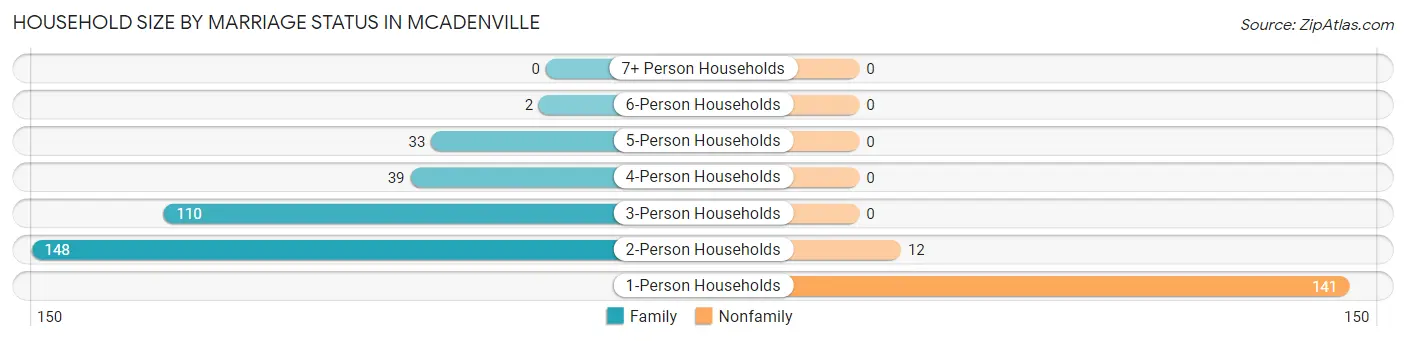
| Household Size | Family Households | Nonfamily Households |
| 1-Person Households | - | 141 (29.1%) |
| 2-Person Households | 148 (30.5%) | 12 (2.5%) |
| 3-Person Households | 110 (22.7%) | 0 (0.0%) |
| 4-Person Households | 39 (8.0%) | 0 (0.0%) |
| 5-Person Households | 33 (6.8%) | 0 (0.0%) |
| 6-Person Households | 2 (0.4%) | 0 (0.0%) |
| 7+ Person Households | 0 (0.0%) | 0 (0.0%) |
| Total | 332 (68.4%) | 153 (31.6%) |
Female Fertility in McAdenville
Fertility by Age in McAdenville
Average fertility rate in McAdenville is 37.0 births per 1,000 women. Women in the age bracket of 20 to 34 years have the highest fertility rate with 125.0 births per 1,000 women. Women in the age bracket of 20 to 34 years acount for 100.0% of all women with births.
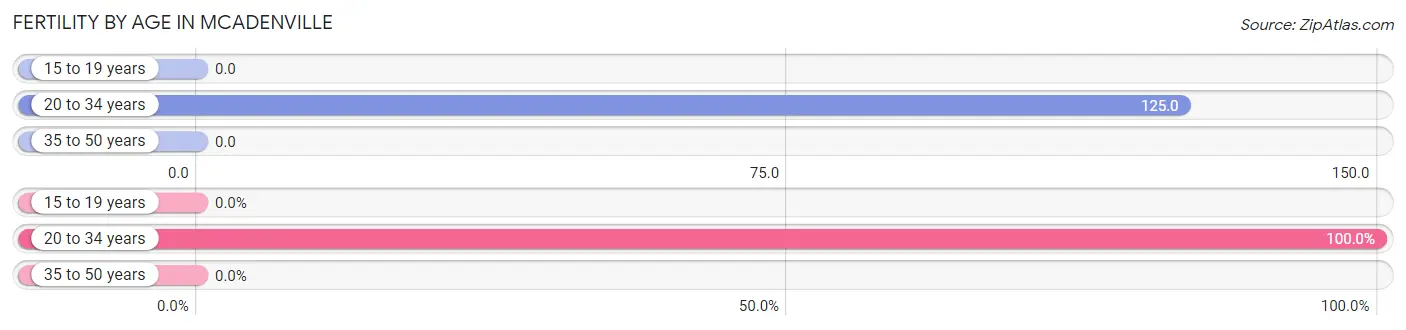
| Age Bracket | Women with Births | Births / 1,000 Women |
| 15 to 19 years | 0 (0.0%) | 0.0 |
| 20 to 34 years | 11 (100.0%) | 125.0 |
| 35 to 50 years | 0 (0.0%) | 0.0 |
| Total | 11 (100.0%) | 37.0 |
Fertility by Age by Marriage Status in McAdenville
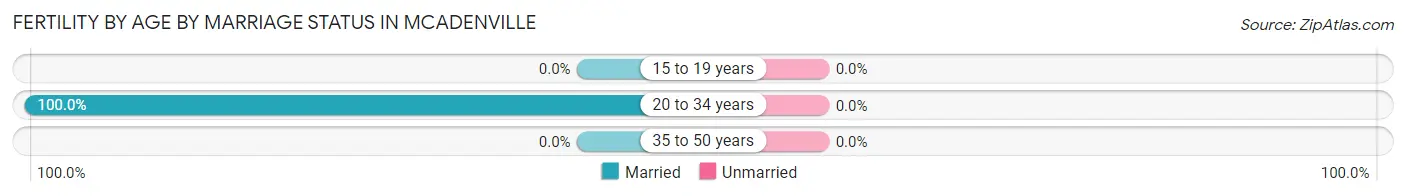
| Age Bracket | Married | Unmarried |
| 15 to 19 years | 0 (0.0%) | 0 (0.0%) |
| 20 to 34 years | 11 (100.0%) | 0 (0.0%) |
| 35 to 50 years | 0 (0.0%) | 0 (0.0%) |
| Total | 11 (100.0%) | 0 (0.0%) |
Fertility by Education in McAdenville
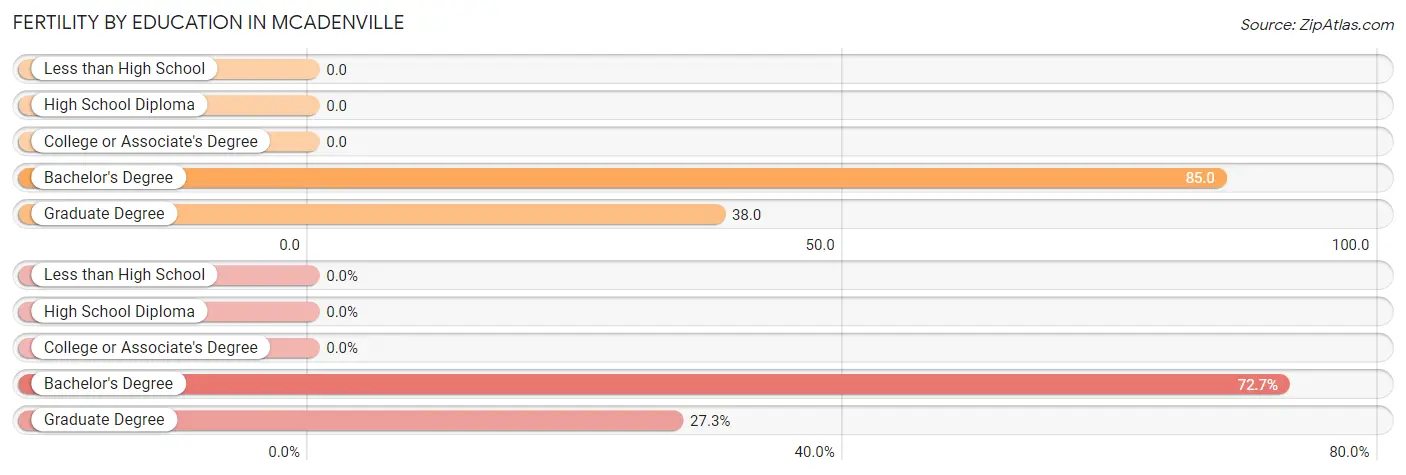
| Educational Attainment | Women with Births | Births / 1,000 Women |
| Less than High School | 0 (0.0%) | 0.0 |
| High School Diploma | 0 (0.0%) | 0.0 |
| College or Associate's Degree | 0 (0.0%) | 0.0 |
| Bachelor's Degree | 8 (72.7%) | 85.0 |
| Graduate Degree | 3 (27.3%) | 38.0 |
| Total | 11 (100.0%) | 37.0 |
Fertility by Education by Marriage Status in McAdenville
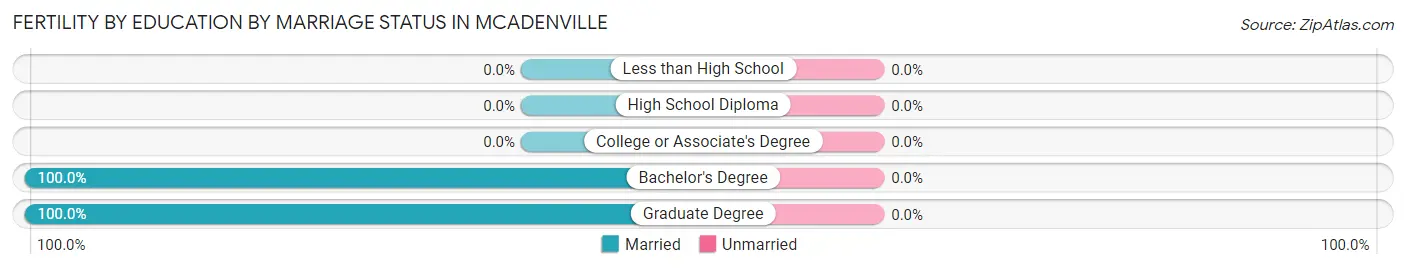
| Educational Attainment | Married | Unmarried |
| Less than High School | 0 (0.0%) | 0 (0.0%) |
| High School Diploma | 0 (0.0%) | 0 (0.0%) |
| College or Associate's Degree | 0 (0.0%) | 0 (0.0%) |
| Bachelor's Degree | 8 (100.0%) | 0 (0.0%) |
| Graduate Degree | 3 (100.0%) | 0 (0.0%) |
| Total | 11 (100.0%) | 0 (0.0%) |
Employment Characteristics in McAdenville
Employment by Class of Employer in McAdenville
Among the 542 employed individuals in McAdenville, private company employees (374 | 69.0%), not-for-profit organizations (55 | 10.2%), and state government employees (39 | 7.2%) make up the most common classes of employment.
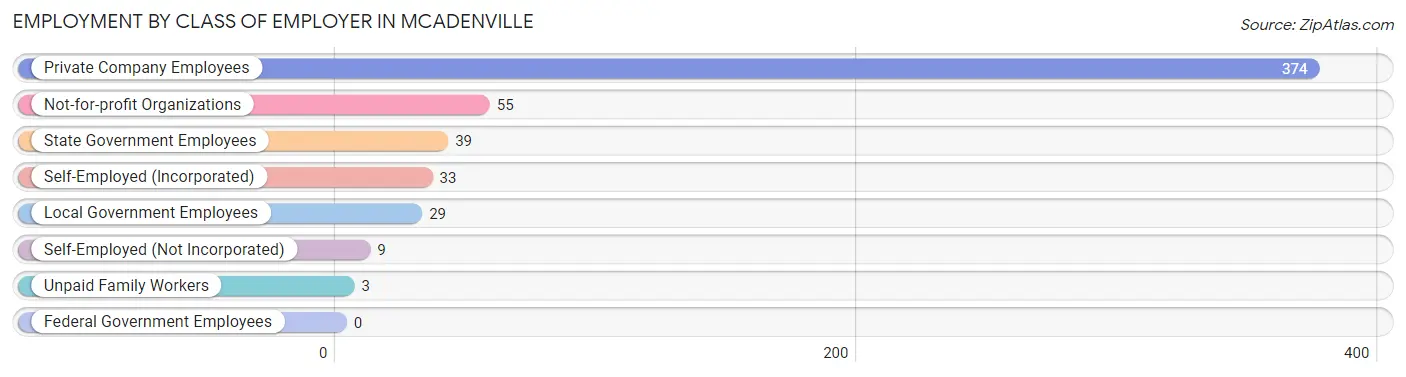
| Employer Class | # Employees | % Employees |
| Private Company Employees | 374 | 69.0% |
| Self-Employed (Incorporated) | 33 | 6.1% |
| Self-Employed (Not Incorporated) | 9 | 1.7% |
| Not-for-profit Organizations | 55 | 10.2% |
| Local Government Employees | 29 | 5.3% |
| State Government Employees | 39 | 7.2% |
| Federal Government Employees | 0 | 0.0% |
| Unpaid Family Workers | 3 | 0.5% |
| Total | 542 | 100.0% |
Employment Status by Age in McAdenville
According to the labor force statistics for McAdenville, out of the total population over 16 years of age (894), 63.8% or 570 individuals are in the labor force, with 3.7% or 21 of them unemployed. The age group with the highest labor force participation rate is 45 to 54 years, with 96.2% or 153 individuals in the labor force. Within the labor force, the 55 to 59 years age range has the highest percentage of unemployed individuals, with 33.3% or 9 of them being unemployed.
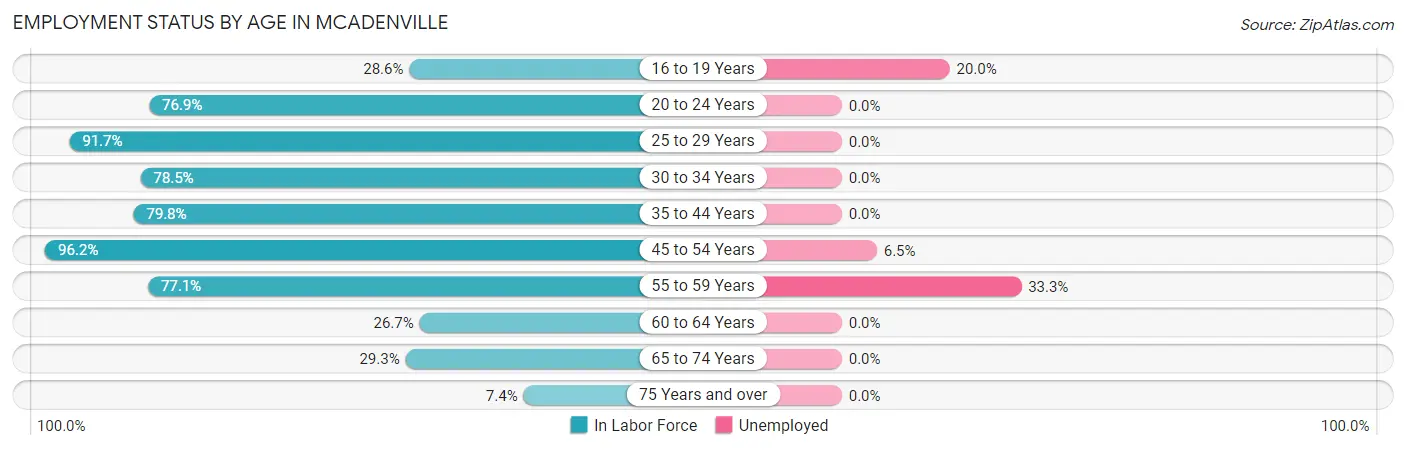
| Age Bracket | In Labor Force | Unemployed |
| 16 to 19 Years | 10 (28.6%) | 2 (20.0%) |
| 20 to 24 Years | 20 (76.9%) | 0 (0.0%) |
| 25 to 29 Years | 44 (91.7%) | 0 (0.0%) |
| 30 to 34 Years | 73 (78.5%) | 0 (0.0%) |
| 35 to 44 Years | 210 (79.8%) | 0 (0.0%) |
| 45 to 54 Years | 153 (96.2%) | 10 (6.5%) |
| 55 to 59 Years | 27 (77.1%) | 9 (33.3%) |
| 60 to 64 Years | 4 (26.7%) | 0 (0.0%) |
| 65 to 74 Years | 17 (29.3%) | 0 (0.0%) |
| 75 Years and over | 12 (7.4%) | 0 (0.0%) |
| Total | 570 (63.8%) | 21 (3.7%) |
Employment Status by Educational Attainment in McAdenville
According to labor force statistics for McAdenville, 83.4% of individuals (511) out of the total population between 25 and 64 years of age (613) are in the labor force, with 3.7% or 19 of them being unemployed. The group with the highest labor force participation rate are those with the educational attainment of college / associate degree, with 92.9% or 105 individuals in the labor force. Within the labor force, individuals with college / associate degree education have the highest percentage of unemployment, with 18.1% or 19 of them being unemployed.
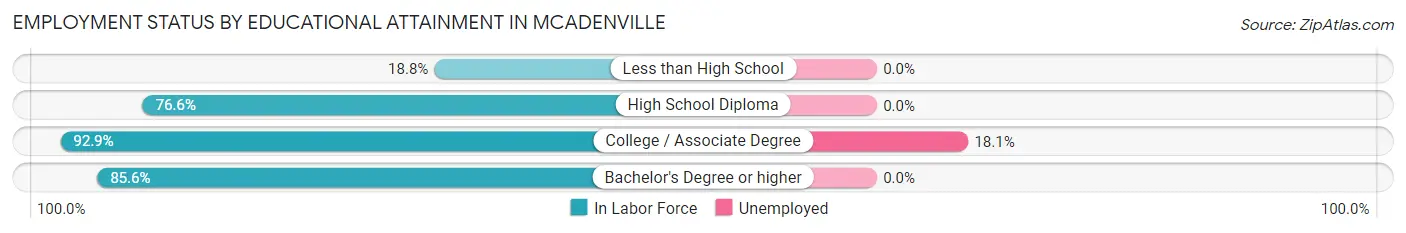
| Educational Attainment | In Labor Force | Unemployed |
| Less than High School | 3 (18.8%) | 0 (0.0%) |
| High School Diploma | 95 (76.6%) | 0 (0.0%) |
| College / Associate Degree | 105 (92.9%) | 20 (18.1%) |
| Bachelor's Degree or higher | 308 (85.6%) | 0 (0.0%) |
| Total | 511 (83.4%) | 23 (3.7%) |
Employment Occupations by Sex in McAdenville
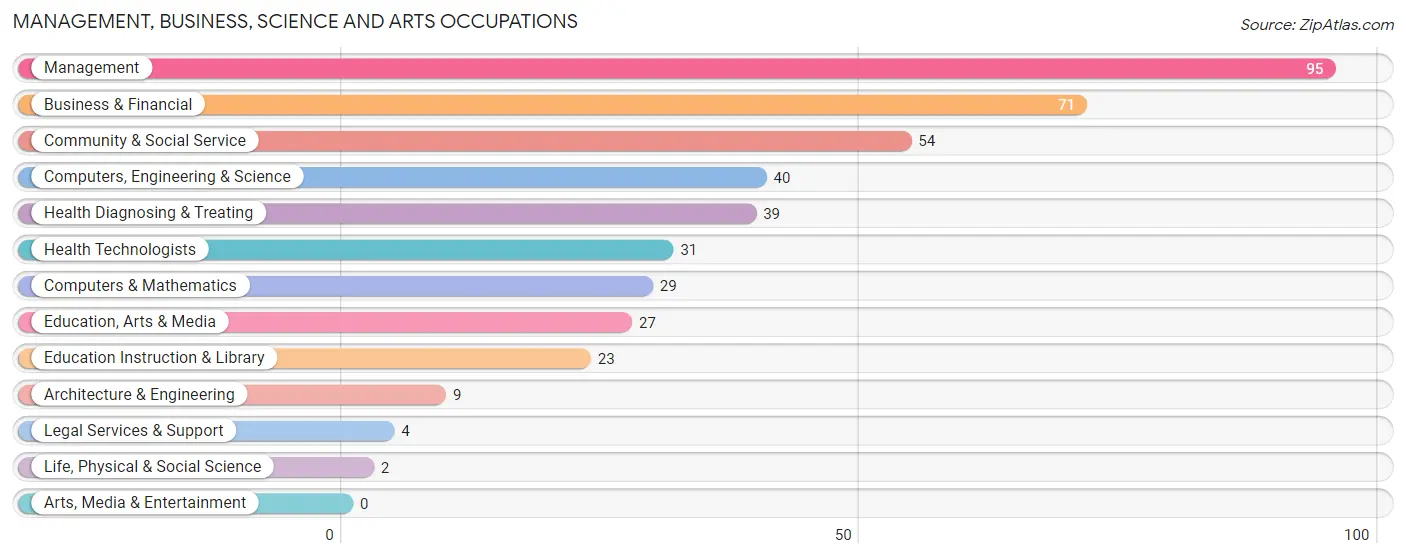
Management, Business, Science and Arts Occupations
The most common Management, Business, Science and Arts occupations in McAdenville are Management (95 | 17.3%), Business & Financial (71 | 12.9%), Community & Social Service (54 | 9.8%), Computers, Engineering & Science (40 | 7.3%), and Health Diagnosing & Treating (39 | 7.1%).
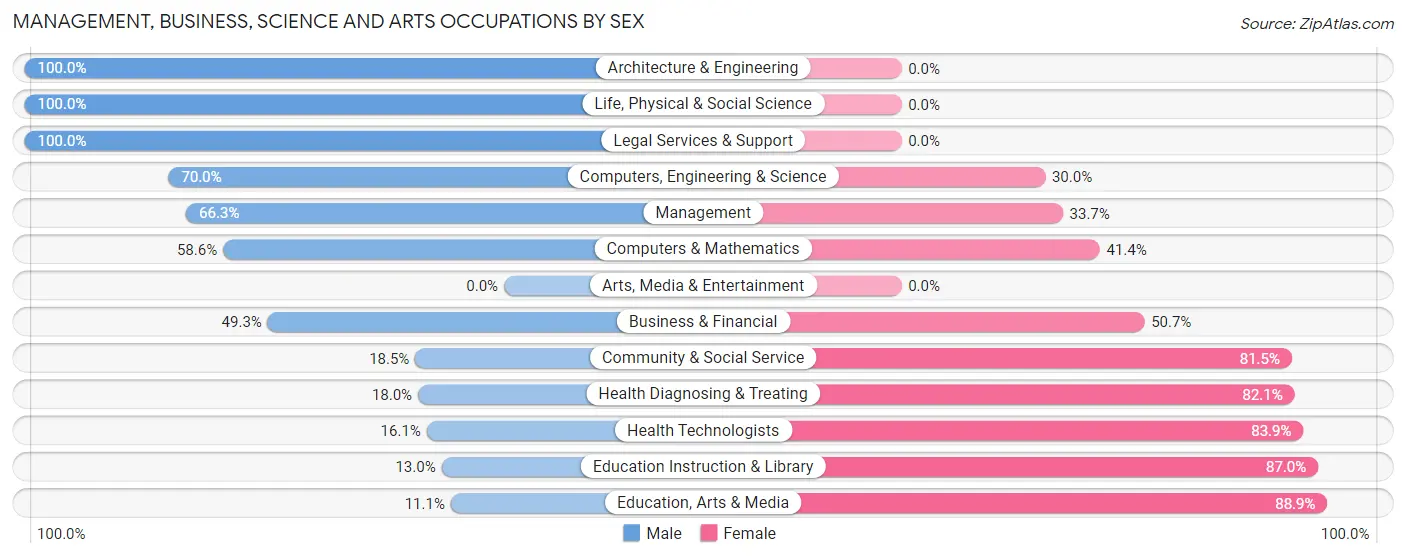
Management, Business, Science and Arts Occupations by Sex
Within the Management, Business, Science and Arts occupations in McAdenville, the most male-oriented occupations are Architecture & Engineering (100.0%), Life, Physical & Social Science (100.0%), and Legal Services & Support (100.0%), while the most female-oriented occupations are Education, Arts & Media (88.9%), Education Instruction & Library (87.0%), and Health Technologists (83.9%).
| Occupation | Male | Female |
| Management | 63 (66.3%) | 32 (33.7%) |
| Business & Financial | 35 (49.3%) | 36 (50.7%) |
| Computers, Engineering & Science | 28 (70.0%) | 12 (30.0%) |
| Computers & Mathematics | 17 (58.6%) | 12 (41.4%) |
| Architecture & Engineering | 9 (100.0%) | 0 (0.0%) |
| Life, Physical & Social Science | 2 (100.0%) | 0 (0.0%) |
| Community & Social Service | 10 (18.5%) | 44 (81.5%) |
| Education, Arts & Media | 3 (11.1%) | 24 (88.9%) |
| Legal Services & Support | 4 (100.0%) | 0 (0.0%) |
| Education Instruction & Library | 3 (13.0%) | 20 (87.0%) |
| Arts, Media & Entertainment | 0 (0.0%) | 0 (0.0%) |
| Health Diagnosing & Treating | 7 (17.9%) | 32 (82.1%) |
| Health Technologists | 5 (16.1%) | 26 (83.9%) |
| Total (Category) | 143 (47.8%) | 156 (52.2%) |
| Total (Overall) | 321 (58.5%) | 228 (41.5%) |
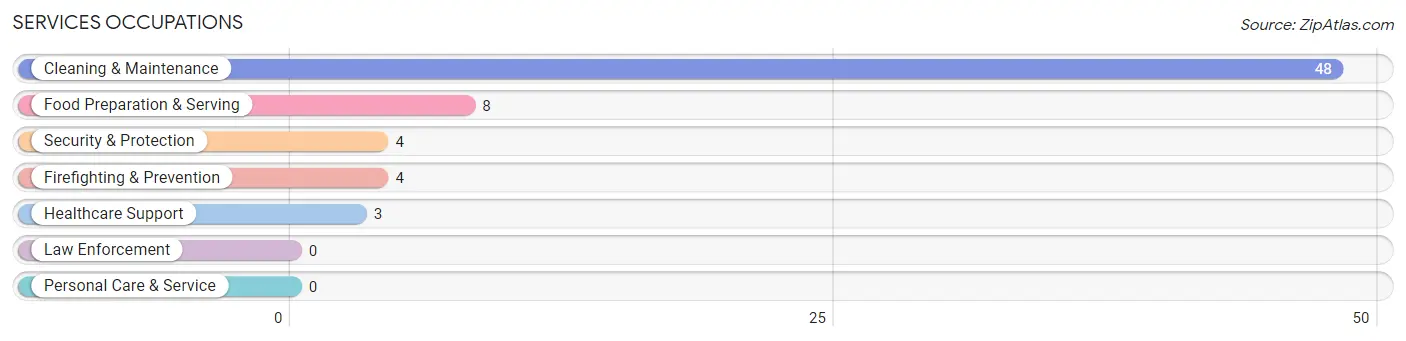
Services Occupations
The most common Services occupations in McAdenville are Cleaning & Maintenance (48 | 8.7%), Food Preparation & Serving (8 | 1.5%), Security & Protection (4 | 0.7%), Firefighting & Prevention (4 | 0.7%), and Healthcare Support (3 | 0.5%).
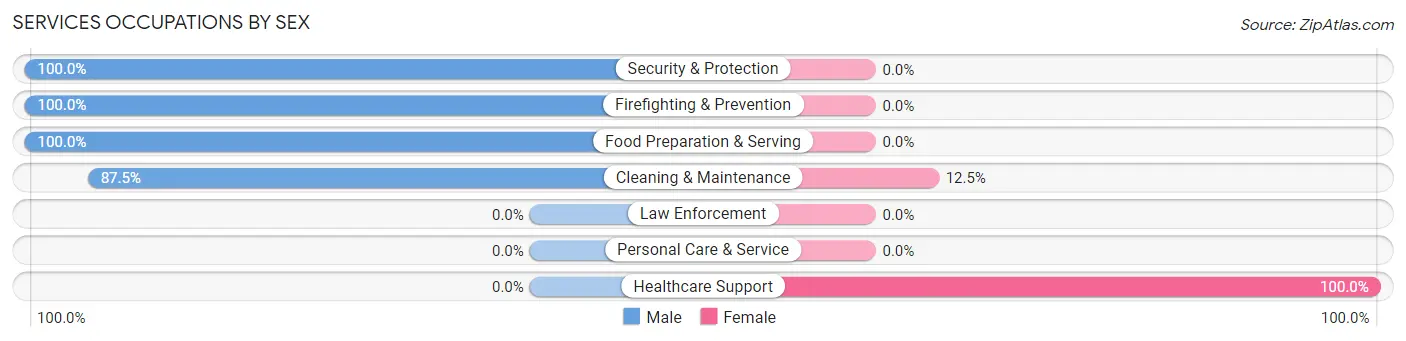
Services Occupations by Sex
Within the Services occupations in McAdenville, the most male-oriented occupations are Security & Protection (100.0%), Firefighting & Prevention (100.0%), and Food Preparation & Serving (100.0%), while the most female-oriented occupations are Healthcare Support (100.0%), and Cleaning & Maintenance (12.5%).
| Occupation | Male | Female |
| Healthcare Support | 0 (0.0%) | 3 (100.0%) |
| Security & Protection | 4 (100.0%) | 0 (0.0%) |
| Firefighting & Prevention | 4 (100.0%) | 0 (0.0%) |
| Law Enforcement | 0 (0.0%) | 0 (0.0%) |
| Food Preparation & Serving | 8 (100.0%) | 0 (0.0%) |
| Cleaning & Maintenance | 42 (87.5%) | 6 (12.5%) |
| Personal Care & Service | 0 (0.0%) | 0 (0.0%) |
| Total (Category) | 54 (85.7%) | 9 (14.3%) |
| Total (Overall) | 321 (58.5%) | 228 (41.5%) |
Sales and Office Occupations
The most common Sales and Office occupations in McAdenville are Sales & Related (45 | 8.2%), and Office & Administration (26 | 4.7%).

Sales and Office Occupations by Sex
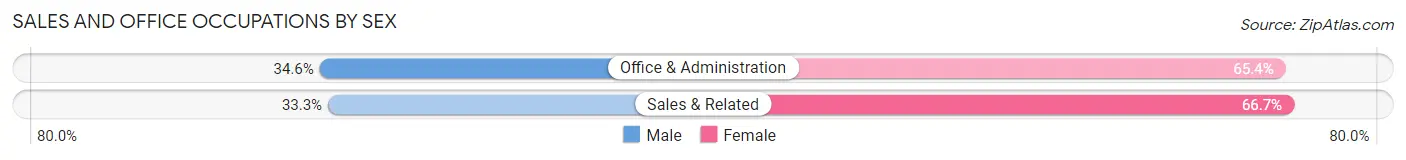
| Occupation | Male | Female |
| Sales & Related | 15 (33.3%) | 30 (66.7%) |
| Office & Administration | 9 (34.6%) | 17 (65.4%) |
| Total (Category) | 24 (33.8%) | 47 (66.2%) |
| Total (Overall) | 321 (58.5%) | 228 (41.5%) |
Natural Resources, Construction and Maintenance Occupations
The most common Natural Resources, Construction and Maintenance occupations in McAdenville are Construction & Extraction (28 | 5.1%), and Installation, Maintenance & Repair (9 | 1.6%).
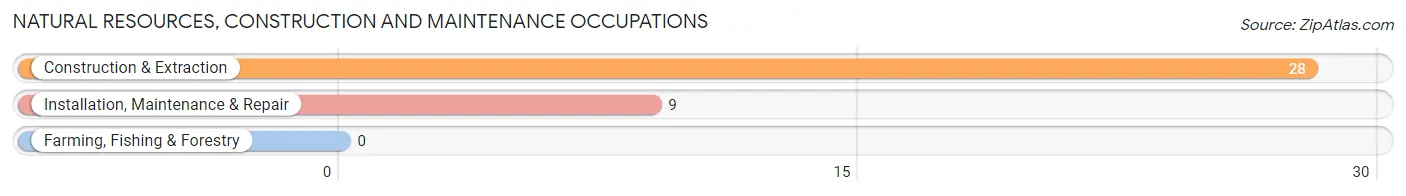
Natural Resources, Construction and Maintenance Occupations by Sex

| Occupation | Male | Female |
| Farming, Fishing & Forestry | 0 (0.0%) | 0 (0.0%) |
| Construction & Extraction | 28 (100.0%) | 0 (0.0%) |
| Installation, Maintenance & Repair | 9 (100.0%) | 0 (0.0%) |
| Total (Category) | 37 (100.0%) | 0 (0.0%) |
| Total (Overall) | 321 (58.5%) | 228 (41.5%) |
Production, Transportation and Moving Occupations
The most common Production, Transportation and Moving occupations in McAdenville are Production (64 | 11.7%), Material Moving (10 | 1.8%), and Transportation (5 | 0.9%).
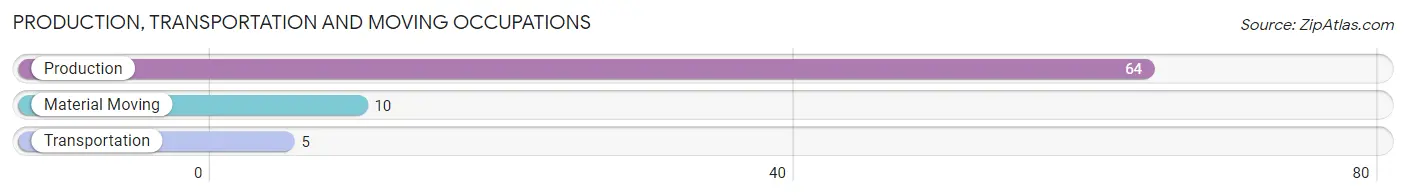
Production, Transportation and Moving Occupations by Sex
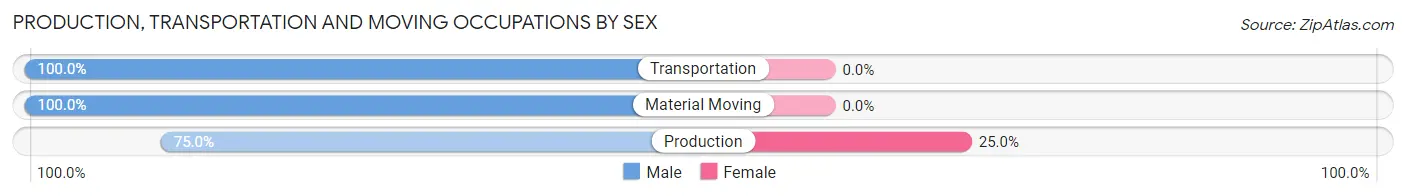
| Occupation | Male | Female |
| Production | 48 (75.0%) | 16 (25.0%) |
| Transportation | 5 (100.0%) | 0 (0.0%) |
| Material Moving | 10 (100.0%) | 0 (0.0%) |
| Total (Category) | 63 (79.7%) | 16 (20.3%) |
| Total (Overall) | 321 (58.5%) | 228 (41.5%) |
Employment Industries by Sex in McAdenville
Employment Industries in McAdenville
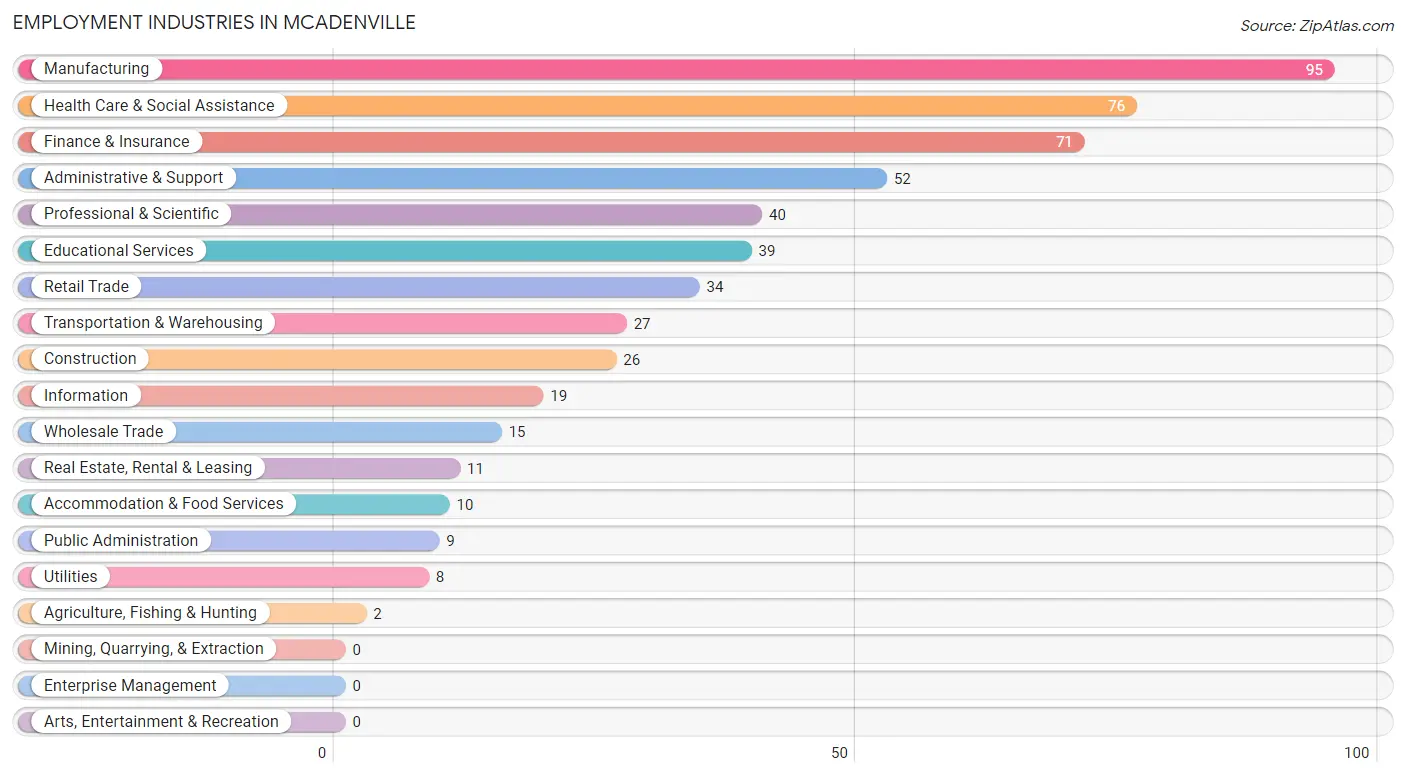
The major employment industries in McAdenville include Manufacturing (95 | 17.3%), Health Care & Social Assistance (76 | 13.8%), Finance & Insurance (71 | 12.9%), Administrative & Support (52 | 9.5%), and Professional & Scientific (40 | 7.3%).
Employment Industries by Sex in McAdenville
The McAdenville industries that see more men than women are Agriculture, Fishing & Hunting (100.0%), Construction (100.0%), and Information (100.0%), whereas the industries that tend to have a higher number of women are Wholesale Trade (100.0%), Educational Services (92.3%), and Health Care & Social Assistance (73.7%).
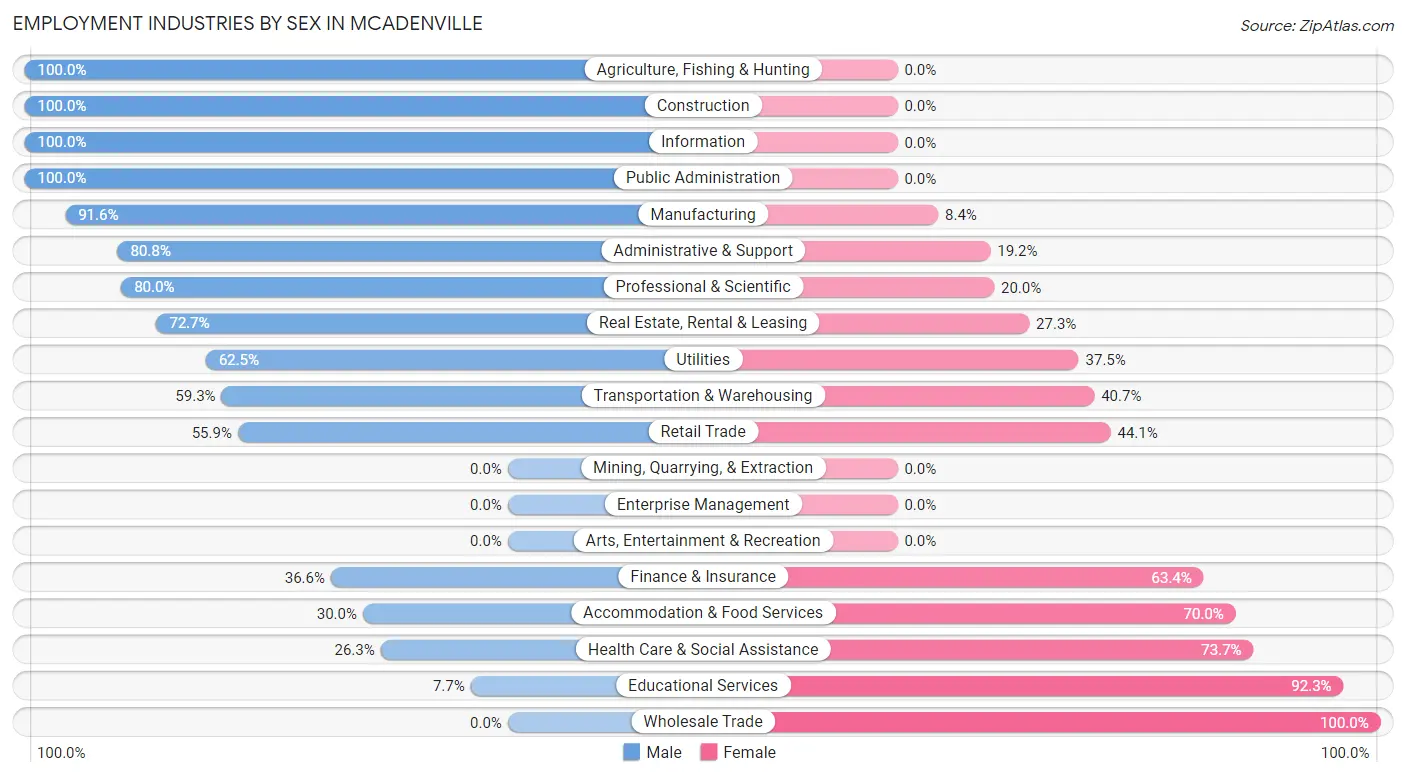
| Industry | Male | Female |
| Agriculture, Fishing & Hunting | 2 (100.0%) | 0 (0.0%) |
| Mining, Quarrying, & Extraction | 0 (0.0%) | 0 (0.0%) |
| Construction | 26 (100.0%) | 0 (0.0%) |
| Manufacturing | 87 (91.6%) | 8 (8.4%) |
| Wholesale Trade | 0 (0.0%) | 15 (100.0%) |
| Retail Trade | 19 (55.9%) | 15 (44.1%) |
| Transportation & Warehousing | 16 (59.3%) | 11 (40.7%) |
| Utilities | 5 (62.5%) | 3 (37.5%) |
| Information | 19 (100.0%) | 0 (0.0%) |
| Finance & Insurance | 26 (36.6%) | 45 (63.4%) |
| Real Estate, Rental & Leasing | 8 (72.7%) | 3 (27.3%) |
| Professional & Scientific | 32 (80.0%) | 8 (20.0%) |
| Enterprise Management | 0 (0.0%) | 0 (0.0%) |
| Administrative & Support | 42 (80.8%) | 10 (19.2%) |
| Educational Services | 3 (7.7%) | 36 (92.3%) |
| Health Care & Social Assistance | 20 (26.3%) | 56 (73.7%) |
| Arts, Entertainment & Recreation | 0 (0.0%) | 0 (0.0%) |
| Accommodation & Food Services | 3 (30.0%) | 7 (70.0%) |
| Public Administration | 9 (100.0%) | 0 (0.0%) |
| Total | 321 (58.5%) | 228 (41.5%) |
Education in McAdenville
School Enrollment in McAdenville
The most common levels of schooling among the 242 students in McAdenville are middle school (98 | 40.5%), elementary school (52 | 21.5%), and high school (39 | 16.1%).
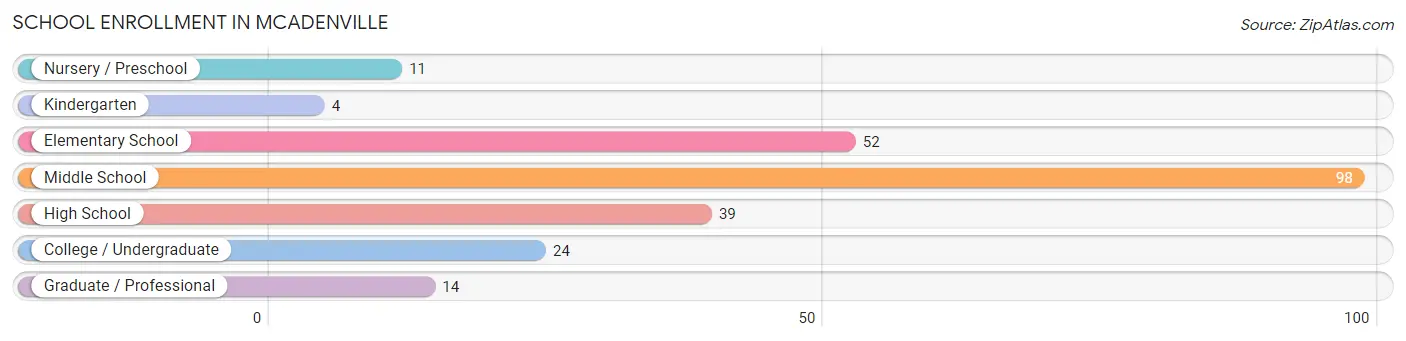
| School Level | # Students | % Students |
| Nursery / Preschool | 11 | 4.5% |
| Kindergarten | 4 | 1.7% |
| Elementary School | 52 | 21.5% |
| Middle School | 98 | 40.5% |
| High School | 39 | 16.1% |
| College / Undergraduate | 24 | 9.9% |
| Graduate / Professional | 14 | 5.8% |
| Total | 242 | 100.0% |
School Enrollment by Age by Funding Source in McAdenville
Out of a total of 242 students who are enrolled in schools in McAdenville, 88 (36.4%) attend a private institution, while the remaining 154 (63.6%) are enrolled in public schools. The age group of 10 to 14 year olds has the highest likelihood of being enrolled in private schools, with 59 (55.7% in the age bracket) enrolled. Conversely, the age group of 18 to 19 year olds has the lowest likelihood of being enrolled in a private school, with 15 (100.0% in the age bracket) attending a public institution.
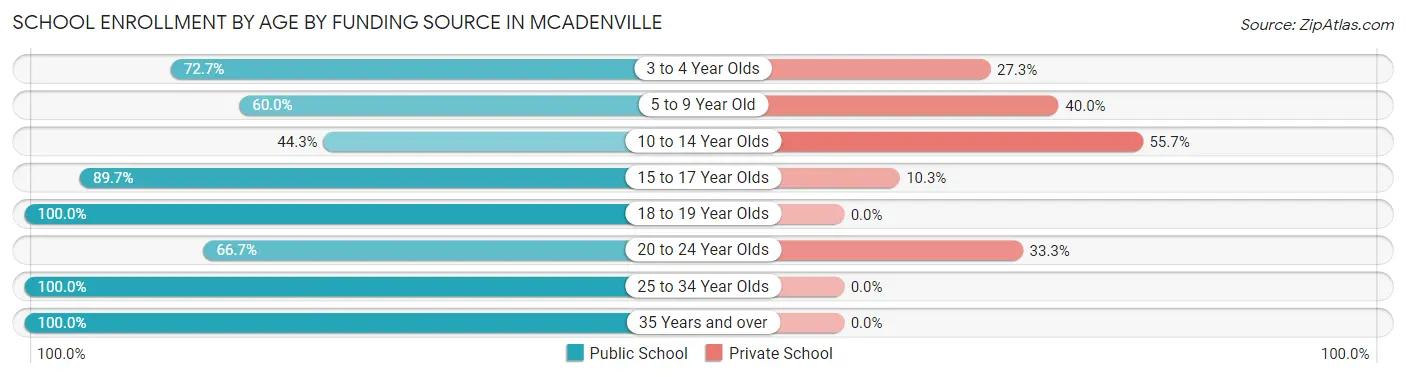
| Age Bracket | Public School | Private School |
| 3 to 4 Year Olds | 8 (72.7%) | 3 (27.3%) |
| 5 to 9 Year Old | 30 (60.0%) | 20 (40.0%) |
| 10 to 14 Year Olds | 47 (44.3%) | 59 (55.7%) |
| 15 to 17 Year Olds | 26 (89.7%) | 3 (10.3%) |
| 18 to 19 Year Olds | 15 (100.0%) | 0 (0.0%) |
| 20 to 24 Year Olds | 6 (66.7%) | 3 (33.3%) |
| 25 to 34 Year Olds | 9 (100.0%) | 0 (0.0%) |
| 35 Years and over | 13 (100.0%) | 0 (0.0%) |
| Total | 154 (63.6%) | 88 (36.4%) |
Educational Attainment by Field of Study in McAdenville
Business (130 | 25.2%), education (122 | 23.6%), arts & humanities (72 | 14.0%), psychology (50 | 9.7%), and social sciences (26 | 5.0%) are the most common fields of study among 516 individuals in McAdenville who have obtained a bachelor's degree or higher.
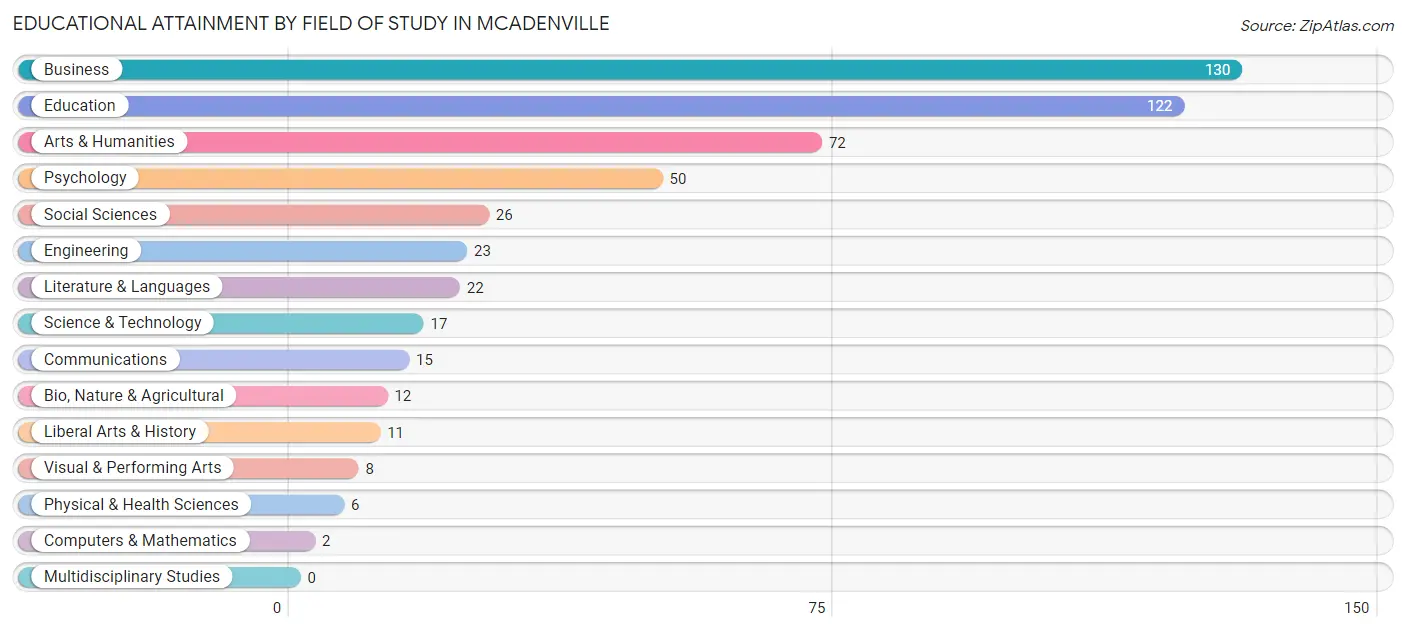
| Field of Study | # Graduates | % Graduates |
| Computers & Mathematics | 2 | 0.4% |
| Bio, Nature & Agricultural | 12 | 2.3% |
| Physical & Health Sciences | 6 | 1.2% |
| Psychology | 50 | 9.7% |
| Social Sciences | 26 | 5.0% |
| Engineering | 23 | 4.5% |
| Multidisciplinary Studies | 0 | 0.0% |
| Science & Technology | 17 | 3.3% |
| Business | 130 | 25.2% |
| Education | 122 | 23.6% |
| Literature & Languages | 22 | 4.3% |
| Liberal Arts & History | 11 | 2.1% |
| Visual & Performing Arts | 8 | 1.5% |
| Communications | 15 | 2.9% |
| Arts & Humanities | 72 | 14.0% |
| Total | 516 | 100.0% |
Transportation & Commute in McAdenville
Vehicle Availability by Sex in McAdenville
The most prevalent vehicle ownership categories in McAdenville are males with 2 vehicles (205, accounting for 65.3%) and females with 2 vehicles (137, making up 89.9%).
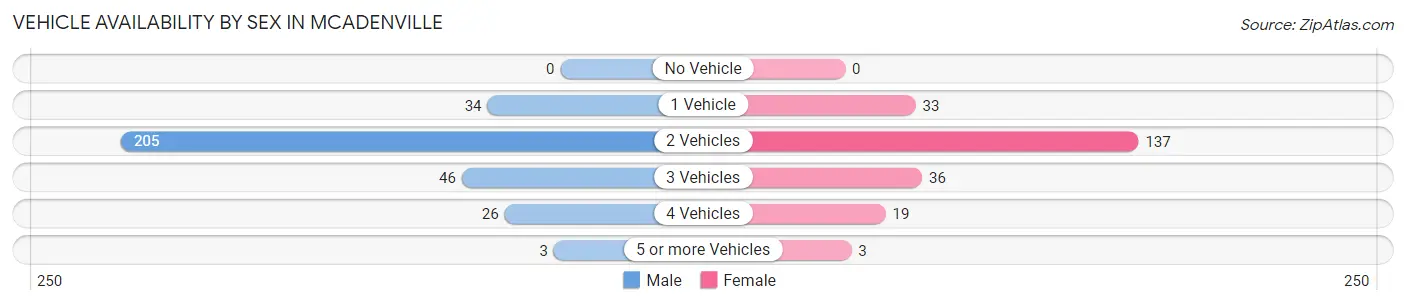
| Vehicles Available | Male | Female |
| No Vehicle | 0 (0.0%) | 0 (0.0%) |
| 1 Vehicle | 34 (10.8%) | 33 (14.5%) |
| 2 Vehicles | 205 (65.3%) | 137 (60.1%) |
| 3 Vehicles | 46 (14.6%) | 36 (15.8%) |
| 4 Vehicles | 26 (8.3%) | 19 (8.3%) |
| 5 or more Vehicles | 3 (1.0%) | 3 (1.3%) |
| Total | 314 (100.0%) | 228 (100.0%) |
Commute Time in McAdenville
The most frequently occuring commute durations in McAdenville are 25 to 29 minutes (85 commuters, 17.8%), 45 to 59 minutes (84 commuters, 17.6%), and 30 to 34 minutes (74 commuters, 15.5%).
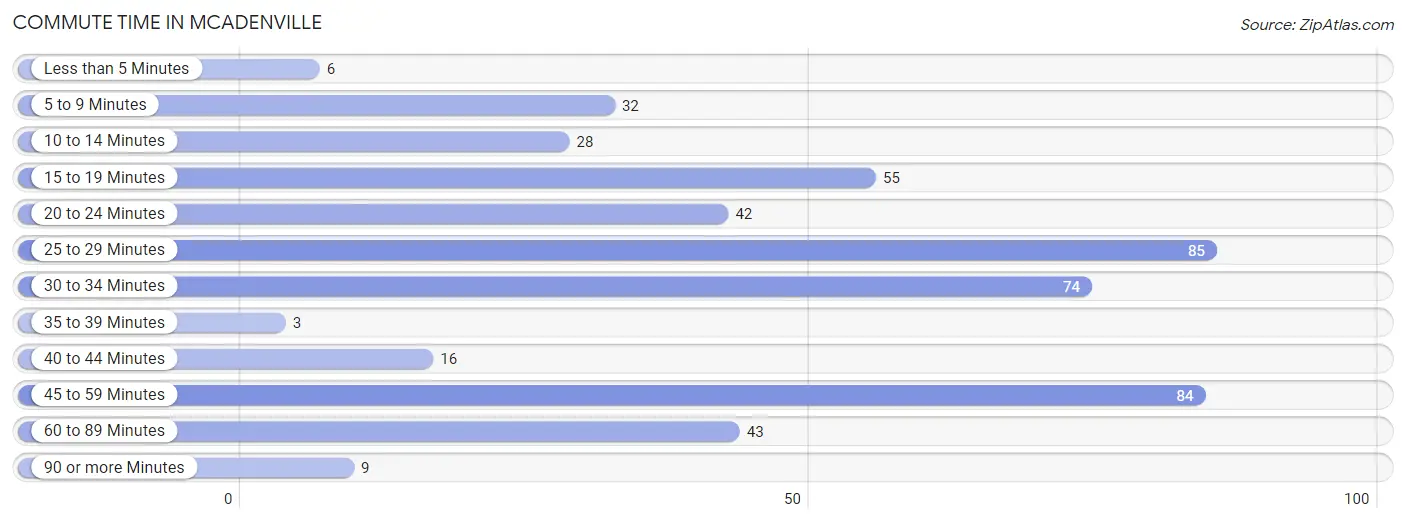
| Commute Time | # Commuters | % Commuters |
| Less than 5 Minutes | 6 | 1.3% |
| 5 to 9 Minutes | 32 | 6.7% |
| 10 to 14 Minutes | 28 | 5.9% |
| 15 to 19 Minutes | 55 | 11.5% |
| 20 to 24 Minutes | 42 | 8.8% |
| 25 to 29 Minutes | 85 | 17.8% |
| 30 to 34 Minutes | 74 | 15.5% |
| 35 to 39 Minutes | 3 | 0.6% |
| 40 to 44 Minutes | 16 | 3.4% |
| 45 to 59 Minutes | 84 | 17.6% |
| 60 to 89 Minutes | 43 | 9.0% |
| 90 or more Minutes | 9 | 1.9% |
Commute Time by Sex in McAdenville
The most common commute times in McAdenville are 25 to 29 minutes (63 commuters, 22.9%) for males and 30 to 34 minutes (39 commuters, 19.3%) for females.
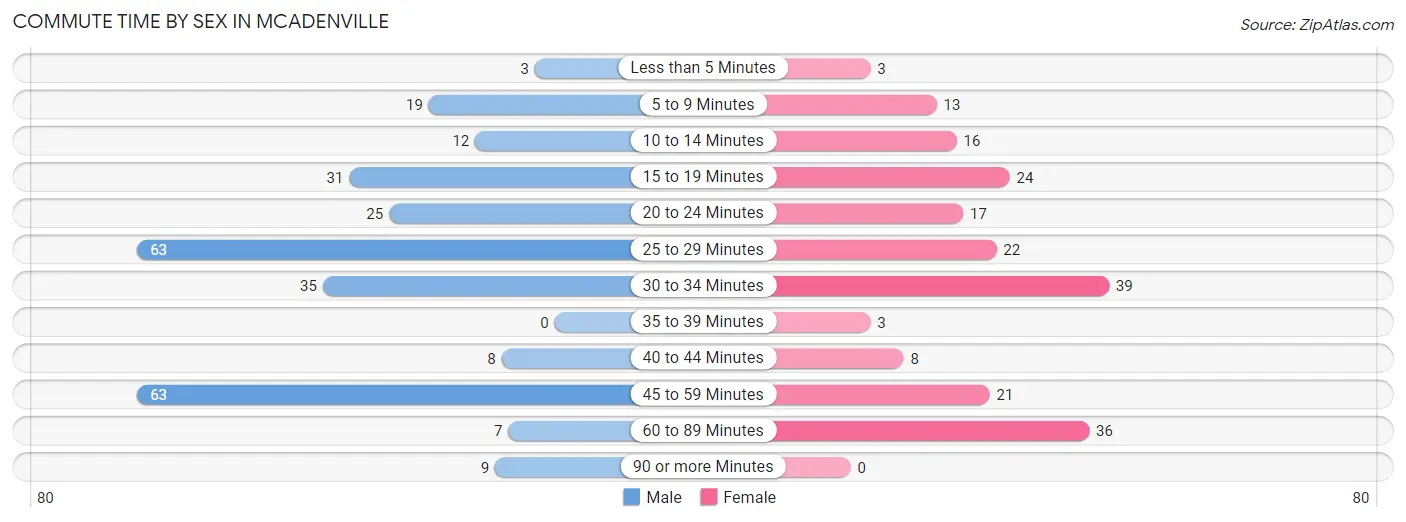
| Commute Time | Male | Female |
| Less than 5 Minutes | 3 (1.1%) | 3 (1.5%) |
| 5 to 9 Minutes | 19 (6.9%) | 13 (6.4%) |
| 10 to 14 Minutes | 12 (4.4%) | 16 (7.9%) |
| 15 to 19 Minutes | 31 (11.3%) | 24 (11.9%) |
| 20 to 24 Minutes | 25 (9.1%) | 17 (8.4%) |
| 25 to 29 Minutes | 63 (22.9%) | 22 (10.9%) |
| 30 to 34 Minutes | 35 (12.7%) | 39 (19.3%) |
| 35 to 39 Minutes | 0 (0.0%) | 3 (1.5%) |
| 40 to 44 Minutes | 8 (2.9%) | 8 (4.0%) |
| 45 to 59 Minutes | 63 (22.9%) | 21 (10.4%) |
| 60 to 89 Minutes | 7 (2.5%) | 36 (17.8%) |
| 90 or more Minutes | 9 (3.3%) | 0 (0.0%) |
Time of Departure to Work by Sex in McAdenville
The most frequent times of departure to work in McAdenville are 6:00 AM to 6:29 AM (56, 20.4%) for males and 7:00 AM to 7:29 AM (37, 18.3%) for females.
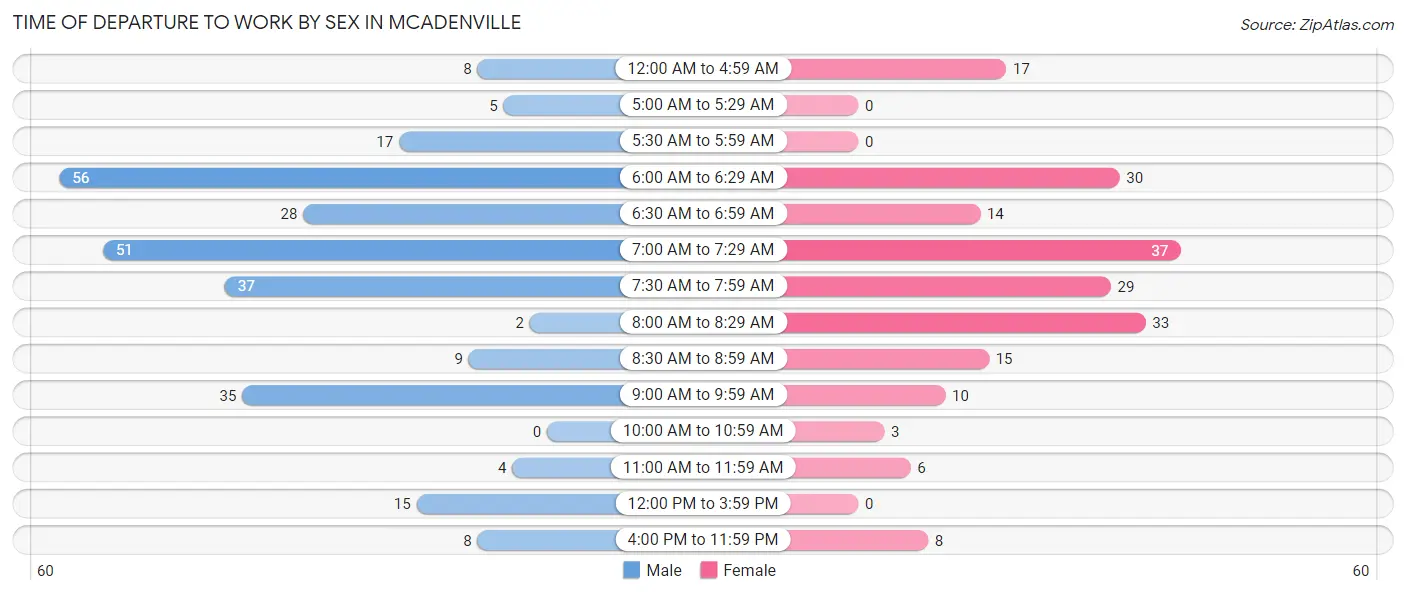
| Time of Departure | Male | Female |
| 12:00 AM to 4:59 AM | 8 (2.9%) | 17 (8.4%) |
| 5:00 AM to 5:29 AM | 5 (1.8%) | 0 (0.0%) |
| 5:30 AM to 5:59 AM | 17 (6.2%) | 0 (0.0%) |
| 6:00 AM to 6:29 AM | 56 (20.4%) | 30 (14.8%) |
| 6:30 AM to 6:59 AM | 28 (10.2%) | 14 (6.9%) |
| 7:00 AM to 7:29 AM | 51 (18.5%) | 37 (18.3%) |
| 7:30 AM to 7:59 AM | 37 (13.5%) | 29 (14.4%) |
| 8:00 AM to 8:29 AM | 2 (0.7%) | 33 (16.3%) |
| 8:30 AM to 8:59 AM | 9 (3.3%) | 15 (7.4%) |
| 9:00 AM to 9:59 AM | 35 (12.7%) | 10 (5.0%) |
| 10:00 AM to 10:59 AM | 0 (0.0%) | 3 (1.5%) |
| 11:00 AM to 11:59 AM | 4 (1.5%) | 6 (3.0%) |
| 12:00 PM to 3:59 PM | 15 (5.4%) | 0 (0.0%) |
| 4:00 PM to 11:59 PM | 8 (2.9%) | 8 (4.0%) |
| Total | 275 (100.0%) | 202 (100.0%) |
Housing Occupancy in McAdenville
Occupancy by Ownership in McAdenville
Of the total 485 dwellings in McAdenville, owner-occupied units account for 439 (90.5%), while renter-occupied units make up 46 (9.5%).
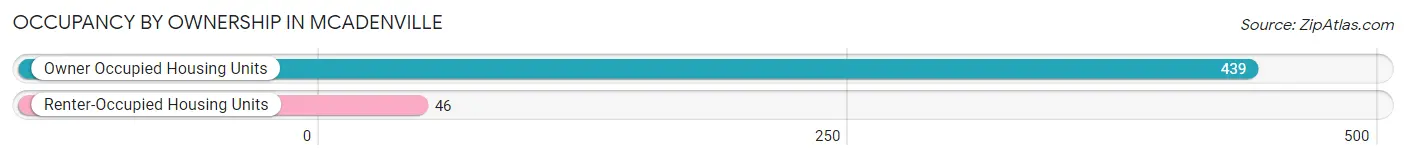
| Occupancy | # Housing Units | % Housing Units |
| Owner Occupied Housing Units | 439 | 90.5% |
| Renter-Occupied Housing Units | 46 | 9.5% |
| Total Occupied Housing Units | 485 | 100.0% |
Occupancy by Household Size in McAdenville
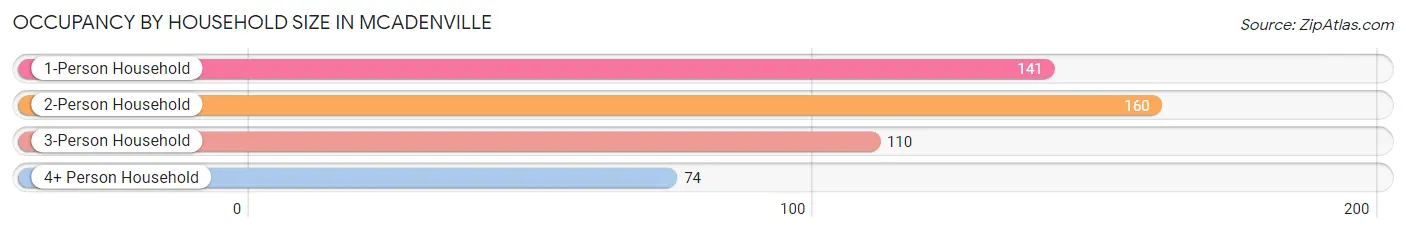
| Household Size | # Housing Units | % Housing Units |
| 1-Person Household | 141 | 29.1% |
| 2-Person Household | 160 | 33.0% |
| 3-Person Household | 110 | 22.7% |
| 4+ Person Household | 74 | 15.3% |
| Total Housing Units | 485 | 100.0% |
Occupancy by Ownership by Household Size in McAdenville
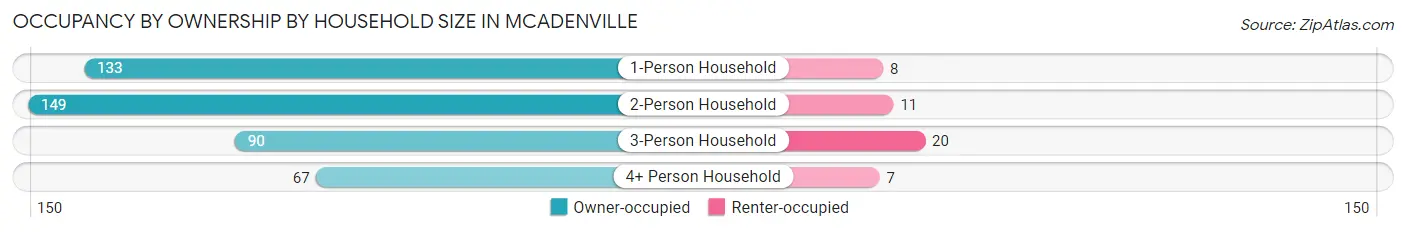
| Household Size | Owner-occupied | Renter-occupied |
| 1-Person Household | 133 (94.3%) | 8 (5.7%) |
| 2-Person Household | 149 (93.1%) | 11 (6.9%) |
| 3-Person Household | 90 (81.8%) | 20 (18.2%) |
| 4+ Person Household | 67 (90.5%) | 7 (9.5%) |
| Total Housing Units | 439 (90.5%) | 46 (9.5%) |
Occupancy by Educational Attainment in McAdenville
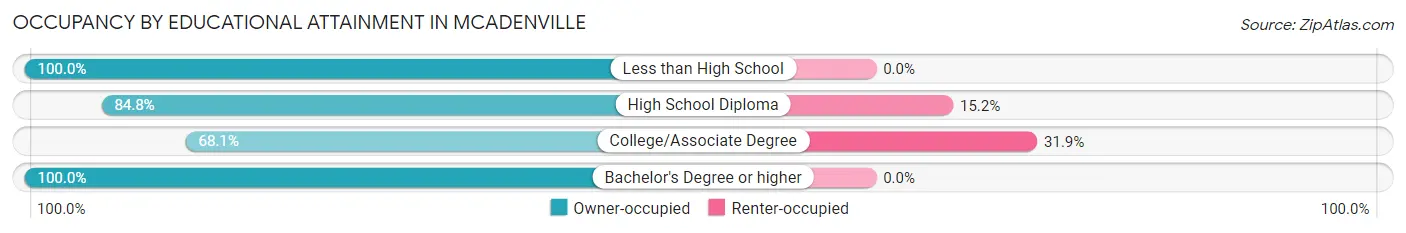
| Household Size | Owner-occupied | Renter-occupied |
| Less than High School | 3 (100.0%) | 0 (0.0%) |
| High School Diploma | 89 (84.8%) | 16 (15.2%) |
| College/Associate Degree | 64 (68.1%) | 30 (31.9%) |
| Bachelor's Degree or higher | 283 (100.0%) | 0 (0.0%) |
Occupancy by Age of Householder in McAdenville
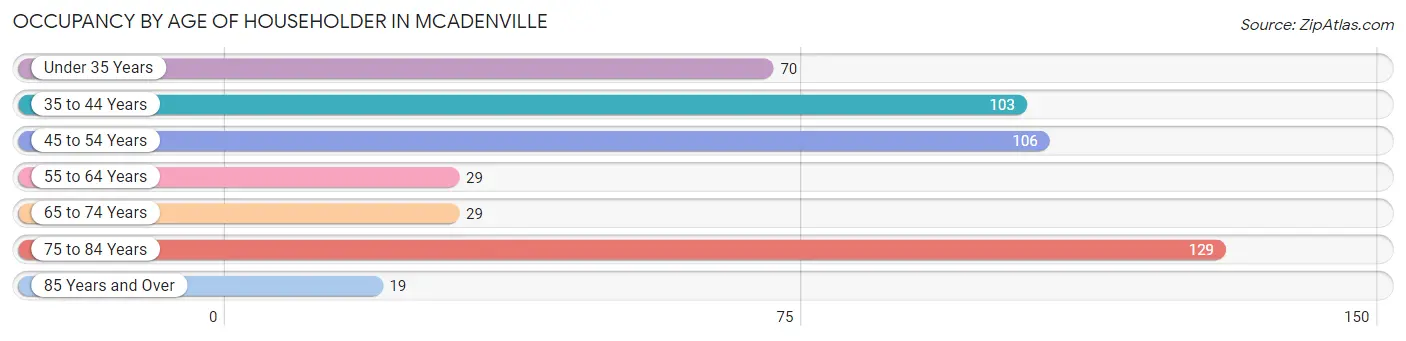
| Age Bracket | # Households | % Households |
| Under 35 Years | 70 | 14.4% |
| 35 to 44 Years | 103 | 21.2% |
| 45 to 54 Years | 106 | 21.9% |
| 55 to 64 Years | 29 | 6.0% |
| 65 to 74 Years | 29 | 6.0% |
| 75 to 84 Years | 129 | 26.6% |
| 85 Years and Over | 19 | 3.9% |
| Total | 485 | 100.0% |
Housing Finances in McAdenville
Median Income by Occupancy in McAdenville
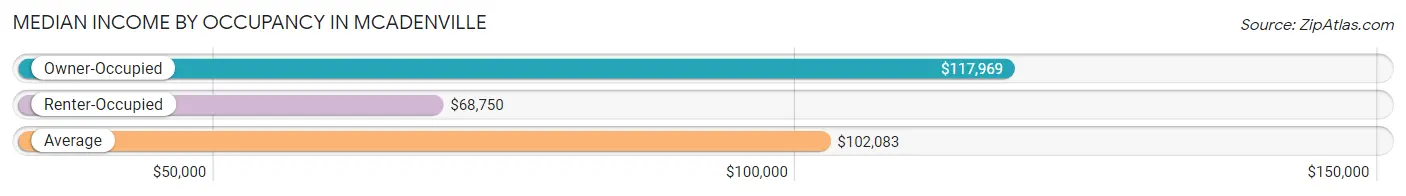
| Occupancy Type | # Households | Median Income |
| Owner-Occupied | 439 (90.5%) | $117,969 |
| Renter-Occupied | 46 (9.5%) | $68,750 |
| Average | 485 (100.0%) | $102,083 |
Occupancy by Householder Income Bracket in McAdenville

| Income Bracket | Owner-occupied | Renter-occupied |
| Less than $5,000 | 2 (0.5%) | 2 (4.3%) |
| $5,000 to $9,999 | 3 (0.7%) | 0 (0.0%) |
| $10,000 to $14,999 | 3 (0.7%) | 0 (0.0%) |
| $15,000 to $19,999 | 12 (2.7%) | 0 (0.0%) |
| $20,000 to $24,999 | 3 (0.7%) | 0 (0.0%) |
| $25,000 to $34,999 | 31 (7.1%) | 3 (6.5%) |
| $35,000 to $49,999 | 90 (20.5%) | 7 (15.2%) |
| $50,000 to $74,999 | 23 (5.2%) | 18 (39.1%) |
| $75,000 to $99,999 | 40 (9.1%) | 3 (6.5%) |
| $100,000 to $149,999 | 115 (26.2%) | 13 (28.3%) |
| $150,000 or more | 117 (26.7%) | 0 (0.0%) |
| Total | 439 (100.0%) | 46 (100.0%) |
Monthly Housing Cost Tiers in McAdenville
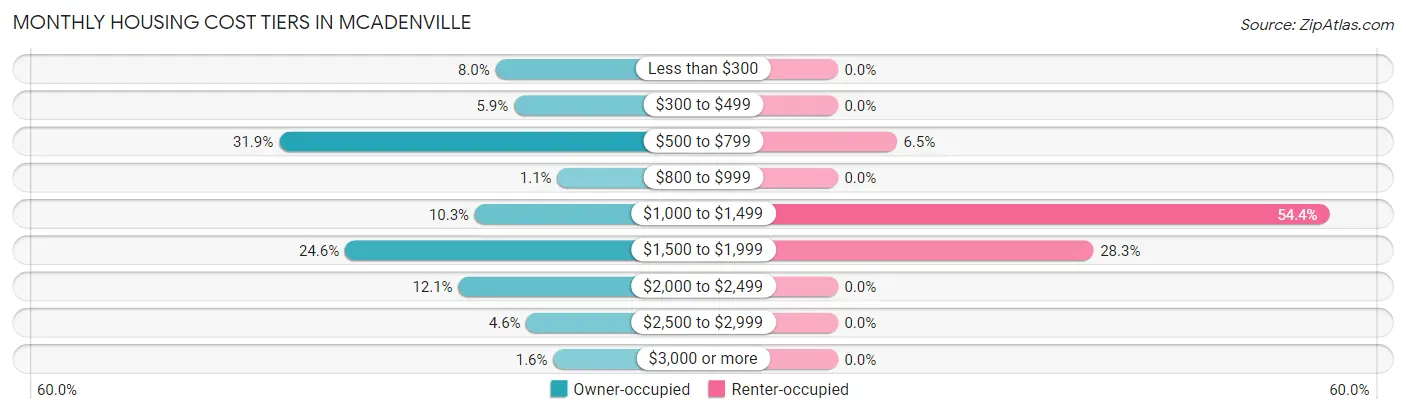
| Monthly Cost | Owner-occupied | Renter-occupied |
| Less than $300 | 35 (8.0%) | 0 (0.0%) |
| $300 to $499 | 26 (5.9%) | 0 (0.0%) |
| $500 to $799 | 140 (31.9%) | 3 (6.5%) |
| $800 to $999 | 5 (1.1%) | 0 (0.0%) |
| $1,000 to $1,499 | 45 (10.2%) | 25 (54.3%) |
| $1,500 to $1,999 | 108 (24.6%) | 13 (28.3%) |
| $2,000 to $2,499 | 53 (12.1%) | 0 (0.0%) |
| $2,500 to $2,999 | 20 (4.6%) | 0 (0.0%) |
| $3,000 or more | 7 (1.6%) | 0 (0.0%) |
| Total | 439 (100.0%) | 46 (100.0%) |
Physical Housing Characteristics in McAdenville
Housing Structures in McAdenville
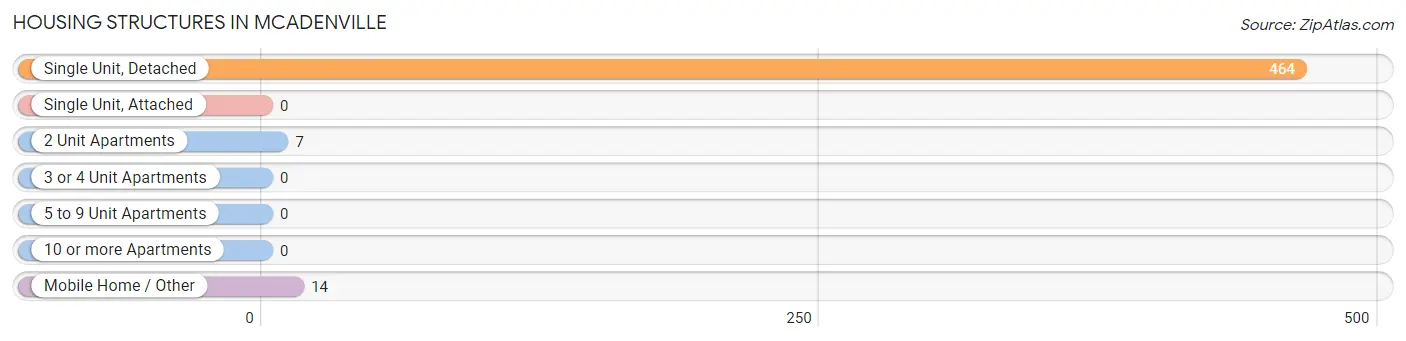
| Structure Type | # Housing Units | % Housing Units |
| Single Unit, Detached | 464 | 95.7% |
| Single Unit, Attached | 0 | 0.0% |
| 2 Unit Apartments | 7 | 1.4% |
| 3 or 4 Unit Apartments | 0 | 0.0% |
| 5 to 9 Unit Apartments | 0 | 0.0% |
| 10 or more Apartments | 0 | 0.0% |
| Mobile Home / Other | 14 | 2.9% |
| Total | 485 | 100.0% |
Housing Structures by Occupancy in McAdenville
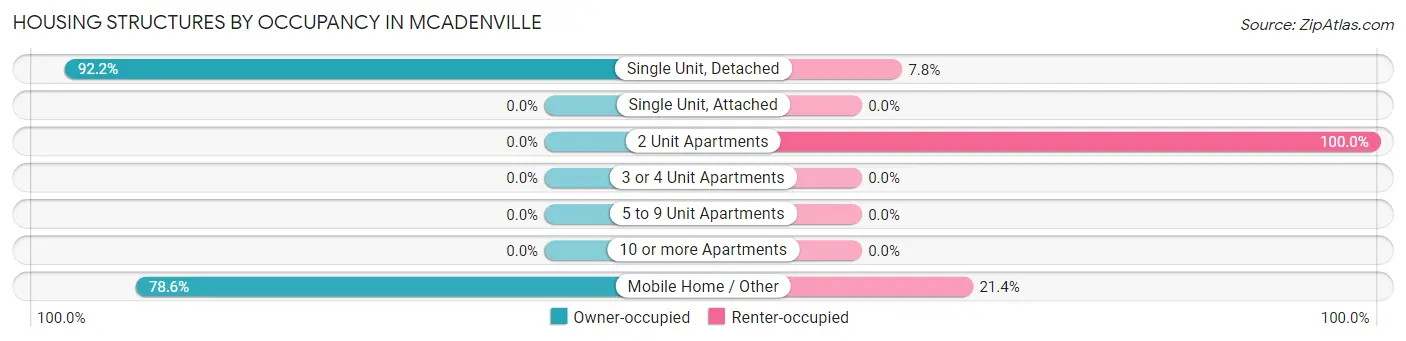
| Structure Type | Owner-occupied | Renter-occupied |
| Single Unit, Detached | 428 (92.2%) | 36 (7.8%) |
| Single Unit, Attached | 0 (0.0%) | 0 (0.0%) |
| 2 Unit Apartments | 0 (0.0%) | 7 (100.0%) |
| 3 or 4 Unit Apartments | 0 (0.0%) | 0 (0.0%) |
| 5 to 9 Unit Apartments | 0 (0.0%) | 0 (0.0%) |
| 10 or more Apartments | 0 (0.0%) | 0 (0.0%) |
| Mobile Home / Other | 11 (78.6%) | 3 (21.4%) |
| Total | 439 (90.5%) | 46 (9.5%) |
Housing Structures by Number of Rooms in McAdenville
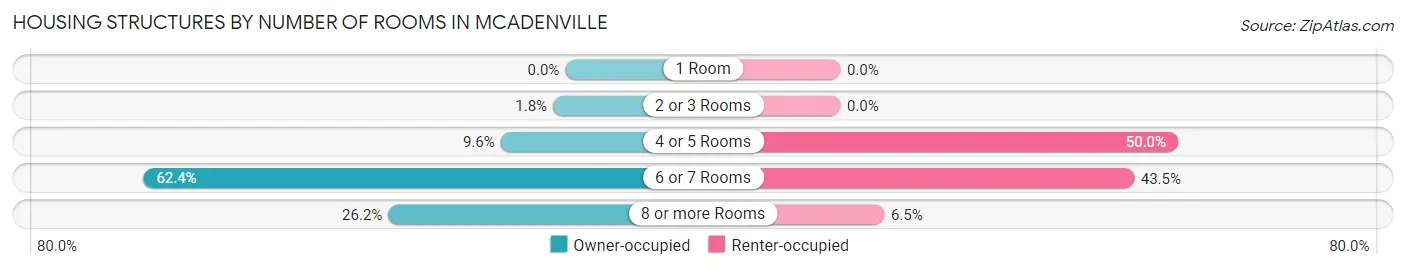
| Number of Rooms | Owner-occupied | Renter-occupied |
| 1 Room | 0 (0.0%) | 0 (0.0%) |
| 2 or 3 Rooms | 8 (1.8%) | 0 (0.0%) |
| 4 or 5 Rooms | 42 (9.6%) | 23 (50.0%) |
| 6 or 7 Rooms | 274 (62.4%) | 20 (43.5%) |
| 8 or more Rooms | 115 (26.2%) | 3 (6.5%) |
| Total | 439 (100.0%) | 46 (100.0%) |
Housing Structure by Heating Type in McAdenville
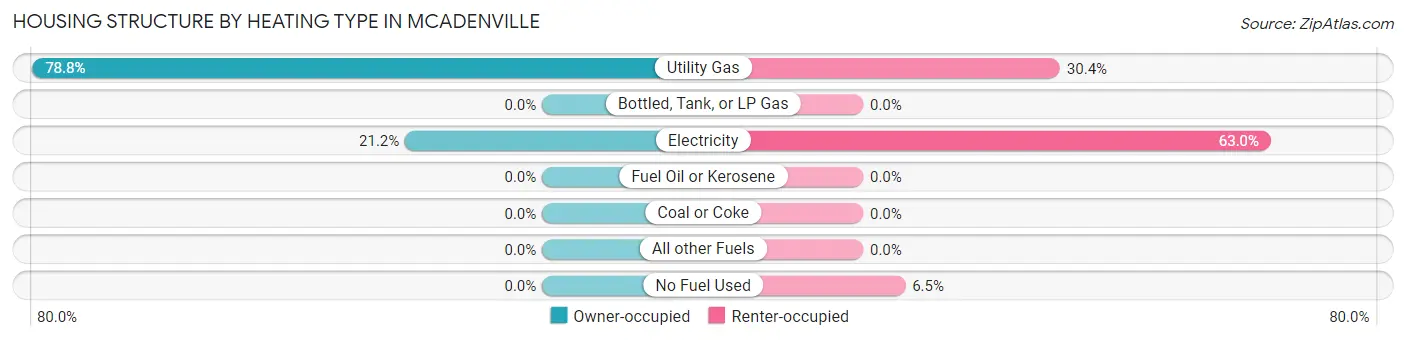
| Heating Type | Owner-occupied | Renter-occupied |
| Utility Gas | 346 (78.8%) | 14 (30.4%) |
| Bottled, Tank, or LP Gas | 0 (0.0%) | 0 (0.0%) |
| Electricity | 93 (21.2%) | 29 (63.0%) |
| Fuel Oil or Kerosene | 0 (0.0%) | 0 (0.0%) |
| Coal or Coke | 0 (0.0%) | 0 (0.0%) |
| All other Fuels | 0 (0.0%) | 0 (0.0%) |
| No Fuel Used | 0 (0.0%) | 3 (6.5%) |
| Total | 439 (100.0%) | 46 (100.0%) |
Household Vehicle Usage in McAdenville
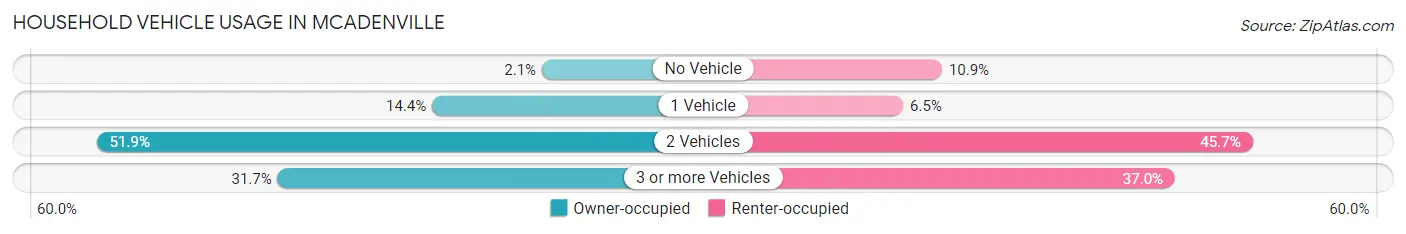
| Vehicles per Household | Owner-occupied | Renter-occupied |
| No Vehicle | 9 (2.1%) | 5 (10.9%) |
| 1 Vehicle | 63 (14.3%) | 3 (6.5%) |
| 2 Vehicles | 228 (51.9%) | 21 (45.7%) |
| 3 or more Vehicles | 139 (31.7%) | 17 (37.0%) |
| Total | 439 (100.0%) | 46 (100.0%) |
Real Estate & Mortgages in McAdenville
Real Estate and Mortgage Overview in McAdenville
| Characteristic | Without Mortgage | With Mortgage |
| Housing Units | 190 | 249 |
| Median Property Value | $311,500 | $346,500 |
| Median Household Income | - | - |
| Monthly Housing Costs | $619 | $7 |
| Real Estate Taxes | $3,252 | $2 |
Property Value by Mortgage Status in McAdenville
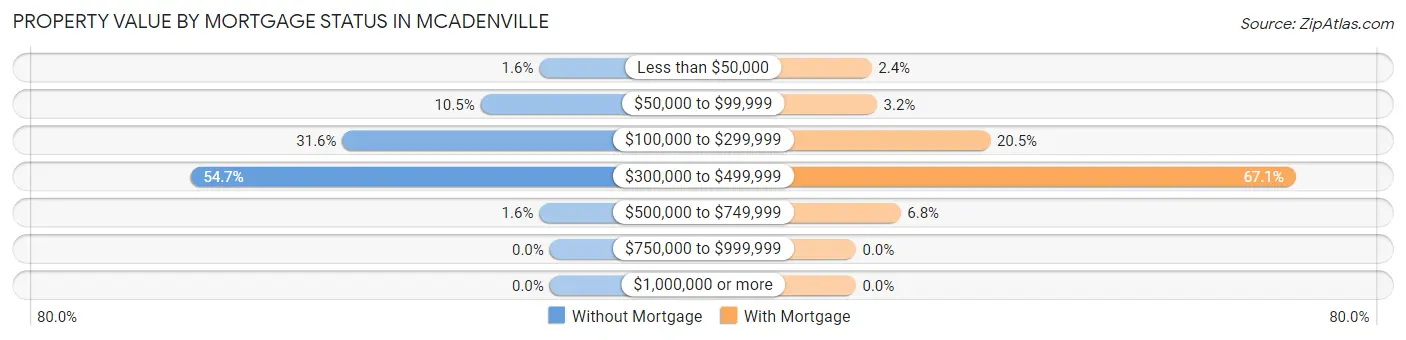
| Property Value | Without Mortgage | With Mortgage |
| Less than $50,000 | 3 (1.6%) | 6 (2.4%) |
| $50,000 to $99,999 | 20 (10.5%) | 8 (3.2%) |
| $100,000 to $299,999 | 60 (31.6%) | 51 (20.5%) |
| $300,000 to $499,999 | 104 (54.7%) | 167 (67.1%) |
| $500,000 to $749,999 | 3 (1.6%) | 17 (6.8%) |
| $750,000 to $999,999 | 0 (0.0%) | 0 (0.0%) |
| $1,000,000 or more | 0 (0.0%) | 0 (0.0%) |
| Total | 190 (100.0%) | 249 (100.0%) |
Household Income by Mortgage Status in McAdenville
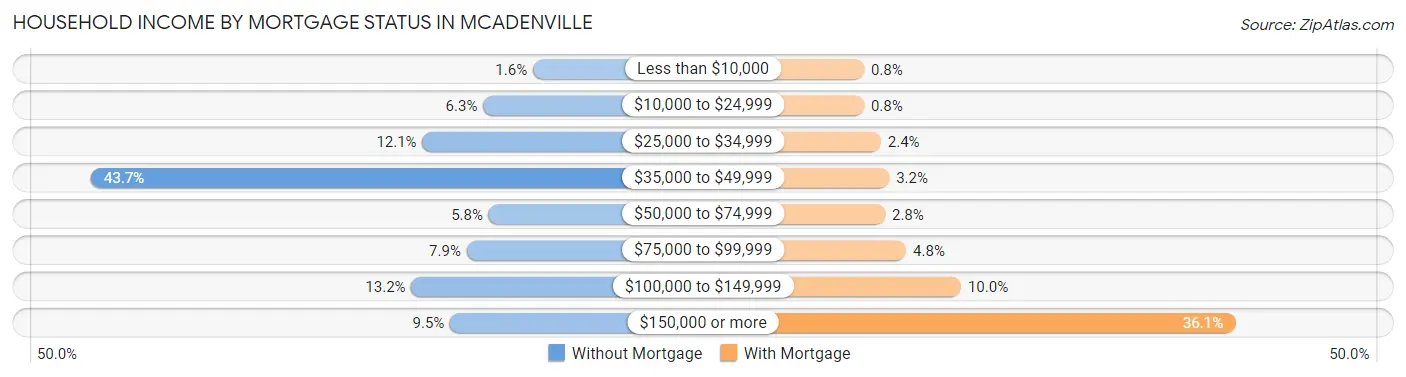
| Household Income | Without Mortgage | With Mortgage |
| Less than $10,000 | 3 (1.6%) | 2 (0.8%) |
| $10,000 to $24,999 | 12 (6.3%) | 2 (0.8%) |
| $25,000 to $34,999 | 23 (12.1%) | 6 (2.4%) |
| $35,000 to $49,999 | 83 (43.7%) | 8 (3.2%) |
| $50,000 to $74,999 | 11 (5.8%) | 7 (2.8%) |
| $75,000 to $99,999 | 15 (7.9%) | 12 (4.8%) |
| $100,000 to $149,999 | 25 (13.2%) | 25 (10.0%) |
| $150,000 or more | 18 (9.5%) | 90 (36.1%) |
| Total | 190 (100.0%) | 249 (100.0%) |
Property Value to Household Income Ratio in McAdenville
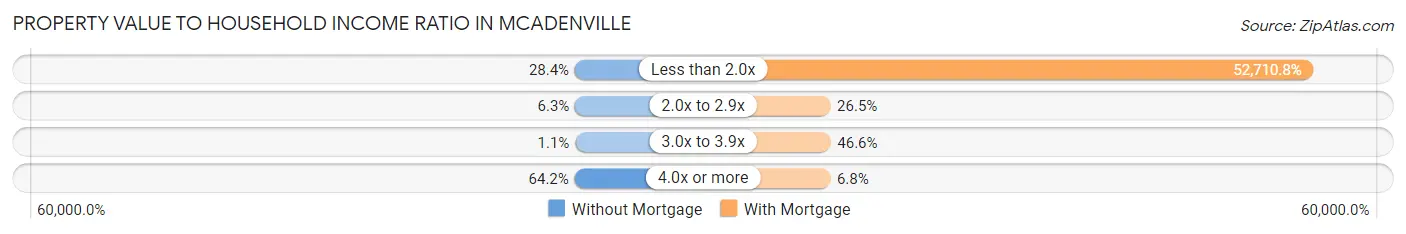
| Value-to-Income Ratio | Without Mortgage | With Mortgage |
| Less than 2.0x | 54 (28.4%) | 131,250 (52,710.8%) |
| 2.0x to 2.9x | 12 (6.3%) | 66 (26.5%) |
| 3.0x to 3.9x | 2 (1.1%) | 116 (46.6%) |
| 4.0x or more | 122 (64.2%) | 17 (6.8%) |
| Total | 190 (100.0%) | 249 (100.0%) |
Real Estate Taxes by Mortgage Status in McAdenville
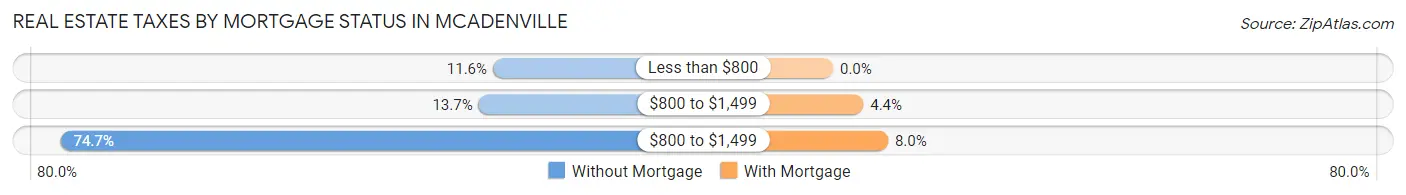
| Property Taxes | Without Mortgage | With Mortgage |
| Less than $800 | 22 (11.6%) | 0 (0.0%) |
| $800 to $1,499 | 26 (13.7%) | 11 (4.4%) |
| $800 to $1,499 | 142 (74.7%) | 20 (8.0%) |
| Total | 190 (100.0%) | 249 (100.0%) |
Health & Disability in McAdenville
Health Insurance Coverage by Age in McAdenville
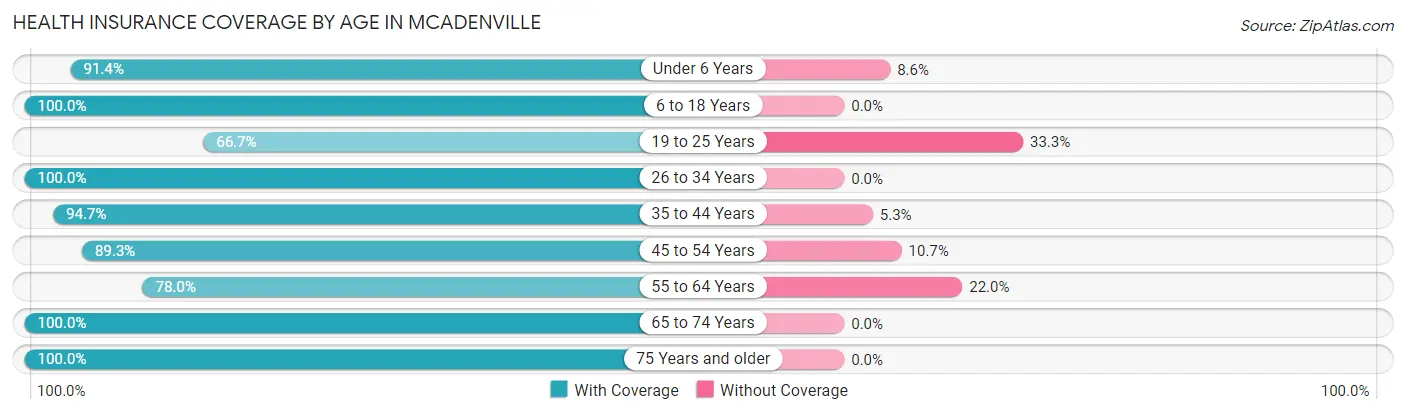
| Age Bracket | With Coverage | Without Coverage |
| Under 6 Years | 64 (91.4%) | 6 (8.6%) |
| 6 to 18 Years | 189 (100.0%) | 0 (0.0%) |
| 19 to 25 Years | 22 (66.7%) | 11 (33.3%) |
| 26 to 34 Years | 141 (100.0%) | 0 (0.0%) |
| 35 to 44 Years | 249 (94.7%) | 14 (5.3%) |
| 45 to 54 Years | 142 (89.3%) | 17 (10.7%) |
| 55 to 64 Years | 39 (78.0%) | 11 (22.0%) |
| 65 to 74 Years | 58 (100.0%) | 0 (0.0%) |
| 75 Years and older | 162 (100.0%) | 0 (0.0%) |
| Total | 1,066 (94.8%) | 59 (5.2%) |
Health Insurance Coverage by Citizenship Status in McAdenville

| Citizenship Status | With Coverage | Without Coverage |
| Native Born | 64 (91.4%) | 6 (8.6%) |
| Foreign Born, Citizen | 189 (100.0%) | 0 (0.0%) |
| Foreign Born, not a Citizen | 22 (66.7%) | 11 (33.3%) |
Health Insurance Coverage by Household Income in McAdenville
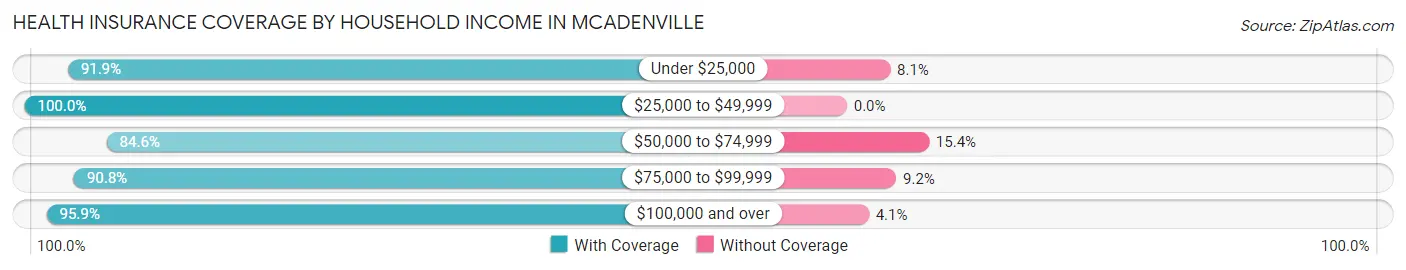
| Household Income | With Coverage | Without Coverage |
| Under $25,000 | 34 (91.9%) | 3 (8.1%) |
| $25,000 to $49,999 | 160 (100.0%) | 0 (0.0%) |
| $50,000 to $74,999 | 88 (84.6%) | 16 (15.4%) |
| $75,000 to $99,999 | 108 (90.8%) | 11 (9.2%) |
| $100,000 and over | 676 (95.9%) | 29 (4.1%) |
Public vs Private Health Insurance Coverage by Age in McAdenville
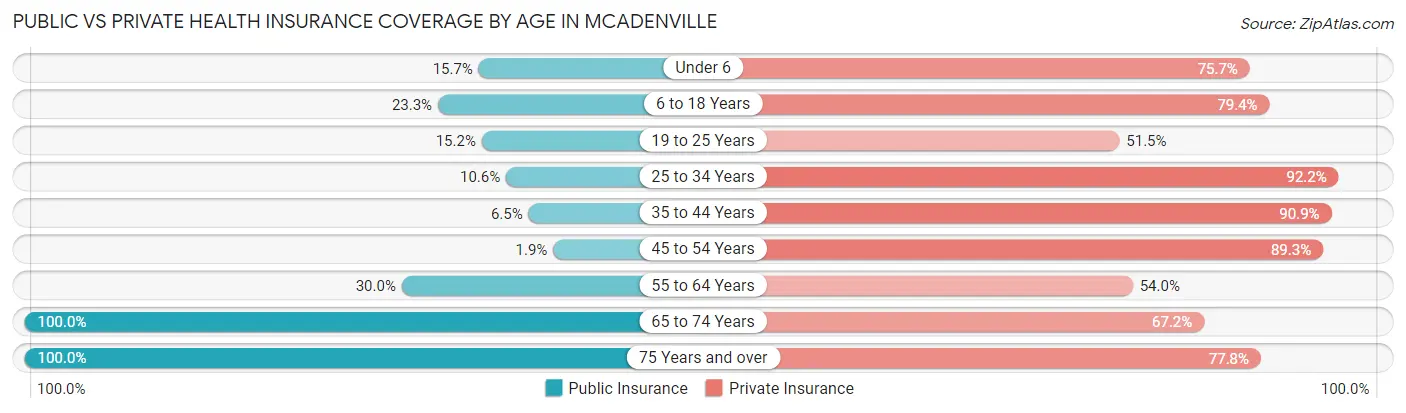
| Age Bracket | Public Insurance | Private Insurance |
| Under 6 | 11 (15.7%) | 53 (75.7%) |
| 6 to 18 Years | 44 (23.3%) | 150 (79.4%) |
| 19 to 25 Years | 5 (15.1%) | 17 (51.5%) |
| 25 to 34 Years | 15 (10.6%) | 130 (92.2%) |
| 35 to 44 Years | 17 (6.5%) | 239 (90.9%) |
| 45 to 54 Years | 3 (1.9%) | 142 (89.3%) |
| 55 to 64 Years | 15 (30.0%) | 27 (54.0%) |
| 65 to 74 Years | 58 (100.0%) | 39 (67.2%) |
| 75 Years and over | 162 (100.0%) | 126 (77.8%) |
| Total | 330 (29.3%) | 923 (82.0%) |
Disability Status by Sex by Age in McAdenville
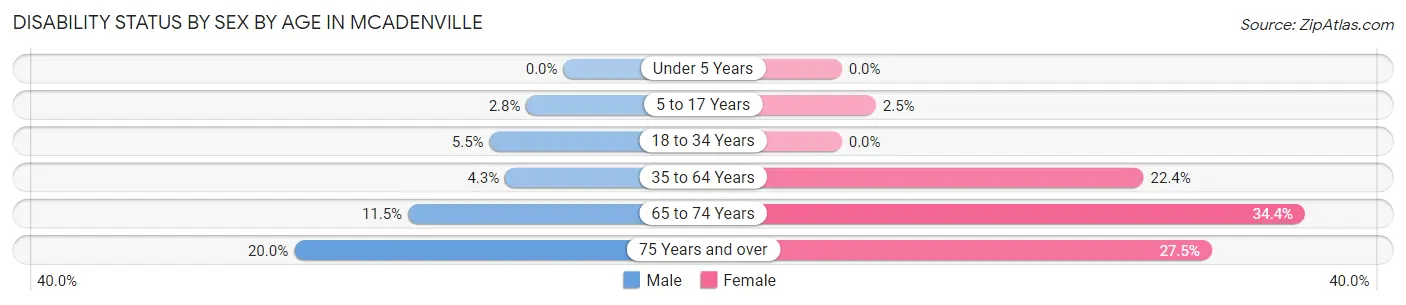
| Age Bracket | Male | Female |
| Under 5 Years | 0 (0.0%) | 0 (0.0%) |
| 5 to 17 Years | 3 (2.8%) | 2 (2.5%) |
| 18 to 34 Years | 5 (5.5%) | 0 (0.0%) |
| 35 to 64 Years | 10 (4.3%) | 54 (22.4%) |
| 65 to 74 Years | 3 (11.5%) | 11 (34.4%) |
| 75 Years and over | 4 (20.0%) | 39 (27.5%) |
Disability Class by Sex by Age in McAdenville
Disability Class: Hearing Difficulty
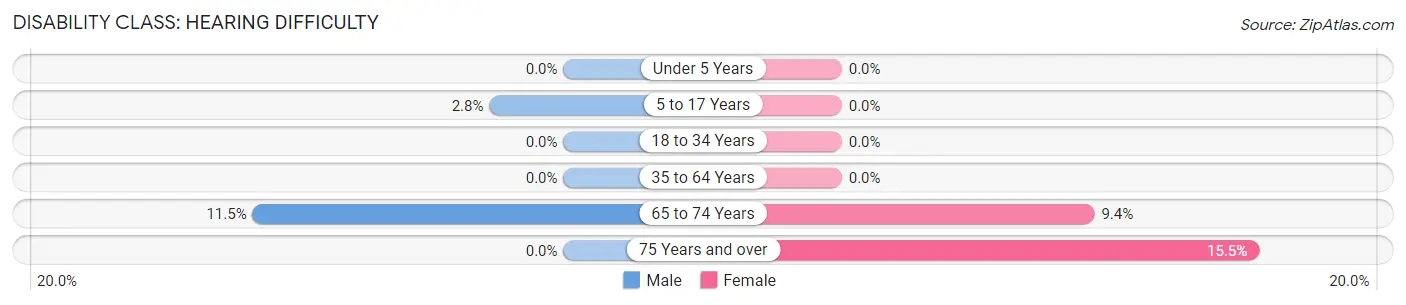
| Age Bracket | Male | Female |
| Under 5 Years | 0 (0.0%) | 0 (0.0%) |
| 5 to 17 Years | 3 (2.8%) | 0 (0.0%) |
| 18 to 34 Years | 0 (0.0%) | 0 (0.0%) |
| 35 to 64 Years | 0 (0.0%) | 0 (0.0%) |
| 65 to 74 Years | 3 (11.5%) | 3 (9.4%) |
| 75 Years and over | 0 (0.0%) | 22 (15.5%) |
Disability Class: Vision Difficulty
| Age Bracket | Male | Female |
| Under 5 Years | 0 (0.0%) | 0 (0.0%) |
| 5 to 17 Years | 0 (0.0%) | 0 (0.0%) |
| 18 to 34 Years | 0 (0.0%) | 0 (0.0%) |
| 35 to 64 Years | 0 (0.0%) | 0 (0.0%) |
| 65 to 74 Years | 0 (0.0%) | 0 (0.0%) |
| 75 Years and over | 0 (0.0%) | 0 (0.0%) |
Disability Class: Cognitive Difficulty
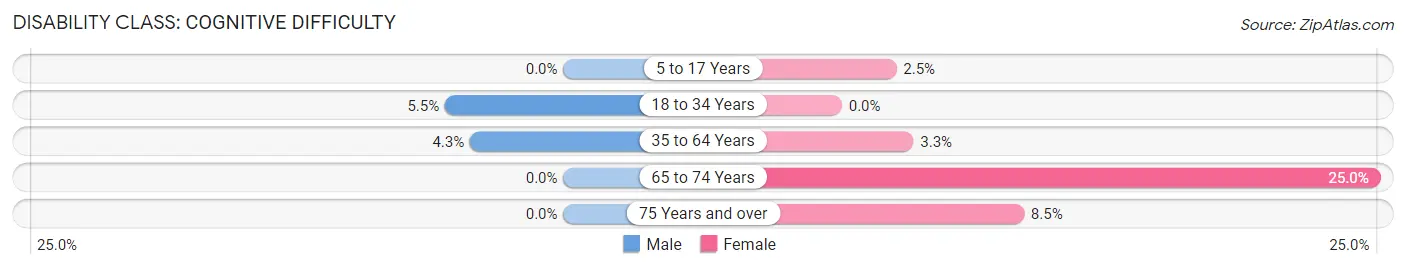
| Age Bracket | Male | Female |
| 5 to 17 Years | 0 (0.0%) | 2 (2.5%) |
| 18 to 34 Years | 5 (5.5%) | 0 (0.0%) |
| 35 to 64 Years | 10 (4.3%) | 8 (3.3%) |
| 65 to 74 Years | 0 (0.0%) | 8 (25.0%) |
| 75 Years and over | 0 (0.0%) | 12 (8.5%) |
Disability Class: Ambulatory Difficulty
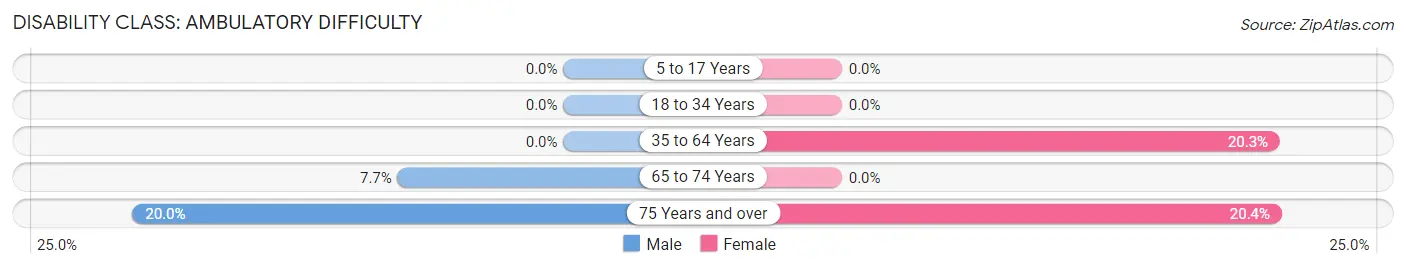
| Age Bracket | Male | Female |
| 5 to 17 Years | 0 (0.0%) | 0 (0.0%) |
| 18 to 34 Years | 0 (0.0%) | 0 (0.0%) |
| 35 to 64 Years | 0 (0.0%) | 49 (20.3%) |
| 65 to 74 Years | 2 (7.7%) | 0 (0.0%) |
| 75 Years and over | 4 (20.0%) | 29 (20.4%) |
Disability Class: Self-Care Difficulty
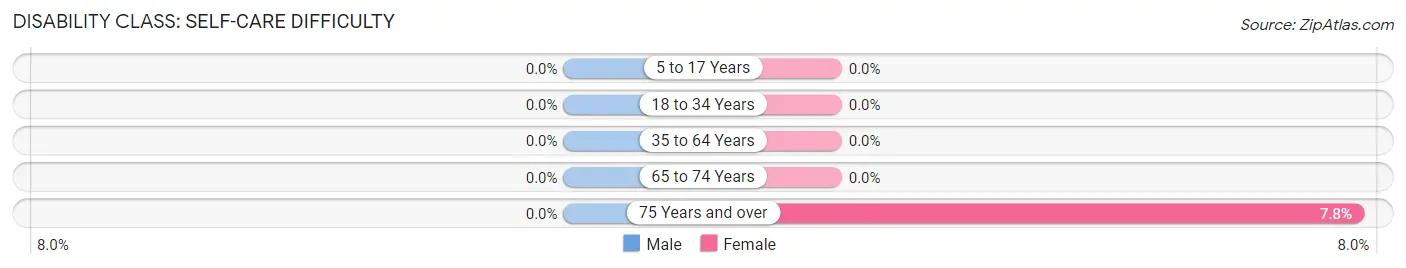
| Age Bracket | Male | Female |
| 5 to 17 Years | 0 (0.0%) | 0 (0.0%) |
| 18 to 34 Years | 0 (0.0%) | 0 (0.0%) |
| 35 to 64 Years | 0 (0.0%) | 0 (0.0%) |
| 65 to 74 Years | 0 (0.0%) | 0 (0.0%) |
| 75 Years and over | 0 (0.0%) | 11 (7.7%) |
Technology Access in McAdenville
Computing Device Access in McAdenville
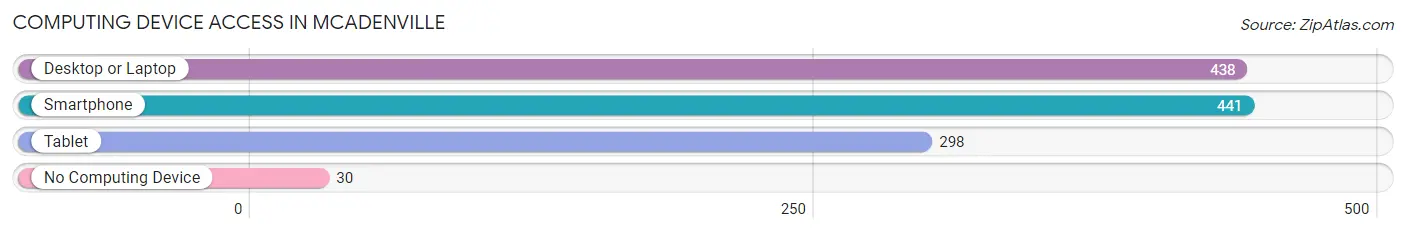
| Device Type | # Households | % Households |
| Desktop or Laptop | 438 | 90.3% |
| Smartphone | 441 | 90.9% |
| Tablet | 298 | 61.4% |
| No Computing Device | 30 | 6.2% |
| Total | 485 | 100.0% |
Internet Access in McAdenville
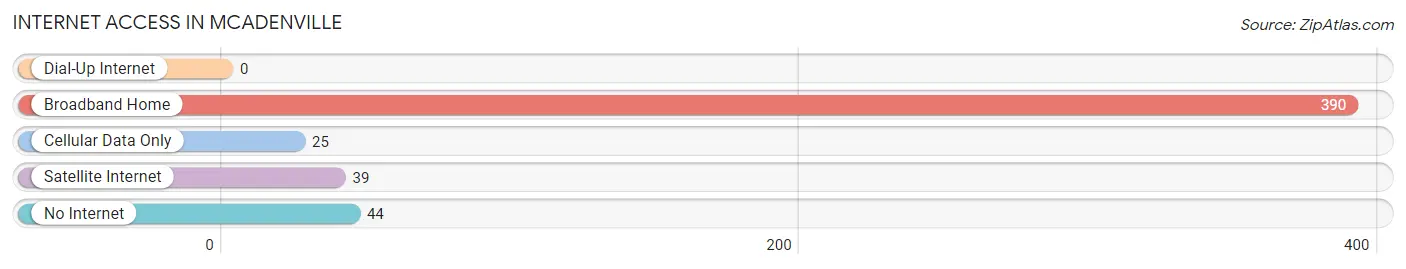
| Internet Type | # Households | % Households |
| Dial-Up Internet | 0 | 0.0% |
| Broadband Home | 390 | 80.4% |
| Cellular Data Only | 25 | 5.1% |
| Satellite Internet | 39 | 8.0% |
| No Internet | 44 | 9.1% |
| Total | 485 | 100.0% |
McAdenville Summary
Mcadenville, NC is a small town located in Gaston County, North Carolina. It is situated on the banks of the Catawba River, about 20 miles west of Charlotte. The town was founded in 1891 and was originally known as Stumptown. The name was changed to McAdenville in 1895 in honor of the local McAden family, who were prominent in the area.
Geography
McAdenville is located in the Piedmont region of North Carolina, which is characterized by rolling hills and valleys. The town is situated on the banks of the Catawba River, which is a major tributary of the larger Yadkin-Pee Dee River system. The town is located at an elevation of 745 feet above sea level. The climate in McAdenville is humid subtropical, with hot, humid summers and mild winters.
Economy
McAdenville is a small town with a population of just over 1,000 people. The town is home to several small businesses, including a grocery store, a hardware store, a pharmacy, and a few restaurants. The town is also home to the McAdenville Textile Company, which has been in operation since the early 1900s. The company produces a variety of fabrics and textiles for the apparel industry.
Demographics
As of the 2010 census, the population of McAdenville was 1,079. The racial makeup of the town was 95.3% White, 1.7% African American, 0.2% Native American, 0.7% Asian, 0.1% Pacific Islander, and 1.9% from two or more races. The median household income in McAdenville was $45,938, and the median family income was $50,938. The per capita income was $20,938.
History
McAdenville was founded in 1891 and was originally known as Stumptown. The name was changed to McAdenville in 1895 in honor of the local McAden family, who were prominent in the area. The town was incorporated in 1901 and has remained a small, rural community ever since. The town was home to the McAdenville Textile Company, which has been in operation since the early 1900s. The company produces a variety of fabrics and textiles for the apparel industry.
McAdenville is also home to the McAdenville Christmas Lights Display, which is one of the most popular holiday attractions in the region. The display consists of over 375,000 lights and is lit up every year from the first week of December through New Year’s Day. The town also hosts a variety of other events throughout the year, including the McAdenville Summer Festival and the McAdenville Christmas Parade.
Conclusion
McAdenville, NC is a small town located in Gaston County, North Carolina. It is situated on the banks of the Catawba River, about 20 miles west of Charlotte. The town was founded in 1891 and was originally known as Stumptown. The name was changed to McAdenville in 1895 in honor of the local McAden family, who were prominent in the area. The town is home to several small businesses, including a grocery store, a hardware store, a pharmacy, and a few restaurants. The town is also home to the McAdenville Textile Company, which has been in operation since the early 1900s. The town is home to the McAdenville Christmas Lights Display, which is one of the most popular holiday attractions in the region. McAdenville is a small town with a population of just over 1,000 people, and the racial makeup of the town is 95.3% White, 1.7% African American, 0.2% Native American, 0.7% Asian, 0.1% Pacific Islander, and 1.9% from two or more races. The median household income in McAdenville was $45,938, and the median family income was $50,938. The per capita income was $20,938. McAdenville is a small, rural community with a rich history and a variety of attractions and events throughout the year.
Common Questions
What is Per Capita Income in McAdenville?
Per Capita income in McAdenville is $45,861.
What is the Median Family Income in McAdenville?
Median Family Income in McAdenville is $123,967.
What is the Median Household income in McAdenville?
Median Household Income in McAdenville is $102,083.
What is Income or Wage Gap in McAdenville?
Income or Wage Gap in McAdenville is 20.1%.
Women in McAdenville earn 79.9 cents for every dollar earned by a man.
What is Inequality or Gini Index in McAdenville?
Inequality or Gini Index in McAdenville is 0.37.
What is the Total Population of McAdenville?
Total Population of McAdenville is 1,125.
What is the Total Male Population of McAdenville?
Total Male Population of McAdenville is 502.
What is the Total Female Population of McAdenville?
Total Female Population of McAdenville is 623.
What is the Ratio of Males per 100 Females in McAdenville?
There are 80.58 Males per 100 Females in McAdenville.
What is the Ratio of Females per 100 Males in McAdenville?
There are 124.10 Females per 100 Males in McAdenville.
What is the Median Population Age in McAdenville?
Median Population Age in McAdenville is 41.2 Years.
What is the Average Family Size in McAdenville
Average Family Size in McAdenville is 2.9 People.
What is the Average Household Size in McAdenville
Average Household Size in McAdenville is 2.3 People.
How Large is the Labor Force in McAdenville?
There are 570 People in the Labor Forcein in McAdenville.
What is the Percentage of People in the Labor Force in McAdenville?
63.8% of People are in the Labor Force in McAdenville.
What is the Unemployment Rate in McAdenville?
Unemployment Rate in McAdenville is 3.7%.