Mars Hill, NC Map & Demographics
Mars Hill Map
Mars Hill Overview
$29,467
PER CAPITA INCOME
$103,258
AVG FAMILY INCOME
$80,833
AVG HOUSEHOLD INCOME
35.2%
WAGE / INCOME GAP [ % ]
64.8¢/ $1
WAGE / INCOME GAP [ $ ]
$11,591
FAMILY INCOME DEFICIT
0.38
INEQUALITY / GINI INDEX
2,843
TOTAL POPULATION
1,529
MALE POPULATION
1,314
FEMALE POPULATION
116.36
MALES / 100 FEMALES
85.94
FEMALES / 100 MALES
27.0
MEDIAN AGE
2.9
AVG FAMILY SIZE
2.4
AVG HOUSEHOLD SIZE
1,343
LABOR FORCE [ PEOPLE ]
54.8%
PERCENT IN LABOR FORCE
2.2%
UNEMPLOYMENT RATE
Mars Hill Zip Codes
Mars Hill Area Codes
Income in Mars Hill
Income Overview in Mars Hill
Per Capita Income in Mars Hill is $29,467, while median incomes of families and households are $103,258 and $80,833 respectively.
| Characteristic | Number | Measure |
| Per Capita Income | 2,843 | $29,467 |
| Median Family Income | 544 | $103,258 |
| Mean Family Income | 544 | $101,102 |
| Median Household Income | 936 | $80,833 |
| Mean Household Income | 936 | $84,213 |
| Income Deficit | 544 | $11,591 |
| Wage / Income Gap (%) | 2,843 | 35.20% |
| Wage / Income Gap ($) | 2,843 | 64.80¢ per $1 |
| Gini / Inequality Index | 2,843 | 0.38 |
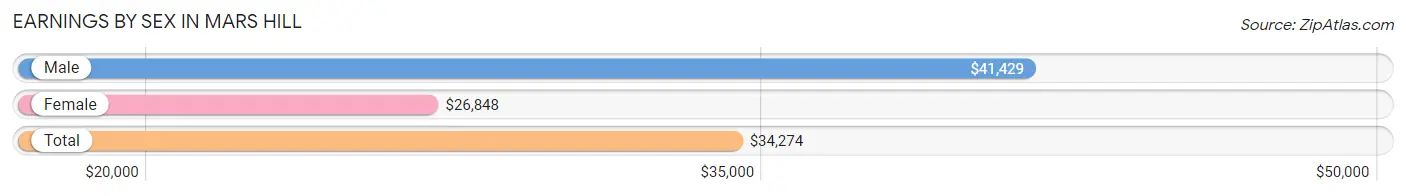
Earnings by Sex in Mars Hill
Average Earnings in Mars Hill are $34,274, $41,429 for men and $26,848 for women, a difference of 35.2%.
| Sex | Number | Average Earnings |
| Male | 844 (53.4%) | $41,429 |
| Female | 736 (46.6%) | $26,848 |
| Total | 1,580 (100.0%) | $34,274 |
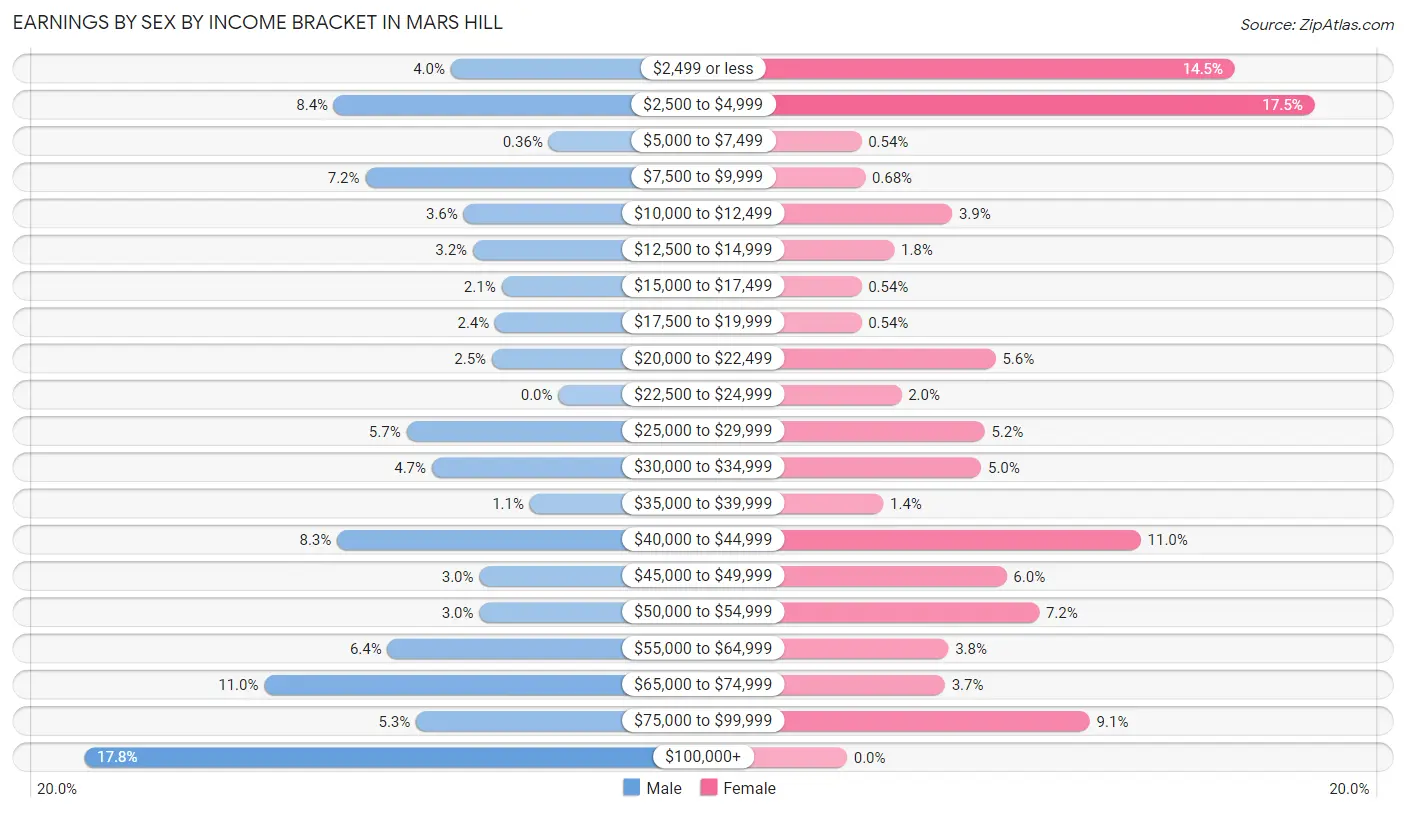
Earnings by Sex by Income Bracket in Mars Hill
The most common earnings brackets in Mars Hill are $100,000+ for men (150 | 17.8%) and $2,500 to $4,999 for women (129 | 17.5%).
| Income | Male | Female |
| $2,499 or less | 34 (4.0%) | 107 (14.5%) |
| $2,500 to $4,999 | 71 (8.4%) | 129 (17.5%) |
| $5,000 to $7,499 | 3 (0.4%) | 4 (0.5%) |
| $7,500 to $9,999 | 61 (7.2%) | 5 (0.7%) |
| $10,000 to $12,499 | 30 (3.5%) | 29 (3.9%) |
| $12,500 to $14,999 | 27 (3.2%) | 13 (1.8%) |
| $15,000 to $17,499 | 18 (2.1%) | 4 (0.5%) |
| $17,500 to $19,999 | 20 (2.4%) | 4 (0.5%) |
| $20,000 to $22,499 | 21 (2.5%) | 41 (5.6%) |
| $22,500 to $24,999 | 0 (0.0%) | 15 (2.0%) |
| $25,000 to $29,999 | 48 (5.7%) | 38 (5.2%) |
| $30,000 to $34,999 | 40 (4.7%) | 37 (5.0%) |
| $35,000 to $39,999 | 9 (1.1%) | 10 (1.4%) |
| $40,000 to $44,999 | 70 (8.3%) | 81 (11.0%) |
| $45,000 to $49,999 | 25 (3.0%) | 44 (6.0%) |
| $50,000 to $54,999 | 25 (3.0%) | 53 (7.2%) |
| $55,000 to $64,999 | 54 (6.4%) | 28 (3.8%) |
| $65,000 to $74,999 | 93 (11.0%) | 27 (3.7%) |
| $75,000 to $99,999 | 45 (5.3%) | 67 (9.1%) |
| $100,000+ | 150 (17.8%) | 0 (0.0%) |
| Total | 844 (100.0%) | 736 (100.0%) |
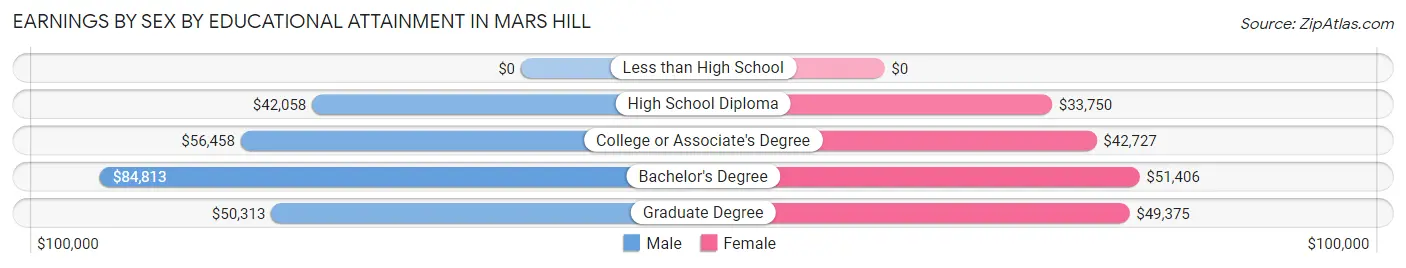
Earnings by Sex by Educational Attainment in Mars Hill
Average earnings in Mars Hill are $57,104 for men and $43,182 for women, a difference of 24.4%. Men with an educational attainment of bachelor's degree enjoy the highest average annual earnings of $84,813, while those with high school diploma education earn the least with $42,058. Women with an educational attainment of bachelor's degree earn the most with the average annual earnings of $51,406, while those with high school diploma education have the smallest earnings of $33,750.
| Educational Attainment | Male Income | Female Income |
| Less than High School | - | - |
| High School Diploma | $42,058 | $33,750 |
| College or Associate's Degree | $56,458 | $42,727 |
| Bachelor's Degree | $84,813 | $51,406 |
| Graduate Degree | $50,313 | $49,375 |
| Total | $57,104 | $43,182 |
Family Income in Mars Hill
Family Income Brackets in Mars Hill
According to the Mars Hill family income data, there are 173 families falling into the $100,000 to $149,999 income range, which is the most common income bracket and makes up 31.8% of all families.
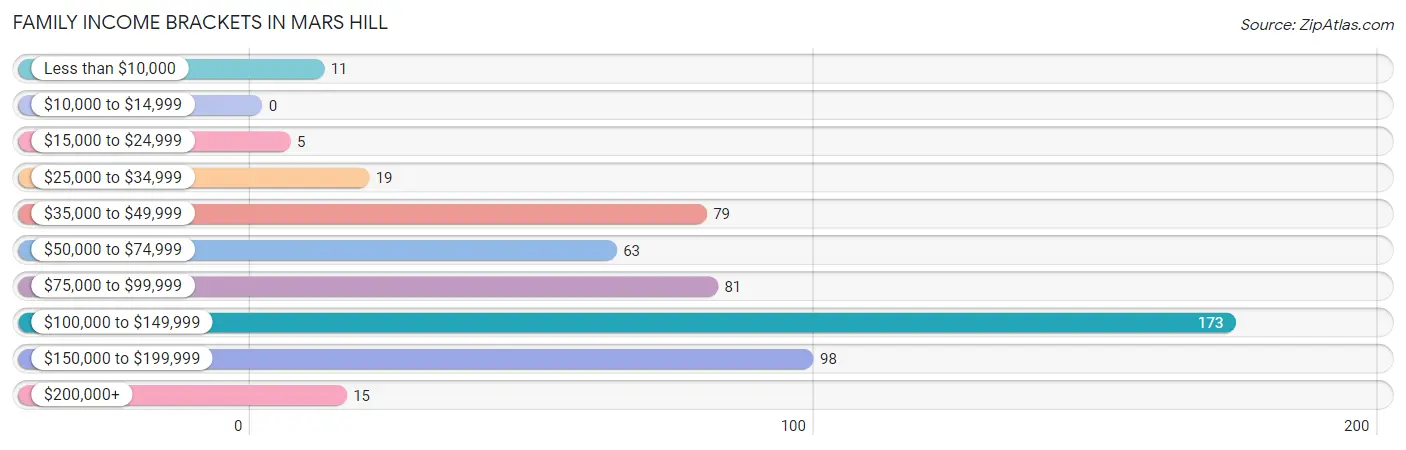
| Income Bracket | # Families | % Families |
| Less than $10,000 | 11 | 2.0% |
| $10,000 to $14,999 | 0 | 0.0% |
| $15,000 to $24,999 | 5 | 0.9% |
| $25,000 to $34,999 | 19 | 3.5% |
| $35,000 to $49,999 | 79 | 14.5% |
| $50,000 to $74,999 | 63 | 11.6% |
| $75,000 to $99,999 | 81 | 14.9% |
| $100,000 to $149,999 | 173 | 31.8% |
| $150,000 to $199,999 | 98 | 18.0% |
| $200,000+ | 15 | 2.8% |
Family Income by Famaliy Size in Mars Hill
3-person families (121 | 22.2%) account for the highest median family income in Mars Hill with $121,563 per family, while 2-person families (316 | 58.1%) have the highest median income of $40,860 per family member.
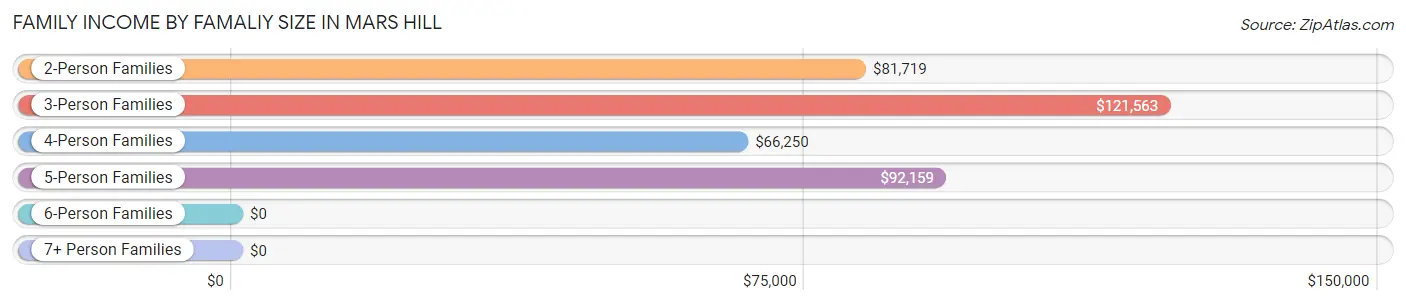
| Income Bracket | # Families | Median Income |
| 2-Person Families | 316 (58.1%) | $81,719 |
| 3-Person Families | 121 (22.2%) | $121,563 |
| 4-Person Families | 51 (9.4%) | $66,250 |
| 5-Person Families | 19 (3.5%) | $92,159 |
| 6-Person Families | 30 (5.5%) | $0 |
| 7+ Person Families | 7 (1.3%) | $0 |
| Total | 544 (100.0%) | $103,258 |
Family Income by Number of Earners in Mars Hill
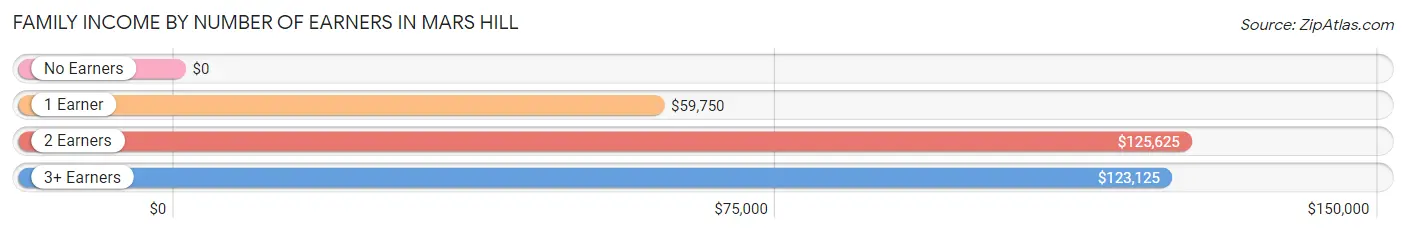
| Number of Earners | # Families | Median Income |
| No Earners | 59 (10.8%) | $0 |
| 1 Earner | 197 (36.2%) | $59,750 |
| 2 Earners | 248 (45.6%) | $125,625 |
| 3+ Earners | 40 (7.3%) | $123,125 |
| Total | 544 (100.0%) | $103,258 |
Household Income in Mars Hill
Household Income Brackets in Mars Hill
With 203 households falling in the category, the $100,000 to $149,999 income range is the most frequent in Mars Hill, accounting for 21.7% of all households. In contrast, only 19 households (2.0%) fall into the less than $10,000 income bracket, making it the least populous group.
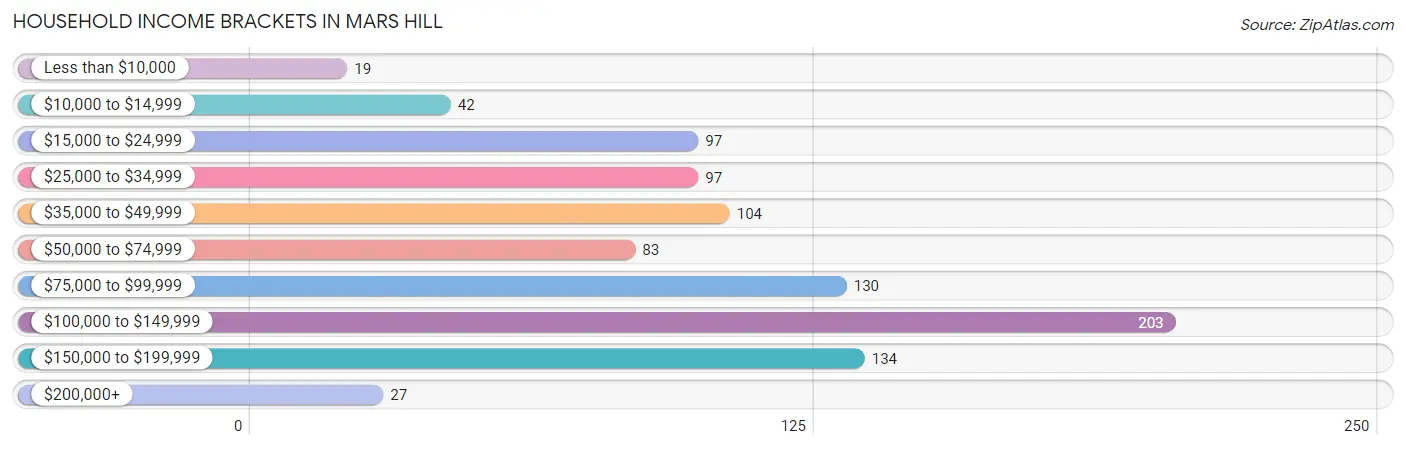
| Income Bracket | # Households | % Households |
| Less than $10,000 | 19 | 2.0% |
| $10,000 to $14,999 | 42 | 4.5% |
| $15,000 to $24,999 | 97 | 10.4% |
| $25,000 to $34,999 | 97 | 10.4% |
| $35,000 to $49,999 | 104 | 11.1% |
| $50,000 to $74,999 | 83 | 8.9% |
| $75,000 to $99,999 | 130 | 13.9% |
| $100,000 to $149,999 | 203 | 21.7% |
| $150,000 to $199,999 | 134 | 14.3% |
| $200,000+ | 27 | 2.9% |
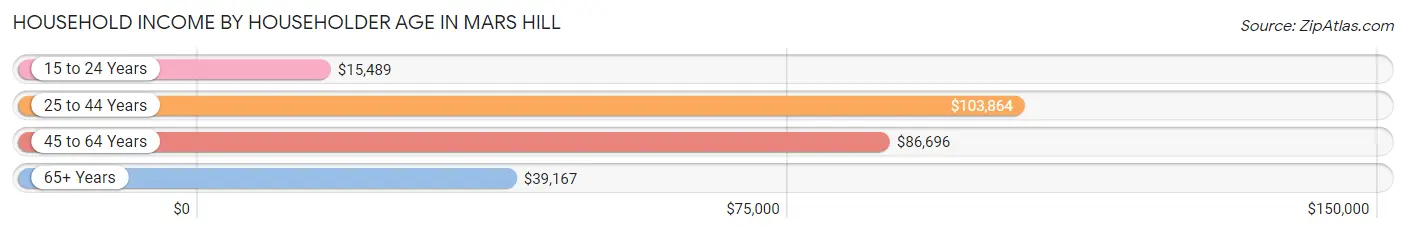
Household Income by Householder Age in Mars Hill
The median household income in Mars Hill is $80,833, with the highest median household income of $103,864 found in the 25 to 44 years age bracket for the primary householder. A total of 352 households (37.6%) fall into this category. Meanwhile, the 15 to 24 years age bracket for the primary householder has the lowest median household income of $15,489, with 47 households (5.0%) in this group.
| Income Bracket | # Households | Median Income |
| 15 to 24 Years | 47 (5.0%) | $15,489 |
| 25 to 44 Years | 352 (37.6%) | $103,864 |
| 45 to 64 Years | 263 (28.1%) | $86,696 |
| 65+ Years | 274 (29.3%) | $39,167 |
| Total | 936 (100.0%) | $80,833 |
Poverty in Mars Hill
Income Below Poverty by Sex and Age in Mars Hill
With 8.5% poverty level for males and 10.6% for females among the residents of Mars Hill, 18 to 24 year old males and 18 to 24 year old females are the most vulnerable to poverty, with 60 males (57.7%) and 77 females (74.0%) in their respective age groups living below the poverty level.
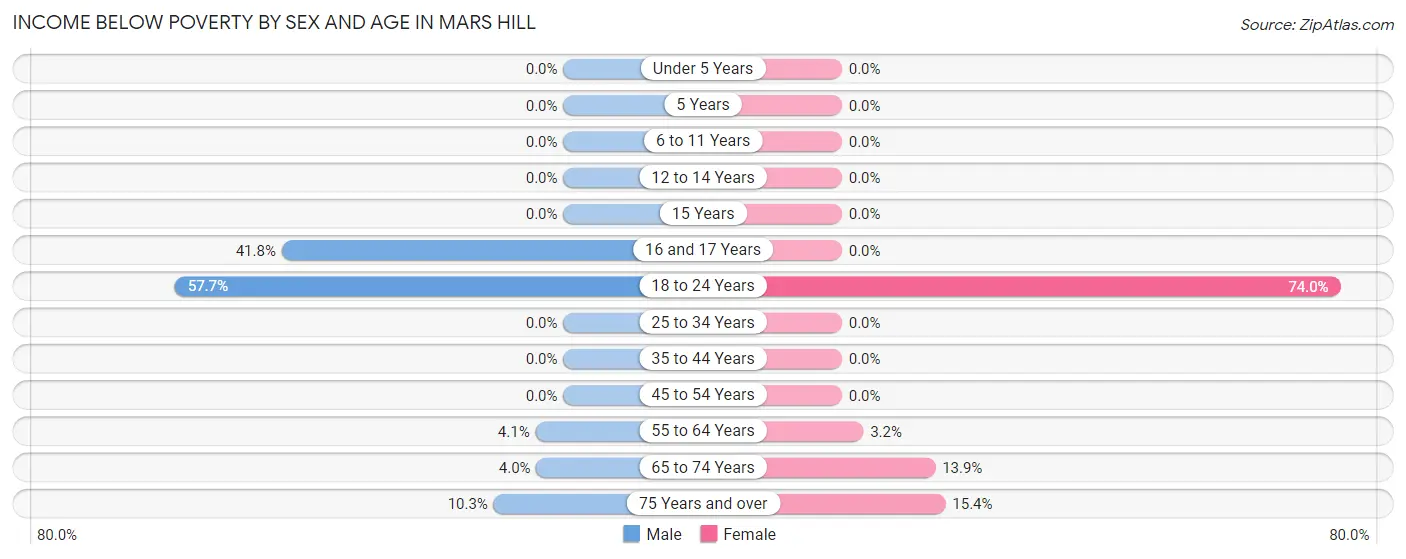
| Age Bracket | Male | Female |
| Under 5 Years | 0 (0.0%) | 0 (0.0%) |
| 5 Years | 0 (0.0%) | 0 (0.0%) |
| 6 to 11 Years | 0 (0.0%) | 0 (0.0%) |
| 12 to 14 Years | 0 (0.0%) | 0 (0.0%) |
| 15 Years | 0 (0.0%) | 0 (0.0%) |
| 16 and 17 Years | 23 (41.8%) | 0 (0.0%) |
| 18 to 24 Years | 60 (57.7%) | 77 (74.0%) |
| 25 to 34 Years | 0 (0.0%) | 0 (0.0%) |
| 35 to 44 Years | 0 (0.0%) | 0 (0.0%) |
| 45 to 54 Years | 0 (0.0%) | 0 (0.0%) |
| 55 to 64 Years | 6 (4.1%) | 5 (3.2%) |
| 65 to 74 Years | 5 (4.0%) | 19 (13.9%) |
| 75 Years and over | 6 (10.3%) | 12 (15.4%) |
| Total | 100 (8.5%) | 113 (10.6%) |
Income Above Poverty by Sex and Age in Mars Hill
According to the poverty statistics in Mars Hill, males aged under 5 years and females aged under 5 years are the age groups that are most secure financially, with 100.0% of males and 100.0% of females in these age groups living above the poverty line.
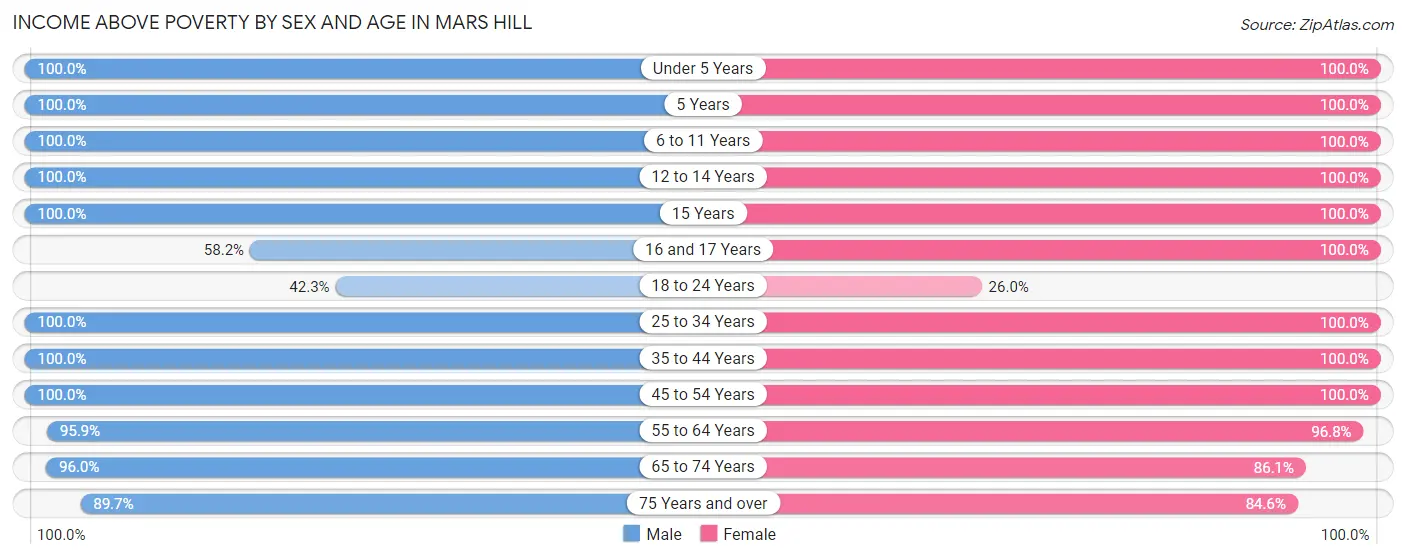
| Age Bracket | Male | Female |
| Under 5 Years | 74 (100.0%) | 10 (100.0%) |
| 5 Years | 32 (100.0%) | 3 (100.0%) |
| 6 to 11 Years | 86 (100.0%) | 123 (100.0%) |
| 12 to 14 Years | 27 (100.0%) | 20 (100.0%) |
| 15 Years | 9 (100.0%) | 8 (100.0%) |
| 16 and 17 Years | 32 (58.2%) | 38 (100.0%) |
| 18 to 24 Years | 44 (42.3%) | 27 (26.0%) |
| 25 to 34 Years | 181 (100.0%) | 88 (100.0%) |
| 35 to 44 Years | 211 (100.0%) | 195 (100.0%) |
| 45 to 54 Years | 65 (100.0%) | 107 (100.0%) |
| 55 to 64 Years | 139 (95.9%) | 152 (96.8%) |
| 65 to 74 Years | 120 (96.0%) | 118 (86.1%) |
| 75 Years and over | 52 (89.7%) | 66 (84.6%) |
| Total | 1,072 (91.5%) | 955 (89.4%) |
Income Below Poverty Among Married-Couple Families in Mars Hill
The poverty statistics for married-couple families in Mars Hill show that 2.6% or 11 of the total 429 families live below the poverty line. Families with no children have the highest poverty rate of 4.5%, comprising of 11 families. On the other hand, families with 1 or 2 children have the lowest poverty rate of 0.0%, which includes 0 families.
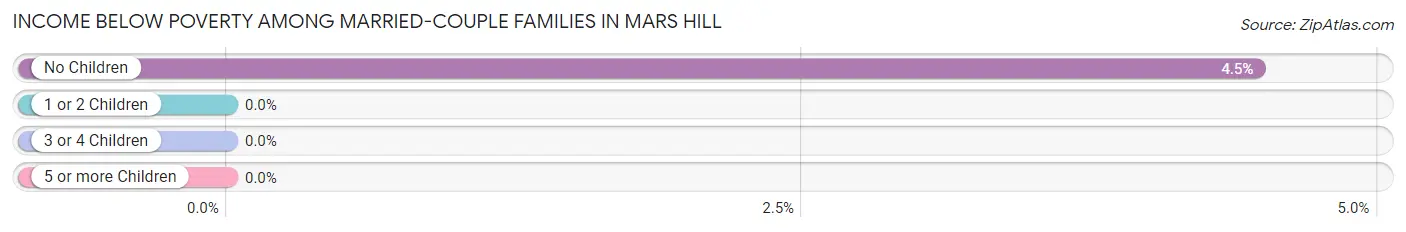
| Children | Above Poverty | Below Poverty |
| No Children | 235 (95.5%) | 11 (4.5%) |
| 1 or 2 Children | 131 (100.0%) | 0 (0.0%) |
| 3 or 4 Children | 45 (100.0%) | 0 (0.0%) |
| 5 or more Children | 7 (100.0%) | 0 (0.0%) |
| Total | 418 (97.4%) | 11 (2.6%) |
Income Below Poverty Among Single-Parent Households in Mars Hill
| Children | Single Father | Single Mother |
| No Children | 0 (0.0%) | 0 (0.0%) |
| 1 or 2 Children | 0 (0.0%) | 0 (0.0%) |
| 3 or 4 Children | 0 (0.0%) | 0 (0.0%) |
| 5 or more Children | 0 (0.0%) | 0 (0.0%) |
| Total | 0 (0.0%) | 0 (0.0%) |
Income Below Poverty Among Married-Couple vs Single-Parent Households in Mars Hill
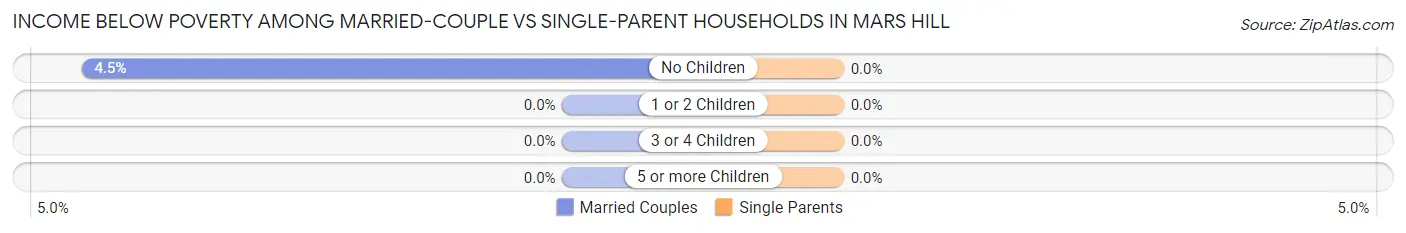
| Children | Married-Couple Families | Single-Parent Households |
| No Children | 11 (4.5%) | 0 (0.0%) |
| 1 or 2 Children | 0 (0.0%) | 0 (0.0%) |
| 3 or 4 Children | 0 (0.0%) | 0 (0.0%) |
| 5 or more Children | 0 (0.0%) | 0 (0.0%) |
| Total | 11 (2.6%) | 0 (0.0%) |
Race in Mars Hill
The most populous races in Mars Hill are White / Caucasian (2,589 | 91.1%), Black / African American (145 | 5.1%), and Hispanic or Latino (138 | 4.9%).
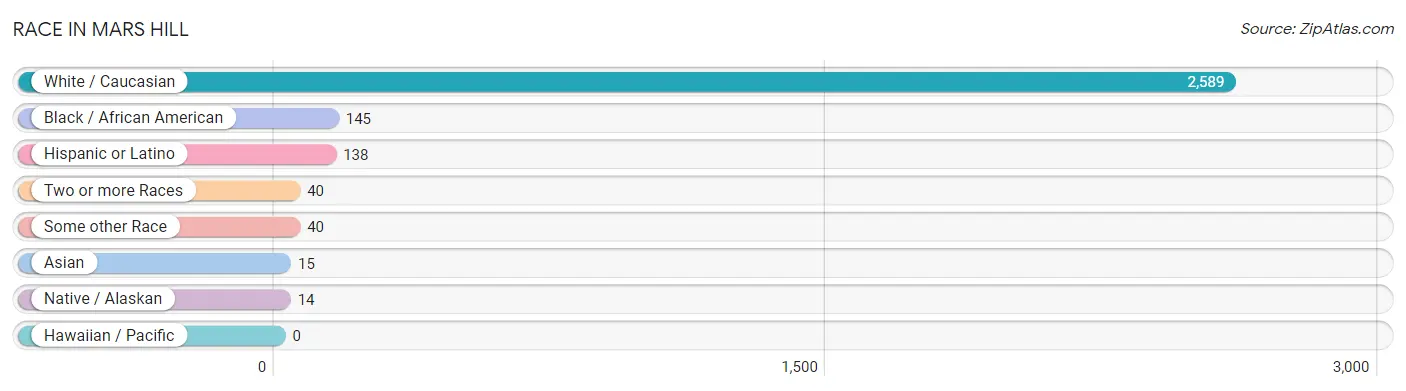
| Race | # Population | % Population |
| Asian | 15 | 0.5% |
| Black / African American | 145 | 5.1% |
| Hawaiian / Pacific | 0 | 0.0% |
| Hispanic or Latino | 138 | 4.9% |
| Native / Alaskan | 14 | 0.5% |
| White / Caucasian | 2,589 | 91.1% |
| Two or more Races | 40 | 1.4% |
| Some other Race | 40 | 1.4% |
| Total | 2,843 | 100.0% |
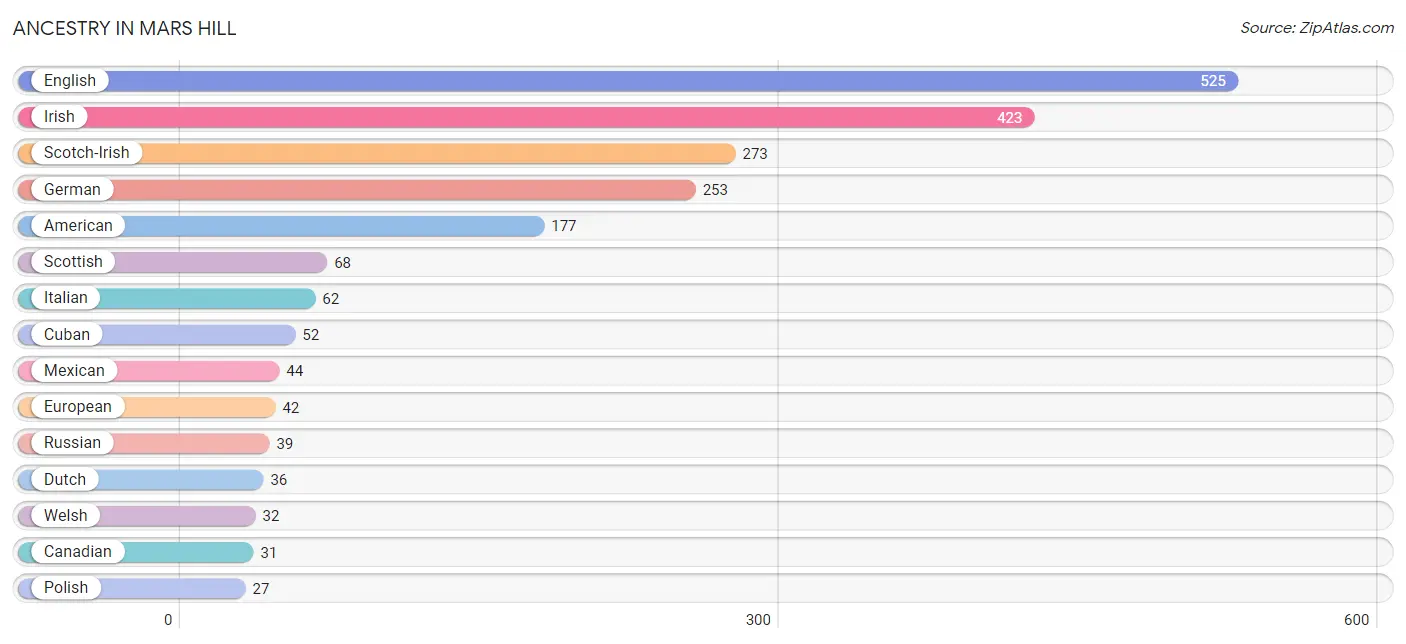
Ancestry in Mars Hill
The most populous ancestries reported in Mars Hill are English (525 | 18.5%), Irish (423 | 14.9%), Scotch-Irish (273 | 9.6%), German (253 | 8.9%), and American (177 | 6.2%), together accounting for 58.1% of all Mars Hill residents.
| Ancestry | # Population | % Population |
| African | 6 | 0.2% |
| American | 177 | 6.2% |
| Australian | 13 | 0.5% |
| Austrian | 9 | 0.3% |
| Bhutanese | 5 | 0.2% |
| British | 12 | 0.4% |
| Canadian | 31 | 1.1% |
| Cherokee | 9 | 0.3% |
| Chilean | 13 | 0.5% |
| Cuban | 52 | 1.8% |
| Dutch | 36 | 1.3% |
| English | 525 | 18.5% |
| European | 42 | 1.5% |
| French | 19 | 0.7% |
| French Canadian | 3 | 0.1% |
| German | 253 | 8.9% |
| Haitian | 4 | 0.1% |
| Indian (Asian) | 6 | 0.2% |
| Indonesian | 2 | 0.1% |
| Irish | 423 | 14.9% |
| Italian | 62 | 2.2% |
| Korean | 2 | 0.1% |
| Mexican | 44 | 1.5% |
| Norwegian | 6 | 0.2% |
| Polish | 27 | 0.9% |
| Romanian | 6 | 0.2% |
| Russian | 39 | 1.4% |
| Scotch-Irish | 273 | 9.6% |
| Scottish | 68 | 2.4% |
| South American | 13 | 0.5% |
| Spaniard | 7 | 0.3% |
| Spanish | 5 | 0.2% |
| Subsaharan African | 6 | 0.2% |
| Swiss | 3 | 0.1% |
| Ukrainian | 7 | 0.3% |
| Welsh | 32 | 1.1% | View All 36 Rows |
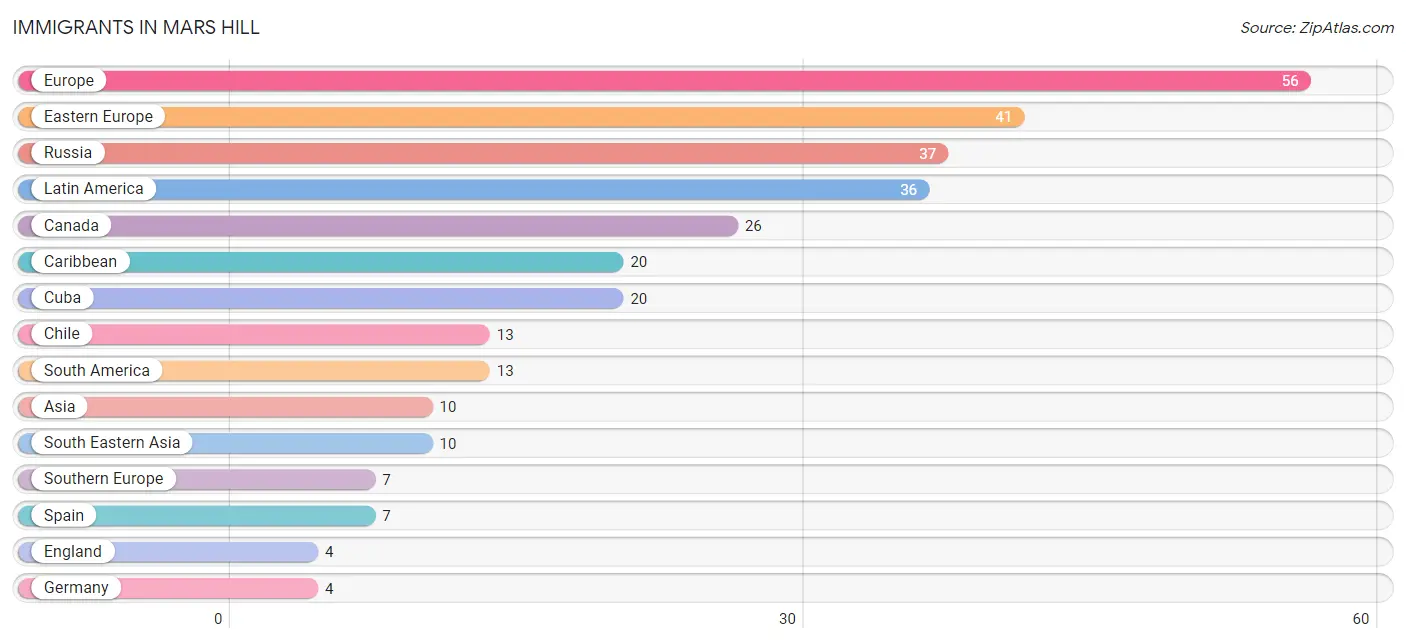
Immigrants in Mars Hill
The most numerous immigrant groups reported in Mars Hill came from Europe (56 | 2.0%), Eastern Europe (41 | 1.4%), Russia (37 | 1.3%), Latin America (36 | 1.3%), and Canada (26 | 0.9%), together accounting for 6.9% of all Mars Hill residents.
| Immigration Origin | # Population | % Population |
| Asia | 10 | 0.4% |
| Canada | 26 | 0.9% |
| Caribbean | 20 | 0.7% |
| Central America | 3 | 0.1% |
| Chile | 13 | 0.5% |
| Cuba | 20 | 0.7% |
| Eastern Europe | 41 | 1.4% |
| England | 4 | 0.1% |
| Europe | 56 | 2.0% |
| Germany | 4 | 0.1% |
| Latin America | 36 | 1.3% |
| Malaysia | 4 | 0.1% |
| Mexico | 3 | 0.1% |
| Northern Europe | 4 | 0.1% |
| Philippines | 2 | 0.1% |
| Russia | 37 | 1.3% |
| South America | 13 | 0.5% |
| South Eastern Asia | 10 | 0.4% |
| Southern Europe | 7 | 0.3% |
| Spain | 7 | 0.3% |
| Ukraine | 4 | 0.1% |
| Western Europe | 4 | 0.1% | View All 22 Rows |
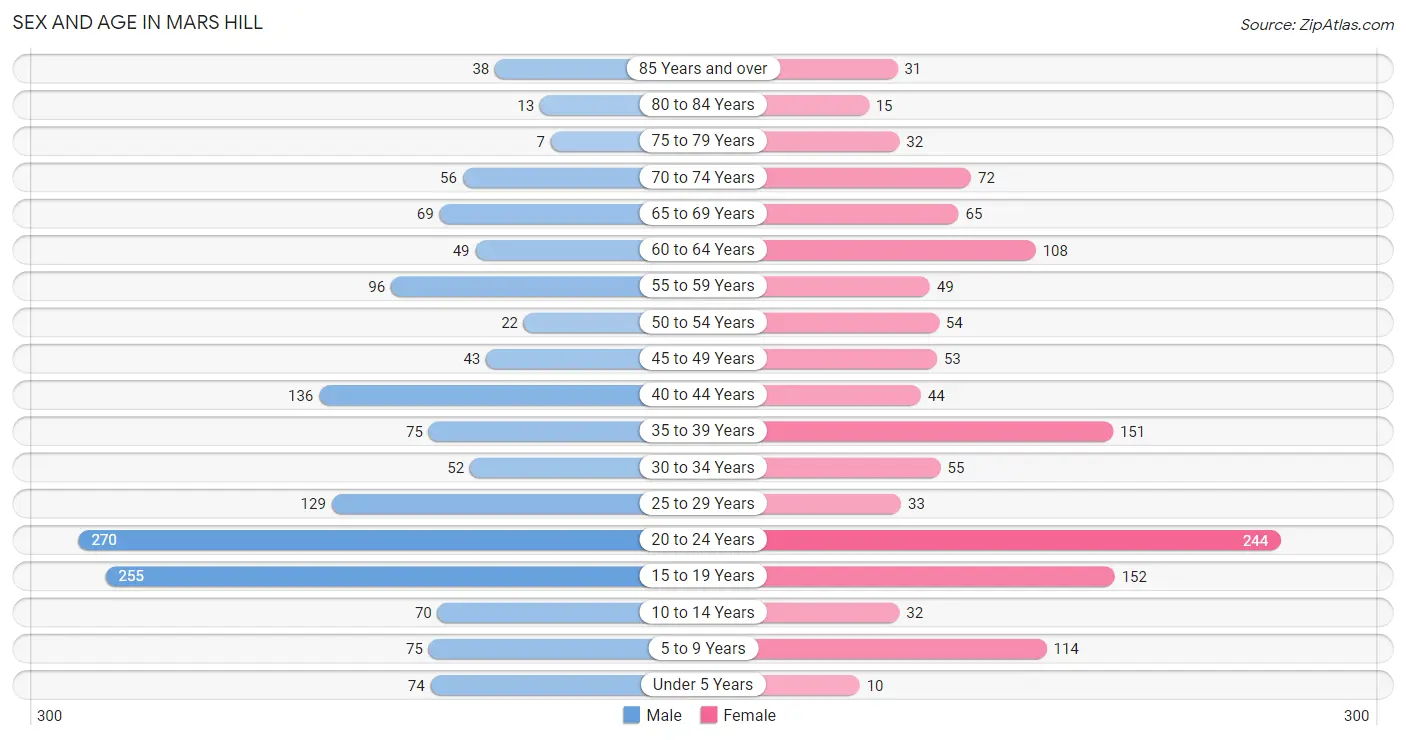
Sex and Age in Mars Hill
Sex and Age in Mars Hill
The most populous age groups in Mars Hill are 20 to 24 Years (270 | 17.7%) for men and 20 to 24 Years (244 | 18.6%) for women.
| Age Bracket | Male | Female |
| Under 5 Years | 74 (4.8%) | 10 (0.8%) |
| 5 to 9 Years | 75 (4.9%) | 114 (8.7%) |
| 10 to 14 Years | 70 (4.6%) | 32 (2.4%) |
| 15 to 19 Years | 255 (16.7%) | 152 (11.6%) |
| 20 to 24 Years | 270 (17.7%) | 244 (18.6%) |
| 25 to 29 Years | 129 (8.4%) | 33 (2.5%) |
| 30 to 34 Years | 52 (3.4%) | 55 (4.2%) |
| 35 to 39 Years | 75 (4.9%) | 151 (11.5%) |
| 40 to 44 Years | 136 (8.9%) | 44 (3.4%) |
| 45 to 49 Years | 43 (2.8%) | 53 (4.0%) |
| 50 to 54 Years | 22 (1.4%) | 54 (4.1%) |
| 55 to 59 Years | 96 (6.3%) | 49 (3.7%) |
| 60 to 64 Years | 49 (3.2%) | 108 (8.2%) |
| 65 to 69 Years | 69 (4.5%) | 65 (5.0%) |
| 70 to 74 Years | 56 (3.7%) | 72 (5.5%) |
| 75 to 79 Years | 7 (0.5%) | 32 (2.4%) |
| 80 to 84 Years | 13 (0.9%) | 15 (1.1%) |
| 85 Years and over | 38 (2.5%) | 31 (2.4%) |
| Total | 1,529 (100.0%) | 1,314 (100.0%) |
Families and Households in Mars Hill
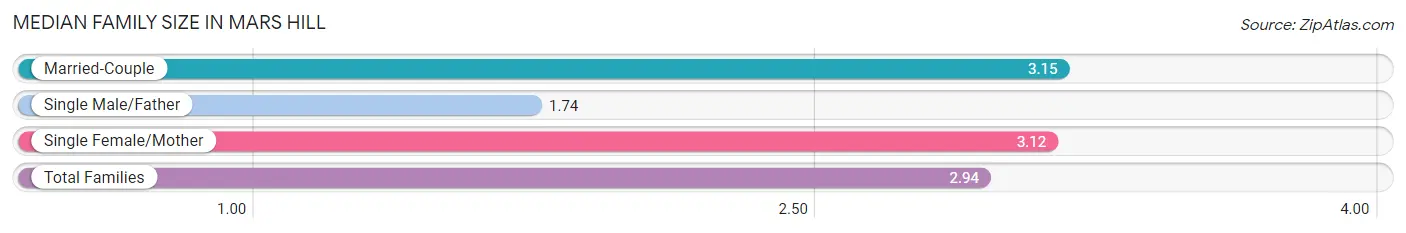
Median Family Size in Mars Hill
The median family size in Mars Hill is 2.94 persons per family, with married-couple families (429 | 78.9%) accounting for the largest median family size of 3.15 persons per family. On the other hand, single male/father families (81 | 14.9%) represent the smallest median family size with 1.74 persons per family.
| Family Type | # Families | Family Size |
| Married-Couple | 429 (78.9%) | 3.15 |
| Single Male/Father | 81 (14.9%) | 1.74 |
| Single Female/Mother | 34 (6.2%) | 3.12 |
| Total Families | 544 (100.0%) | 2.94 |
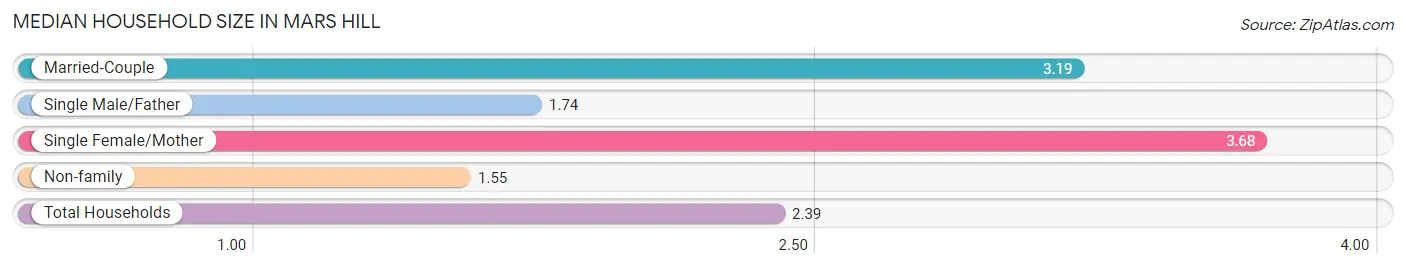
Median Household Size in Mars Hill
The median household size in Mars Hill is 2.39 persons per household, with single female/mother households (34 | 3.6%) accounting for the largest median household size of 3.68 persons per household. non-family households (392 | 41.9%) represent the smallest median household size with 1.55 persons per household.
| Household Type | # Households | Household Size |
| Married-Couple | 429 (45.8%) | 3.19 |
| Single Male/Father | 81 (8.6%) | 1.74 |
| Single Female/Mother | 34 (3.6%) | 3.68 |
| Non-family | 392 (41.9%) | 1.55 |
| Total Households | 936 (100.0%) | 2.39 |
Household Size by Marriage Status in Mars Hill
Out of a total of 936 households in Mars Hill, 544 (58.1%) are family households, while 392 (41.9%) are nonfamily households. The most numerous type of family households are 2-person households, comprising 285, and the most common type of nonfamily households are 1-person households, comprising 289.
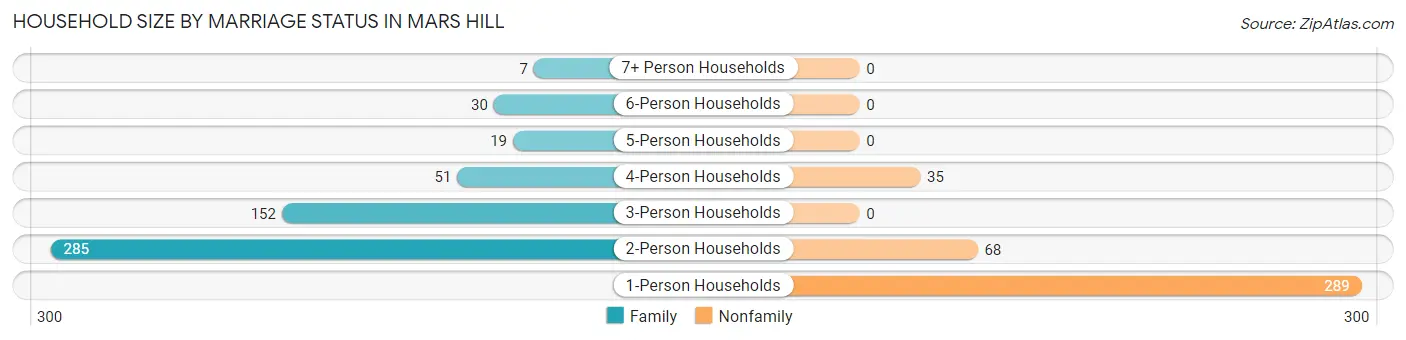
| Household Size | Family Households | Nonfamily Households |
| 1-Person Households | - | 289 (30.9%) |
| 2-Person Households | 285 (30.4%) | 68 (7.3%) |
| 3-Person Households | 152 (16.2%) | 0 (0.0%) |
| 4-Person Households | 51 (5.4%) | 35 (3.7%) |
| 5-Person Households | 19 (2.0%) | 0 (0.0%) |
| 6-Person Households | 30 (3.2%) | 0 (0.0%) |
| 7+ Person Households | 7 (0.7%) | 0 (0.0%) |
| Total | 544 (58.1%) | 392 (41.9%) |
Female Fertility in Mars Hill
Fertility by Age in Mars Hill
Average fertility rate in Mars Hill is 13.0 births per 1,000 women. Women in the age bracket of 35 to 50 years have the highest fertility rate with 37.0 births per 1,000 women. Women in the age bracket of 35 to 50 years acount for 100.0% of all women with births.
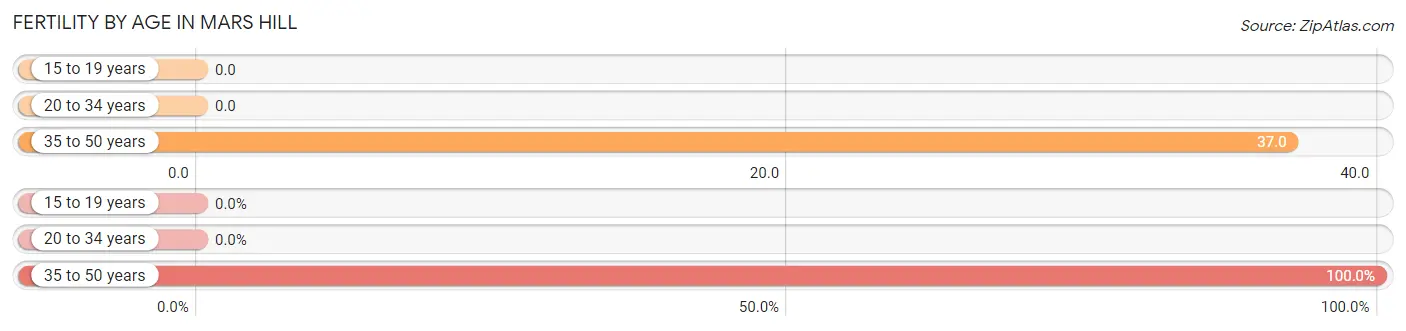
| Age Bracket | Women with Births | Births / 1,000 Women |
| 15 to 19 years | 0 (0.0%) | 0.0 |
| 20 to 34 years | 0 (0.0%) | 0.0 |
| 35 to 50 years | 10 (100.0%) | 37.0 |
| Total | 10 (100.0%) | 13.0 |
Fertility by Age by Marriage Status in Mars Hill
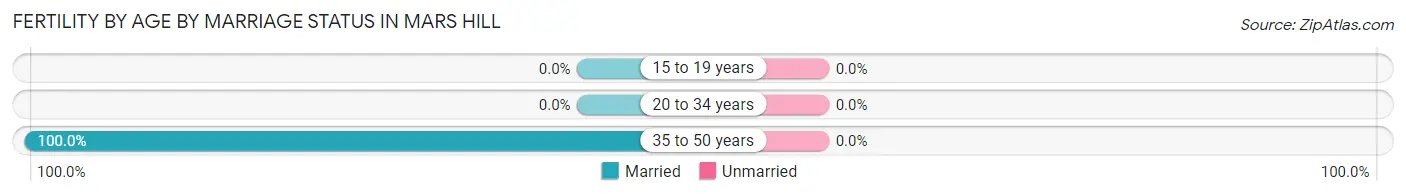
| Age Bracket | Married | Unmarried |
| 15 to 19 years | 0 (0.0%) | 0 (0.0%) |
| 20 to 34 years | 0 (0.0%) | 0 (0.0%) |
| 35 to 50 years | 10 (100.0%) | 0 (0.0%) |
| Total | 10 (100.0%) | 0 (0.0%) |
Fertility by Education in Mars Hill
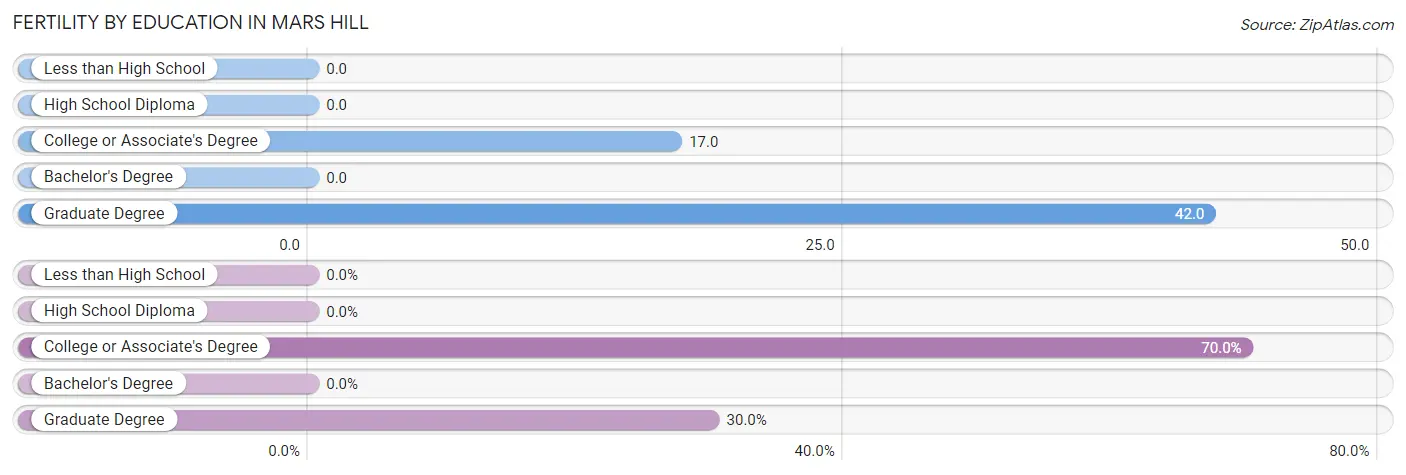
| Educational Attainment | Women with Births | Births / 1,000 Women |
| Less than High School | 0 (0.0%) | 0.0 |
| High School Diploma | 0 (0.0%) | 0.0 |
| College or Associate's Degree | 7 (70.0%) | 17.0 |
| Bachelor's Degree | 0 (0.0%) | 0.0 |
| Graduate Degree | 3 (30.0%) | 42.0 |
| Total | 10 (100.0%) | 13.0 |
Fertility by Education by Marriage Status in Mars Hill
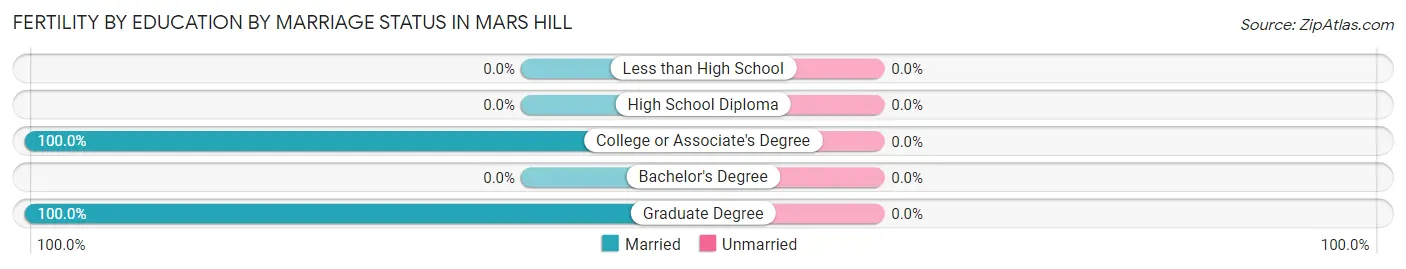
| Educational Attainment | Married | Unmarried |
| Less than High School | 0 (0.0%) | 0 (0.0%) |
| High School Diploma | 0 (0.0%) | 0 (0.0%) |
| College or Associate's Degree | 7 (100.0%) | 0 (0.0%) |
| Bachelor's Degree | 0 (0.0%) | 0 (0.0%) |
| Graduate Degree | 3 (100.0%) | 0 (0.0%) |
| Total | 10 (100.0%) | 0 (0.0%) |
Employment Characteristics in Mars Hill
Employment by Class of Employer in Mars Hill
Among the 1,239 employed individuals in Mars Hill, private company employees (763 | 61.6%), local government employees (193 | 15.6%), and not-for-profit organizations (131 | 10.6%) make up the most common classes of employment.
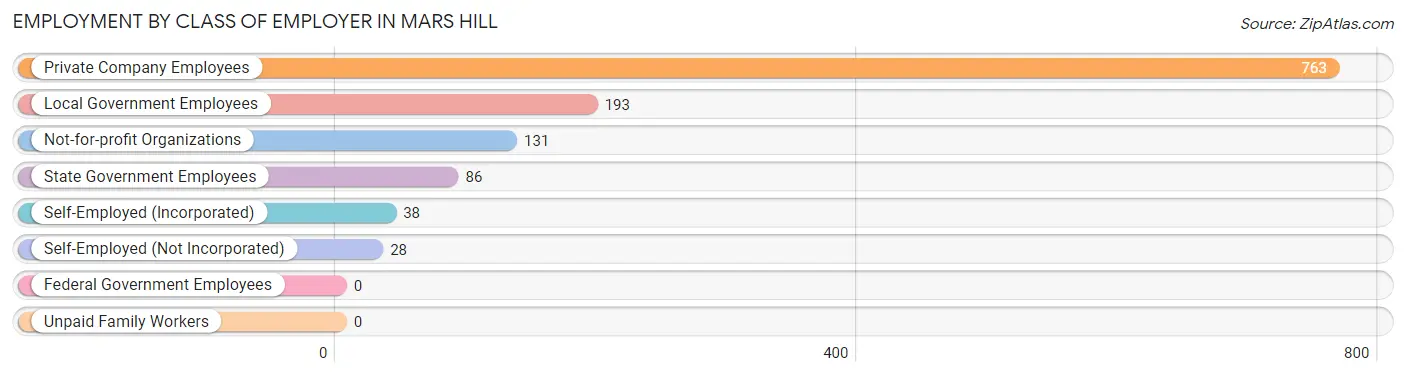
| Employer Class | # Employees | % Employees |
| Private Company Employees | 763 | 61.6% |
| Self-Employed (Incorporated) | 38 | 3.1% |
| Self-Employed (Not Incorporated) | 28 | 2.3% |
| Not-for-profit Organizations | 131 | 10.6% |
| Local Government Employees | 193 | 15.6% |
| State Government Employees | 86 | 6.9% |
| Federal Government Employees | 0 | 0.0% |
| Unpaid Family Workers | 0 | 0.0% |
| Total | 1,239 | 100.0% |
Employment Status by Age in Mars Hill
According to the labor force statistics for Mars Hill, out of the total population over 16 years of age (2,451), 54.8% or 1,343 individuals are in the labor force, with 2.2% or 30 of them unemployed. The age group with the highest labor force participation rate is 25 to 29 years, with 100.0% or 162 individuals in the labor force. Within the labor force, the 16 to 19 years age range has the highest percentage of unemployed individuals, with 14.6% or 14 of them being unemployed.
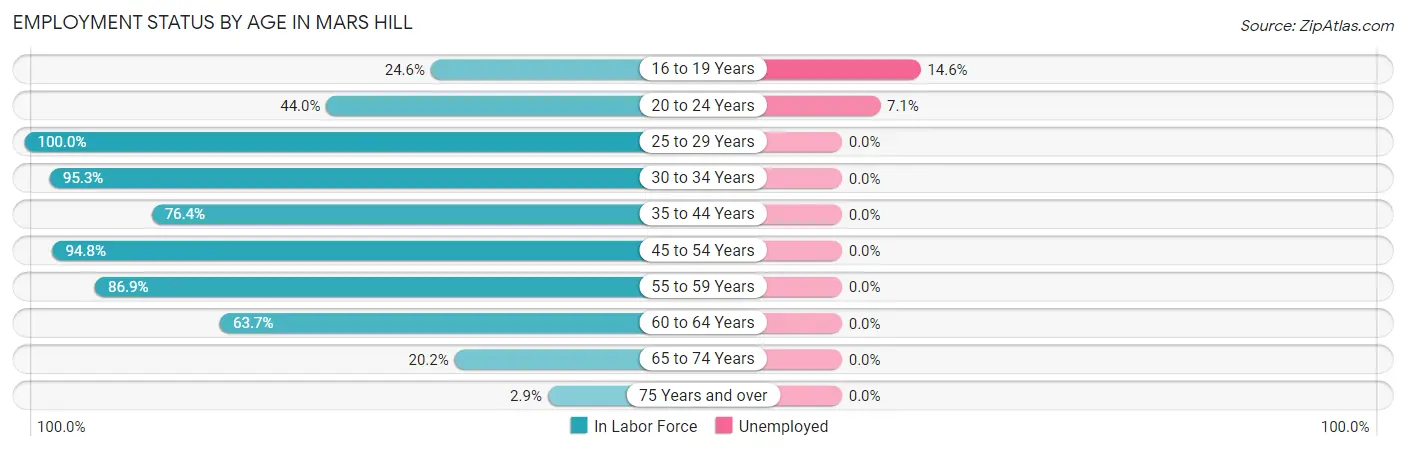
| Age Bracket | In Labor Force | Unemployed |
| 16 to 19 Years | 96 (24.6%) | 14 (14.6%) |
| 20 to 24 Years | 226 (44.0%) | 16 (7.1%) |
| 25 to 29 Years | 162 (100.0%) | 0 (0.0%) |
| 30 to 34 Years | 102 (95.3%) | 0 (0.0%) |
| 35 to 44 Years | 310 (76.4%) | 0 (0.0%) |
| 45 to 54 Years | 163 (94.8%) | 0 (0.0%) |
| 55 to 59 Years | 126 (86.9%) | 0 (0.0%) |
| 60 to 64 Years | 100 (63.7%) | 0 (0.0%) |
| 65 to 74 Years | 53 (20.2%) | 0 (0.0%) |
| 75 Years and over | 4 (2.9%) | 0 (0.0%) |
| Total | 1,343 (54.8%) | 30 (2.2%) |
Employment Status by Educational Attainment in Mars Hill
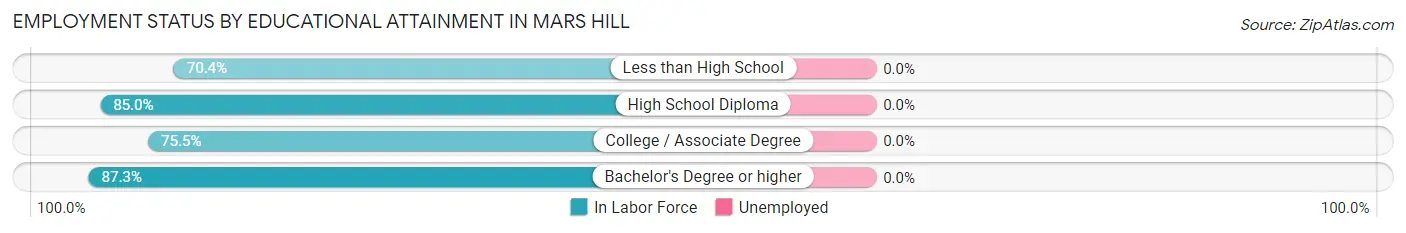
| Educational Attainment | In Labor Force | Unemployed |
| Less than High School | 19 (70.4%) | 0 (0.0%) |
| High School Diploma | 233 (85.0%) | 0 (0.0%) |
| College / Associate Degree | 188 (75.5%) | 0 (0.0%) |
| Bachelor's Degree or higher | 523 (87.3%) | 0 (0.0%) |
| Total | 963 (83.8%) | 0 (0.0%) |
Employment Occupations by Sex in Mars Hill
Management, Business, Science and Arts Occupations
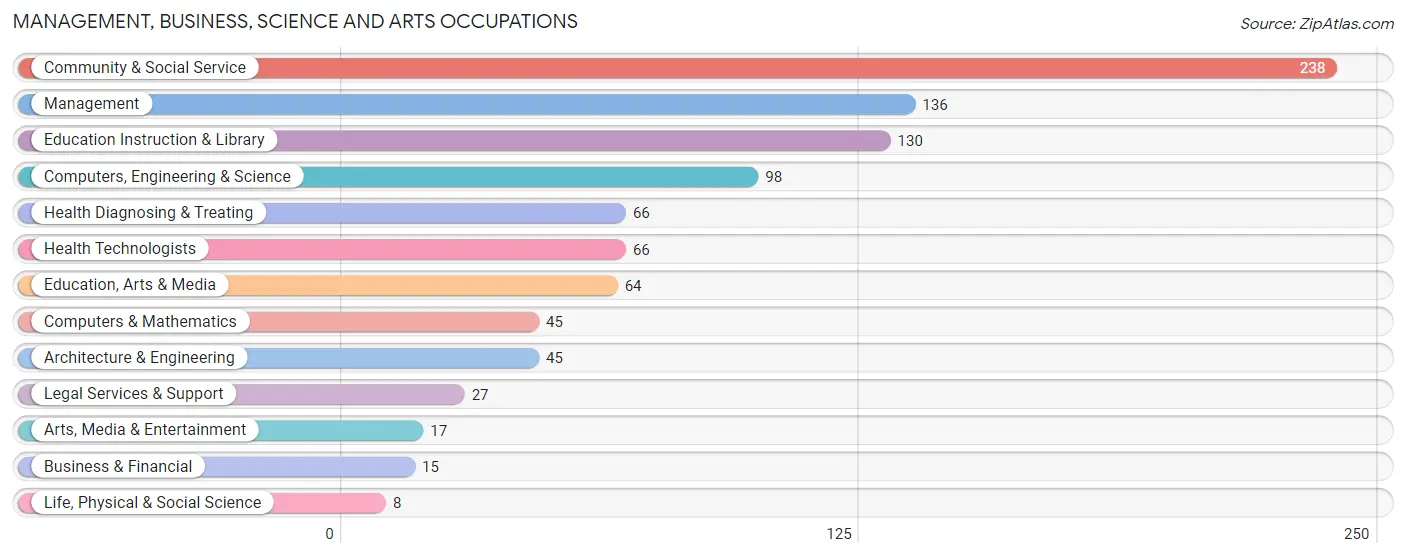
The most common Management, Business, Science and Arts occupations in Mars Hill are Community & Social Service (238 | 18.1%), Management (136 | 10.4%), Education Instruction & Library (130 | 9.9%), Computers, Engineering & Science (98 | 7.5%), and Health Diagnosing & Treating (66 | 5.0%).
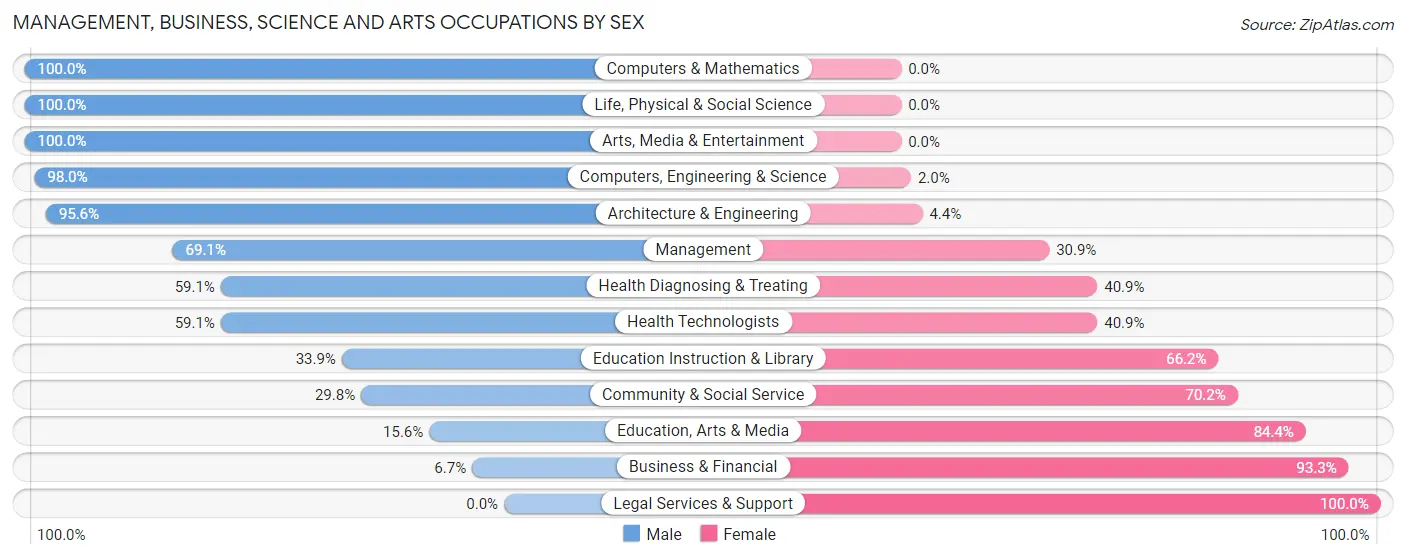
Management, Business, Science and Arts Occupations by Sex
Within the Management, Business, Science and Arts occupations in Mars Hill, the most male-oriented occupations are Computers & Mathematics (100.0%), Life, Physical & Social Science (100.0%), and Arts, Media & Entertainment (100.0%), while the most female-oriented occupations are Legal Services & Support (100.0%), Business & Financial (93.3%), and Education, Arts & Media (84.4%).
| Occupation | Male | Female |
| Management | 94 (69.1%) | 42 (30.9%) |
| Business & Financial | 1 (6.7%) | 14 (93.3%) |
| Computers, Engineering & Science | 96 (98.0%) | 2 (2.0%) |
| Computers & Mathematics | 45 (100.0%) | 0 (0.0%) |
| Architecture & Engineering | 43 (95.6%) | 2 (4.4%) |
| Life, Physical & Social Science | 8 (100.0%) | 0 (0.0%) |
| Community & Social Service | 71 (29.8%) | 167 (70.2%) |
| Education, Arts & Media | 10 (15.6%) | 54 (84.4%) |
| Legal Services & Support | 0 (0.0%) | 27 (100.0%) |
| Education Instruction & Library | 44 (33.9%) | 86 (66.1%) |
| Arts, Media & Entertainment | 17 (100.0%) | 0 (0.0%) |
| Health Diagnosing & Treating | 39 (59.1%) | 27 (40.9%) |
| Health Technologists | 39 (59.1%) | 27 (40.9%) |
| Total (Category) | 301 (54.4%) | 252 (45.6%) |
| Total (Overall) | 691 (52.7%) | 621 (47.3%) |
Services Occupations
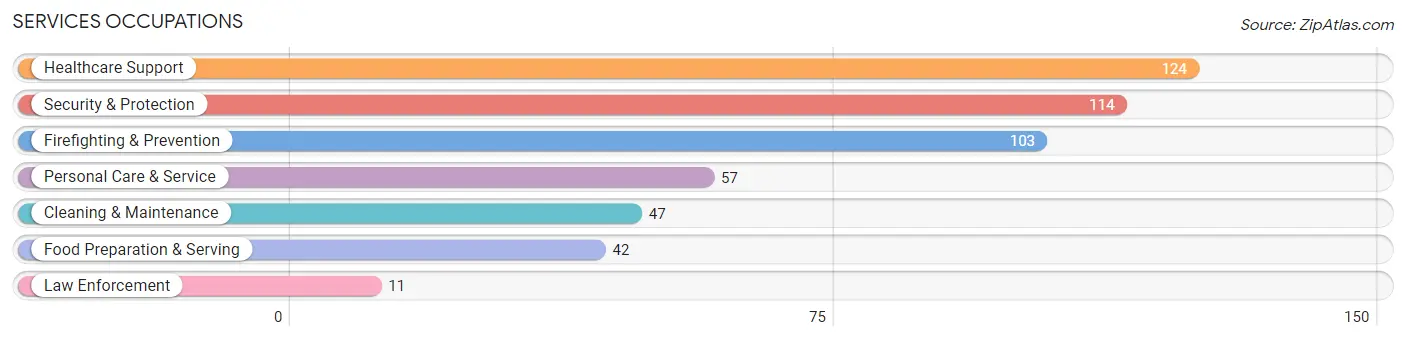
The most common Services occupations in Mars Hill are Healthcare Support (124 | 9.5%), Security & Protection (114 | 8.7%), Firefighting & Prevention (103 | 7.9%), Personal Care & Service (57 | 4.3%), and Cleaning & Maintenance (47 | 3.6%).
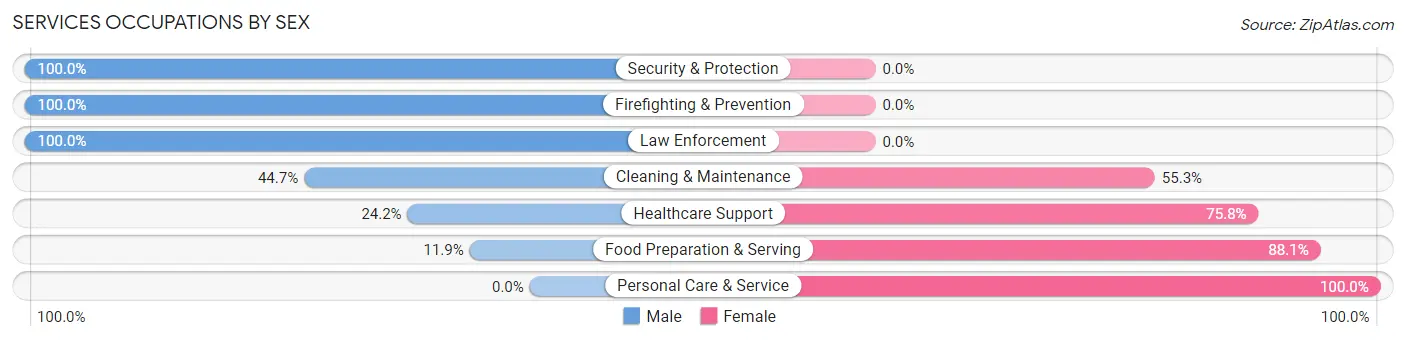
Services Occupations by Sex
Within the Services occupations in Mars Hill, the most male-oriented occupations are Security & Protection (100.0%), Firefighting & Prevention (100.0%), and Law Enforcement (100.0%), while the most female-oriented occupations are Personal Care & Service (100.0%), Food Preparation & Serving (88.1%), and Healthcare Support (75.8%).
| Occupation | Male | Female |
| Healthcare Support | 30 (24.2%) | 94 (75.8%) |
| Security & Protection | 114 (100.0%) | 0 (0.0%) |
| Firefighting & Prevention | 103 (100.0%) | 0 (0.0%) |
| Law Enforcement | 11 (100.0%) | 0 (0.0%) |
| Food Preparation & Serving | 5 (11.9%) | 37 (88.1%) |
| Cleaning & Maintenance | 21 (44.7%) | 26 (55.3%) |
| Personal Care & Service | 0 (0.0%) | 57 (100.0%) |
| Total (Category) | 170 (44.3%) | 214 (55.7%) |
| Total (Overall) | 691 (52.7%) | 621 (47.3%) |
Sales and Office Occupations
The most common Sales and Office occupations in Mars Hill are Sales & Related (148 | 11.3%), and Office & Administration (23 | 1.8%).
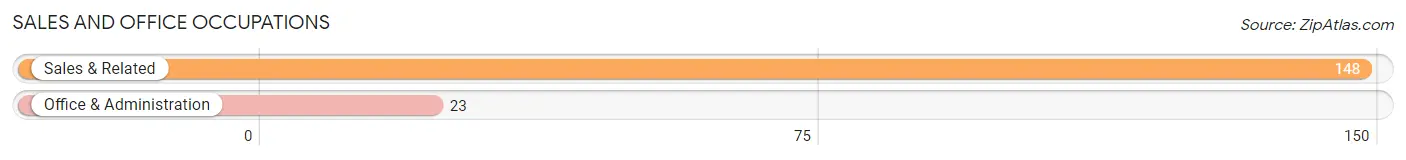
Sales and Office Occupations by Sex
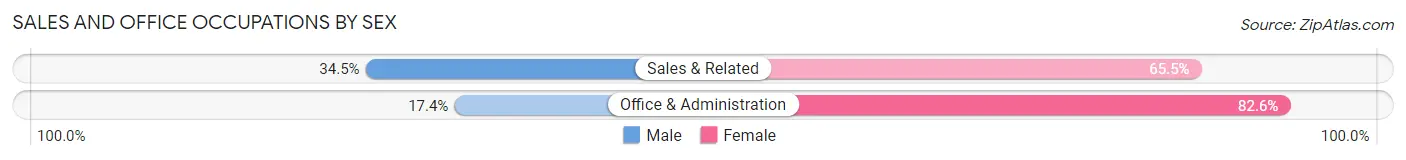
| Occupation | Male | Female |
| Sales & Related | 51 (34.5%) | 97 (65.5%) |
| Office & Administration | 4 (17.4%) | 19 (82.6%) |
| Total (Category) | 55 (32.2%) | 116 (67.8%) |
| Total (Overall) | 691 (52.7%) | 621 (47.3%) |
Natural Resources, Construction and Maintenance Occupations
The most common Natural Resources, Construction and Maintenance occupations in Mars Hill are Construction & Extraction (46 | 3.5%), and Installation, Maintenance & Repair (20 | 1.5%).
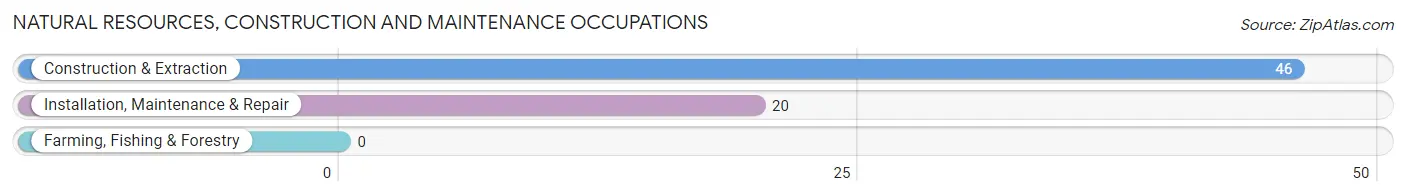
Natural Resources, Construction and Maintenance Occupations by Sex
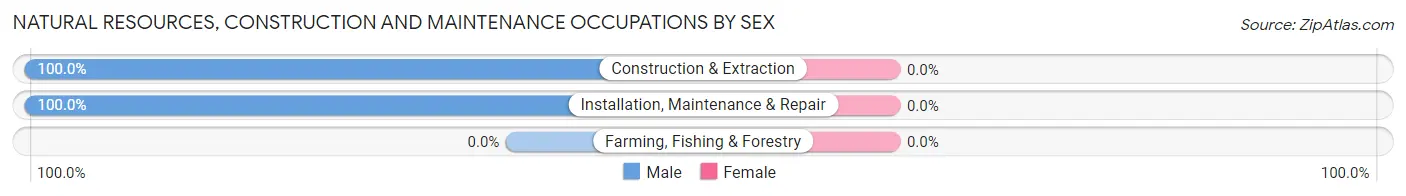
| Occupation | Male | Female |
| Farming, Fishing & Forestry | 0 (0.0%) | 0 (0.0%) |
| Construction & Extraction | 46 (100.0%) | 0 (0.0%) |
| Installation, Maintenance & Repair | 20 (100.0%) | 0 (0.0%) |
| Total (Category) | 66 (100.0%) | 0 (0.0%) |
| Total (Overall) | 691 (52.7%) | 621 (47.3%) |
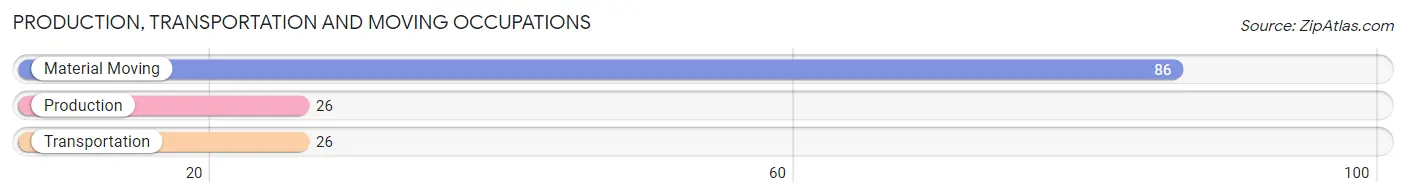
Production, Transportation and Moving Occupations
The most common Production, Transportation and Moving occupations in Mars Hill are Material Moving (86 | 6.6%), Production (26 | 2.0%), and Transportation (26 | 2.0%).
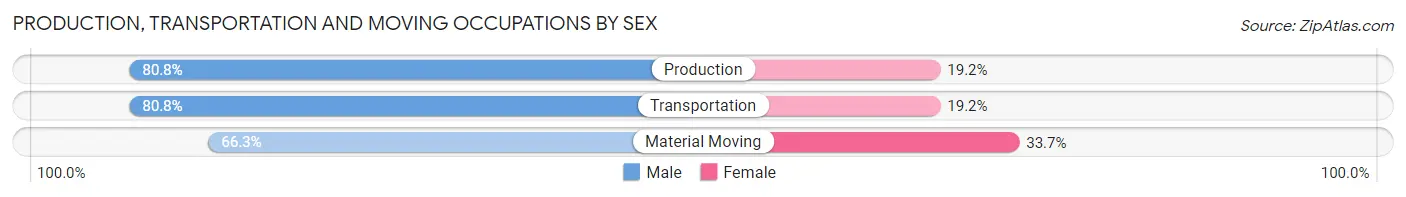
Production, Transportation and Moving Occupations by Sex
| Occupation | Male | Female |
| Production | 21 (80.8%) | 5 (19.2%) |
| Transportation | 21 (80.8%) | 5 (19.2%) |
| Material Moving | 57 (66.3%) | 29 (33.7%) |
| Total (Category) | 99 (71.7%) | 39 (28.3%) |
| Total (Overall) | 691 (52.7%) | 621 (47.3%) |
Employment Industries by Sex in Mars Hill
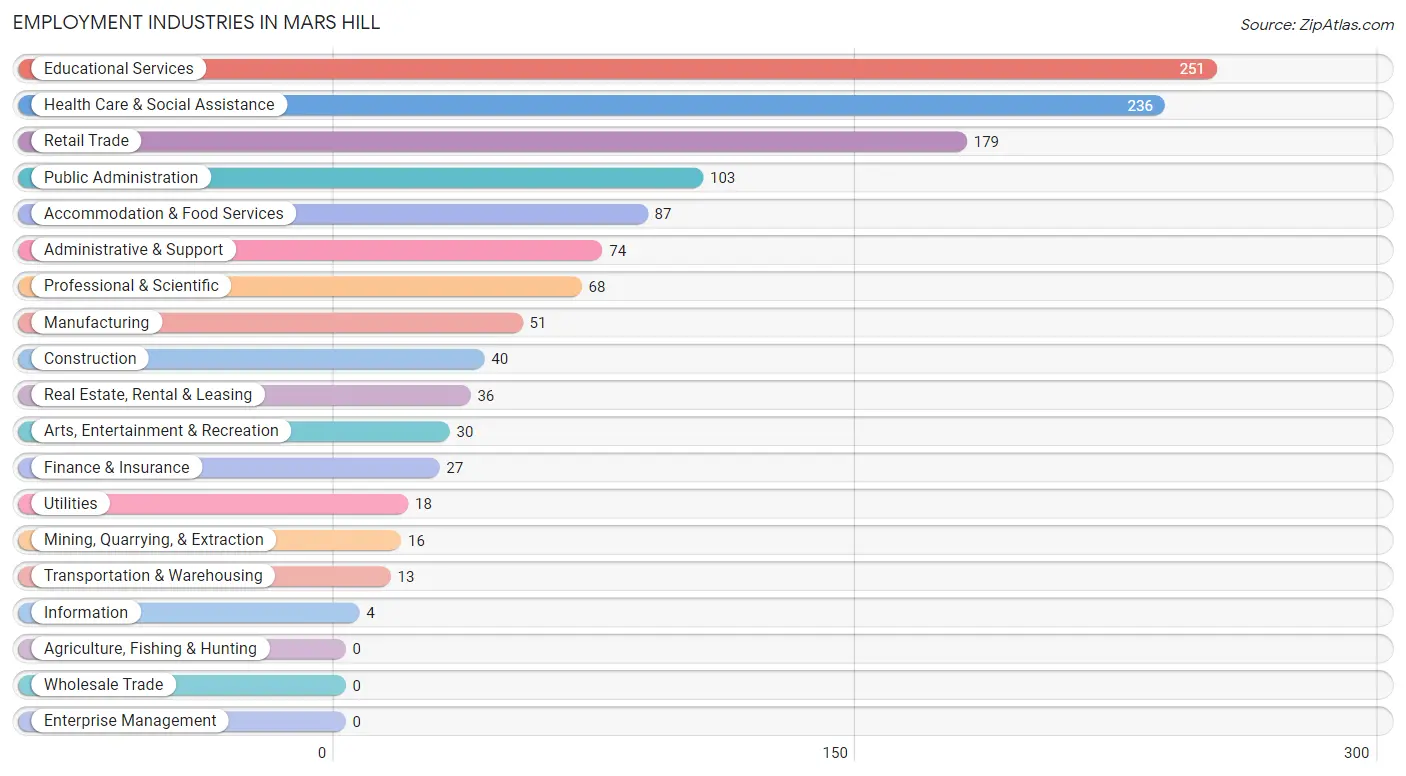
Employment Industries in Mars Hill
The major employment industries in Mars Hill include Educational Services (251 | 19.1%), Health Care & Social Assistance (236 | 18.0%), Retail Trade (179 | 13.6%), Public Administration (103 | 7.9%), and Accommodation & Food Services (87 | 6.6%).
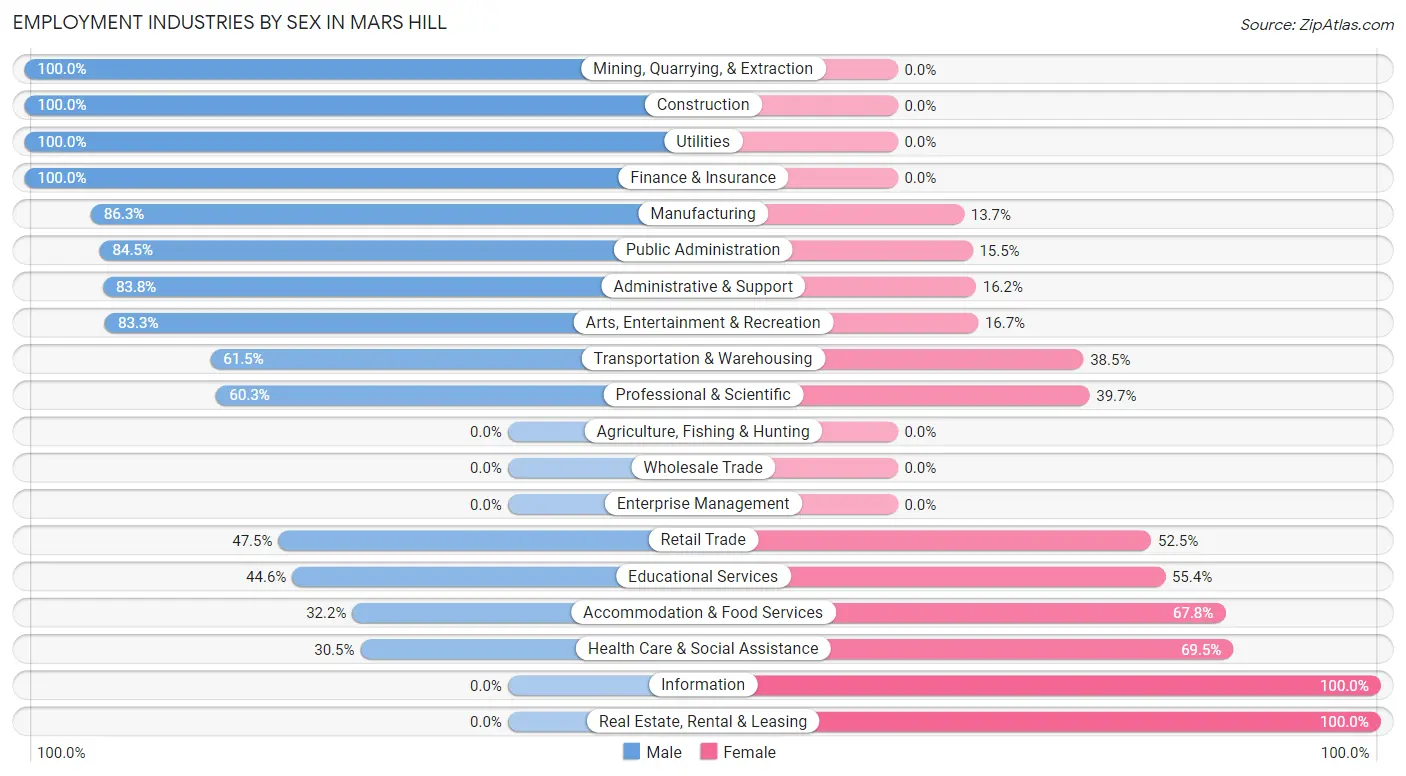
Employment Industries by Sex in Mars Hill
The Mars Hill industries that see more men than women are Mining, Quarrying, & Extraction (100.0%), Construction (100.0%), and Utilities (100.0%), whereas the industries that tend to have a higher number of women are Information (100.0%), Real Estate, Rental & Leasing (100.0%), and Health Care & Social Assistance (69.5%).
| Industry | Male | Female |
| Agriculture, Fishing & Hunting | 0 (0.0%) | 0 (0.0%) |
| Mining, Quarrying, & Extraction | 16 (100.0%) | 0 (0.0%) |
| Construction | 40 (100.0%) | 0 (0.0%) |
| Manufacturing | 44 (86.3%) | 7 (13.7%) |
| Wholesale Trade | 0 (0.0%) | 0 (0.0%) |
| Retail Trade | 85 (47.5%) | 94 (52.5%) |
| Transportation & Warehousing | 8 (61.5%) | 5 (38.5%) |
| Utilities | 18 (100.0%) | 0 (0.0%) |
| Information | 0 (0.0%) | 4 (100.0%) |
| Finance & Insurance | 27 (100.0%) | 0 (0.0%) |
| Real Estate, Rental & Leasing | 0 (0.0%) | 36 (100.0%) |
| Professional & Scientific | 41 (60.3%) | 27 (39.7%) |
| Enterprise Management | 0 (0.0%) | 0 (0.0%) |
| Administrative & Support | 62 (83.8%) | 12 (16.2%) |
| Educational Services | 112 (44.6%) | 139 (55.4%) |
| Health Care & Social Assistance | 72 (30.5%) | 164 (69.5%) |
| Arts, Entertainment & Recreation | 25 (83.3%) | 5 (16.7%) |
| Accommodation & Food Services | 28 (32.2%) | 59 (67.8%) |
| Public Administration | 87 (84.5%) | 16 (15.5%) |
| Total | 691 (52.7%) | 621 (47.3%) |
Education in Mars Hill
School Enrollment in Mars Hill
The most common levels of schooling among the 1,251 students in Mars Hill are college / undergraduate (825 | 65.9%), elementary school (137 | 11.0%), and high school (134 | 10.7%).
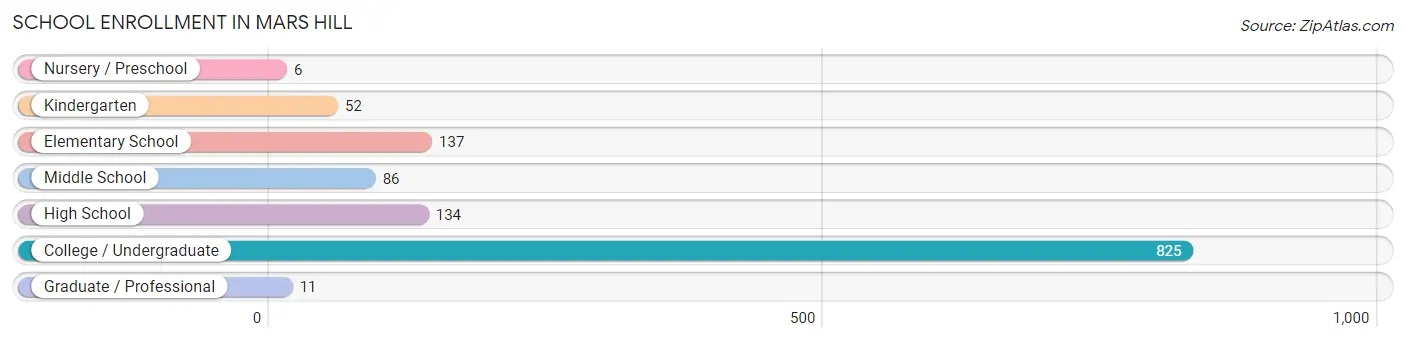
| School Level | # Students | % Students |
| Nursery / Preschool | 6 | 0.5% |
| Kindergarten | 52 | 4.2% |
| Elementary School | 137 | 11.0% |
| Middle School | 86 | 6.9% |
| High School | 134 | 10.7% |
| College / Undergraduate | 825 | 65.9% |
| Graduate / Professional | 11 | 0.9% |
| Total | 1,251 | 100.0% |
School Enrollment by Age by Funding Source in Mars Hill
Out of a total of 1,251 students who are enrolled in schools in Mars Hill, 728 (58.2%) attend a private institution, while the remaining 523 (41.8%) are enrolled in public schools. The age group of 20 to 24 year olds has the highest likelihood of being enrolled in private schools, with 428 (92.4% in the age bracket) enrolled. Conversely, the age group of 25 to 34 year olds has the lowest likelihood of being enrolled in a private school, with 82 (100.0% in the age bracket) attending a public institution.
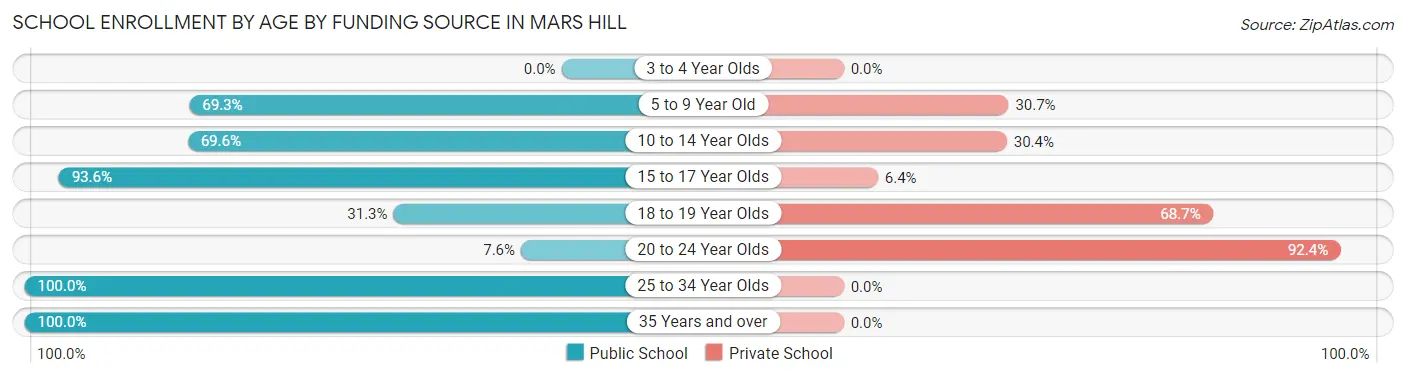
| Age Bracket | Public School | Private School |
| 3 to 4 Year Olds | 0 (0.0%) | 0 (0.0%) |
| 5 to 9 Year Old | 131 (69.3%) | 58 (30.7%) |
| 10 to 14 Year Olds | 71 (69.6%) | 31 (30.4%) |
| 15 to 17 Year Olds | 103 (93.6%) | 7 (6.4%) |
| 18 to 19 Year Olds | 93 (31.3%) | 204 (68.7%) |
| 20 to 24 Year Olds | 35 (7.6%) | 428 (92.4%) |
| 25 to 34 Year Olds | 82 (100.0%) | 0 (0.0%) |
| 35 Years and over | 8 (100.0%) | 0 (0.0%) |
| Total | 523 (41.8%) | 728 (58.2%) |
Educational Attainment by Field of Study in Mars Hill
Liberal arts & history (196 | 23.1%), education (120 | 14.1%), science & technology (90 | 10.6%), business (72 | 8.5%), and literature & languages (58 | 6.8%) are the most common fields of study among 848 individuals in Mars Hill who have obtained a bachelor's degree or higher.
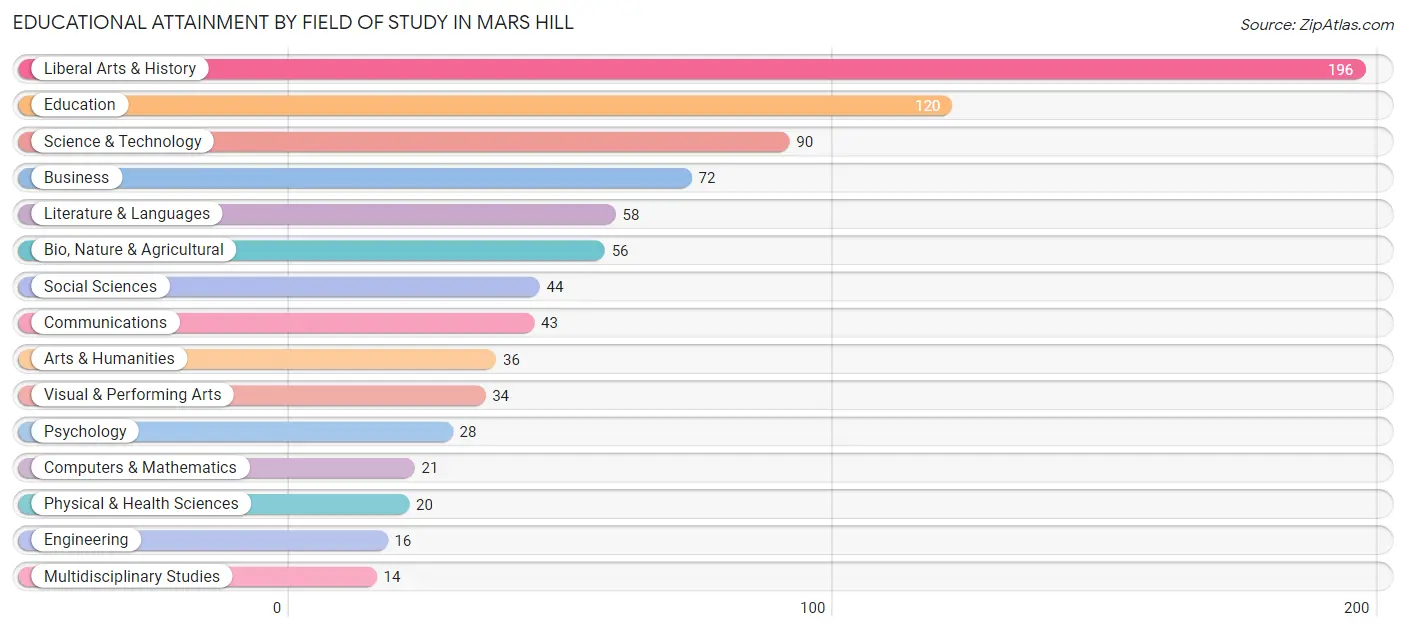
| Field of Study | # Graduates | % Graduates |
| Computers & Mathematics | 21 | 2.5% |
| Bio, Nature & Agricultural | 56 | 6.6% |
| Physical & Health Sciences | 20 | 2.4% |
| Psychology | 28 | 3.3% |
| Social Sciences | 44 | 5.2% |
| Engineering | 16 | 1.9% |
| Multidisciplinary Studies | 14 | 1.7% |
| Science & Technology | 90 | 10.6% |
| Business | 72 | 8.5% |
| Education | 120 | 14.1% |
| Literature & Languages | 58 | 6.8% |
| Liberal Arts & History | 196 | 23.1% |
| Visual & Performing Arts | 34 | 4.0% |
| Communications | 43 | 5.1% |
| Arts & Humanities | 36 | 4.3% |
| Total | 848 | 100.0% |
Transportation & Commute in Mars Hill
Vehicle Availability by Sex in Mars Hill
The most prevalent vehicle ownership categories in Mars Hill are males with 3 vehicles (230, accounting for 38.4%) and females with 3 vehicles (150, making up 50.3%).
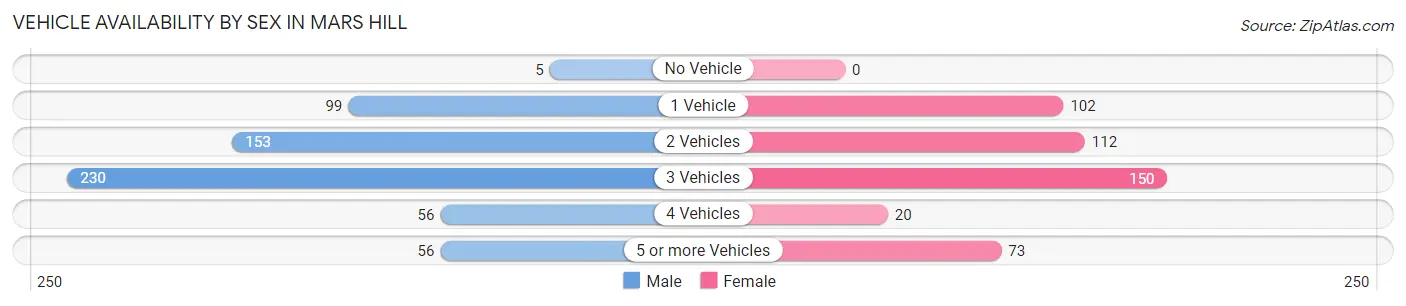
| Vehicles Available | Male | Female |
| No Vehicle | 5 (0.8%) | 0 (0.0%) |
| 1 Vehicle | 99 (16.5%) | 102 (22.3%) |
| 2 Vehicles | 153 (25.5%) | 112 (24.5%) |
| 3 Vehicles | 230 (38.4%) | 150 (32.8%) |
| 4 Vehicles | 56 (9.3%) | 20 (4.4%) |
| 5 or more Vehicles | 56 (9.3%) | 73 (16.0%) |
| Total | 599 (100.0%) | 457 (100.0%) |
Commute Time in Mars Hill
The most frequently occuring commute durations in Mars Hill are 15 to 19 minutes (329 commuters, 30.7%), 30 to 34 minutes (157 commuters, 14.7%), and 10 to 14 minutes (118 commuters, 11.0%).
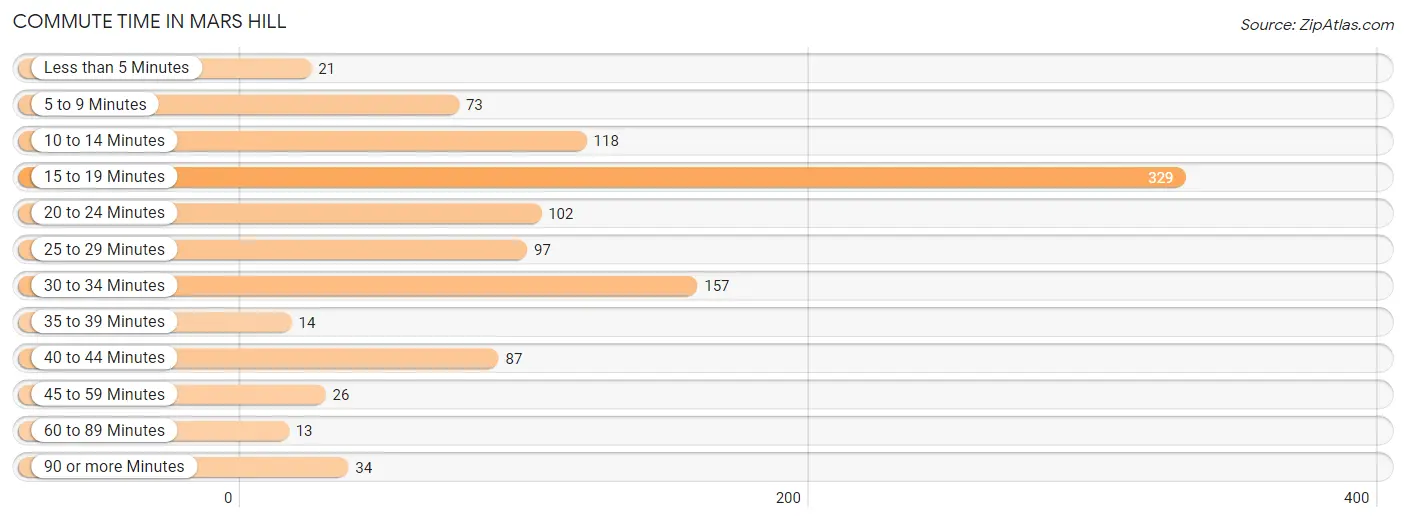
| Commute Time | # Commuters | % Commuters |
| Less than 5 Minutes | 21 | 2.0% |
| 5 to 9 Minutes | 73 | 6.8% |
| 10 to 14 Minutes | 118 | 11.0% |
| 15 to 19 Minutes | 329 | 30.7% |
| 20 to 24 Minutes | 102 | 9.5% |
| 25 to 29 Minutes | 97 | 9.1% |
| 30 to 34 Minutes | 157 | 14.7% |
| 35 to 39 Minutes | 14 | 1.3% |
| 40 to 44 Minutes | 87 | 8.1% |
| 45 to 59 Minutes | 26 | 2.4% |
| 60 to 89 Minutes | 13 | 1.2% |
| 90 or more Minutes | 34 | 3.2% |
Commute Time by Sex in Mars Hill
The most common commute times in Mars Hill are 15 to 19 minutes (174 commuters, 32.7%) for males and 15 to 19 minutes (155 commuters, 28.8%) for females.
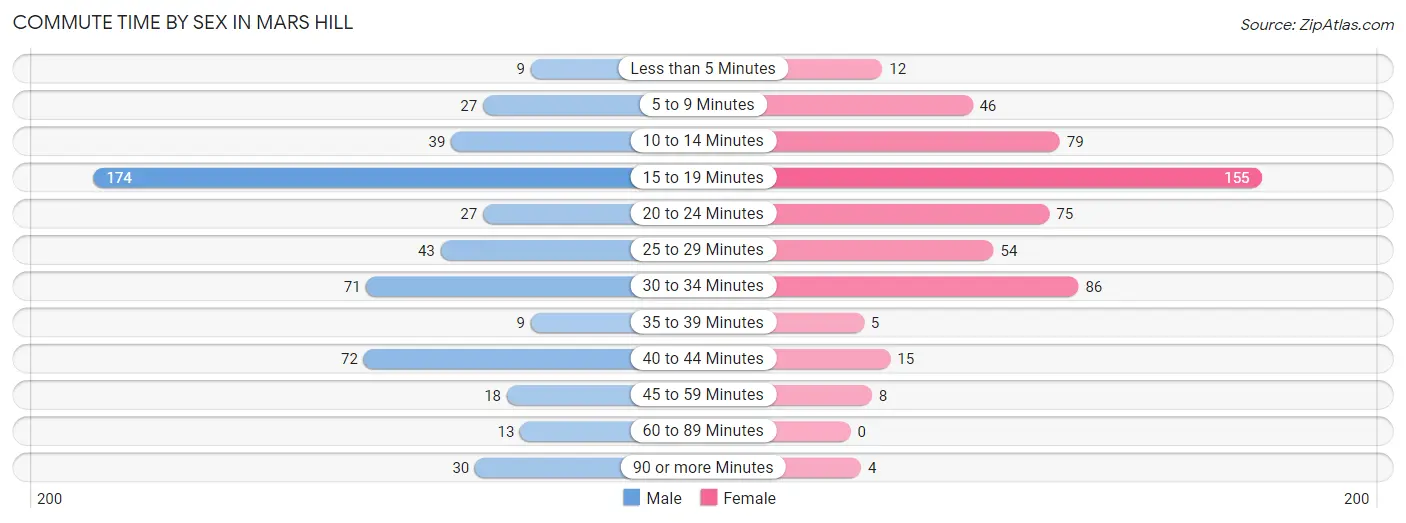
| Commute Time | Male | Female |
| Less than 5 Minutes | 9 (1.7%) | 12 (2.2%) |
| 5 to 9 Minutes | 27 (5.1%) | 46 (8.5%) |
| 10 to 14 Minutes | 39 (7.3%) | 79 (14.7%) |
| 15 to 19 Minutes | 174 (32.7%) | 155 (28.8%) |
| 20 to 24 Minutes | 27 (5.1%) | 75 (13.9%) |
| 25 to 29 Minutes | 43 (8.1%) | 54 (10.0%) |
| 30 to 34 Minutes | 71 (13.4%) | 86 (16.0%) |
| 35 to 39 Minutes | 9 (1.7%) | 5 (0.9%) |
| 40 to 44 Minutes | 72 (13.5%) | 15 (2.8%) |
| 45 to 59 Minutes | 18 (3.4%) | 8 (1.5%) |
| 60 to 89 Minutes | 13 (2.4%) | 0 (0.0%) |
| 90 or more Minutes | 30 (5.6%) | 4 (0.7%) |
Time of Departure to Work by Sex in Mars Hill
The most frequent times of departure to work in Mars Hill are 6:00 AM to 6:29 AM (108, 20.3%) for males and 12:00 PM to 3:59 PM (111, 20.6%) for females.
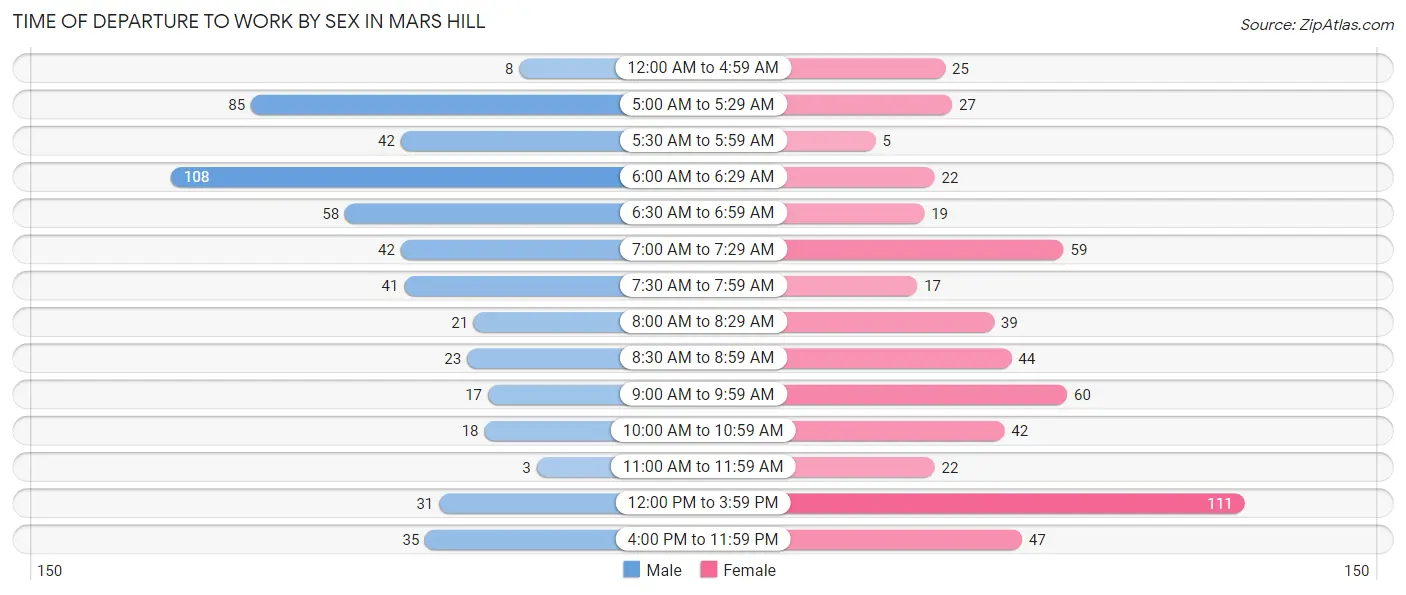
| Time of Departure | Male | Female |
| 12:00 AM to 4:59 AM | 8 (1.5%) | 25 (4.6%) |
| 5:00 AM to 5:29 AM | 85 (16.0%) | 27 (5.0%) |
| 5:30 AM to 5:59 AM | 42 (7.9%) | 5 (0.9%) |
| 6:00 AM to 6:29 AM | 108 (20.3%) | 22 (4.1%) |
| 6:30 AM to 6:59 AM | 58 (10.9%) | 19 (3.5%) |
| 7:00 AM to 7:29 AM | 42 (7.9%) | 59 (11.0%) |
| 7:30 AM to 7:59 AM | 41 (7.7%) | 17 (3.2%) |
| 8:00 AM to 8:29 AM | 21 (4.0%) | 39 (7.2%) |
| 8:30 AM to 8:59 AM | 23 (4.3%) | 44 (8.2%) |
| 9:00 AM to 9:59 AM | 17 (3.2%) | 60 (11.1%) |
| 10:00 AM to 10:59 AM | 18 (3.4%) | 42 (7.8%) |
| 11:00 AM to 11:59 AM | 3 (0.6%) | 22 (4.1%) |
| 12:00 PM to 3:59 PM | 31 (5.8%) | 111 (20.6%) |
| 4:00 PM to 11:59 PM | 35 (6.6%) | 47 (8.7%) |
| Total | 532 (100.0%) | 539 (100.0%) |
Housing Occupancy in Mars Hill
Occupancy by Ownership in Mars Hill
Of the total 936 dwellings in Mars Hill, owner-occupied units account for 563 (60.2%), while renter-occupied units make up 373 (39.9%).
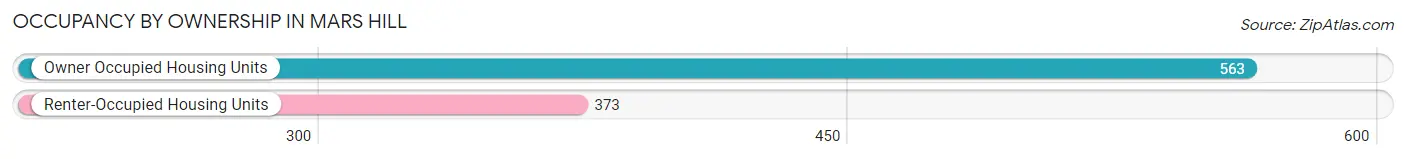
| Occupancy | # Housing Units | % Housing Units |
| Owner Occupied Housing Units | 563 | 60.2% |
| Renter-Occupied Housing Units | 373 | 39.9% |
| Total Occupied Housing Units | 936 | 100.0% |
Occupancy by Household Size in Mars Hill
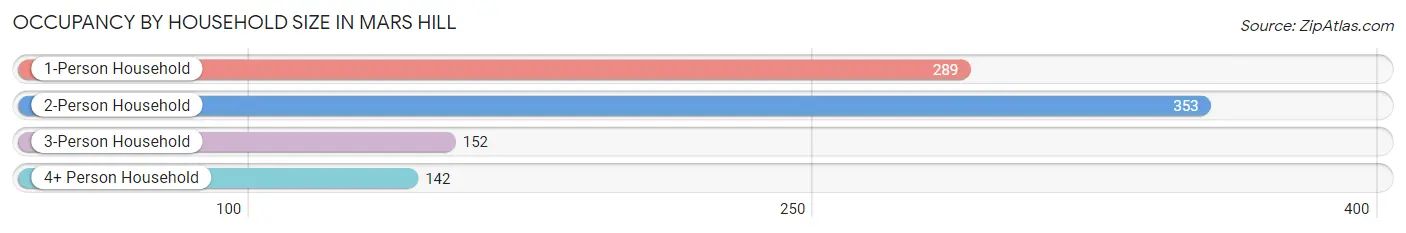
| Household Size | # Housing Units | % Housing Units |
| 1-Person Household | 289 | 30.9% |
| 2-Person Household | 353 | 37.7% |
| 3-Person Household | 152 | 16.2% |
| 4+ Person Household | 142 | 15.2% |
| Total Housing Units | 936 | 100.0% |
Occupancy by Ownership by Household Size in Mars Hill
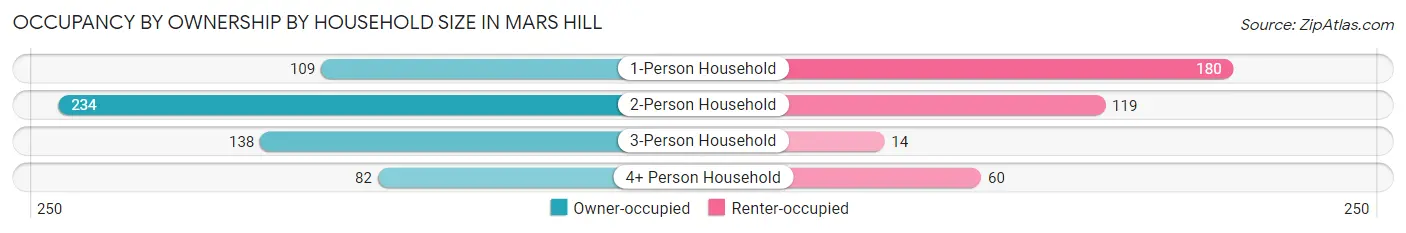
| Household Size | Owner-occupied | Renter-occupied |
| 1-Person Household | 109 (37.7%) | 180 (62.3%) |
| 2-Person Household | 234 (66.3%) | 119 (33.7%) |
| 3-Person Household | 138 (90.8%) | 14 (9.2%) |
| 4+ Person Household | 82 (57.8%) | 60 (42.2%) |
| Total Housing Units | 563 (60.2%) | 373 (39.9%) |
Occupancy by Educational Attainment in Mars Hill
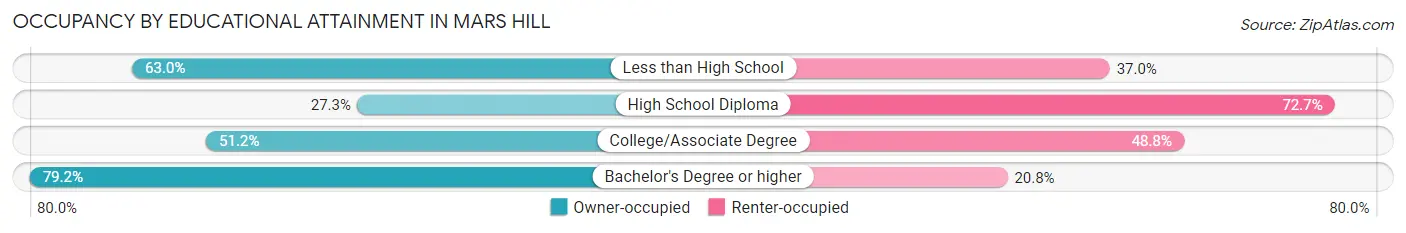
| Household Size | Owner-occupied | Renter-occupied |
| Less than High School | 34 (63.0%) | 20 (37.0%) |
| High School Diploma | 59 (27.3%) | 157 (72.7%) |
| College/Associate Degree | 105 (51.2%) | 100 (48.8%) |
| Bachelor's Degree or higher | 365 (79.2%) | 96 (20.8%) |
Occupancy by Age of Householder in Mars Hill
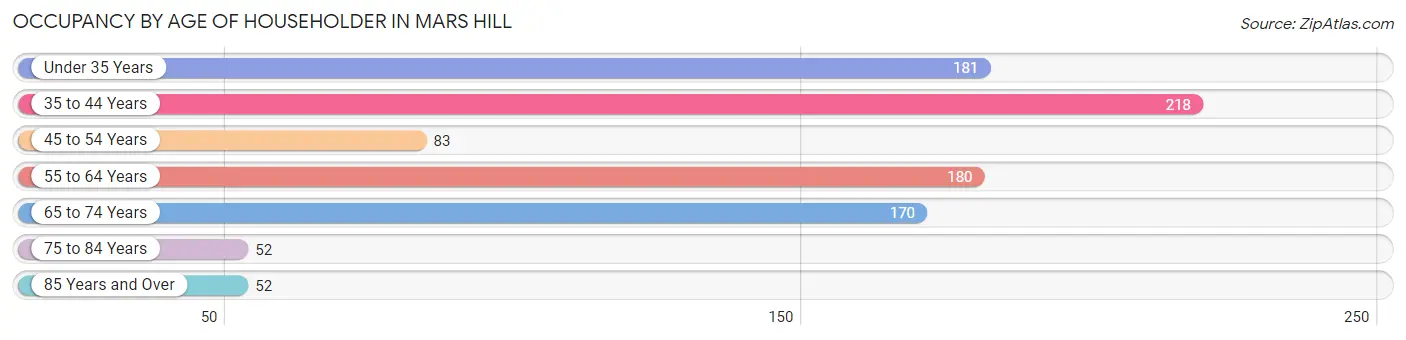
| Age Bracket | # Households | % Households |
| Under 35 Years | 181 | 19.3% |
| 35 to 44 Years | 218 | 23.3% |
| 45 to 54 Years | 83 | 8.9% |
| 55 to 64 Years | 180 | 19.2% |
| 65 to 74 Years | 170 | 18.2% |
| 75 to 84 Years | 52 | 5.6% |
| 85 Years and Over | 52 | 5.6% |
| Total | 936 | 100.0% |
Housing Finances in Mars Hill
Median Income by Occupancy in Mars Hill
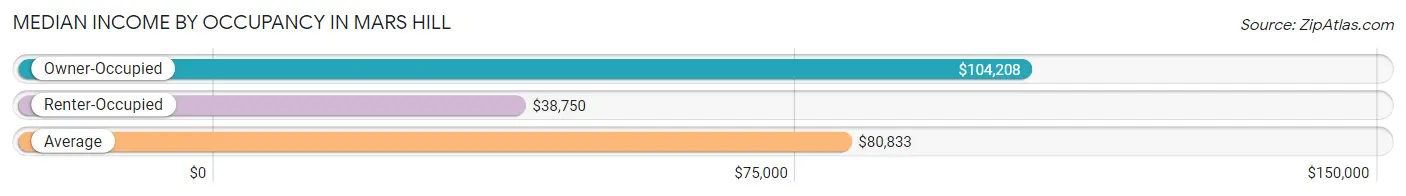
| Occupancy Type | # Households | Median Income |
| Owner-Occupied | 563 (60.2%) | $104,208 |
| Renter-Occupied | 373 (39.9%) | $38,750 |
| Average | 936 (100.0%) | $80,833 |
Occupancy by Householder Income Bracket in Mars Hill
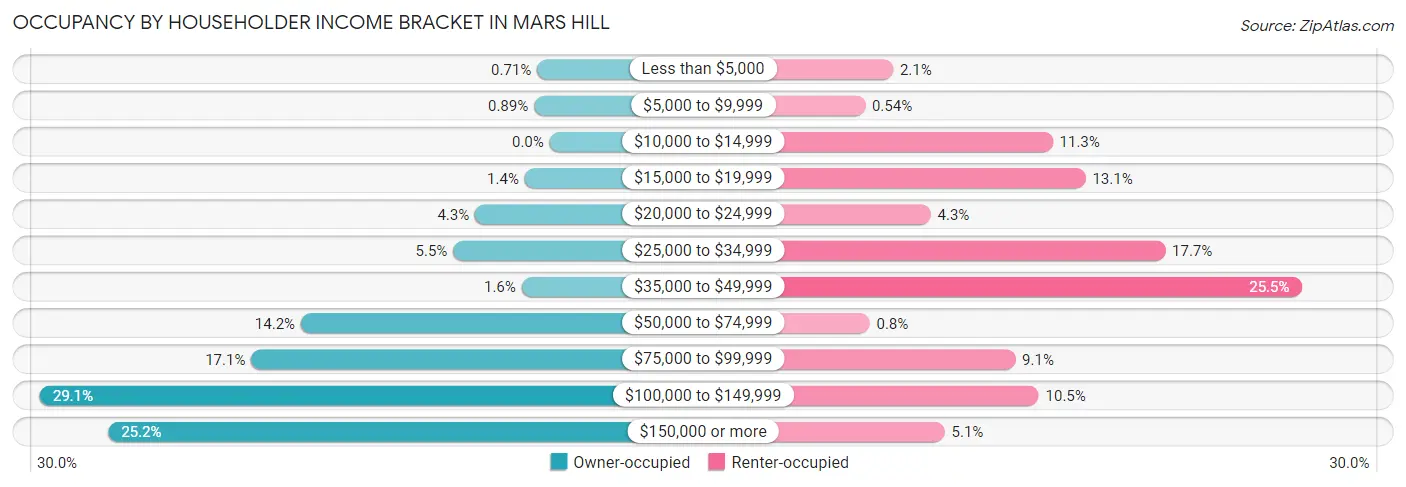
| Income Bracket | Owner-occupied | Renter-occupied |
| Less than $5,000 | 4 (0.7%) | 8 (2.1%) |
| $5,000 to $9,999 | 5 (0.9%) | 2 (0.5%) |
| $10,000 to $14,999 | 0 (0.0%) | 42 (11.3%) |
| $15,000 to $19,999 | 8 (1.4%) | 49 (13.1%) |
| $20,000 to $24,999 | 24 (4.3%) | 16 (4.3%) |
| $25,000 to $34,999 | 31 (5.5%) | 66 (17.7%) |
| $35,000 to $49,999 | 9 (1.6%) | 95 (25.5%) |
| $50,000 to $74,999 | 80 (14.2%) | 3 (0.8%) |
| $75,000 to $99,999 | 96 (17.1%) | 34 (9.1%) |
| $100,000 to $149,999 | 164 (29.1%) | 39 (10.5%) |
| $150,000 or more | 142 (25.2%) | 19 (5.1%) |
| Total | 563 (100.0%) | 373 (100.0%) |
Monthly Housing Cost Tiers in Mars Hill
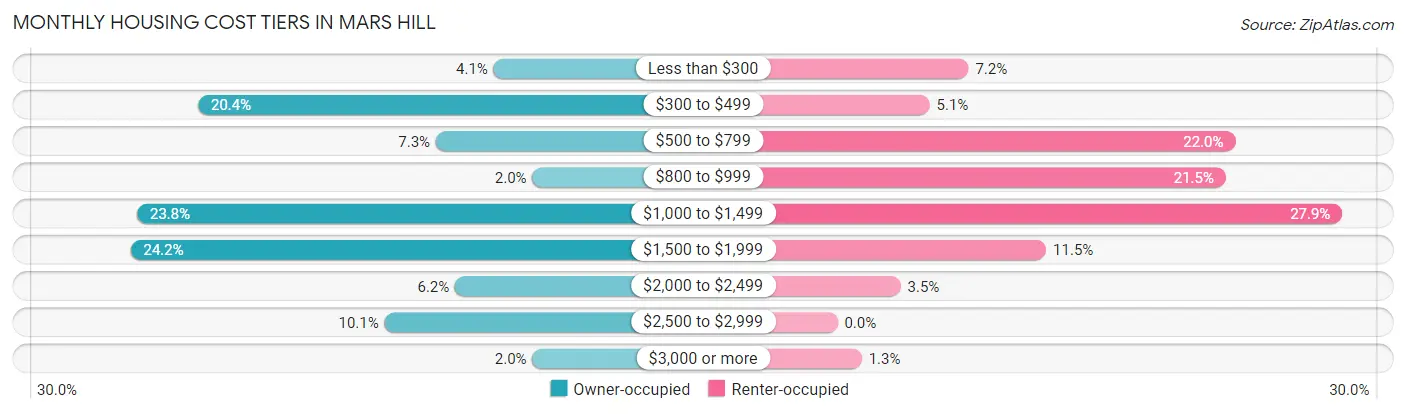
| Monthly Cost | Owner-occupied | Renter-occupied |
| Less than $300 | 23 (4.1%) | 27 (7.2%) |
| $300 to $499 | 115 (20.4%) | 19 (5.1%) |
| $500 to $799 | 41 (7.3%) | 82 (22.0%) |
| $800 to $999 | 11 (1.9%) | 80 (21.4%) |
| $1,000 to $1,499 | 134 (23.8%) | 104 (27.9%) |
| $1,500 to $1,999 | 136 (24.2%) | 43 (11.5%) |
| $2,000 to $2,499 | 35 (6.2%) | 13 (3.5%) |
| $2,500 to $2,999 | 57 (10.1%) | 0 (0.0%) |
| $3,000 or more | 11 (1.9%) | 5 (1.3%) |
| Total | 563 (100.0%) | 373 (100.0%) |
Physical Housing Characteristics in Mars Hill
Housing Structures in Mars Hill
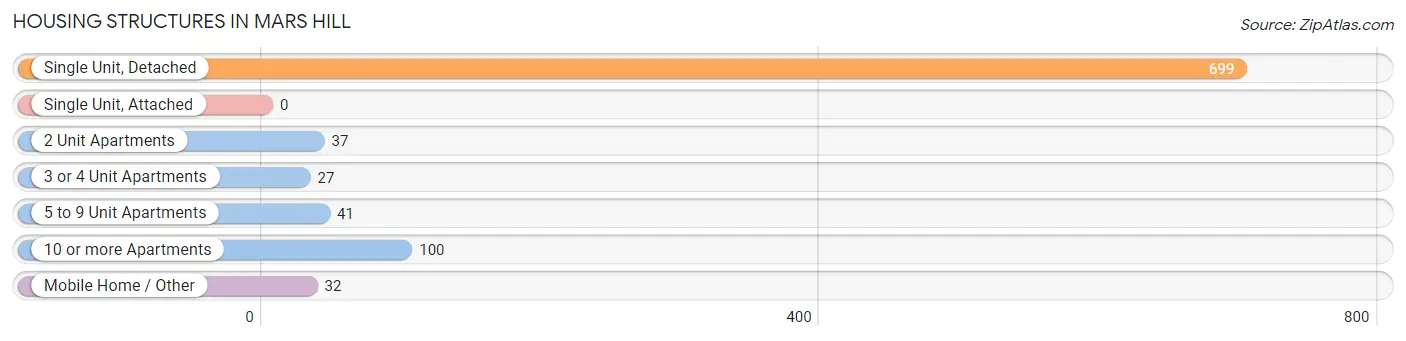
| Structure Type | # Housing Units | % Housing Units |
| Single Unit, Detached | 699 | 74.7% |
| Single Unit, Attached | 0 | 0.0% |
| 2 Unit Apartments | 37 | 4.0% |
| 3 or 4 Unit Apartments | 27 | 2.9% |
| 5 to 9 Unit Apartments | 41 | 4.4% |
| 10 or more Apartments | 100 | 10.7% |
| Mobile Home / Other | 32 | 3.4% |
| Total | 936 | 100.0% |
Housing Structures by Occupancy in Mars Hill
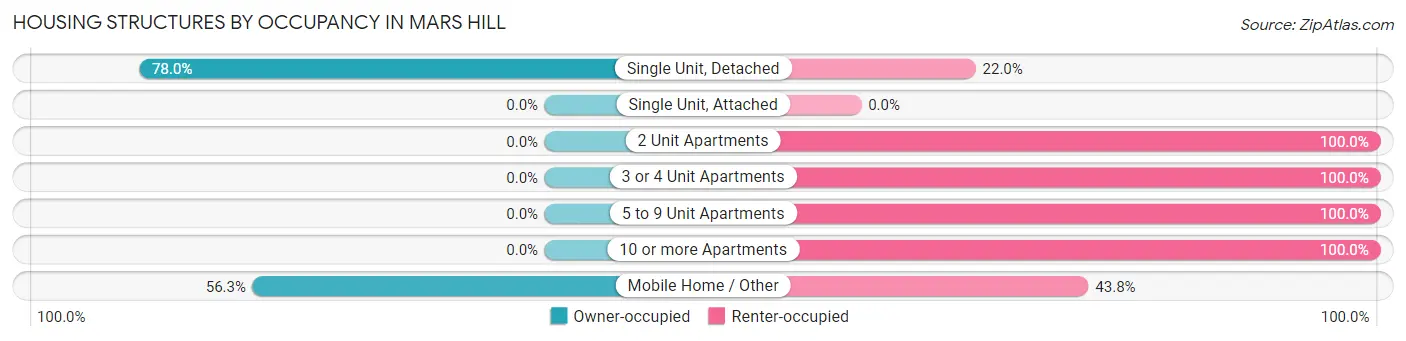
| Structure Type | Owner-occupied | Renter-occupied |
| Single Unit, Detached | 545 (78.0%) | 154 (22.0%) |
| Single Unit, Attached | 0 (0.0%) | 0 (0.0%) |
| 2 Unit Apartments | 0 (0.0%) | 37 (100.0%) |
| 3 or 4 Unit Apartments | 0 (0.0%) | 27 (100.0%) |
| 5 to 9 Unit Apartments | 0 (0.0%) | 41 (100.0%) |
| 10 or more Apartments | 0 (0.0%) | 100 (100.0%) |
| Mobile Home / Other | 18 (56.2%) | 14 (43.8%) |
| Total | 563 (60.2%) | 373 (39.9%) |
Housing Structures by Number of Rooms in Mars Hill
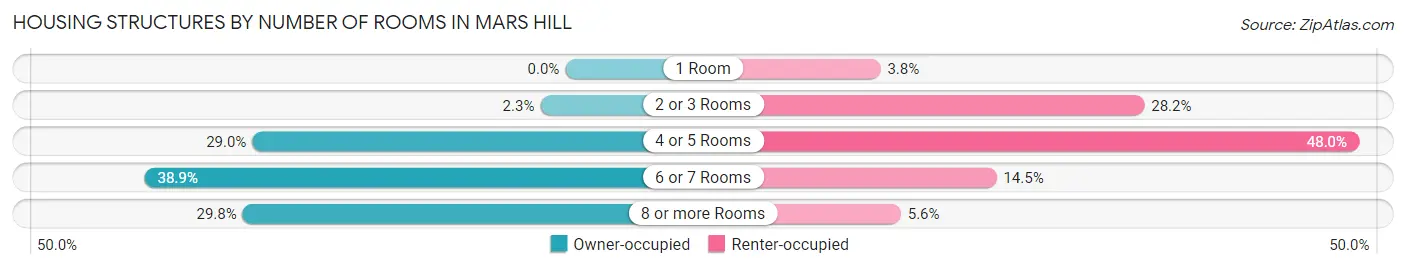
| Number of Rooms | Owner-occupied | Renter-occupied |
| 1 Room | 0 (0.0%) | 14 (3.7%) |
| 2 or 3 Rooms | 13 (2.3%) | 105 (28.1%) |
| 4 or 5 Rooms | 163 (28.9%) | 179 (48.0%) |
| 6 or 7 Rooms | 219 (38.9%) | 54 (14.5%) |
| 8 or more Rooms | 168 (29.8%) | 21 (5.6%) |
| Total | 563 (100.0%) | 373 (100.0%) |
Housing Structure by Heating Type in Mars Hill
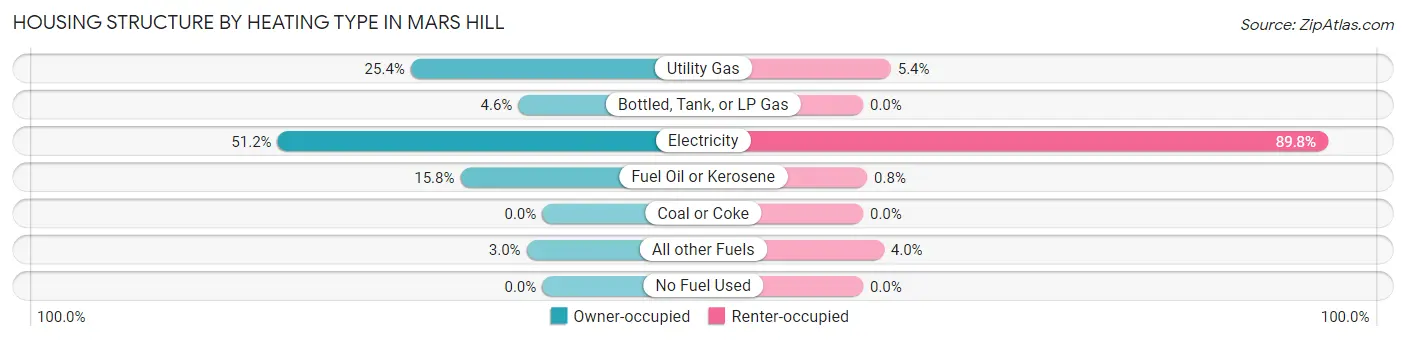
| Heating Type | Owner-occupied | Renter-occupied |
| Utility Gas | 143 (25.4%) | 20 (5.4%) |
| Bottled, Tank, or LP Gas | 26 (4.6%) | 0 (0.0%) |
| Electricity | 288 (51.1%) | 335 (89.8%) |
| Fuel Oil or Kerosene | 89 (15.8%) | 3 (0.8%) |
| Coal or Coke | 0 (0.0%) | 0 (0.0%) |
| All other Fuels | 17 (3.0%) | 15 (4.0%) |
| No Fuel Used | 0 (0.0%) | 0 (0.0%) |
| Total | 563 (100.0%) | 373 (100.0%) |
Household Vehicle Usage in Mars Hill
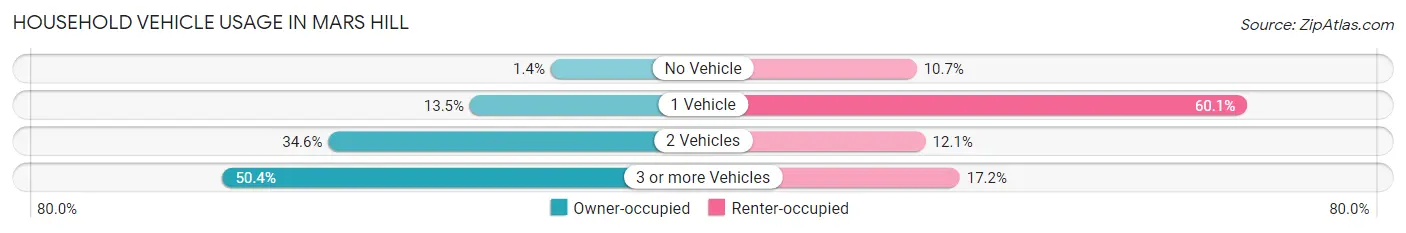
| Vehicles per Household | Owner-occupied | Renter-occupied |
| No Vehicle | 8 (1.4%) | 40 (10.7%) |
| 1 Vehicle | 76 (13.5%) | 224 (60.1%) |
| 2 Vehicles | 195 (34.6%) | 45 (12.1%) |
| 3 or more Vehicles | 284 (50.4%) | 64 (17.2%) |
| Total | 563 (100.0%) | 373 (100.0%) |
Real Estate & Mortgages in Mars Hill
Real Estate and Mortgage Overview in Mars Hill
| Characteristic | Without Mortgage | With Mortgage |
| Housing Units | 175 | 388 |
| Median Property Value | $219,800 | $324,800 |
| Median Household Income | $57,212 | $127 |
| Monthly Housing Costs | $423 | $11 |
| Real Estate Taxes | $1,364 | $3 |
Property Value by Mortgage Status in Mars Hill
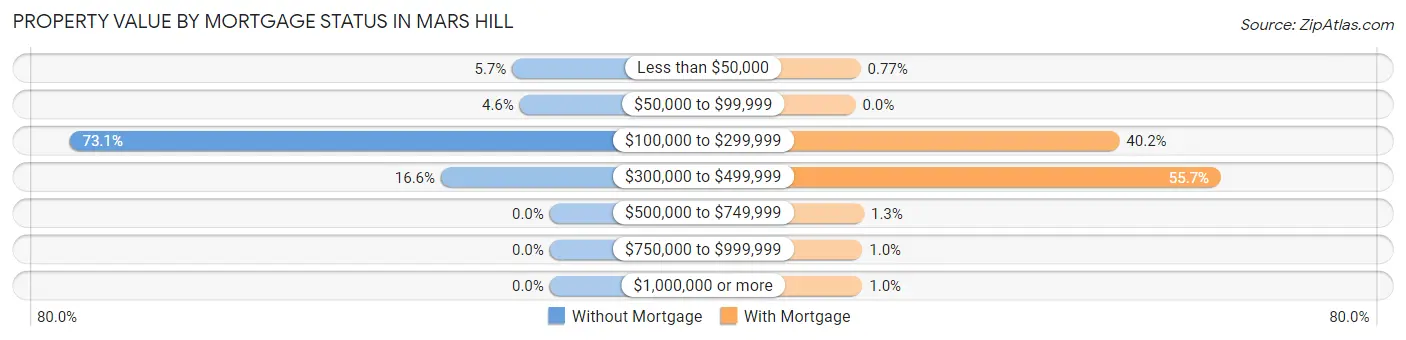
| Property Value | Without Mortgage | With Mortgage |
| Less than $50,000 | 10 (5.7%) | 3 (0.8%) |
| $50,000 to $99,999 | 8 (4.6%) | 0 (0.0%) |
| $100,000 to $299,999 | 128 (73.1%) | 156 (40.2%) |
| $300,000 to $499,999 | 29 (16.6%) | 216 (55.7%) |
| $500,000 to $749,999 | 0 (0.0%) | 5 (1.3%) |
| $750,000 to $999,999 | 0 (0.0%) | 4 (1.0%) |
| $1,000,000 or more | 0 (0.0%) | 4 (1.0%) |
| Total | 175 (100.0%) | 388 (100.0%) |
Household Income by Mortgage Status in Mars Hill
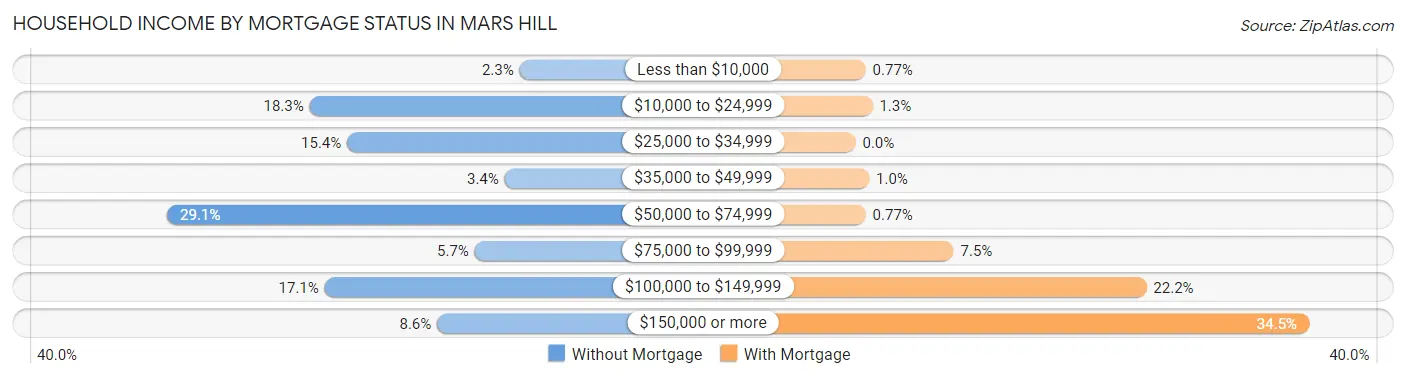
| Household Income | Without Mortgage | With Mortgage |
| Less than $10,000 | 4 (2.3%) | 3 (0.8%) |
| $10,000 to $24,999 | 32 (18.3%) | 5 (1.3%) |
| $25,000 to $34,999 | 27 (15.4%) | 0 (0.0%) |
| $35,000 to $49,999 | 6 (3.4%) | 4 (1.0%) |
| $50,000 to $74,999 | 51 (29.1%) | 3 (0.8%) |
| $75,000 to $99,999 | 10 (5.7%) | 29 (7.5%) |
| $100,000 to $149,999 | 30 (17.1%) | 86 (22.2%) |
| $150,000 or more | 15 (8.6%) | 134 (34.5%) |
| Total | 175 (100.0%) | 388 (100.0%) |
Property Value to Household Income Ratio in Mars Hill
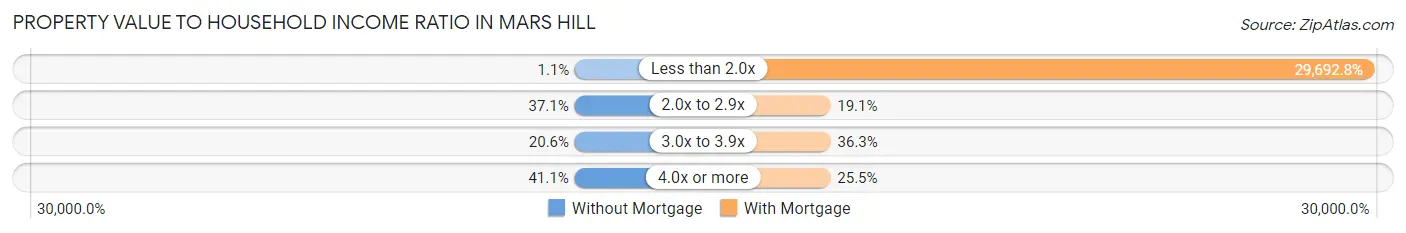
| Value-to-Income Ratio | Without Mortgage | With Mortgage |
| Less than 2.0x | 2 (1.1%) | 115,208 (29,692.8%) |
| 2.0x to 2.9x | 65 (37.1%) | 74 (19.1%) |
| 3.0x to 3.9x | 36 (20.6%) | 141 (36.3%) |
| 4.0x or more | 72 (41.1%) | 99 (25.5%) |
| Total | 175 (100.0%) | 388 (100.0%) |
Real Estate Taxes by Mortgage Status in Mars Hill
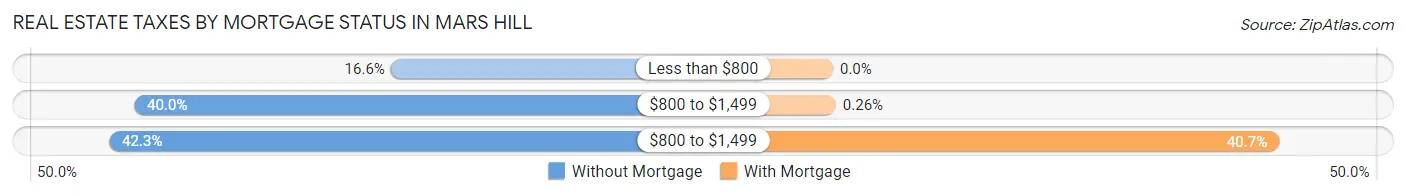
| Property Taxes | Without Mortgage | With Mortgage |
| Less than $800 | 29 (16.6%) | 0 (0.0%) |
| $800 to $1,499 | 70 (40.0%) | 1 (0.3%) |
| $800 to $1,499 | 74 (42.3%) | 158 (40.7%) |
| Total | 175 (100.0%) | 388 (100.0%) |
Health & Disability in Mars Hill
Health Insurance Coverage by Age in Mars Hill
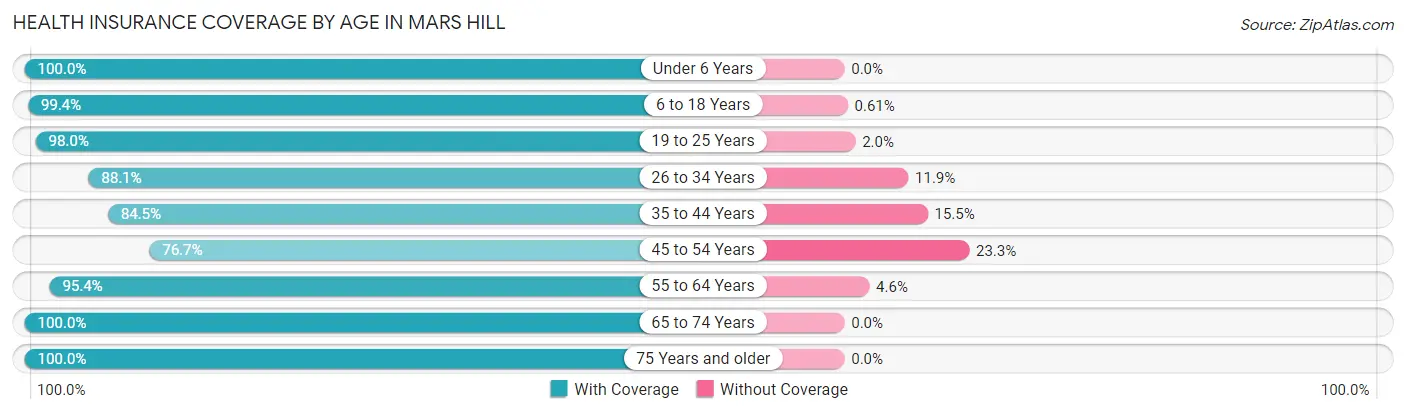
| Age Bracket | With Coverage | Without Coverage |
| Under 6 Years | 119 (100.0%) | 0 (0.0%) |
| 6 to 18 Years | 489 (99.4%) | 3 (0.6%) |
| 19 to 25 Years | 671 (98.0%) | 14 (2.0%) |
| 26 to 34 Years | 237 (88.1%) | 32 (11.9%) |
| 35 to 44 Years | 343 (84.5%) | 63 (15.5%) |
| 45 to 54 Years | 132 (76.7%) | 40 (23.3%) |
| 55 to 64 Years | 288 (95.4%) | 14 (4.6%) |
| 65 to 74 Years | 262 (100.0%) | 0 (0.0%) |
| 75 Years and older | 136 (100.0%) | 0 (0.0%) |
| Total | 2,677 (94.2%) | 166 (5.8%) |
Health Insurance Coverage by Citizenship Status in Mars Hill
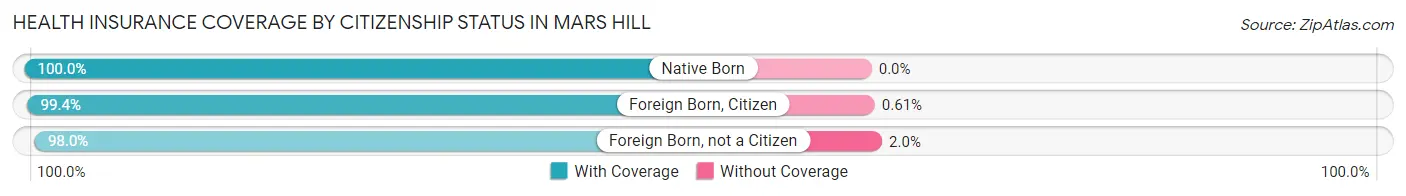
| Citizenship Status | With Coverage | Without Coverage |
| Native Born | 119 (100.0%) | 0 (0.0%) |
| Foreign Born, Citizen | 489 (99.4%) | 3 (0.6%) |
| Foreign Born, not a Citizen | 671 (98.0%) | 14 (2.0%) |
Health Insurance Coverage by Household Income in Mars Hill
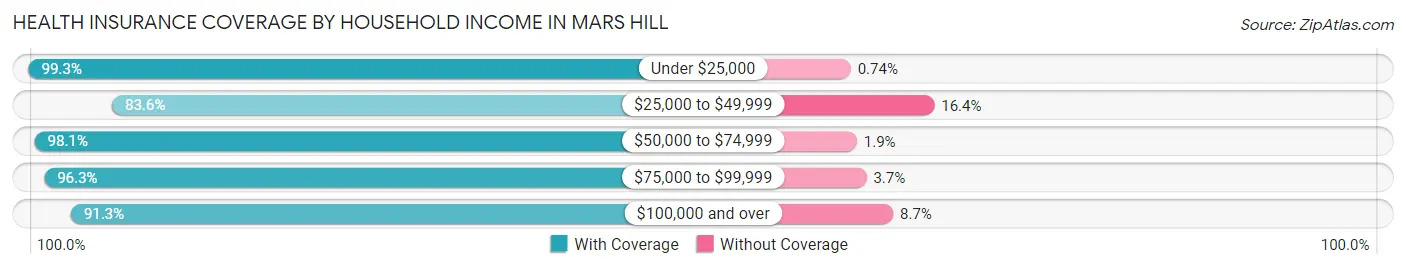
| Household Income | With Coverage | Without Coverage |
| Under $25,000 | 269 (99.3%) | 2 (0.7%) |
| $25,000 to $49,999 | 250 (83.6%) | 49 (16.4%) |
| $50,000 to $74,999 | 157 (98.1%) | 3 (1.9%) |
| $75,000 to $99,999 | 366 (96.3%) | 14 (3.7%) |
| $100,000 and over | 1,032 (91.3%) | 98 (8.7%) |
Public vs Private Health Insurance Coverage by Age in Mars Hill
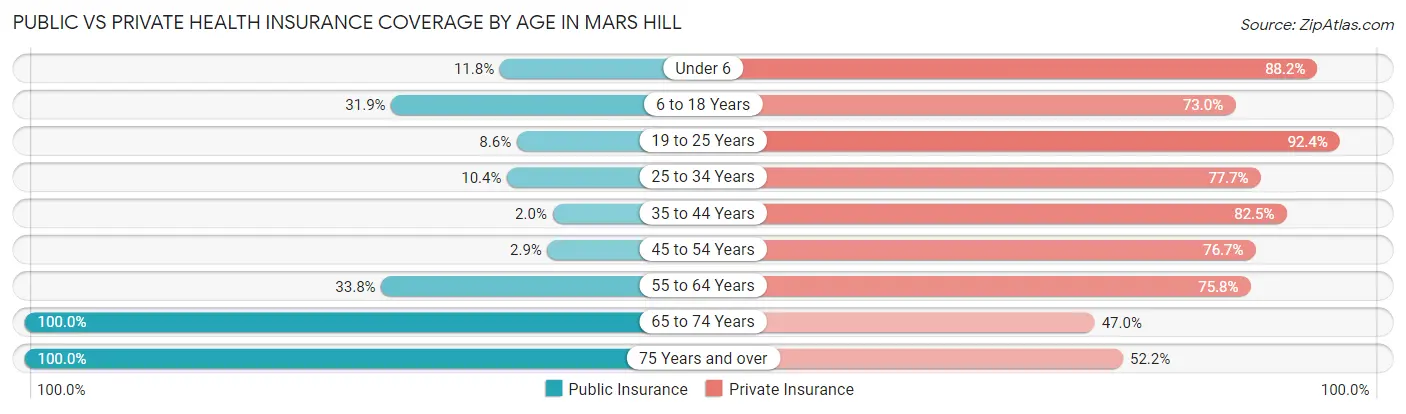
| Age Bracket | Public Insurance | Private Insurance |
| Under 6 | 14 (11.8%) | 105 (88.2%) |
| 6 to 18 Years | 157 (31.9%) | 359 (73.0%) |
| 19 to 25 Years | 59 (8.6%) | 633 (92.4%) |
| 25 to 34 Years | 28 (10.4%) | 209 (77.7%) |
| 35 to 44 Years | 8 (2.0%) | 335 (82.5%) |
| 45 to 54 Years | 5 (2.9%) | 132 (76.7%) |
| 55 to 64 Years | 102 (33.8%) | 229 (75.8%) |
| 65 to 74 Years | 262 (100.0%) | 123 (46.9%) |
| 75 Years and over | 136 (100.0%) | 71 (52.2%) |
| Total | 771 (27.1%) | 2,196 (77.2%) |
Disability Status by Sex by Age in Mars Hill
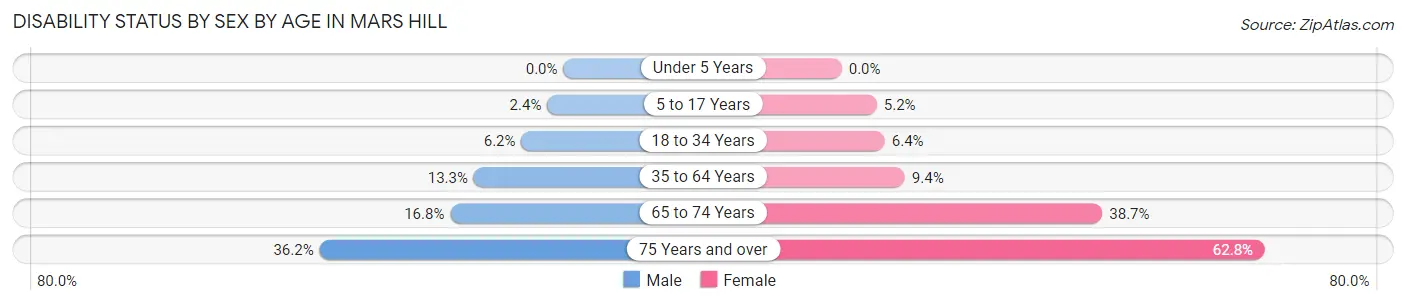
| Age Bracket | Male | Female |
| Under 5 Years | 0 (0.0%) | 0 (0.0%) |
| 5 to 17 Years | 5 (2.4%) | 10 (5.2%) |
| 18 to 34 Years | 40 (6.2%) | 28 (6.4%) |
| 35 to 64 Years | 56 (13.3%) | 43 (9.4%) |
| 65 to 74 Years | 21 (16.8%) | 53 (38.7%) |
| 75 Years and over | 21 (36.2%) | 49 (62.8%) |
Disability Class by Sex by Age in Mars Hill
Disability Class: Hearing Difficulty
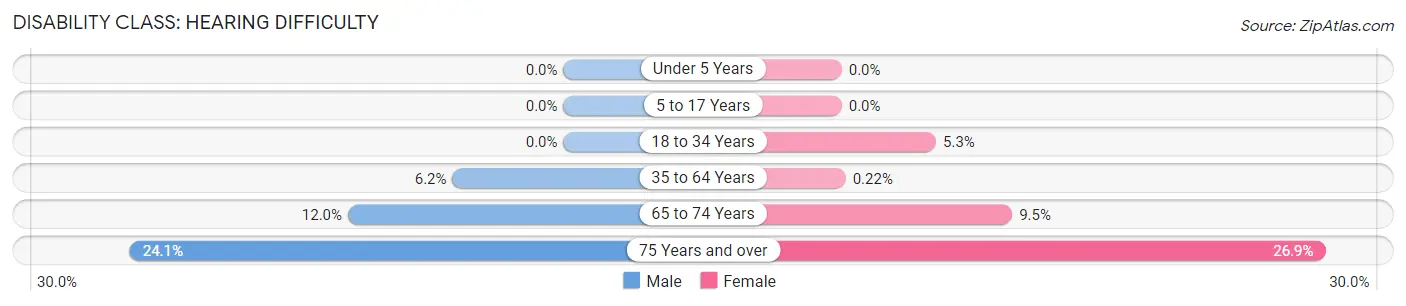
| Age Bracket | Male | Female |
| Under 5 Years | 0 (0.0%) | 0 (0.0%) |
| 5 to 17 Years | 0 (0.0%) | 0 (0.0%) |
| 18 to 34 Years | 0 (0.0%) | 23 (5.2%) |
| 35 to 64 Years | 26 (6.2%) | 1 (0.2%) |
| 65 to 74 Years | 15 (12.0%) | 13 (9.5%) |
| 75 Years and over | 14 (24.1%) | 21 (26.9%) |
Disability Class: Vision Difficulty
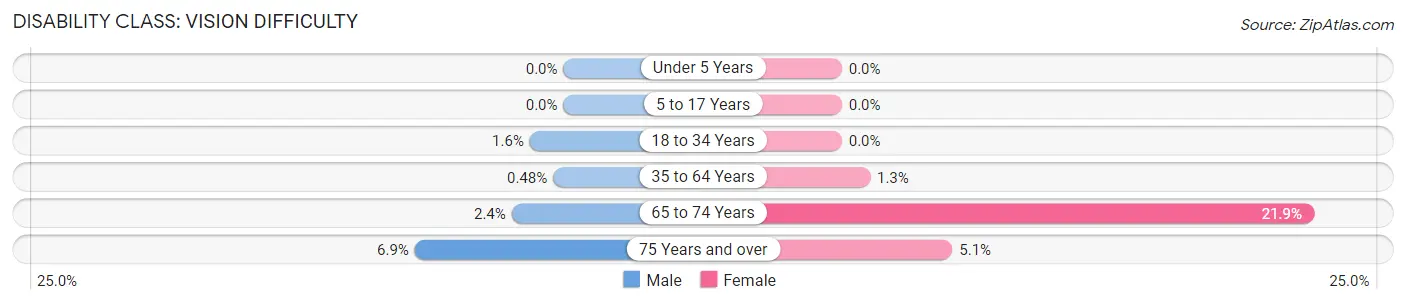
| Age Bracket | Male | Female |
| Under 5 Years | 0 (0.0%) | 0 (0.0%) |
| 5 to 17 Years | 0 (0.0%) | 0 (0.0%) |
| 18 to 34 Years | 10 (1.6%) | 0 (0.0%) |
| 35 to 64 Years | 2 (0.5%) | 6 (1.3%) |
| 65 to 74 Years | 3 (2.4%) | 30 (21.9%) |
| 75 Years and over | 4 (6.9%) | 4 (5.1%) |
Disability Class: Cognitive Difficulty
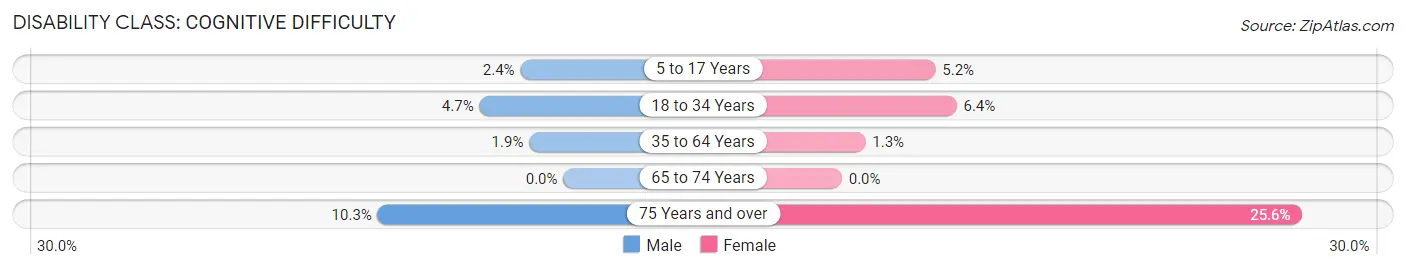
| Age Bracket | Male | Female |
| 5 to 17 Years | 5 (2.4%) | 10 (5.2%) |
| 18 to 34 Years | 30 (4.7%) | 28 (6.4%) |
| 35 to 64 Years | 8 (1.9%) | 6 (1.3%) |
| 65 to 74 Years | 0 (0.0%) | 0 (0.0%) |
| 75 Years and over | 6 (10.3%) | 20 (25.6%) |
Disability Class: Ambulatory Difficulty
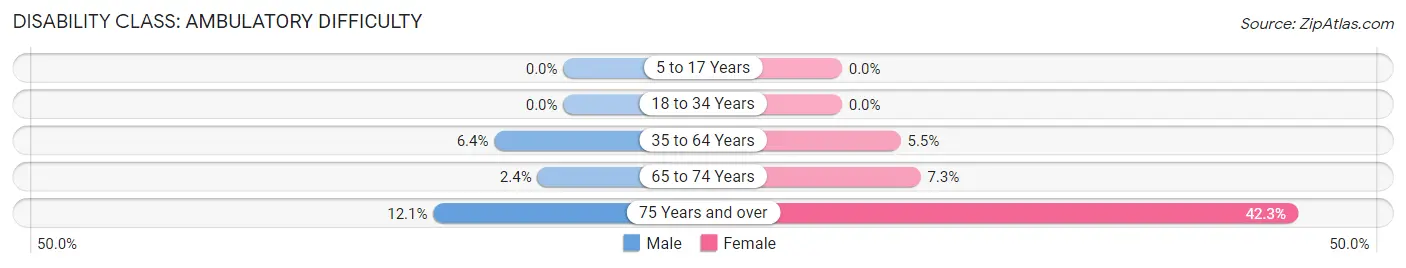
| Age Bracket | Male | Female |
| 5 to 17 Years | 0 (0.0%) | 0 (0.0%) |
| 18 to 34 Years | 0 (0.0%) | 0 (0.0%) |
| 35 to 64 Years | 27 (6.4%) | 25 (5.4%) |
| 65 to 74 Years | 3 (2.4%) | 10 (7.3%) |
| 75 Years and over | 7 (12.1%) | 33 (42.3%) |
Disability Class: Self-Care Difficulty
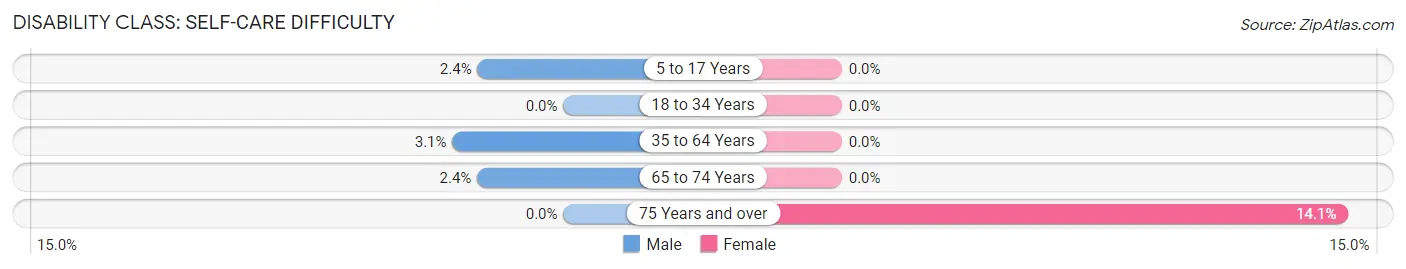
| Age Bracket | Male | Female |
| 5 to 17 Years | 5 (2.4%) | 0 (0.0%) |
| 18 to 34 Years | 0 (0.0%) | 0 (0.0%) |
| 35 to 64 Years | 13 (3.1%) | 0 (0.0%) |
| 65 to 74 Years | 3 (2.4%) | 0 (0.0%) |
| 75 Years and over | 0 (0.0%) | 11 (14.1%) |
Technology Access in Mars Hill
Computing Device Access in Mars Hill
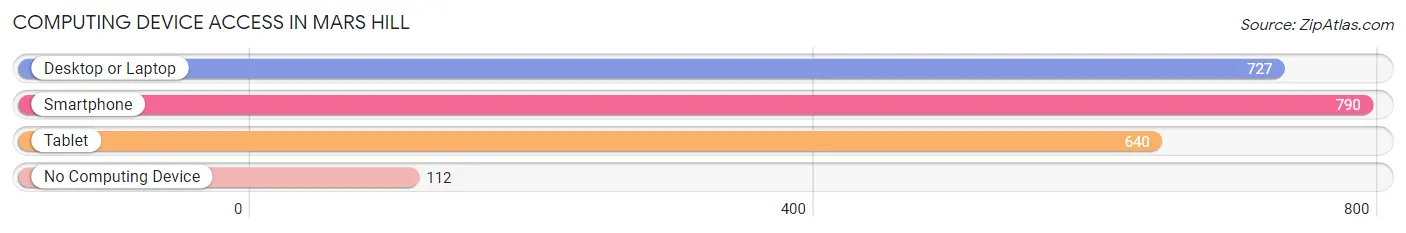
| Device Type | # Households | % Households |
| Desktop or Laptop | 727 | 77.7% |
| Smartphone | 790 | 84.4% |
| Tablet | 640 | 68.4% |
| No Computing Device | 112 | 12.0% |
| Total | 936 | 100.0% |
Internet Access in Mars Hill
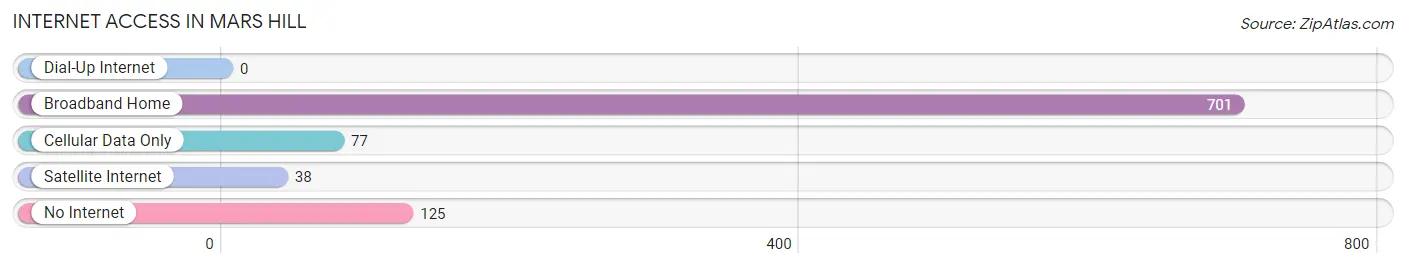
| Internet Type | # Households | % Households |
| Dial-Up Internet | 0 | 0.0% |
| Broadband Home | 701 | 74.9% |
| Cellular Data Only | 77 | 8.2% |
| Satellite Internet | 38 | 4.1% |
| No Internet | 125 | 13.4% |
| Total | 936 | 100.0% |
Mars Hill Summary
History
The town of Mars Hill, North Carolina is located in Madison County, in the Appalachian Mountains of western North Carolina. The town was founded in 1856 by a group of settlers from the nearby town of Marshall. The town was named after the nearby Mars Hill Mountain, which was named after the biblical Mount Mars Hill. The town was originally a farming community, but in the late 19th century, the town began to develop into a small industrial center. The town was home to several small factories, including a cotton mill, a furniture factory, and a tannery.
In the early 20th century, the town began to experience a period of growth and prosperity. The town was home to several businesses, including a bank, a hotel, a movie theater, and a variety of stores. The town also had a thriving music scene, with several local bands playing in the town square.
In the 1950s, the town began to experience a decline in population and economic activity. The factories began to close, and the town's population began to decline. In the late 1970s, the town began to experience a resurgence in population and economic activity. The town was home to several new businesses, including a grocery store, a hardware store, and a restaurant.
Geography
Mars Hill is located in the Appalachian Mountains of western North Carolina. The town is situated at an elevation of 2,000 feet, and is surrounded by the Pisgah National Forest. The town is located near the French Broad River, and is approximately 25 miles north of Asheville. The town is located in a valley, and is surrounded by several mountains, including Mars Hill Mountain, which is the highest peak in the area.
The town has a humid subtropical climate, with hot summers and mild winters. The average annual temperature is around 60 degrees Fahrenheit, and the average annual precipitation is around 45 inches.
Economy
The economy of Mars Hill is largely based on tourism and agriculture. The town is home to several tourist attractions, including the Mars Hill University, the Mars Hill Music Festival, and the Mars Hill Country Club. The town is also home to several farms, which produce a variety of crops, including corn, soybeans, and hay.
The town is also home to several small businesses, including restaurants, retail stores, and service providers. The town is also home to several manufacturing companies, which produce a variety of products, including furniture, clothing, and electronics.
Demographics
As of the 2010 census, the population of Mars Hill was 1,819. The town has a population density of 545 people per square mile. The median age of the population is 39.7 years, and the median household income is $37,941. The town is predominantly white, with 92.3% of the population identifying as white. The town is also home to a small Hispanic population, with 4.3% of the population identifying as Hispanic or Latino. The town is also home to a small African American population, with 2.2% of the population identifying as African American.
Common Questions
What is Per Capita Income in Mars Hill?
Per Capita income in Mars Hill is $29,467.
What is the Median Family Income in Mars Hill?
Median Family Income in Mars Hill is $103,258.
What is the Median Household income in Mars Hill?
Median Household Income in Mars Hill is $80,833.
What is Income or Wage Gap in Mars Hill?
Income or Wage Gap in Mars Hill is 35.2%.
Women in Mars Hill earn 64.8 cents for every dollar earned by a man.
What is Family Income Deficit in Mars Hill?
Family Income Deficit in Mars Hill is $11,591.
Families that are below poverty line in Mars Hill earn $11,591 less on average than the poverty threshold level.
What is Inequality or Gini Index in Mars Hill?
Inequality or Gini Index in Mars Hill is 0.38.
What is the Total Population of Mars Hill?
Total Population of Mars Hill is 2,843.
What is the Total Male Population of Mars Hill?
Total Male Population of Mars Hill is 1,529.
What is the Total Female Population of Mars Hill?
Total Female Population of Mars Hill is 1,314.
What is the Ratio of Males per 100 Females in Mars Hill?
There are 116.36 Males per 100 Females in Mars Hill.
What is the Ratio of Females per 100 Males in Mars Hill?
There are 85.94 Females per 100 Males in Mars Hill.
What is the Median Population Age in Mars Hill?
Median Population Age in Mars Hill is 27.0 Years.
What is the Average Family Size in Mars Hill
Average Family Size in Mars Hill is 2.9 People.
What is the Average Household Size in Mars Hill
Average Household Size in Mars Hill is 2.4 People.
How Large is the Labor Force in Mars Hill?
There are 1,343 People in the Labor Forcein in Mars Hill.
What is the Percentage of People in the Labor Force in Mars Hill?
54.8% of People are in the Labor Force in Mars Hill.
What is the Unemployment Rate in Mars Hill?
Unemployment Rate in Mars Hill is 2.2%.