Linden, NC Map & Demographics
Linden Map
Linden Overview
$27,236
PER CAPITA INCOME
$76,250
AVG FAMILY INCOME
$61,250
AVG HOUSEHOLD INCOME
$10,520
FAMILY INCOME DEFICIT
0.36
INEQUALITY / GINI INDEX
126
TOTAL POPULATION
62
MALE POPULATION
64
FEMALE POPULATION
96.88
MALES / 100 FEMALES
103.23
FEMALES / 100 MALES
32.4
MEDIAN AGE
3.5
AVG FAMILY SIZE
2.5
AVG HOUSEHOLD SIZE
50
LABOR FORCE [ PEOPLE ]
54.9%
PERCENT IN LABOR FORCE
6.3%
UNEMPLOYMENT RATE
Linden Zip Codes
Linden Area Codes
Income in Linden
Income Overview in Linden
Per Capita Income in Linden is $27,236, while median incomes of families and households are $76,250 and $61,250 respectively.
| Characteristic | Number | Measure |
| Per Capita Income | 126 | $27,236 |
| Median Family Income | 30 | $76,250 |
| Mean Family Income | 30 | $75,513 |
| Median Household Income | 50 | $61,250 |
| Mean Household Income | 50 | $66,116 |
| Income Deficit | 30 | $10,520 |
| Wage / Income Gap (%) | 126 | 0.00% |
| Wage / Income Gap ($) | 126 | 100.00¢ per $1 |
| Gini / Inequality Index | 126 | 0.36 |
Earnings by Sex in Linden
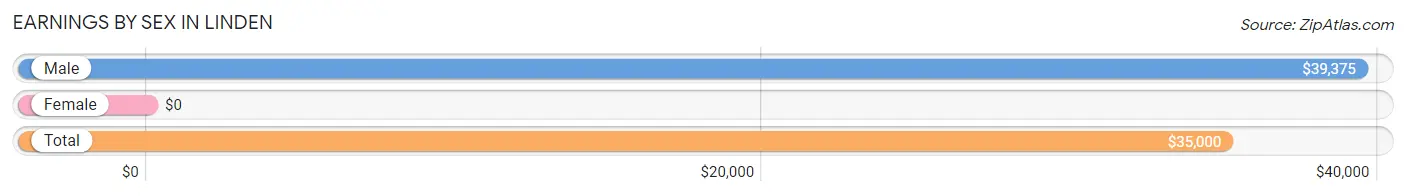
| Sex | Number | Average Earnings |
| Male | 29 (58.0%) | $39,375 |
| Female | 21 (42.0%) | $0 |
| Total | 50 (100.0%) | $35,000 |
Earnings by Sex by Income Bracket in Linden
The most common earnings brackets in Linden are $30,000 to $34,999 for men (5 | 17.2%) and $20,000 to $22,499 for women (3 | 14.3%).
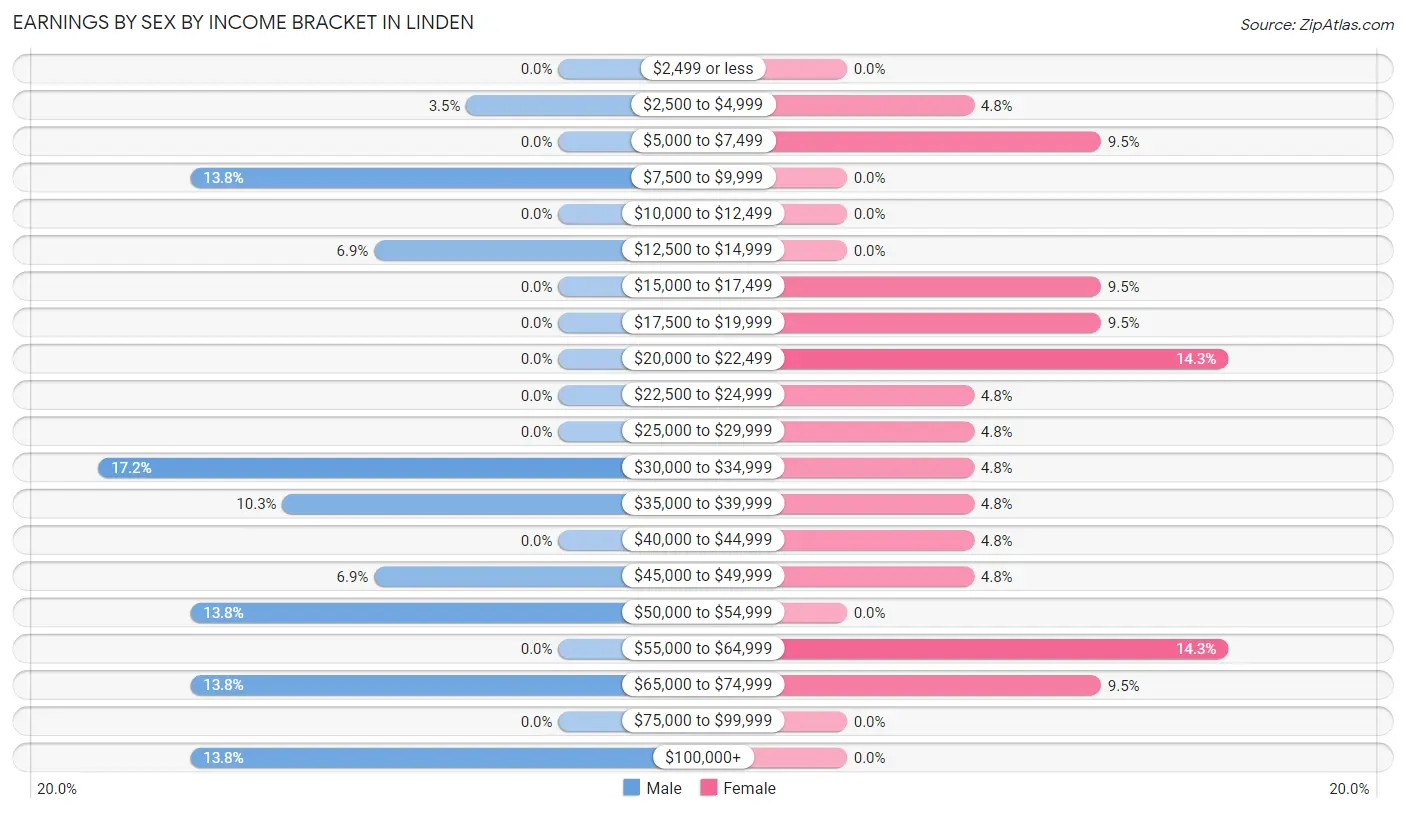
| Income | Male | Female |
| $2,499 or less | 0 (0.0%) | 0 (0.0%) |
| $2,500 to $4,999 | 1 (3.5%) | 1 (4.8%) |
| $5,000 to $7,499 | 0 (0.0%) | 2 (9.5%) |
| $7,500 to $9,999 | 4 (13.8%) | 0 (0.0%) |
| $10,000 to $12,499 | 0 (0.0%) | 0 (0.0%) |
| $12,500 to $14,999 | 2 (6.9%) | 0 (0.0%) |
| $15,000 to $17,499 | 0 (0.0%) | 2 (9.5%) |
| $17,500 to $19,999 | 0 (0.0%) | 2 (9.5%) |
| $20,000 to $22,499 | 0 (0.0%) | 3 (14.3%) |
| $22,500 to $24,999 | 0 (0.0%) | 1 (4.8%) |
| $25,000 to $29,999 | 0 (0.0%) | 1 (4.8%) |
| $30,000 to $34,999 | 5 (17.2%) | 1 (4.8%) |
| $35,000 to $39,999 | 3 (10.3%) | 1 (4.8%) |
| $40,000 to $44,999 | 0 (0.0%) | 1 (4.8%) |
| $45,000 to $49,999 | 2 (6.9%) | 1 (4.8%) |
| $50,000 to $54,999 | 4 (13.8%) | 0 (0.0%) |
| $55,000 to $64,999 | 0 (0.0%) | 3 (14.3%) |
| $65,000 to $74,999 | 4 (13.8%) | 2 (9.5%) |
| $75,000 to $99,999 | 0 (0.0%) | 0 (0.0%) |
| $100,000+ | 4 (13.8%) | 0 (0.0%) |
| Total | 29 (100.0%) | 21 (100.0%) |
Earnings by Sex by Educational Attainment in Linden
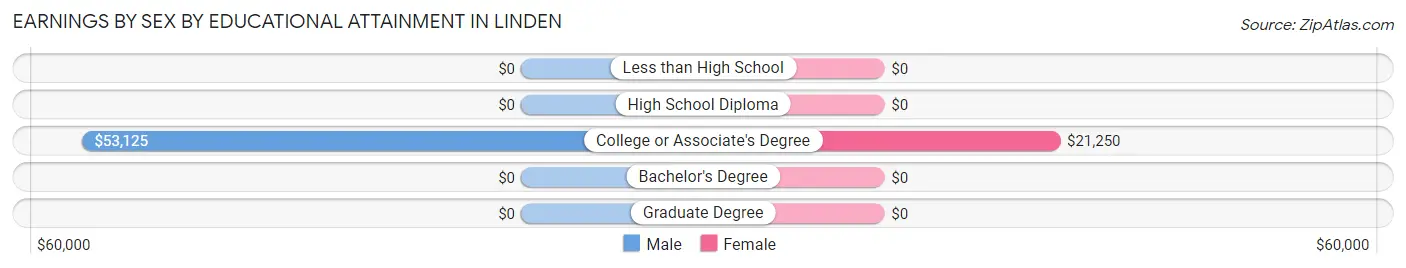
| Educational Attainment | Male Income | Female Income |
| Less than High School | - | - |
| High School Diploma | - | - |
| College or Associate's Degree | $53,125 | $21,250 |
| Bachelor's Degree | - | - |
| Graduate Degree | - | - |
| Total | $48,750 | $0 |
Family Income in Linden
Family Income Brackets in Linden
According to the Linden family income data, there are 8 families falling into the $75,000 to $99,999 income range, which is the most common income bracket and makes up 26.7% of all families.
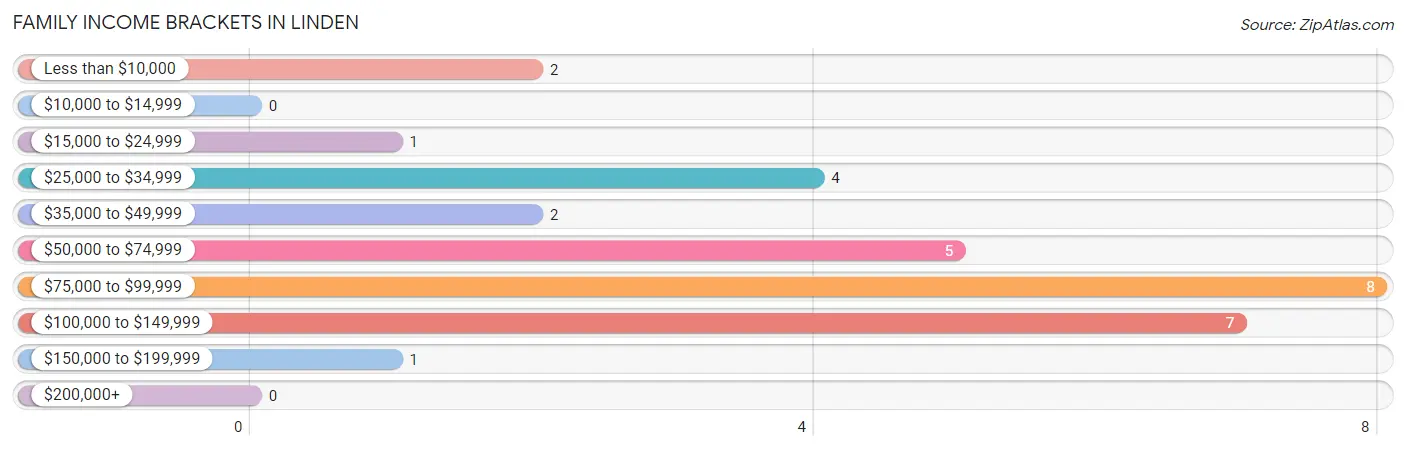
| Income Bracket | # Families | % Families |
| Less than $10,000 | 2 | 6.7% |
| $10,000 to $14,999 | 0 | 0.0% |
| $15,000 to $24,999 | 1 | 3.3% |
| $25,000 to $34,999 | 4 | 13.3% |
| $35,000 to $49,999 | 2 | 6.7% |
| $50,000 to $74,999 | 5 | 16.7% |
| $75,000 to $99,999 | 8 | 26.7% |
| $100,000 to $149,999 | 7 | 23.3% |
| $150,000 to $199,999 | 1 | 3.3% |
| $200,000+ | 0 | 0.0% |
Family Income by Famaliy Size in Linden
2-person families (20 | 66.7%) account for the highest median family income in Linden with $79,167 per family, while 2-person families (20 | 66.7%) have the highest median income of $39,584 per family member.
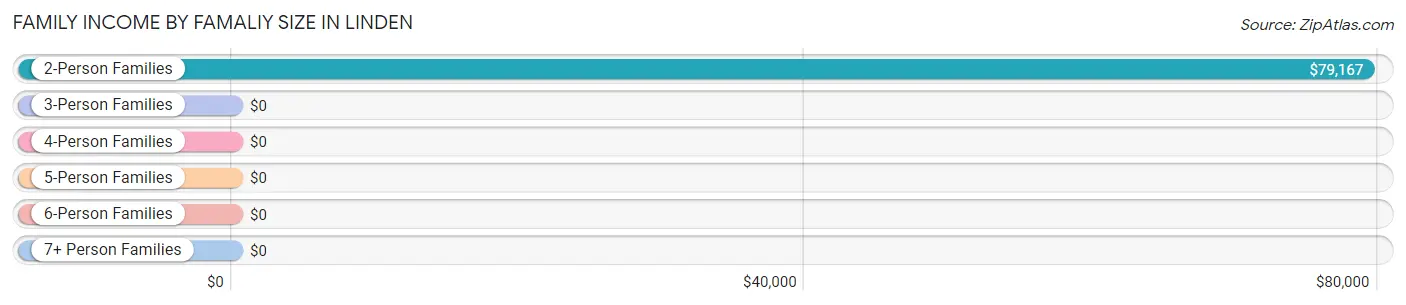
| Income Bracket | # Families | Median Income |
| 2-Person Families | 20 (66.7%) | $79,167 |
| 3-Person Families | 2 (6.7%) | $0 |
| 4-Person Families | 2 (6.7%) | $0 |
| 5-Person Families | 2 (6.7%) | $0 |
| 6-Person Families | 2 (6.7%) | $0 |
| 7+ Person Families | 2 (6.7%) | $0 |
| Total | 30 (100.0%) | $76,250 |
Family Income by Number of Earners in Linden
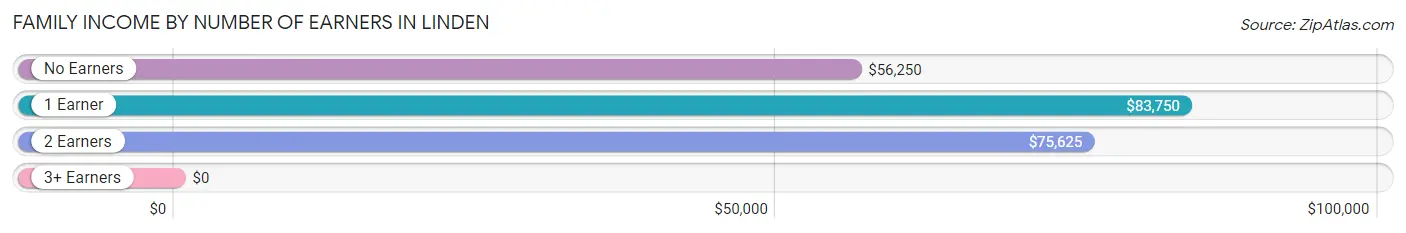
| Number of Earners | # Families | Median Income |
| No Earners | 7 (23.3%) | $56,250 |
| 1 Earner | 10 (33.3%) | $83,750 |
| 2 Earners | 13 (43.3%) | $75,625 |
| 3+ Earners | 0 (0.0%) | $0 |
| Total | 30 (100.0%) | $76,250 |
Household Income in Linden
Household Income Brackets in Linden
With 15 households falling in the category, the $50,000 to $74,999 income range is the most frequent in Linden, accounting for 30.0% of all households.
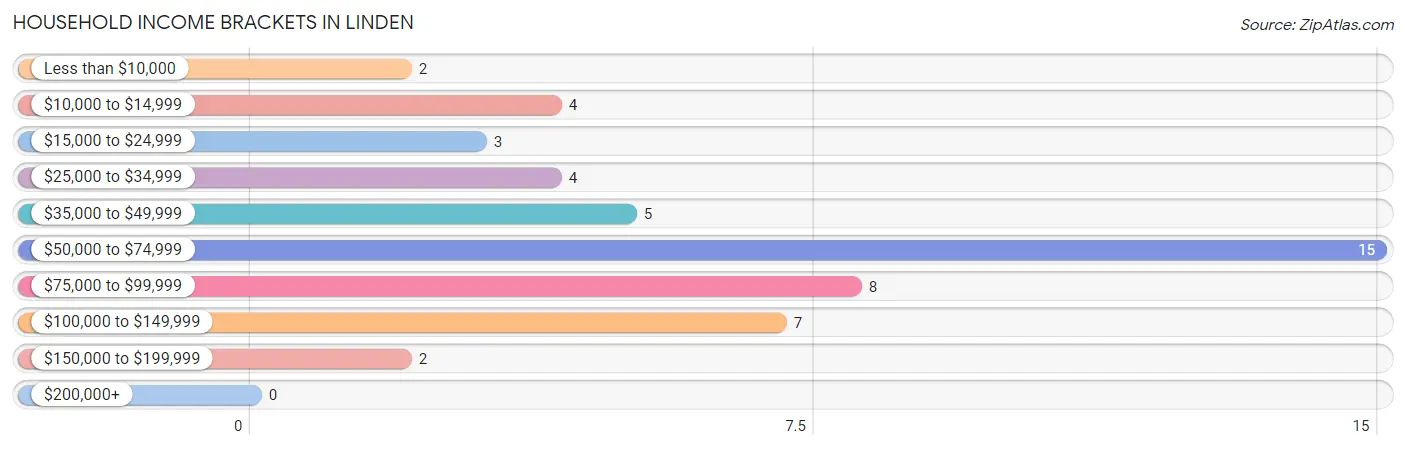
| Income Bracket | # Households | % Households |
| Less than $10,000 | 2 | 4.0% |
| $10,000 to $14,999 | 4 | 8.0% |
| $15,000 to $24,999 | 3 | 6.0% |
| $25,000 to $34,999 | 4 | 8.0% |
| $35,000 to $49,999 | 5 | 10.0% |
| $50,000 to $74,999 | 15 | 30.0% |
| $75,000 to $99,999 | 8 | 16.0% |
| $100,000 to $149,999 | 7 | 14.0% |
| $150,000 to $199,999 | 2 | 4.0% |
| $200,000+ | 0 | 0.0% |
Household Income by Householder Age in Linden
The median household income in Linden is $61,250, with the highest median household income of $72,500 found in the 25 to 44 years age bracket for the primary householder. A total of 12 households (24.0%) fall into this category. Meanwhile, the 45 to 64 years age bracket for the primary householder has the lowest median household income of $0, with 14 households (28.0%) in this group.
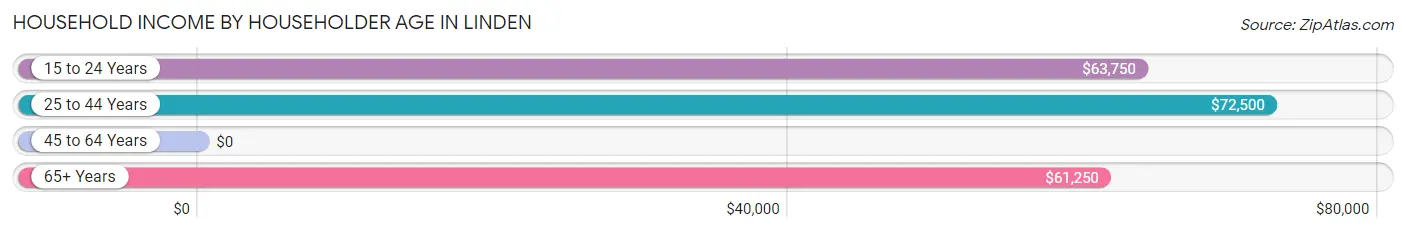
| Income Bracket | # Households | Median Income |
| 15 to 24 Years | 4 (8.0%) | $63,750 |
| 25 to 44 Years | 12 (24.0%) | $72,500 |
| 45 to 64 Years | 14 (28.0%) | $0 |
| 65+ Years | 20 (40.0%) | $61,250 |
| Total | 50 (100.0%) | $61,250 |
Poverty in Linden
Income Below Poverty by Sex and Age in Linden
With 17.7% poverty level for males and 18.8% for females among the residents of Linden, 12 to 14 year old males and 12 to 14 year old females are the most vulnerable to poverty, with 2 males (100.0%) and 2 females (66.7%) in their respective age groups living below the poverty level.
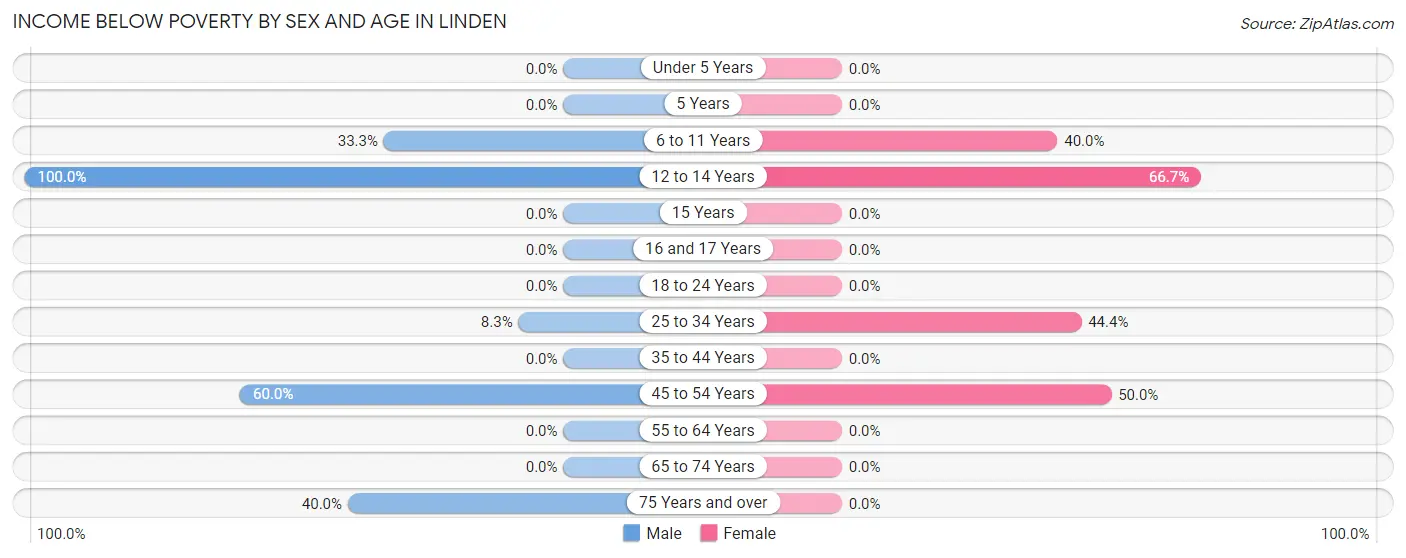
| Age Bracket | Male | Female |
| Under 5 Years | 0 (0.0%) | 0 (0.0%) |
| 5 Years | 0 (0.0%) | 0 (0.0%) |
| 6 to 11 Years | 3 (33.3%) | 4 (40.0%) |
| 12 to 14 Years | 2 (100.0%) | 2 (66.7%) |
| 15 Years | 0 (0.0%) | 0 (0.0%) |
| 16 and 17 Years | 0 (0.0%) | 0 (0.0%) |
| 18 to 24 Years | 0 (0.0%) | 0 (0.0%) |
| 25 to 34 Years | 1 (8.3%) | 4 (44.4%) |
| 35 to 44 Years | 0 (0.0%) | 0 (0.0%) |
| 45 to 54 Years | 3 (60.0%) | 2 (50.0%) |
| 55 to 64 Years | 0 (0.0%) | 0 (0.0%) |
| 65 to 74 Years | 0 (0.0%) | 0 (0.0%) |
| 75 Years and over | 2 (40.0%) | 0 (0.0%) |
| Total | 11 (17.7%) | 12 (18.8%) |
Income Above Poverty by Sex and Age in Linden
According to the poverty statistics in Linden, males aged 5 years and females aged under 5 years are the age groups that are most secure financially, with 100.0% of males and 100.0% of females in these age groups living above the poverty line.
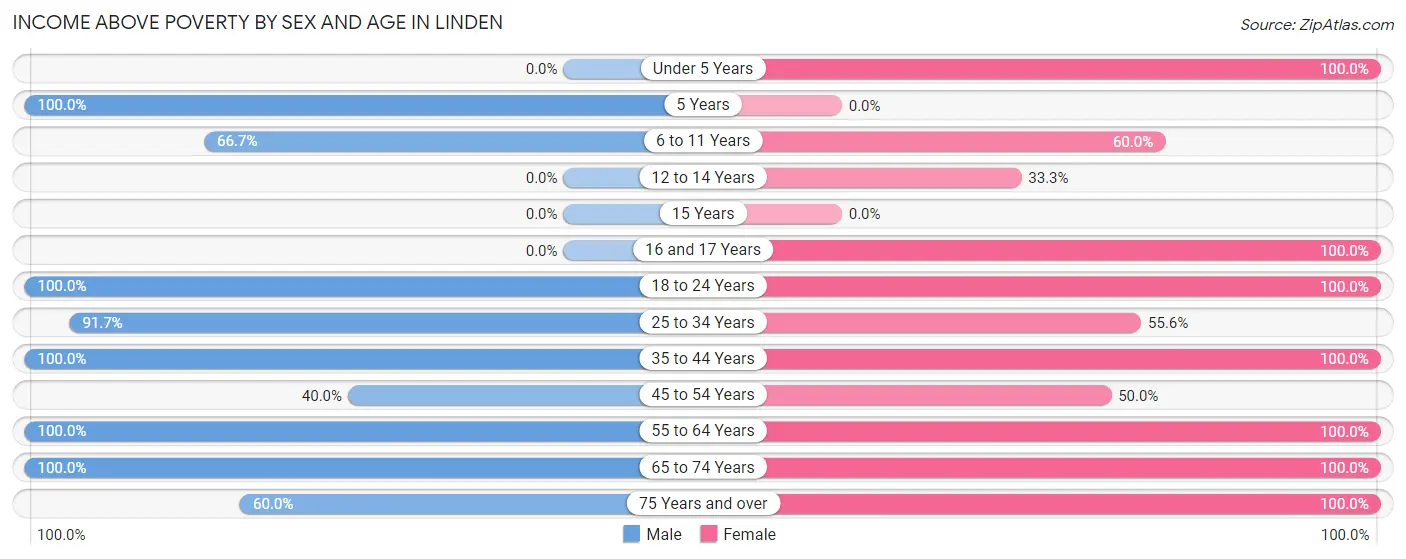
| Age Bracket | Male | Female |
| Under 5 Years | 0 (0.0%) | 10 (100.0%) |
| 5 Years | 1 (100.0%) | 0 (0.0%) |
| 6 to 11 Years | 6 (66.7%) | 6 (60.0%) |
| 12 to 14 Years | 0 (0.0%) | 1 (33.3%) |
| 15 Years | 0 (0.0%) | 0 (0.0%) |
| 16 and 17 Years | 0 (0.0%) | 2 (100.0%) |
| 18 to 24 Years | 5 (100.0%) | 3 (100.0%) |
| 25 to 34 Years | 11 (91.7%) | 5 (55.6%) |
| 35 to 44 Years | 5 (100.0%) | 2 (100.0%) |
| 45 to 54 Years | 2 (40.0%) | 2 (50.0%) |
| 55 to 64 Years | 4 (100.0%) | 8 (100.0%) |
| 65 to 74 Years | 14 (100.0%) | 9 (100.0%) |
| 75 Years and over | 3 (60.0%) | 4 (100.0%) |
| Total | 51 (82.3%) | 52 (81.2%) |
Income Below Poverty Among Married-Couple Families in Linden
The poverty statistics for married-couple families in Linden show that 18.5% or 5 of the total 27 families live below the poverty line. Families with 5 or more children have the highest poverty rate of 100.0%, comprising of 2 families. On the other hand, families with 1 or 2 children have the lowest poverty rate of 0.0%, which includes 0 families.
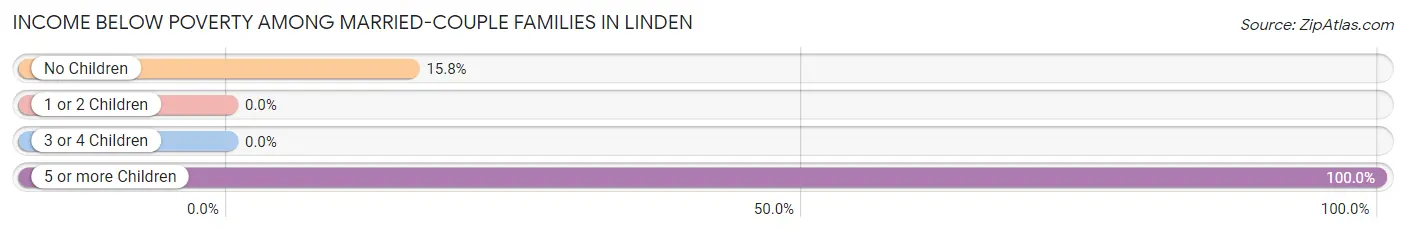
| Children | Above Poverty | Below Poverty |
| No Children | 16 (84.2%) | 3 (15.8%) |
| 1 or 2 Children | 2 (100.0%) | 0 (0.0%) |
| 3 or 4 Children | 4 (100.0%) | 0 (0.0%) |
| 5 or more Children | 0 (0.0%) | 2 (100.0%) |
| Total | 22 (81.5%) | 5 (18.5%) |
Income Below Poverty Among Single-Parent Households in Linden
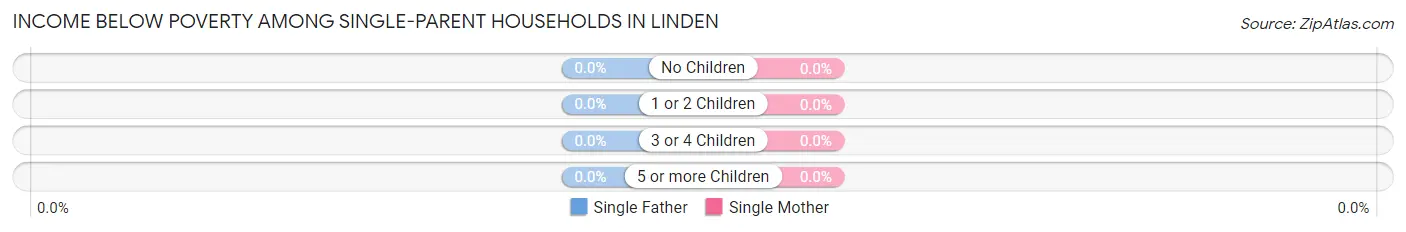
| Children | Single Father | Single Mother |
| No Children | 0 (0.0%) | 0 (0.0%) |
| 1 or 2 Children | 0 (0.0%) | 0 (0.0%) |
| 3 or 4 Children | 0 (0.0%) | 0 (0.0%) |
| 5 or more Children | 0 (0.0%) | 0 (0.0%) |
| Total | 0 (0.0%) | 0 (0.0%) |
Income Below Poverty Among Married-Couple vs Single-Parent Households in Linden
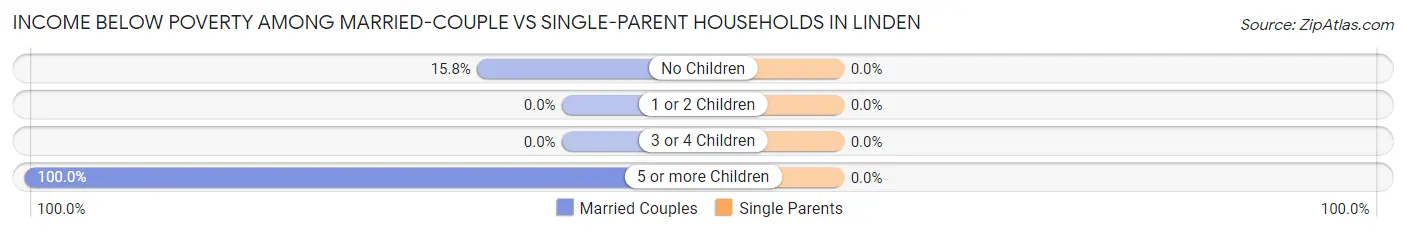
| Children | Married-Couple Families | Single-Parent Households |
| No Children | 3 (15.8%) | 0 (0.0%) |
| 1 or 2 Children | 0 (0.0%) | 0 (0.0%) |
| 3 or 4 Children | 0 (0.0%) | 0 (0.0%) |
| 5 or more Children | 2 (100.0%) | 0 (0.0%) |
| Total | 5 (18.5%) | 0 (0.0%) |
Race in Linden
The most populous races in Linden are White / Caucasian (105 | 83.3%), Black / African American (15 | 11.9%), and Two or more Races (6 | 4.8%).
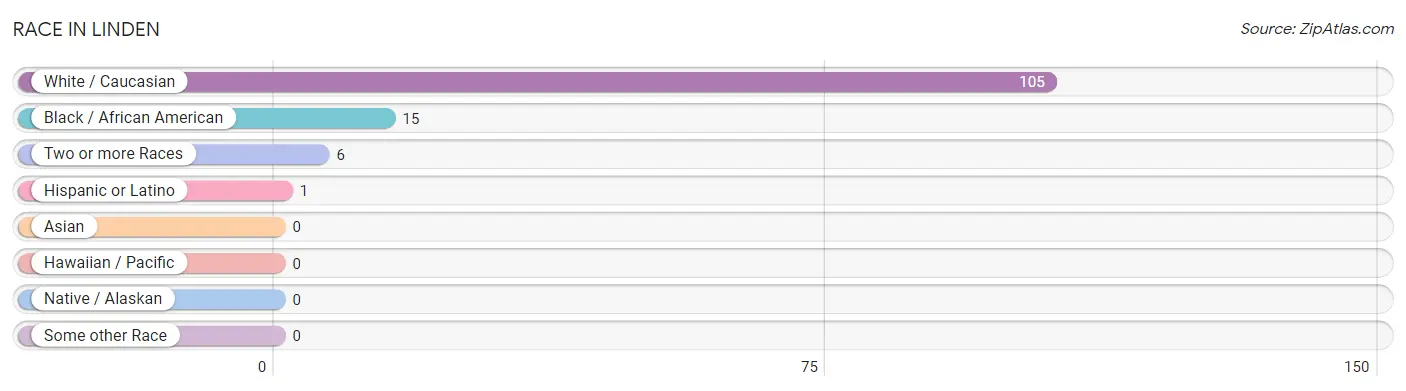
| Race | # Population | % Population |
| Asian | 0 | 0.0% |
| Black / African American | 15 | 11.9% |
| Hawaiian / Pacific | 0 | 0.0% |
| Hispanic or Latino | 1 | 0.8% |
| Native / Alaskan | 0 | 0.0% |
| White / Caucasian | 105 | 83.3% |
| Two or more Races | 6 | 4.8% |
| Some other Race | 0 | 0.0% |
| Total | 126 | 100.0% |
Ancestry in Linden
The most populous ancestries reported in Linden are English (34 | 27.0%), American (17 | 13.5%), German (13 | 10.3%), Irish (11 | 8.7%), and Scandinavian (7 | 5.6%), together accounting for 65.1% of all Linden residents.
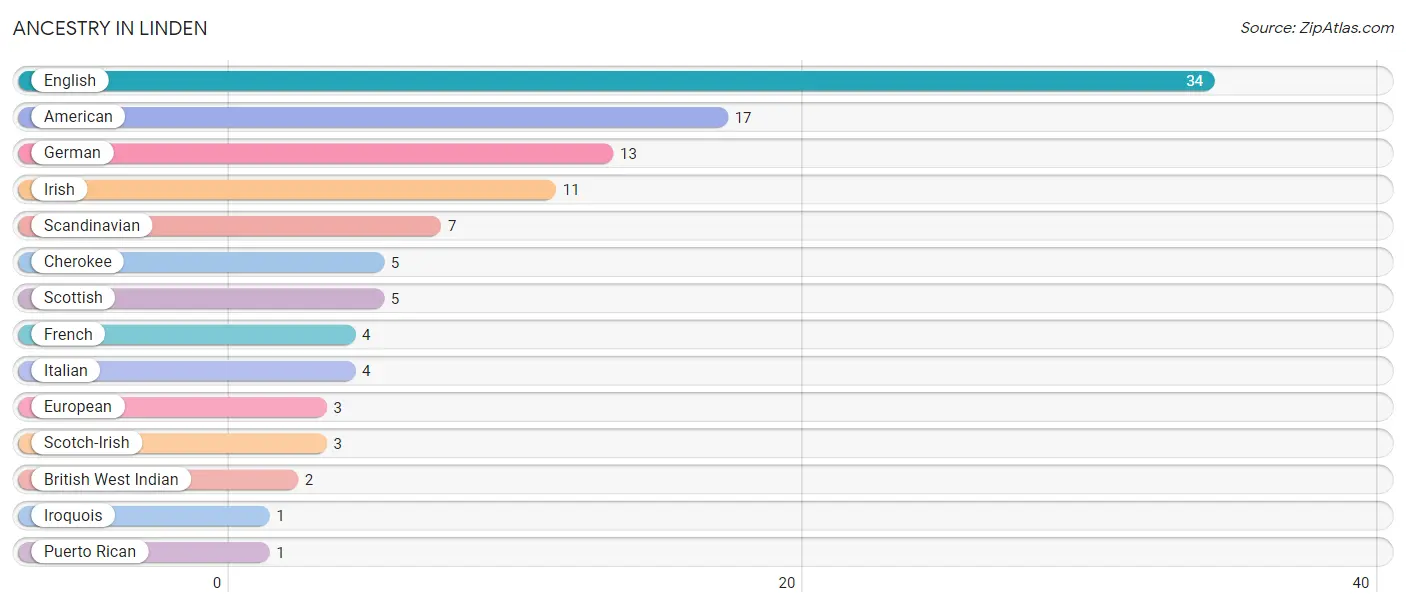
| Ancestry | # Population | % Population |
| American | 17 | 13.5% |
| British West Indian | 2 | 1.6% |
| Cherokee | 5 | 4.0% |
| English | 34 | 27.0% |
| European | 3 | 2.4% |
| French | 4 | 3.2% |
| German | 13 | 10.3% |
| Irish | 11 | 8.7% |
| Iroquois | 1 | 0.8% |
| Italian | 4 | 3.2% |
| Puerto Rican | 1 | 0.8% |
| Scandinavian | 7 | 5.6% |
| Scotch-Irish | 3 | 2.4% |
| Scottish | 5 | 4.0% | View All 14 Rows |
Immigrants in Linden

| Immigration Origin | # Population | % Population | View All 0 Rows |
Sex and Age in Linden
Sex and Age in Linden
The most populous age groups in Linden are 25 to 29 Years (9 | 14.5%) for men and Under 5 Years (10 | 15.6%) for women.
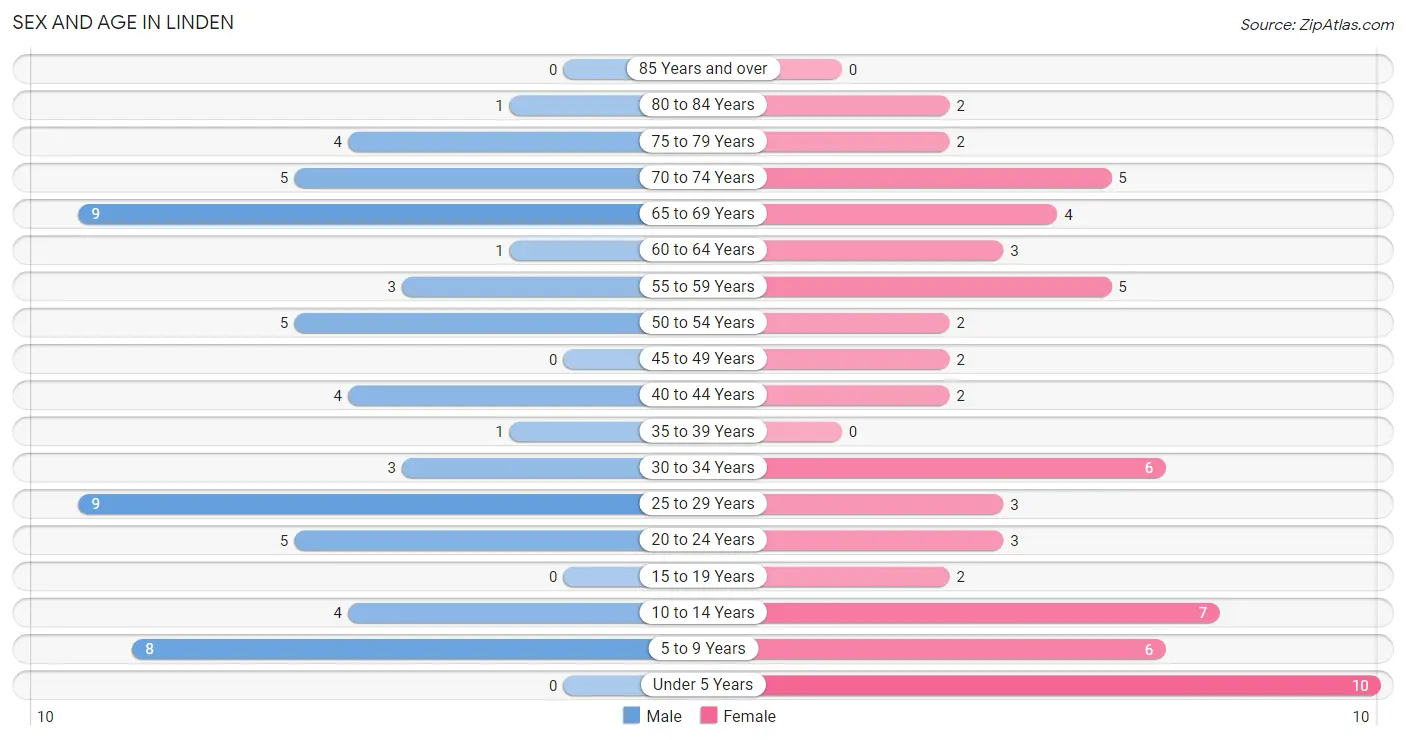
| Age Bracket | Male | Female |
| Under 5 Years | 0 (0.0%) | 10 (15.6%) |
| 5 to 9 Years | 8 (12.9%) | 6 (9.4%) |
| 10 to 14 Years | 4 (6.5%) | 7 (10.9%) |
| 15 to 19 Years | 0 (0.0%) | 2 (3.1%) |
| 20 to 24 Years | 5 (8.1%) | 3 (4.7%) |
| 25 to 29 Years | 9 (14.5%) | 3 (4.7%) |
| 30 to 34 Years | 3 (4.8%) | 6 (9.4%) |
| 35 to 39 Years | 1 (1.6%) | 0 (0.0%) |
| 40 to 44 Years | 4 (6.5%) | 2 (3.1%) |
| 45 to 49 Years | 0 (0.0%) | 2 (3.1%) |
| 50 to 54 Years | 5 (8.1%) | 2 (3.1%) |
| 55 to 59 Years | 3 (4.8%) | 5 (7.8%) |
| 60 to 64 Years | 1 (1.6%) | 3 (4.7%) |
| 65 to 69 Years | 9 (14.5%) | 4 (6.2%) |
| 70 to 74 Years | 5 (8.1%) | 5 (7.8%) |
| 75 to 79 Years | 4 (6.5%) | 2 (3.1%) |
| 80 to 84 Years | 1 (1.6%) | 2 (3.1%) |
| 85 Years and over | 0 (0.0%) | 0 (0.0%) |
| Total | 62 (100.0%) | 64 (100.0%) |
Families and Households in Linden
Median Family Size in Linden
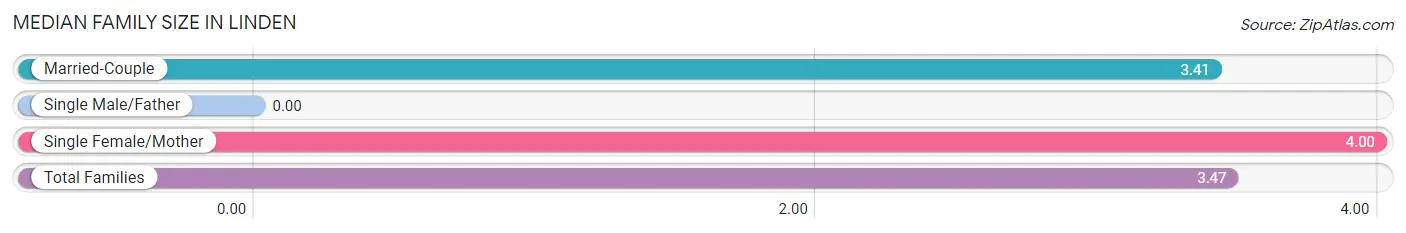
| Family Type | # Families | Family Size |
| Married-Couple | 27 (90.0%) | 3.41 |
| Single Male/Father | 0 (0.0%) | - |
| Single Female/Mother | 3 (10.0%) | 4.00 |
| Total Families | 30 (100.0%) | 3.47 |
Median Household Size in Linden
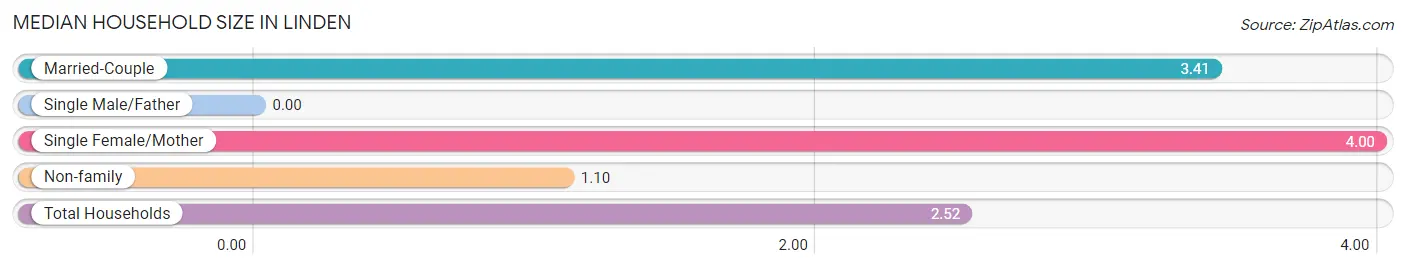
| Household Type | # Households | Household Size |
| Married-Couple | 27 (54.0%) | 3.41 |
| Single Male/Father | 0 (0.0%) | - |
| Single Female/Mother | 3 (6.0%) | 4.00 |
| Non-family | 20 (40.0%) | 1.10 |
| Total Households | 50 (100.0%) | 2.52 |
Household Size by Marriage Status in Linden
Out of a total of 50 households in Linden, 30 (60.0%) are family households, while 20 (40.0%) are nonfamily households. The most numerous type of family households are 2-person households, comprising 20, and the most common type of nonfamily households are 1-person households, comprising 17.
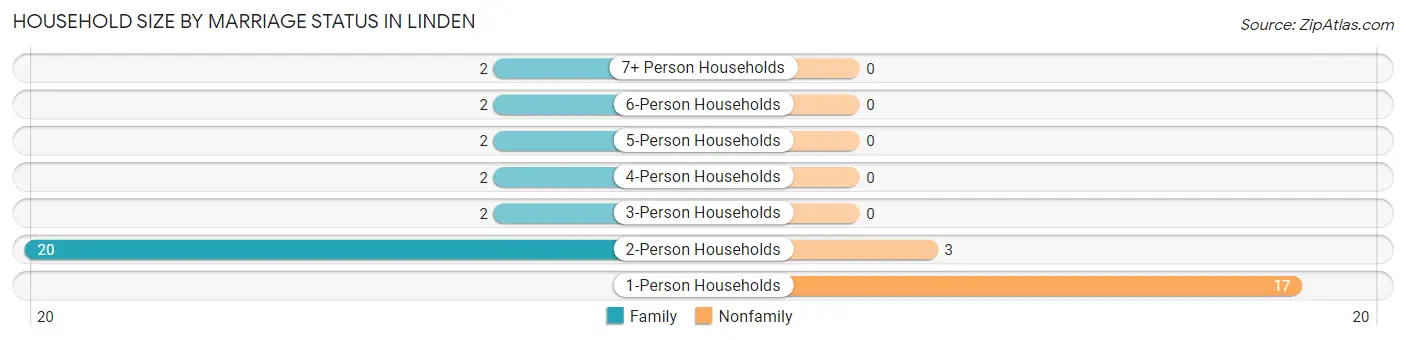
| Household Size | Family Households | Nonfamily Households |
| 1-Person Households | - | 17 (34.0%) |
| 2-Person Households | 20 (40.0%) | 3 (6.0%) |
| 3-Person Households | 2 (4.0%) | 0 (0.0%) |
| 4-Person Households | 2 (4.0%) | 0 (0.0%) |
| 5-Person Households | 2 (4.0%) | 0 (0.0%) |
| 6-Person Households | 2 (4.0%) | 0 (0.0%) |
| 7+ Person Households | 2 (4.0%) | 0 (0.0%) |
| Total | 30 (60.0%) | 20 (40.0%) |
Female Fertility in Linden
Fertility by Age in Linden
Average fertility rate in Linden is 53.0 births per 1,000 women. Women in the age bracket of 20 to 34 years have the highest fertility rate with 83.0 births per 1,000 women. Women in the age bracket of 20 to 34 years acount for 100.0% of all women with births.
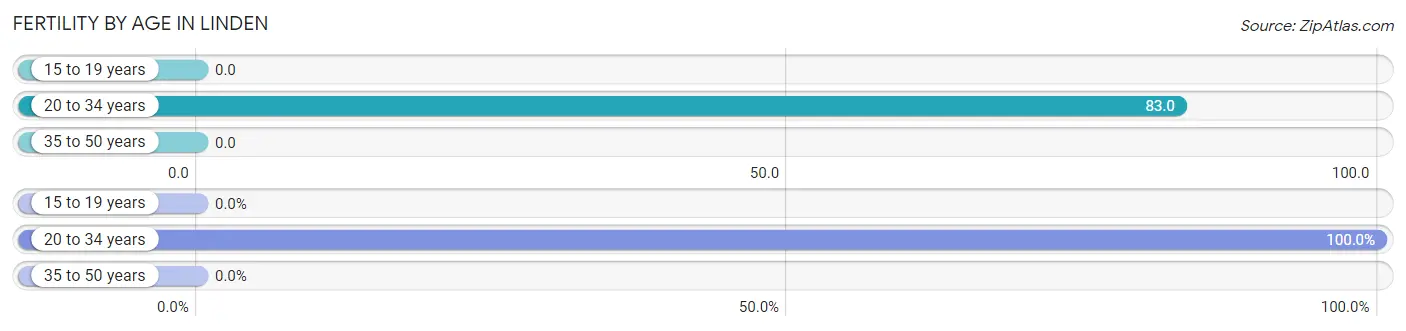
| Age Bracket | Women with Births | Births / 1,000 Women |
| 15 to 19 years | 0 (0.0%) | 0.0 |
| 20 to 34 years | 1 (100.0%) | 83.0 |
| 35 to 50 years | 0 (0.0%) | 0.0 |
| Total | 1 (100.0%) | 53.0 |
Fertility by Age by Marriage Status in Linden
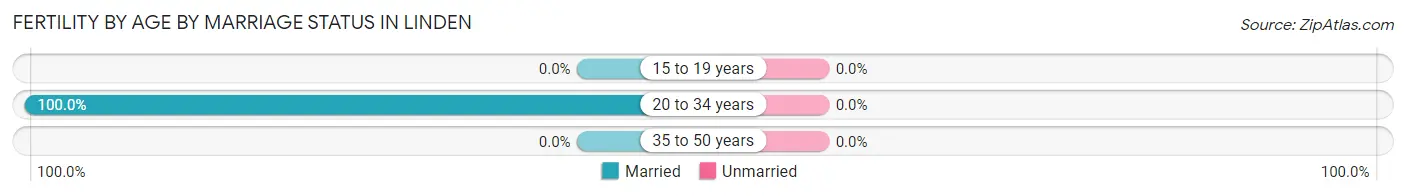
| Age Bracket | Married | Unmarried |
| 15 to 19 years | 0 (0.0%) | 0 (0.0%) |
| 20 to 34 years | 1 (100.0%) | 0 (0.0%) |
| 35 to 50 years | 0 (0.0%) | 0 (0.0%) |
| Total | 1 (100.0%) | 0 (0.0%) |
Fertility by Education in Linden
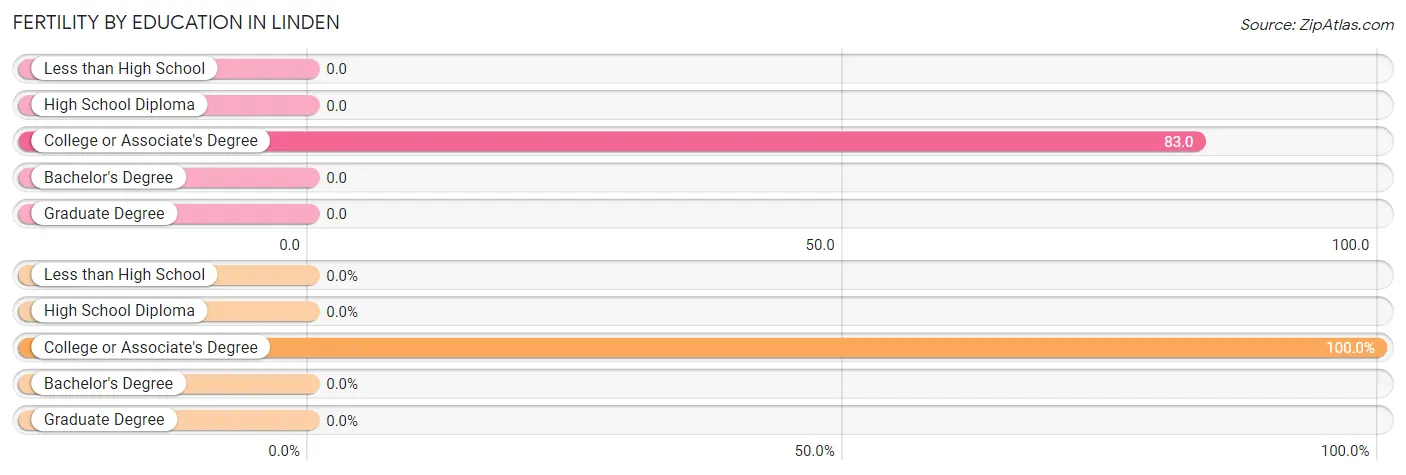
| Educational Attainment | Women with Births | Births / 1,000 Women |
| Less than High School | 0 (0.0%) | 0.0 |
| High School Diploma | 0 (0.0%) | 0.0 |
| College or Associate's Degree | 1 (100.0%) | 83.0 |
| Bachelor's Degree | 0 (0.0%) | 0.0 |
| Graduate Degree | 0 (0.0%) | 0.0 |
| Total | 1 (100.0%) | 53.0 |
Fertility by Education by Marriage Status in Linden
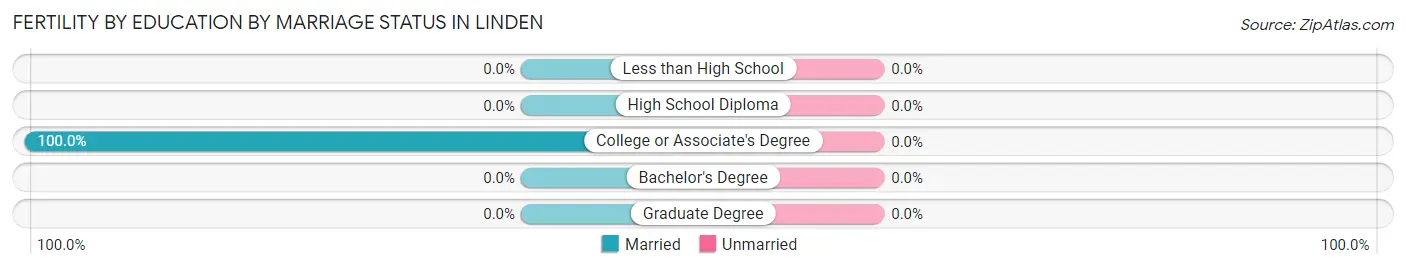
| Educational Attainment | Married | Unmarried |
| Less than High School | 0 (0.0%) | 0 (0.0%) |
| High School Diploma | 0 (0.0%) | 0 (0.0%) |
| College or Associate's Degree | 1 (100.0%) | 0 (0.0%) |
| Bachelor's Degree | 0 (0.0%) | 0 (0.0%) |
| Graduate Degree | 0 (0.0%) | 0 (0.0%) |
| Total | 1 (100.0%) | 0 (0.0%) |
Employment Characteristics in Linden
Employment by Class of Employer in Linden
Among the 46 employed individuals in Linden, private company employees (33 | 71.7%), federal government employees (7 | 15.2%), and self-employed (incorporated) (3 | 6.5%) make up the most common classes of employment.
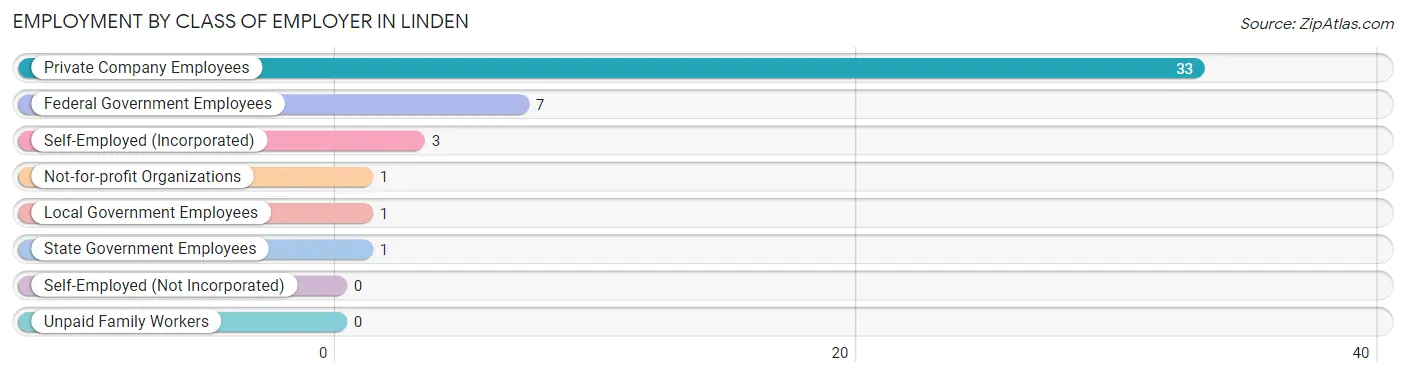
| Employer Class | # Employees | % Employees |
| Private Company Employees | 33 | 71.7% |
| Self-Employed (Incorporated) | 3 | 6.5% |
| Self-Employed (Not Incorporated) | 0 | 0.0% |
| Not-for-profit Organizations | 1 | 2.2% |
| Local Government Employees | 1 | 2.2% |
| State Government Employees | 1 | 2.2% |
| Federal Government Employees | 7 | 15.2% |
| Unpaid Family Workers | 0 | 0.0% |
| Total | 46 | 100.0% |
Employment Status by Age in Linden
According to the labor force statistics for Linden, out of the total population over 16 years of age (91), 54.9% or 50 individuals are in the labor force, with 6.3% or 3 of them unemployed. The age group with the highest labor force participation rate is 35 to 44 years, with 100.0% or 7 individuals in the labor force. Within the labor force, the 45 to 54 years age range has the highest percentage of unemployed individuals, with 42.9% or 3 of them being unemployed.
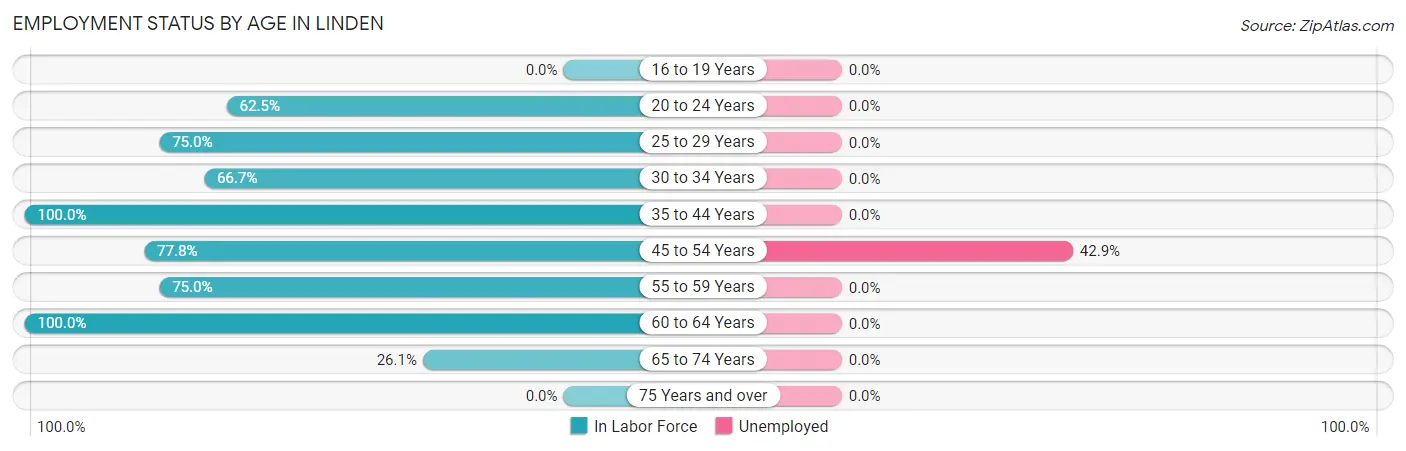
| Age Bracket | In Labor Force | Unemployed |
| 16 to 19 Years | 0 (0.0%) | 0 (0.0%) |
| 20 to 24 Years | 5 (62.5%) | 0 (0.0%) |
| 25 to 29 Years | 9 (75.0%) | 0 (0.0%) |
| 30 to 34 Years | 6 (66.7%) | 0 (0.0%) |
| 35 to 44 Years | 7 (100.0%) | 0 (0.0%) |
| 45 to 54 Years | 7 (77.8%) | 3 (42.9%) |
| 55 to 59 Years | 6 (75.0%) | 0 (0.0%) |
| 60 to 64 Years | 4 (100.0%) | 0 (0.0%) |
| 65 to 74 Years | 6 (26.1%) | 0 (0.0%) |
| 75 Years and over | 0 (0.0%) | 0 (0.0%) |
| Total | 50 (54.9%) | 3 (6.3%) |
Employment Status by Educational Attainment in Linden
According to labor force statistics for Linden, 79.6% of individuals (39) out of the total population between 25 and 64 years of age (49) are in the labor force, with 8.1% or 3 of them being unemployed. The group with the highest labor force participation rate are those with the educational attainment of college / associate degree, with 88.9% or 16 individuals in the labor force. Within the labor force, individuals with college / associate degree education have the highest percentage of unemployment, with 14.3% or 2 of them being unemployed.
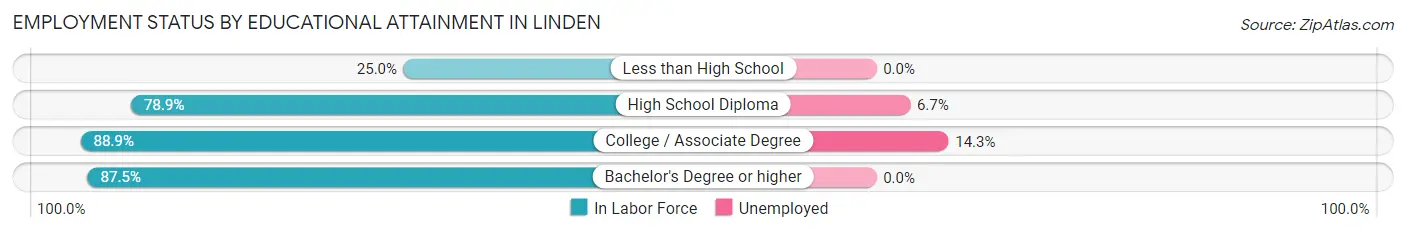
| Educational Attainment | In Labor Force | Unemployed |
| Less than High School | 1 (25.0%) | 0 (0.0%) |
| High School Diploma | 15 (78.9%) | 1 (6.7%) |
| College / Associate Degree | 16 (88.9%) | 3 (14.3%) |
| Bachelor's Degree or higher | 7 (87.5%) | 0 (0.0%) |
| Total | 39 (79.6%) | 4 (8.1%) |
Employment Occupations by Sex in Linden
Management, Business, Science and Arts Occupations
The most common Management, Business, Science and Arts occupations in Linden are Management (3 | 6.7%), Computers, Engineering & Science (2 | 4.4%), Life, Physical & Social Science (2 | 4.4%), Community & Social Service (2 | 4.4%), and Arts, Media & Entertainment (2 | 4.4%).
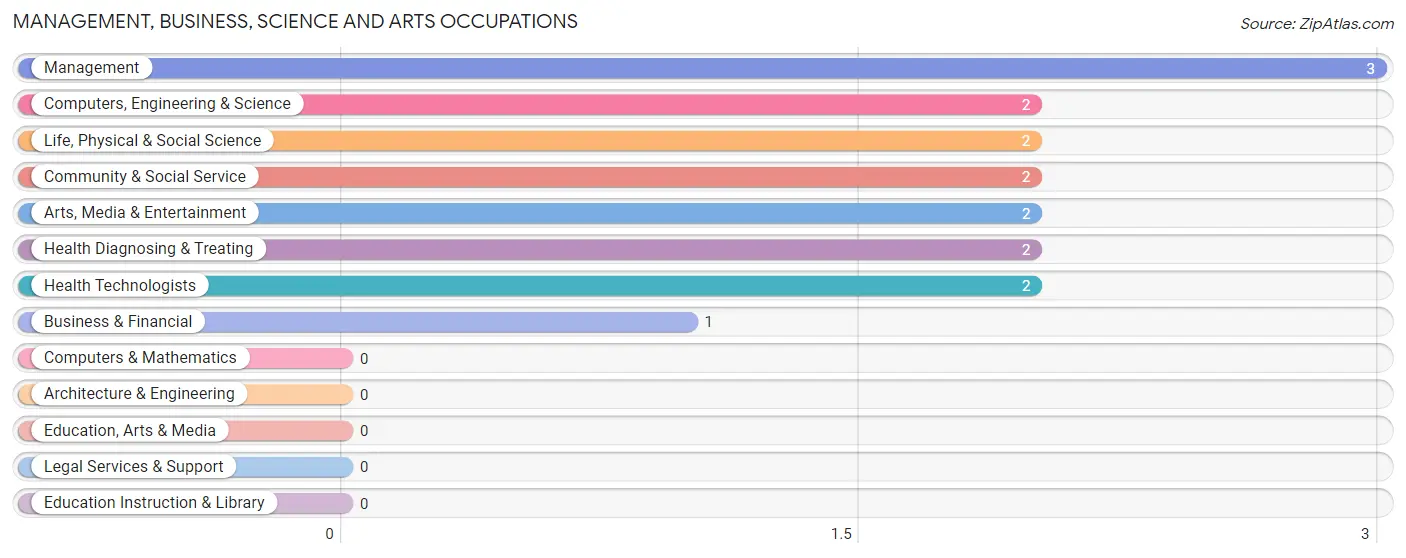
Management, Business, Science and Arts Occupations by Sex
Within the Management, Business, Science and Arts occupations in Linden, the most male-oriented occupations are Computers, Engineering & Science (100.0%), Life, Physical & Social Science (100.0%), and Community & Social Service (100.0%), while the most female-oriented occupations are Business & Financial (100.0%), Health Diagnosing & Treating (100.0%), and Health Technologists (100.0%).
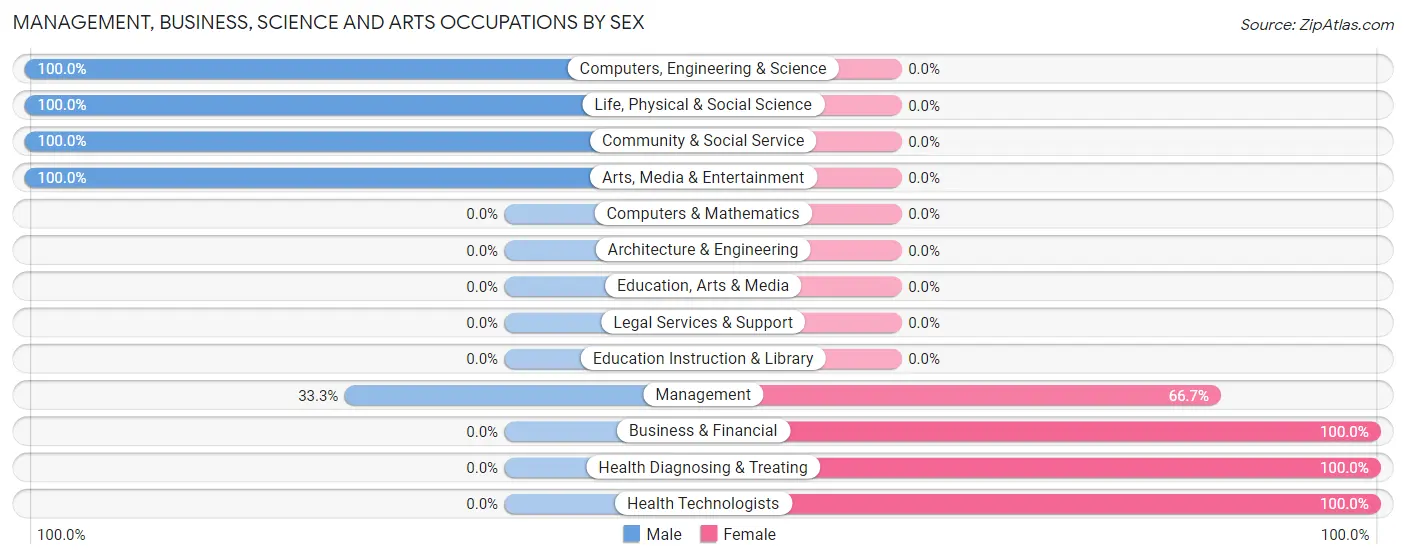
| Occupation | Male | Female |
| Management | 1 (33.3%) | 2 (66.7%) |
| Business & Financial | 0 (0.0%) | 1 (100.0%) |
| Computers, Engineering & Science | 2 (100.0%) | 0 (0.0%) |
| Computers & Mathematics | 0 (0.0%) | 0 (0.0%) |
| Architecture & Engineering | 0 (0.0%) | 0 (0.0%) |
| Life, Physical & Social Science | 2 (100.0%) | 0 (0.0%) |
| Community & Social Service | 2 (100.0%) | 0 (0.0%) |
| Education, Arts & Media | 0 (0.0%) | 0 (0.0%) |
| Legal Services & Support | 0 (0.0%) | 0 (0.0%) |
| Education Instruction & Library | 0 (0.0%) | 0 (0.0%) |
| Arts, Media & Entertainment | 2 (100.0%) | 0 (0.0%) |
| Health Diagnosing & Treating | 0 (0.0%) | 2 (100.0%) |
| Health Technologists | 0 (0.0%) | 2 (100.0%) |
| Total (Category) | 5 (50.0%) | 5 (50.0%) |
| Total (Overall) | 24 (53.3%) | 21 (46.7%) |
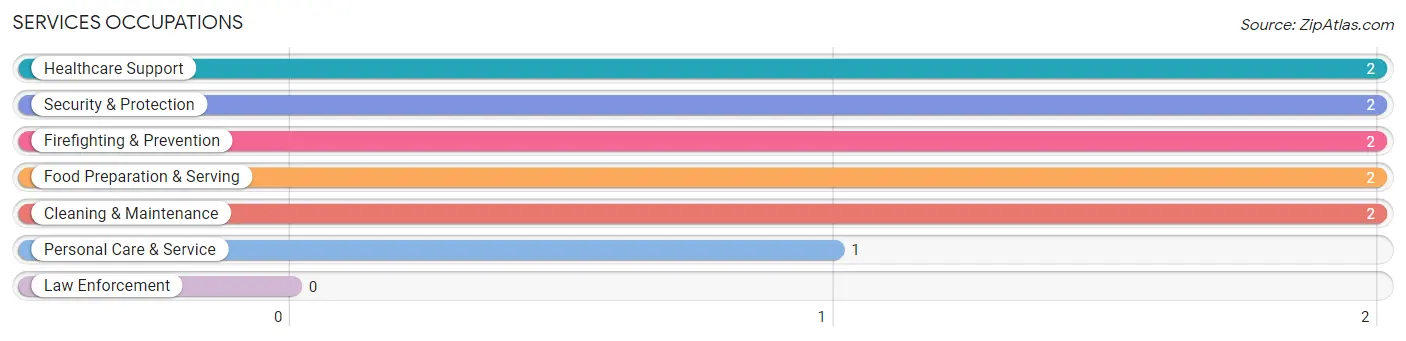
Services Occupations
The most common Services occupations in Linden are Healthcare Support (2 | 4.4%), Security & Protection (2 | 4.4%), Firefighting & Prevention (2 | 4.4%), Food Preparation & Serving (2 | 4.4%), and Cleaning & Maintenance (2 | 4.4%).
Services Occupations by Sex
Within the Services occupations in Linden, the most male-oriented occupations are Security & Protection (100.0%), and Firefighting & Prevention (100.0%), while the most female-oriented occupations are Healthcare Support (100.0%), Food Preparation & Serving (100.0%), and Cleaning & Maintenance (100.0%).
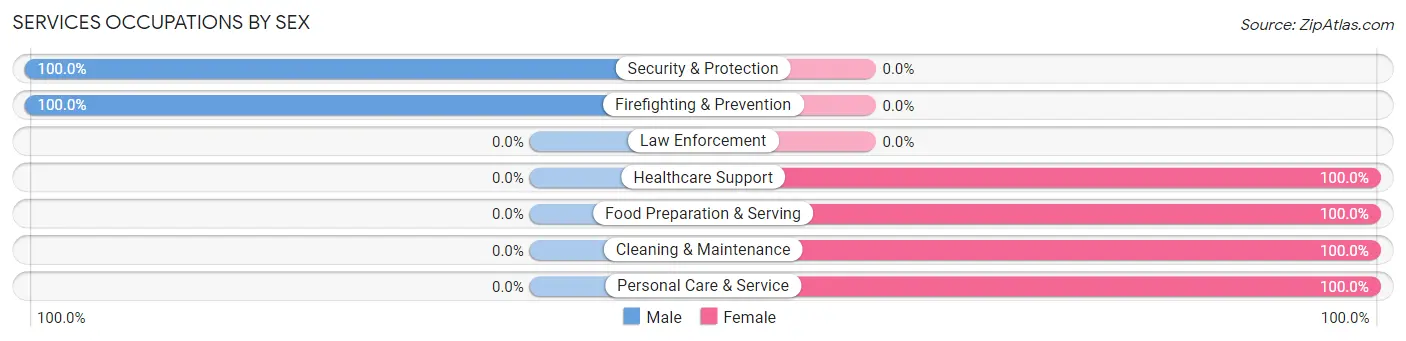
| Occupation | Male | Female |
| Healthcare Support | 0 (0.0%) | 2 (100.0%) |
| Security & Protection | 2 (100.0%) | 0 (0.0%) |
| Firefighting & Prevention | 2 (100.0%) | 0 (0.0%) |
| Law Enforcement | 0 (0.0%) | 0 (0.0%) |
| Food Preparation & Serving | 0 (0.0%) | 2 (100.0%) |
| Cleaning & Maintenance | 0 (0.0%) | 2 (100.0%) |
| Personal Care & Service | 0 (0.0%) | 1 (100.0%) |
| Total (Category) | 2 (22.2%) | 7 (77.8%) |
| Total (Overall) | 24 (53.3%) | 21 (46.7%) |
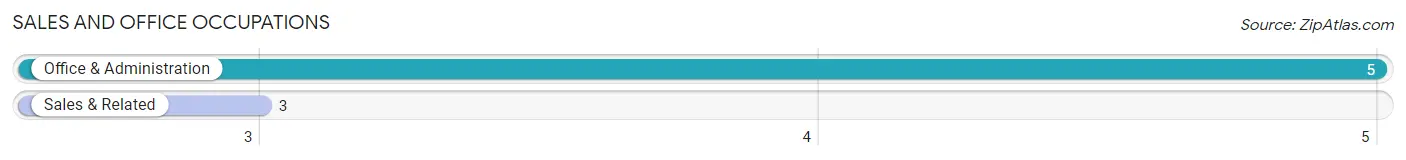
Sales and Office Occupations
The most common Sales and Office occupations in Linden are Office & Administration (5 | 11.1%), and Sales & Related (3 | 6.7%).
Sales and Office Occupations by Sex
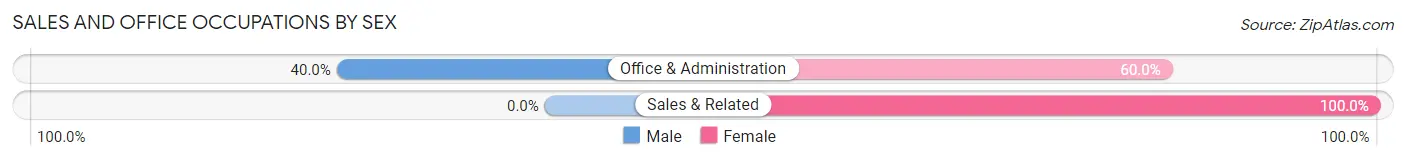
| Occupation | Male | Female |
| Sales & Related | 0 (0.0%) | 3 (100.0%) |
| Office & Administration | 2 (40.0%) | 3 (60.0%) |
| Total (Category) | 2 (25.0%) | 6 (75.0%) |
| Total (Overall) | 24 (53.3%) | 21 (46.7%) |
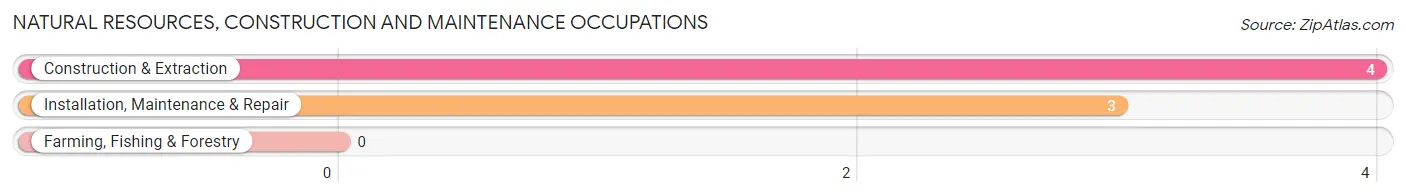
Natural Resources, Construction and Maintenance Occupations
The most common Natural Resources, Construction and Maintenance occupations in Linden are Construction & Extraction (4 | 8.9%), and Installation, Maintenance & Repair (3 | 6.7%).
Natural Resources, Construction and Maintenance Occupations by Sex
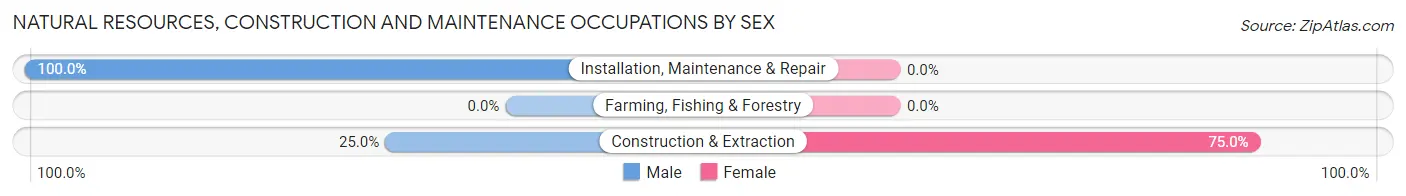
| Occupation | Male | Female |
| Farming, Fishing & Forestry | 0 (0.0%) | 0 (0.0%) |
| Construction & Extraction | 1 (25.0%) | 3 (75.0%) |
| Installation, Maintenance & Repair | 3 (100.0%) | 0 (0.0%) |
| Total (Category) | 4 (57.1%) | 3 (42.9%) |
| Total (Overall) | 24 (53.3%) | 21 (46.7%) |
Production, Transportation and Moving Occupations
The most common Production, Transportation and Moving occupations in Linden are Production (5 | 11.1%), Transportation (4 | 8.9%), and Material Moving (2 | 4.4%).
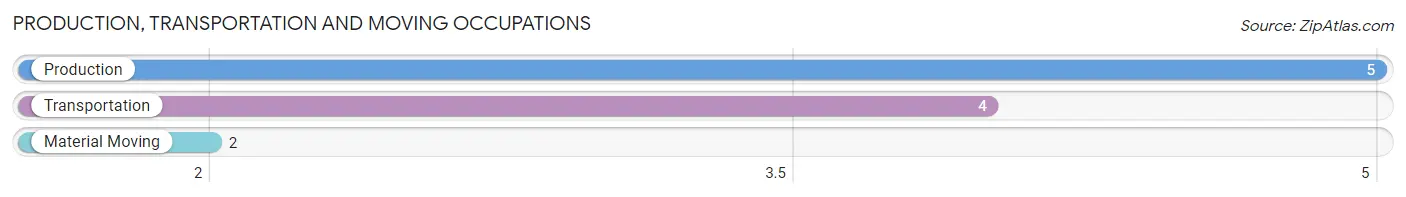
Production, Transportation and Moving Occupations by Sex
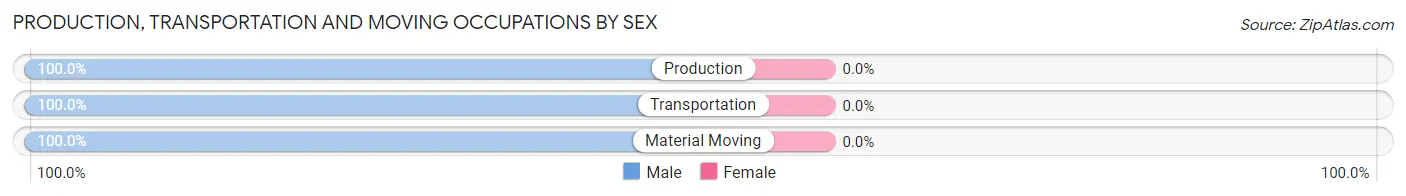
| Occupation | Male | Female |
| Production | 5 (100.0%) | 0 (0.0%) |
| Transportation | 4 (100.0%) | 0 (0.0%) |
| Material Moving | 2 (100.0%) | 0 (0.0%) |
| Total (Category) | 11 (100.0%) | 0 (0.0%) |
| Total (Overall) | 24 (53.3%) | 21 (46.7%) |
Employment Industries by Sex in Linden
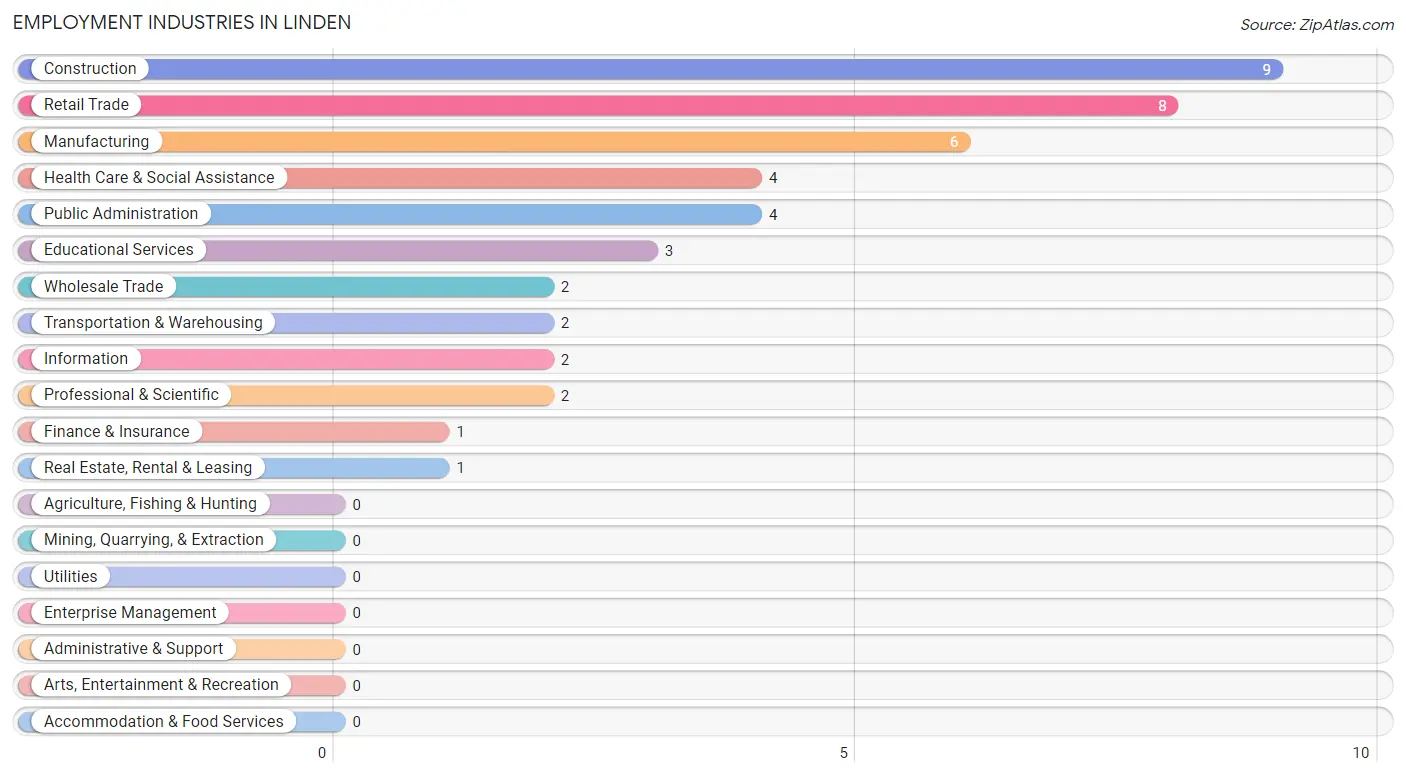
Employment Industries in Linden
The major employment industries in Linden include Construction (9 | 20.0%), Retail Trade (8 | 17.8%), Manufacturing (6 | 13.3%), Health Care & Social Assistance (4 | 8.9%), and Public Administration (4 | 8.9%).
Employment Industries by Sex in Linden
The Linden industries that see more men than women are Manufacturing (100.0%), Wholesale Trade (100.0%), and Information (100.0%), whereas the industries that tend to have a higher number of women are Transportation & Warehousing (100.0%), Finance & Insurance (100.0%), and Educational Services (100.0%).
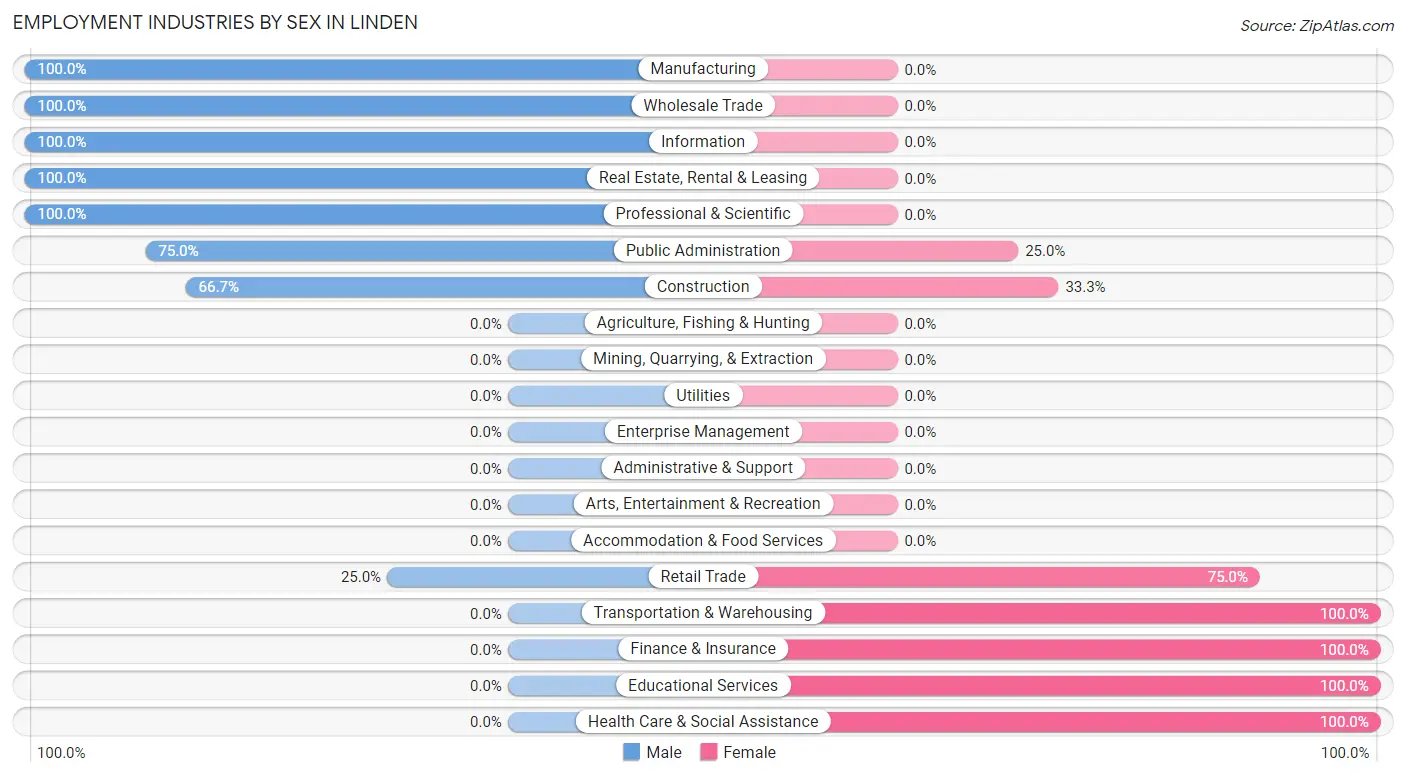
| Industry | Male | Female |
| Agriculture, Fishing & Hunting | 0 (0.0%) | 0 (0.0%) |
| Mining, Quarrying, & Extraction | 0 (0.0%) | 0 (0.0%) |
| Construction | 6 (66.7%) | 3 (33.3%) |
| Manufacturing | 6 (100.0%) | 0 (0.0%) |
| Wholesale Trade | 2 (100.0%) | 0 (0.0%) |
| Retail Trade | 2 (25.0%) | 6 (75.0%) |
| Transportation & Warehousing | 0 (0.0%) | 2 (100.0%) |
| Utilities | 0 (0.0%) | 0 (0.0%) |
| Information | 2 (100.0%) | 0 (0.0%) |
| Finance & Insurance | 0 (0.0%) | 1 (100.0%) |
| Real Estate, Rental & Leasing | 1 (100.0%) | 0 (0.0%) |
| Professional & Scientific | 2 (100.0%) | 0 (0.0%) |
| Enterprise Management | 0 (0.0%) | 0 (0.0%) |
| Administrative & Support | 0 (0.0%) | 0 (0.0%) |
| Educational Services | 0 (0.0%) | 3 (100.0%) |
| Health Care & Social Assistance | 0 (0.0%) | 4 (100.0%) |
| Arts, Entertainment & Recreation | 0 (0.0%) | 0 (0.0%) |
| Accommodation & Food Services | 0 (0.0%) | 0 (0.0%) |
| Public Administration | 3 (75.0%) | 1 (25.0%) |
| Total | 24 (53.3%) | 21 (46.7%) |
Education in Linden
School Enrollment in Linden
The most common levels of schooling among the 30 students in Linden are elementary school (15 | 50.0%), middle school (8 | 26.7%), and college / undergraduate (5 | 16.7%).
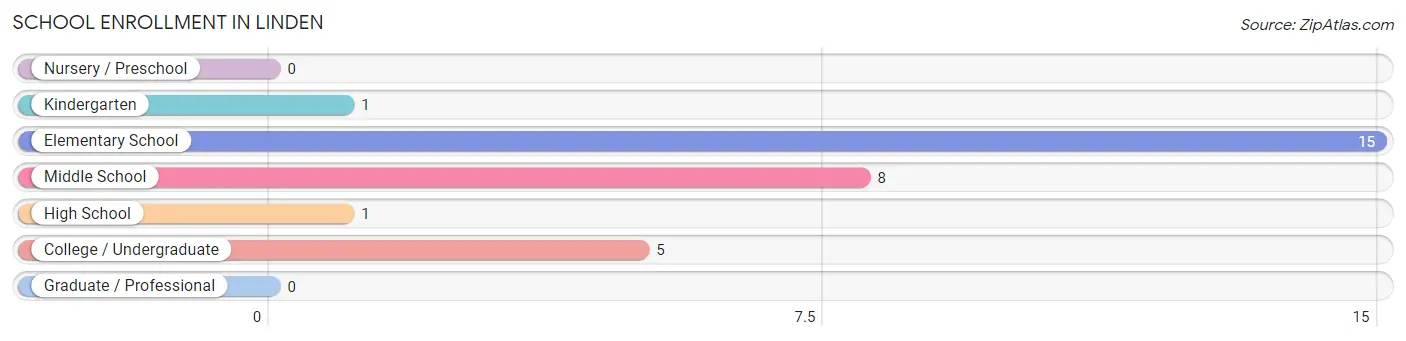
| School Level | # Students | % Students |
| Nursery / Preschool | 0 | 0.0% |
| Kindergarten | 1 | 3.3% |
| Elementary School | 15 | 50.0% |
| Middle School | 8 | 26.7% |
| High School | 1 | 3.3% |
| College / Undergraduate | 5 | 16.7% |
| Graduate / Professional | 0 | 0.0% |
| Total | 30 | 100.0% |
School Enrollment by Age by Funding Source in Linden
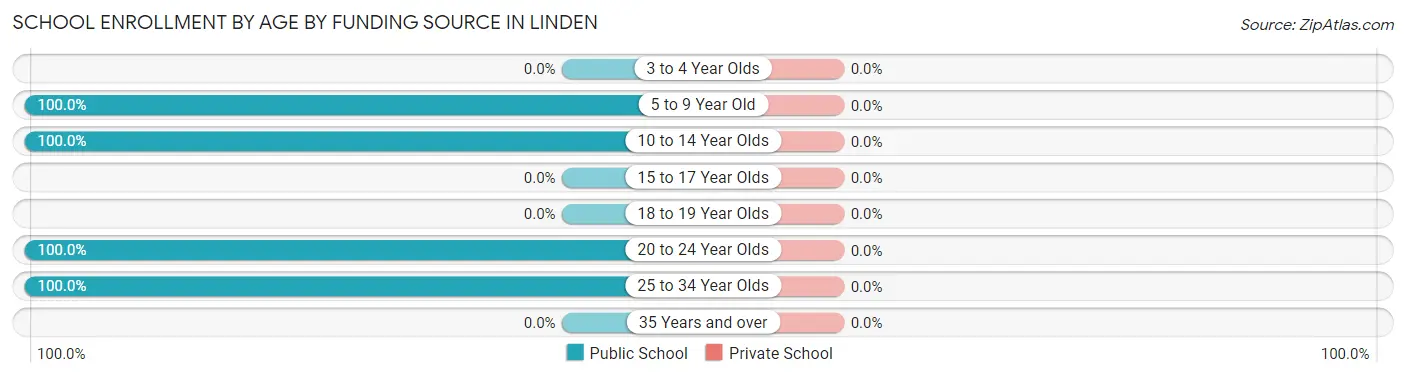
| Age Bracket | Public School | Private School |
| 3 to 4 Year Olds | 0 (0.0%) | 0 (0.0%) |
| 5 to 9 Year Old | 14 (100.0%) | 0 (0.0%) |
| 10 to 14 Year Olds | 11 (100.0%) | 0 (0.0%) |
| 15 to 17 Year Olds | 0 (0.0%) | 0 (0.0%) |
| 18 to 19 Year Olds | 0 (0.0%) | 0 (0.0%) |
| 20 to 24 Year Olds | 3 (100.0%) | 0 (0.0%) |
| 25 to 34 Year Olds | 2 (100.0%) | 0 (0.0%) |
| 35 Years and over | 0 (0.0%) | 0 (0.0%) |
| Total | 30 (100.0%) | 0 (0.0%) |
Educational Attainment by Field of Study in Linden
Science & technology (6 | 35.3%), physical & health sciences (4 | 23.5%), education (3 | 17.6%), bio, nature & agricultural (2 | 11.8%), and engineering (2 | 11.8%) are the most common fields of study among 17 individuals in Linden who have obtained a bachelor's degree or higher.
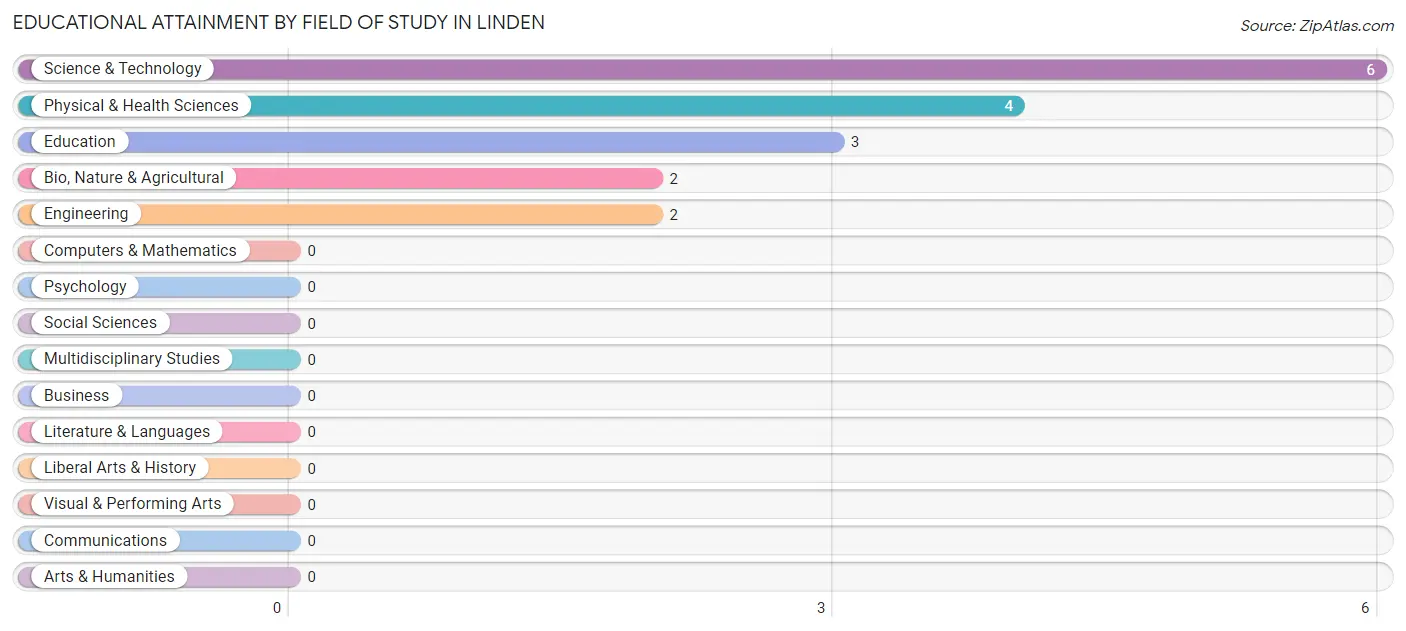
| Field of Study | # Graduates | % Graduates |
| Computers & Mathematics | 0 | 0.0% |
| Bio, Nature & Agricultural | 2 | 11.8% |
| Physical & Health Sciences | 4 | 23.5% |
| Psychology | 0 | 0.0% |
| Social Sciences | 0 | 0.0% |
| Engineering | 2 | 11.8% |
| Multidisciplinary Studies | 0 | 0.0% |
| Science & Technology | 6 | 35.3% |
| Business | 0 | 0.0% |
| Education | 3 | 17.6% |
| Literature & Languages | 0 | 0.0% |
| Liberal Arts & History | 0 | 0.0% |
| Visual & Performing Arts | 0 | 0.0% |
| Communications | 0 | 0.0% |
| Arts & Humanities | 0 | 0.0% |
| Total | 17 | 100.0% |
Transportation & Commute in Linden
Vehicle Availability by Sex in Linden
The most prevalent vehicle ownership categories in Linden are males with 3 vehicles (15, accounting for 57.7%) and females with 3 vehicles (11, making up 75.0%).
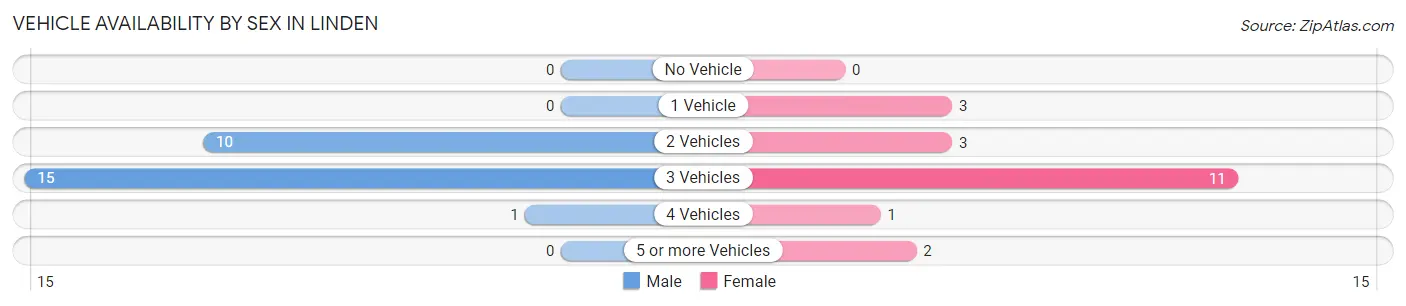
| Vehicles Available | Male | Female |
| No Vehicle | 0 (0.0%) | 0 (0.0%) |
| 1 Vehicle | 0 (0.0%) | 3 (15.0%) |
| 2 Vehicles | 10 (38.5%) | 3 (15.0%) |
| 3 Vehicles | 15 (57.7%) | 11 (55.0%) |
| 4 Vehicles | 1 (3.8%) | 1 (5.0%) |
| 5 or more Vehicles | 0 (0.0%) | 2 (10.0%) |
| Total | 26 (100.0%) | 20 (100.0%) |
Commute Time in Linden
The most frequently occuring commute durations in Linden are 30 to 34 minutes (11 commuters, 24.4%), 20 to 24 minutes (10 commuters, 22.2%), and 15 to 19 minutes (4 commuters, 8.9%).
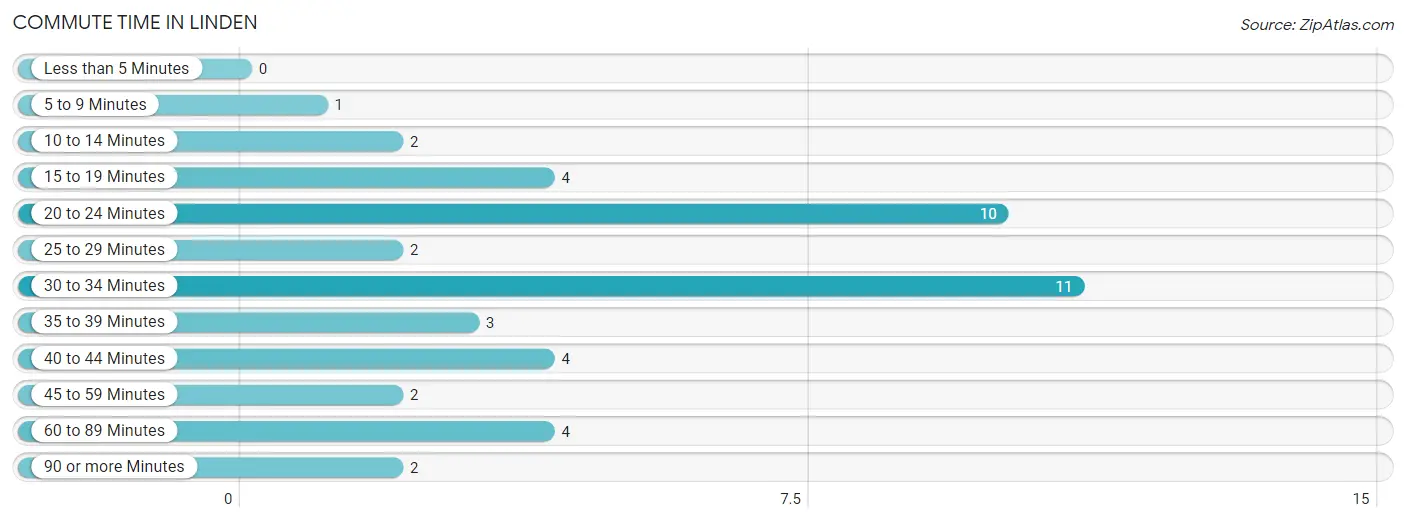
| Commute Time | # Commuters | % Commuters |
| Less than 5 Minutes | 0 | 0.0% |
| 5 to 9 Minutes | 1 | 2.2% |
| 10 to 14 Minutes | 2 | 4.4% |
| 15 to 19 Minutes | 4 | 8.9% |
| 20 to 24 Minutes | 10 | 22.2% |
| 25 to 29 Minutes | 2 | 4.4% |
| 30 to 34 Minutes | 11 | 24.4% |
| 35 to 39 Minutes | 3 | 6.7% |
| 40 to 44 Minutes | 4 | 8.9% |
| 45 to 59 Minutes | 2 | 4.4% |
| 60 to 89 Minutes | 4 | 8.9% |
| 90 or more Minutes | 2 | 4.4% |
Commute Time by Sex in Linden
The most common commute times in Linden are 20 to 24 minutes (5 commuters, 19.2%) for males and 30 to 34 minutes (7 commuters, 36.8%) for females.
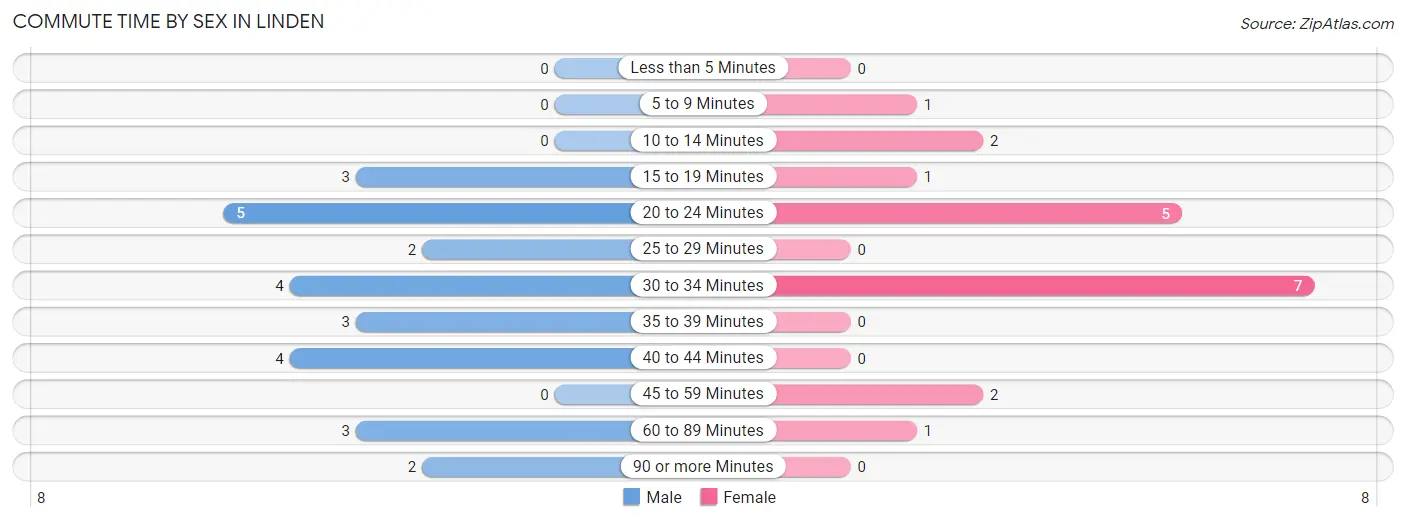
| Commute Time | Male | Female |
| Less than 5 Minutes | 0 (0.0%) | 0 (0.0%) |
| 5 to 9 Minutes | 0 (0.0%) | 1 (5.3%) |
| 10 to 14 Minutes | 0 (0.0%) | 2 (10.5%) |
| 15 to 19 Minutes | 3 (11.5%) | 1 (5.3%) |
| 20 to 24 Minutes | 5 (19.2%) | 5 (26.3%) |
| 25 to 29 Minutes | 2 (7.7%) | 0 (0.0%) |
| 30 to 34 Minutes | 4 (15.4%) | 7 (36.8%) |
| 35 to 39 Minutes | 3 (11.5%) | 0 (0.0%) |
| 40 to 44 Minutes | 4 (15.4%) | 0 (0.0%) |
| 45 to 59 Minutes | 0 (0.0%) | 2 (10.5%) |
| 60 to 89 Minutes | 3 (11.5%) | 1 (5.3%) |
| 90 or more Minutes | 2 (7.7%) | 0 (0.0%) |
Time of Departure to Work by Sex in Linden
The most frequent times of departure to work in Linden are 6:00 AM to 6:29 AM (9, 34.6%) for males and 8:30 AM to 8:59 AM (4, 21.0%) for females.
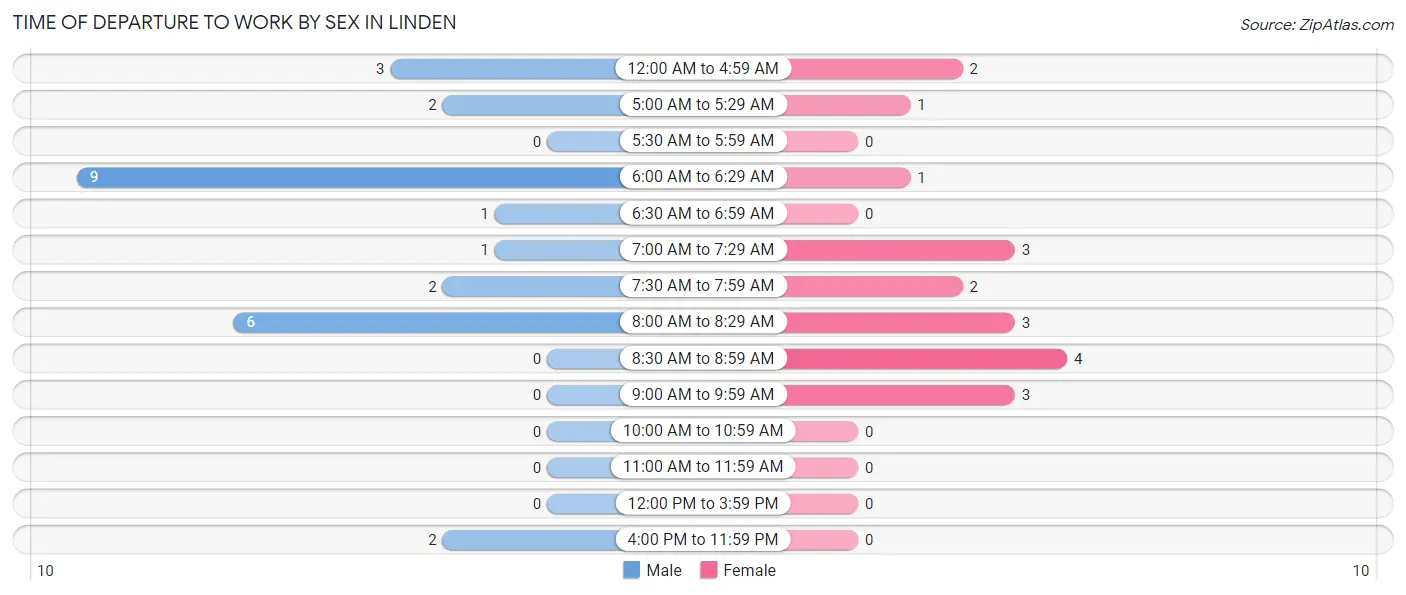
| Time of Departure | Male | Female |
| 12:00 AM to 4:59 AM | 3 (11.5%) | 2 (10.5%) |
| 5:00 AM to 5:29 AM | 2 (7.7%) | 1 (5.3%) |
| 5:30 AM to 5:59 AM | 0 (0.0%) | 0 (0.0%) |
| 6:00 AM to 6:29 AM | 9 (34.6%) | 1 (5.3%) |
| 6:30 AM to 6:59 AM | 1 (3.8%) | 0 (0.0%) |
| 7:00 AM to 7:29 AM | 1 (3.8%) | 3 (15.8%) |
| 7:30 AM to 7:59 AM | 2 (7.7%) | 2 (10.5%) |
| 8:00 AM to 8:29 AM | 6 (23.1%) | 3 (15.8%) |
| 8:30 AM to 8:59 AM | 0 (0.0%) | 4 (21.0%) |
| 9:00 AM to 9:59 AM | 0 (0.0%) | 3 (15.8%) |
| 10:00 AM to 10:59 AM | 0 (0.0%) | 0 (0.0%) |
| 11:00 AM to 11:59 AM | 0 (0.0%) | 0 (0.0%) |
| 12:00 PM to 3:59 PM | 0 (0.0%) | 0 (0.0%) |
| 4:00 PM to 11:59 PM | 2 (7.7%) | 0 (0.0%) |
| Total | 26 (100.0%) | 19 (100.0%) |
Housing Occupancy in Linden
Occupancy by Ownership in Linden
Of the total 50 dwellings in Linden, owner-occupied units account for 43 (86.0%), while renter-occupied units make up 7 (14.0%).
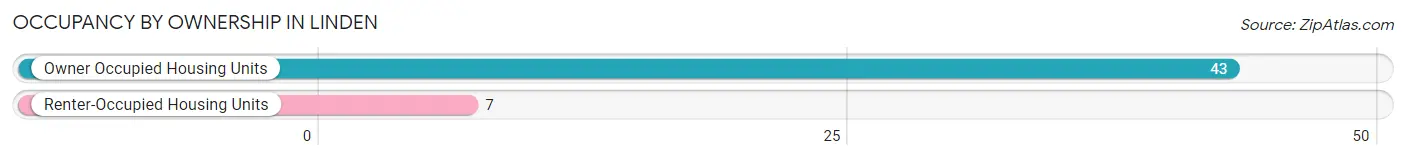
| Occupancy | # Housing Units | % Housing Units |
| Owner Occupied Housing Units | 43 | 86.0% |
| Renter-Occupied Housing Units | 7 | 14.0% |
| Total Occupied Housing Units | 50 | 100.0% |
Occupancy by Household Size in Linden
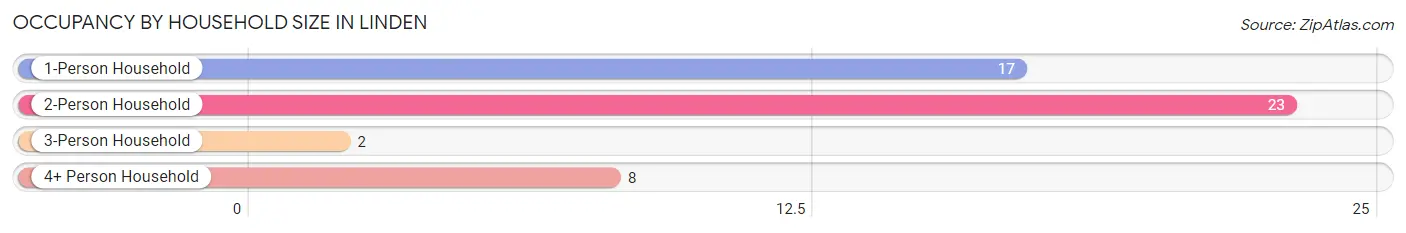
| Household Size | # Housing Units | % Housing Units |
| 1-Person Household | 17 | 34.0% |
| 2-Person Household | 23 | 46.0% |
| 3-Person Household | 2 | 4.0% |
| 4+ Person Household | 8 | 16.0% |
| Total Housing Units | 50 | 100.0% |
Occupancy by Ownership by Household Size in Linden
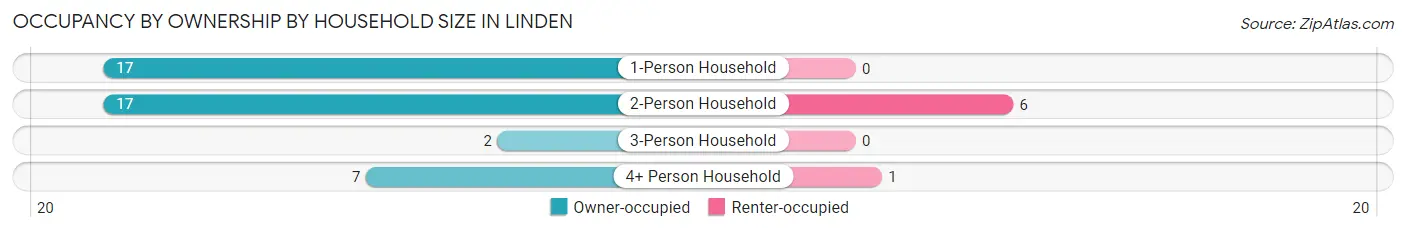
| Household Size | Owner-occupied | Renter-occupied |
| 1-Person Household | 17 (100.0%) | 0 (0.0%) |
| 2-Person Household | 17 (73.9%) | 6 (26.1%) |
| 3-Person Household | 2 (100.0%) | 0 (0.0%) |
| 4+ Person Household | 7 (87.5%) | 1 (12.5%) |
| Total Housing Units | 43 (86.0%) | 7 (14.0%) |
Occupancy by Educational Attainment in Linden
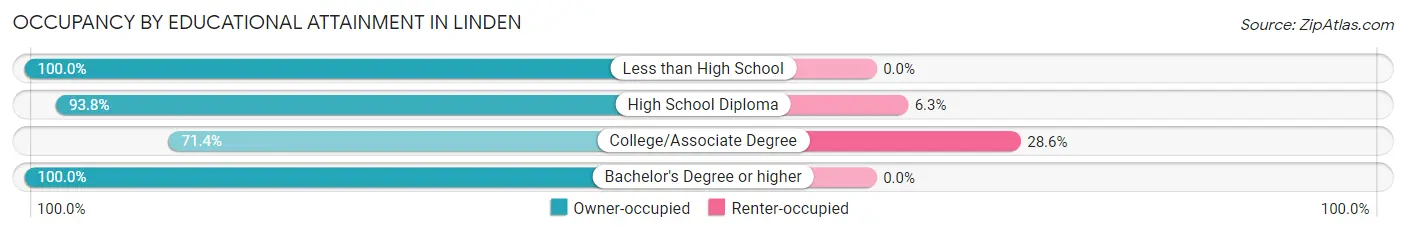
| Household Size | Owner-occupied | Renter-occupied |
| Less than High School | 6 (100.0%) | 0 (0.0%) |
| High School Diploma | 15 (93.8%) | 1 (6.2%) |
| College/Associate Degree | 15 (71.4%) | 6 (28.6%) |
| Bachelor's Degree or higher | 7 (100.0%) | 0 (0.0%) |
Occupancy by Age of Householder in Linden
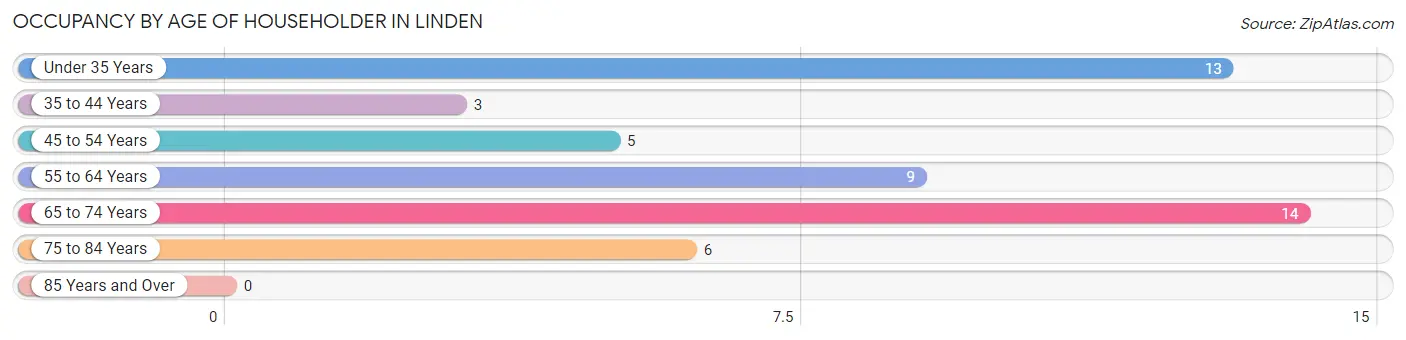
| Age Bracket | # Households | % Households |
| Under 35 Years | 13 | 26.0% |
| 35 to 44 Years | 3 | 6.0% |
| 45 to 54 Years | 5 | 10.0% |
| 55 to 64 Years | 9 | 18.0% |
| 65 to 74 Years | 14 | 28.0% |
| 75 to 84 Years | 6 | 12.0% |
| 85 Years and Over | 0 | 0.0% |
| Total | 50 | 100.0% |
Housing Finances in Linden
Median Income by Occupancy in Linden
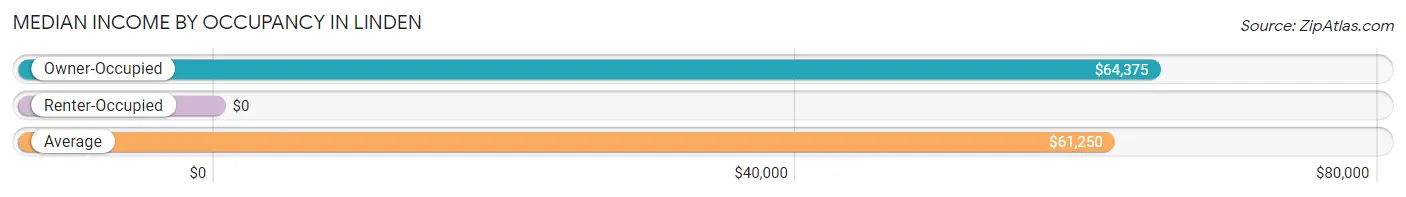
| Occupancy Type | # Households | Median Income |
| Owner-Occupied | 43 (86.0%) | $64,375 |
| Renter-Occupied | 7 (14.0%) | $0 |
| Average | 50 (100.0%) | $61,250 |
Occupancy by Householder Income Bracket in Linden
| Income Bracket | Owner-occupied | Renter-occupied |
| Less than $5,000 | 0 (0.0%) | 2 (28.6%) |
| $5,000 to $9,999 | 0 (0.0%) | 0 (0.0%) |
| $10,000 to $14,999 | 4 (9.3%) | 0 (0.0%) |
| $15,000 to $19,999 | 0 (0.0%) | 1 (14.3%) |
| $20,000 to $24,999 | 2 (4.6%) | 0 (0.0%) |
| $25,000 to $34,999 | 3 (7.0%) | 1 (14.3%) |
| $35,000 to $49,999 | 5 (11.6%) | 0 (0.0%) |
| $50,000 to $74,999 | 12 (27.9%) | 3 (42.9%) |
| $75,000 to $99,999 | 8 (18.6%) | 0 (0.0%) |
| $100,000 to $149,999 | 7 (16.3%) | 0 (0.0%) |
| $150,000 or more | 2 (4.6%) | 0 (0.0%) |
| Total | 43 (100.0%) | 7 (100.0%) |
Monthly Housing Cost Tiers in Linden
| Monthly Cost | Owner-occupied | Renter-occupied |
| Less than $300 | 3 (7.0%) | 0 (0.0%) |
| $300 to $499 | 6 (14.0%) | 0 (0.0%) |
| $500 to $799 | 15 (34.9%) | 3 (42.9%) |
| $800 to $999 | 5 (11.6%) | 3 (42.9%) |
| $1,000 to $1,499 | 11 (25.6%) | 1 (14.3%) |
| $1,500 to $1,999 | 0 (0.0%) | 0 (0.0%) |
| $2,000 to $2,499 | 2 (4.6%) | 0 (0.0%) |
| $2,500 to $2,999 | 1 (2.3%) | 0 (0.0%) |
| $3,000 or more | 0 (0.0%) | 0 (0.0%) |
| Total | 43 (100.0%) | 7 (100.0%) |
Physical Housing Characteristics in Linden
Housing Structures in Linden
| Structure Type | # Housing Units | % Housing Units |
| Single Unit, Detached | 43 | 86.0% |
| Single Unit, Attached | 0 | 0.0% |
| 2 Unit Apartments | 1 | 2.0% |
| 3 or 4 Unit Apartments | 0 | 0.0% |
| 5 to 9 Unit Apartments | 0 | 0.0% |
| 10 or more Apartments | 0 | 0.0% |
| Mobile Home / Other | 6 | 12.0% |
| Total | 50 | 100.0% |
Housing Structures by Occupancy in Linden
| Structure Type | Owner-occupied | Renter-occupied |
| Single Unit, Detached | 37 (86.1%) | 6 (14.0%) |
| Single Unit, Attached | 0 (0.0%) | 0 (0.0%) |
| 2 Unit Apartments | 0 (0.0%) | 1 (100.0%) |
| 3 or 4 Unit Apartments | 0 (0.0%) | 0 (0.0%) |
| 5 to 9 Unit Apartments | 0 (0.0%) | 0 (0.0%) |
| 10 or more Apartments | 0 (0.0%) | 0 (0.0%) |
| Mobile Home / Other | 6 (100.0%) | 0 (0.0%) |
| Total | 43 (86.0%) | 7 (14.0%) |
Housing Structures by Number of Rooms in Linden
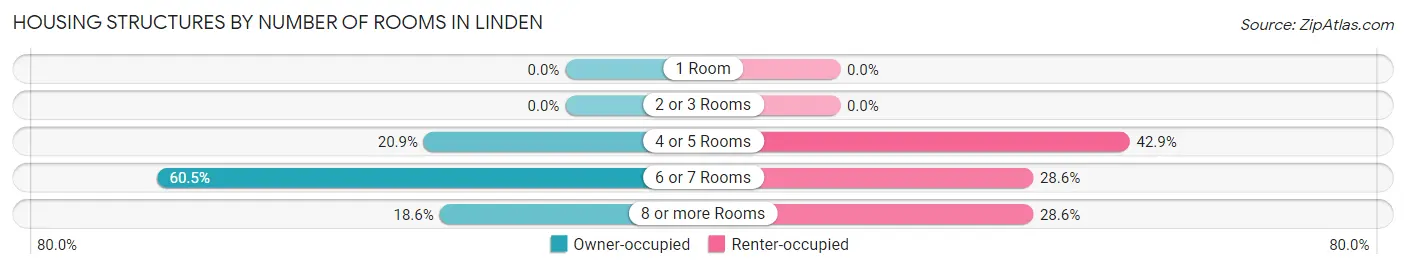
| Number of Rooms | Owner-occupied | Renter-occupied |
| 1 Room | 0 (0.0%) | 0 (0.0%) |
| 2 or 3 Rooms | 0 (0.0%) | 0 (0.0%) |
| 4 or 5 Rooms | 9 (20.9%) | 3 (42.9%) |
| 6 or 7 Rooms | 26 (60.5%) | 2 (28.6%) |
| 8 or more Rooms | 8 (18.6%) | 2 (28.6%) |
| Total | 43 (100.0%) | 7 (100.0%) |
Housing Structure by Heating Type in Linden
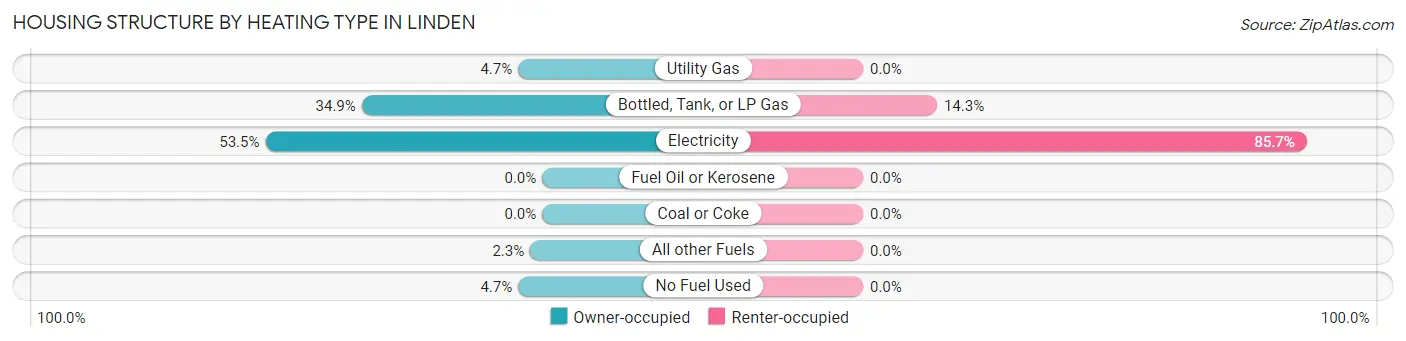
| Heating Type | Owner-occupied | Renter-occupied |
| Utility Gas | 2 (4.6%) | 0 (0.0%) |
| Bottled, Tank, or LP Gas | 15 (34.9%) | 1 (14.3%) |
| Electricity | 23 (53.5%) | 6 (85.7%) |
| Fuel Oil or Kerosene | 0 (0.0%) | 0 (0.0%) |
| Coal or Coke | 0 (0.0%) | 0 (0.0%) |
| All other Fuels | 1 (2.3%) | 0 (0.0%) |
| No Fuel Used | 2 (4.6%) | 0 (0.0%) |
| Total | 43 (100.0%) | 7 (100.0%) |
Household Vehicle Usage in Linden
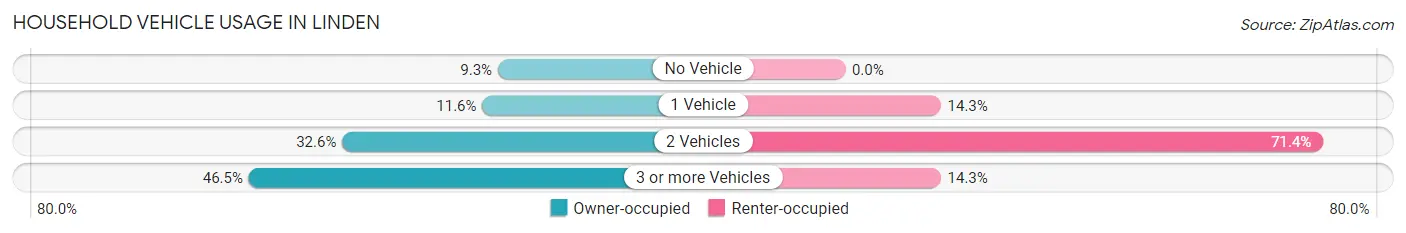
| Vehicles per Household | Owner-occupied | Renter-occupied |
| No Vehicle | 4 (9.3%) | 0 (0.0%) |
| 1 Vehicle | 5 (11.6%) | 1 (14.3%) |
| 2 Vehicles | 14 (32.6%) | 5 (71.4%) |
| 3 or more Vehicles | 20 (46.5%) | 1 (14.3%) |
| Total | 43 (100.0%) | 7 (100.0%) |
Real Estate & Mortgages in Linden
Real Estate and Mortgage Overview in Linden
| Characteristic | Without Mortgage | With Mortgage |
| Housing Units | 25 | 18 |
| Median Property Value | $112,500 | $141,700 |
| Median Household Income | $42,083 | $2 |
| Monthly Housing Costs | $630 | $0 |
| Real Estate Taxes | $1,429 | $0 |
Property Value by Mortgage Status in Linden
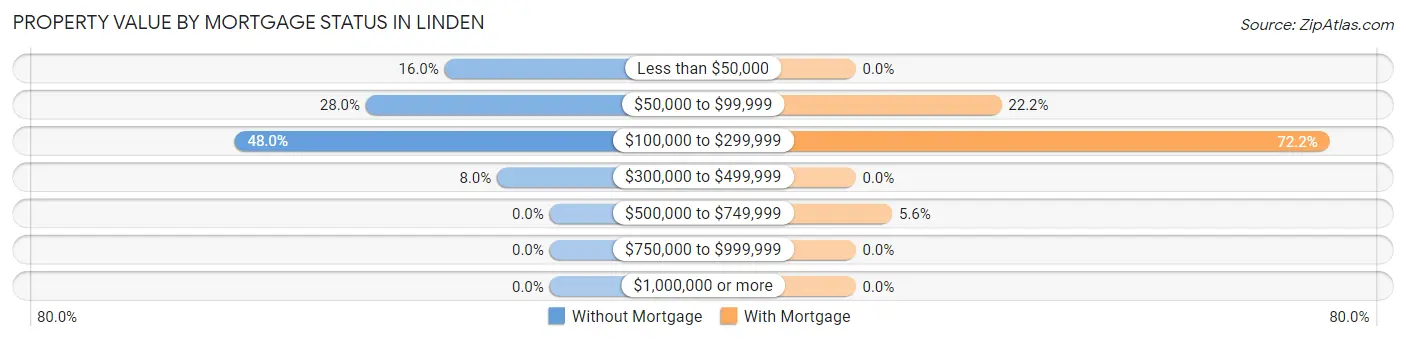
| Property Value | Without Mortgage | With Mortgage |
| Less than $50,000 | 4 (16.0%) | 0 (0.0%) |
| $50,000 to $99,999 | 7 (28.0%) | 4 (22.2%) |
| $100,000 to $299,999 | 12 (48.0%) | 13 (72.2%) |
| $300,000 to $499,999 | 2 (8.0%) | 0 (0.0%) |
| $500,000 to $749,999 | 0 (0.0%) | 1 (5.6%) |
| $750,000 to $999,999 | 0 (0.0%) | 0 (0.0%) |
| $1,000,000 or more | 0 (0.0%) | 0 (0.0%) |
| Total | 25 (100.0%) | 18 (100.0%) |
Household Income by Mortgage Status in Linden
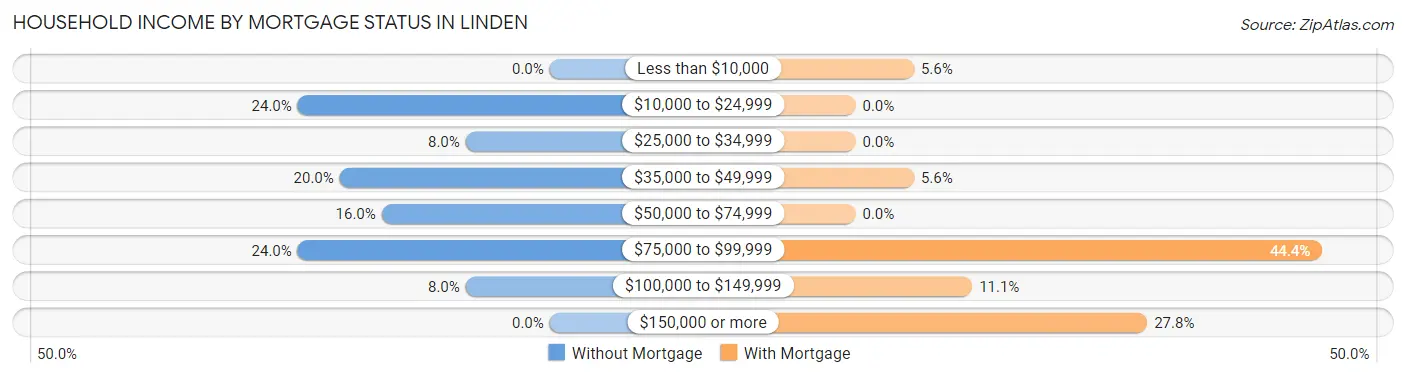
| Household Income | Without Mortgage | With Mortgage |
| Less than $10,000 | 0 (0.0%) | 1 (5.6%) |
| $10,000 to $24,999 | 6 (24.0%) | 0 (0.0%) |
| $25,000 to $34,999 | 2 (8.0%) | 0 (0.0%) |
| $35,000 to $49,999 | 5 (20.0%) | 1 (5.6%) |
| $50,000 to $74,999 | 4 (16.0%) | 0 (0.0%) |
| $75,000 to $99,999 | 6 (24.0%) | 8 (44.4%) |
| $100,000 to $149,999 | 2 (8.0%) | 2 (11.1%) |
| $150,000 or more | 0 (0.0%) | 5 (27.8%) |
| Total | 25 (100.0%) | 18 (100.0%) |
Property Value to Household Income Ratio in Linden
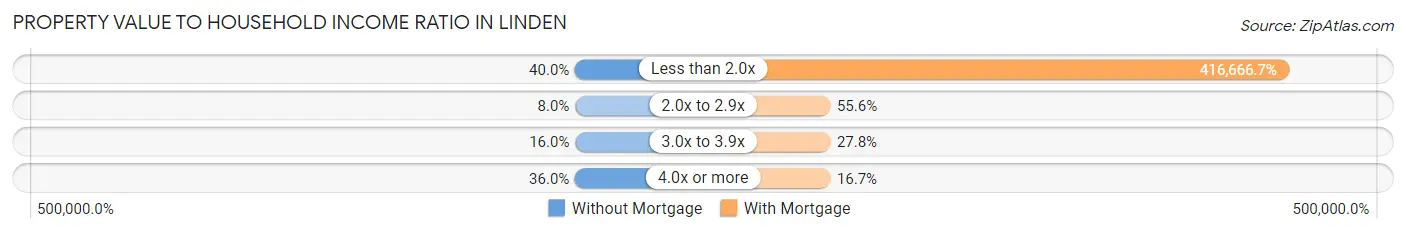
| Value-to-Income Ratio | Without Mortgage | With Mortgage |
| Less than 2.0x | 10 (40.0%) | 75,000 (416,666.7%) |
| 2.0x to 2.9x | 2 (8.0%) | 10 (55.6%) |
| 3.0x to 3.9x | 4 (16.0%) | 5 (27.8%) |
| 4.0x or more | 9 (36.0%) | 3 (16.7%) |
| Total | 25 (100.0%) | 18 (100.0%) |
Real Estate Taxes by Mortgage Status in Linden
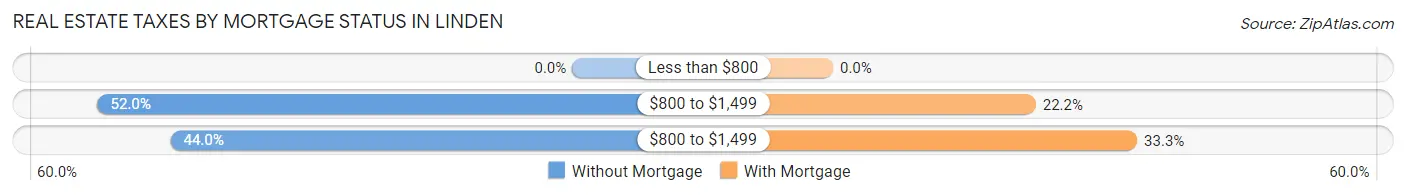
| Property Taxes | Without Mortgage | With Mortgage |
| Less than $800 | 0 (0.0%) | 0 (0.0%) |
| $800 to $1,499 | 13 (52.0%) | 4 (22.2%) |
| $800 to $1,499 | 11 (44.0%) | 6 (33.3%) |
| Total | 25 (100.0%) | 18 (100.0%) |
Health & Disability in Linden
Health Insurance Coverage by Age in Linden
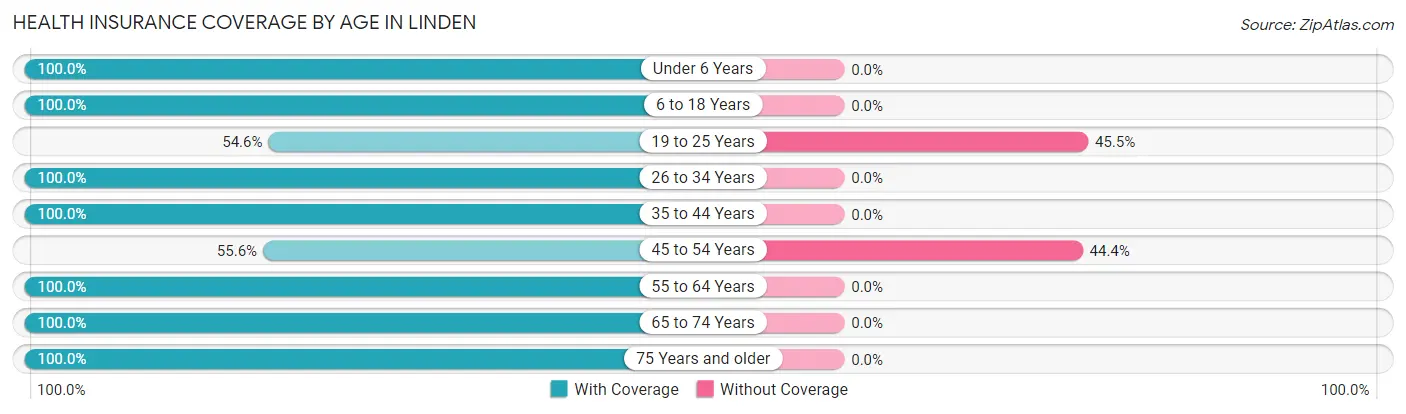
| Age Bracket | With Coverage | Without Coverage |
| Under 6 Years | 11 (100.0%) | 0 (0.0%) |
| 6 to 18 Years | 26 (100.0%) | 0 (0.0%) |
| 19 to 25 Years | 6 (54.5%) | 5 (45.5%) |
| 26 to 34 Years | 18 (100.0%) | 0 (0.0%) |
| 35 to 44 Years | 5 (100.0%) | 0 (0.0%) |
| 45 to 54 Years | 5 (55.6%) | 4 (44.4%) |
| 55 to 64 Years | 12 (100.0%) | 0 (0.0%) |
| 65 to 74 Years | 23 (100.0%) | 0 (0.0%) |
| 75 Years and older | 9 (100.0%) | 0 (0.0%) |
| Total | 115 (92.7%) | 9 (7.3%) |
Health Insurance Coverage by Citizenship Status in Linden
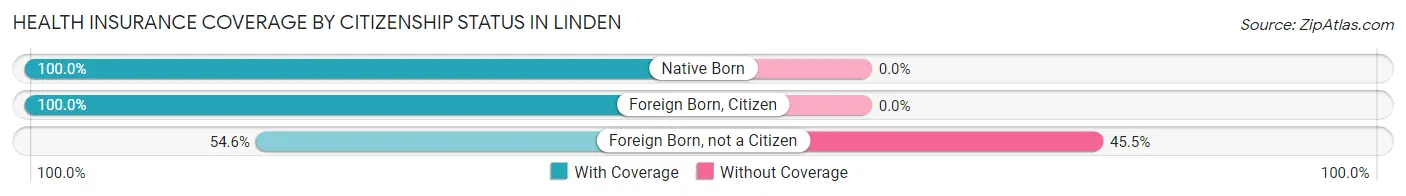
| Citizenship Status | With Coverage | Without Coverage |
| Native Born | 11 (100.0%) | 0 (0.0%) |
| Foreign Born, Citizen | 26 (100.0%) | 0 (0.0%) |
| Foreign Born, not a Citizen | 6 (54.5%) | 5 (45.5%) |
Health Insurance Coverage by Household Income in Linden
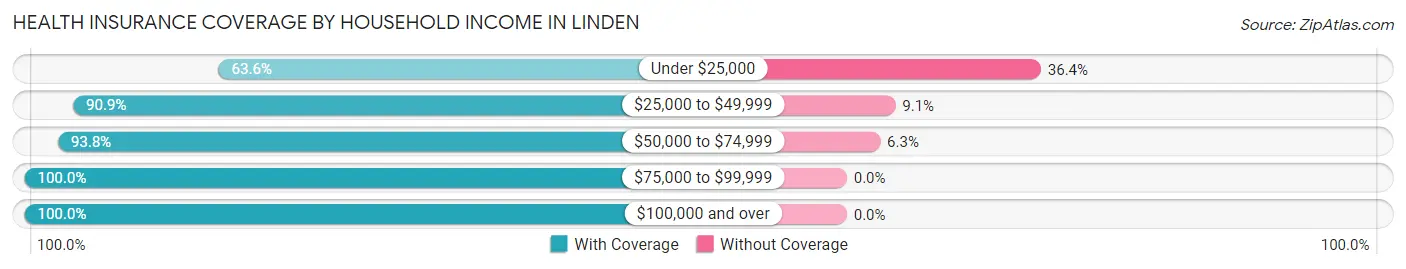
| Household Income | With Coverage | Without Coverage |
| Under $25,000 | 7 (63.6%) | 4 (36.4%) |
| $25,000 to $49,999 | 30 (90.9%) | 3 (9.1%) |
| $50,000 to $74,999 | 30 (93.8%) | 2 (6.2%) |
| $75,000 to $99,999 | 24 (100.0%) | 0 (0.0%) |
| $100,000 and over | 24 (100.0%) | 0 (0.0%) |
Public vs Private Health Insurance Coverage by Age in Linden
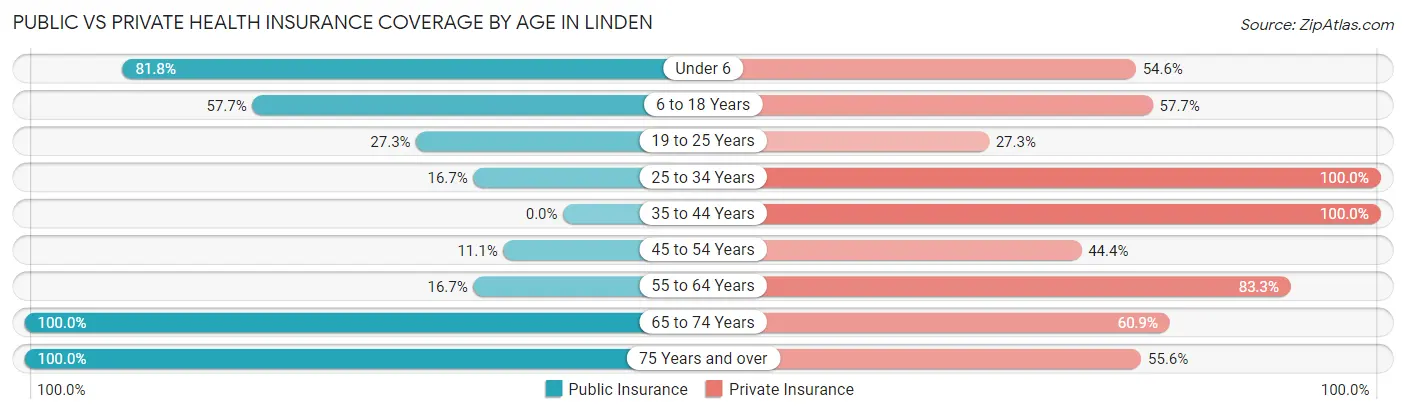
| Age Bracket | Public Insurance | Private Insurance |
| Under 6 | 9 (81.8%) | 6 (54.5%) |
| 6 to 18 Years | 15 (57.7%) | 15 (57.7%) |
| 19 to 25 Years | 3 (27.3%) | 3 (27.3%) |
| 25 to 34 Years | 3 (16.7%) | 18 (100.0%) |
| 35 to 44 Years | 0 (0.0%) | 5 (100.0%) |
| 45 to 54 Years | 1 (11.1%) | 4 (44.4%) |
| 55 to 64 Years | 2 (16.7%) | 10 (83.3%) |
| 65 to 74 Years | 23 (100.0%) | 14 (60.9%) |
| 75 Years and over | 9 (100.0%) | 5 (55.6%) |
| Total | 65 (52.4%) | 80 (64.5%) |
Disability Status by Sex by Age in Linden
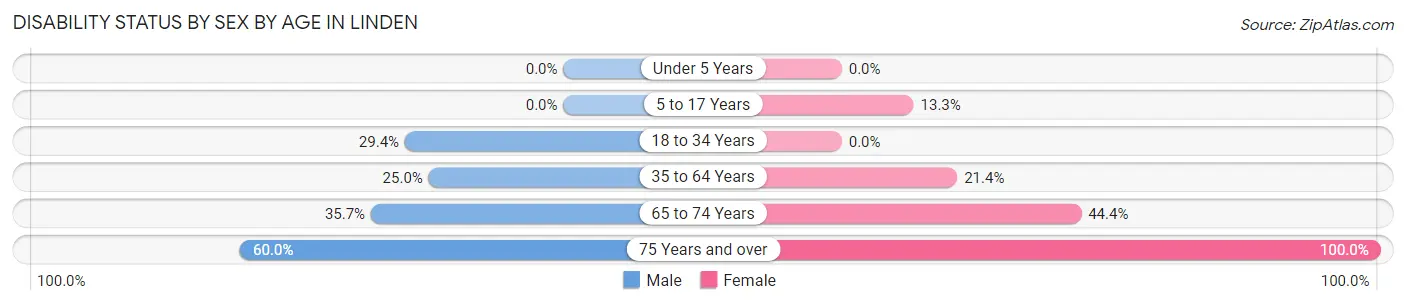
| Age Bracket | Male | Female |
| Under 5 Years | 0 (0.0%) | 0 (0.0%) |
| 5 to 17 Years | 0 (0.0%) | 2 (13.3%) |
| 18 to 34 Years | 5 (29.4%) | 0 (0.0%) |
| 35 to 64 Years | 3 (25.0%) | 3 (21.4%) |
| 65 to 74 Years | 5 (35.7%) | 4 (44.4%) |
| 75 Years and over | 3 (60.0%) | 4 (100.0%) |
Disability Class by Sex by Age in Linden
Disability Class: Hearing Difficulty
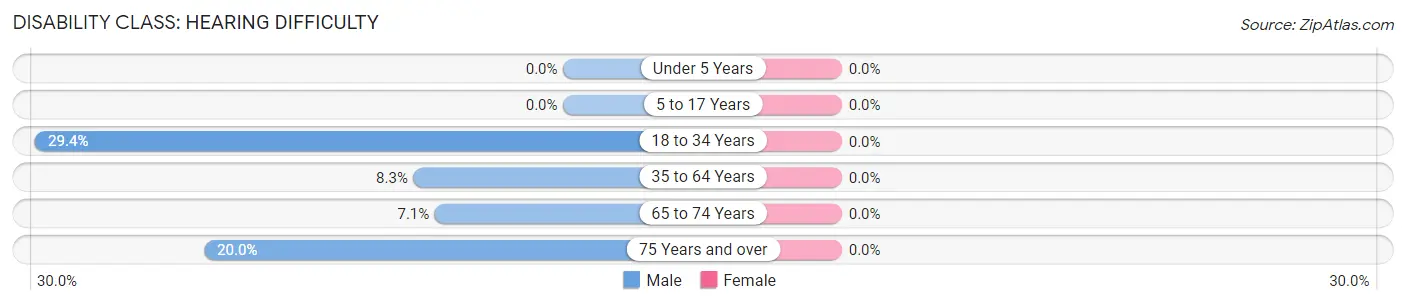
| Age Bracket | Male | Female |
| Under 5 Years | 0 (0.0%) | 0 (0.0%) |
| 5 to 17 Years | 0 (0.0%) | 0 (0.0%) |
| 18 to 34 Years | 5 (29.4%) | 0 (0.0%) |
| 35 to 64 Years | 1 (8.3%) | 0 (0.0%) |
| 65 to 74 Years | 1 (7.1%) | 0 (0.0%) |
| 75 Years and over | 1 (20.0%) | 0 (0.0%) |
Disability Class: Vision Difficulty
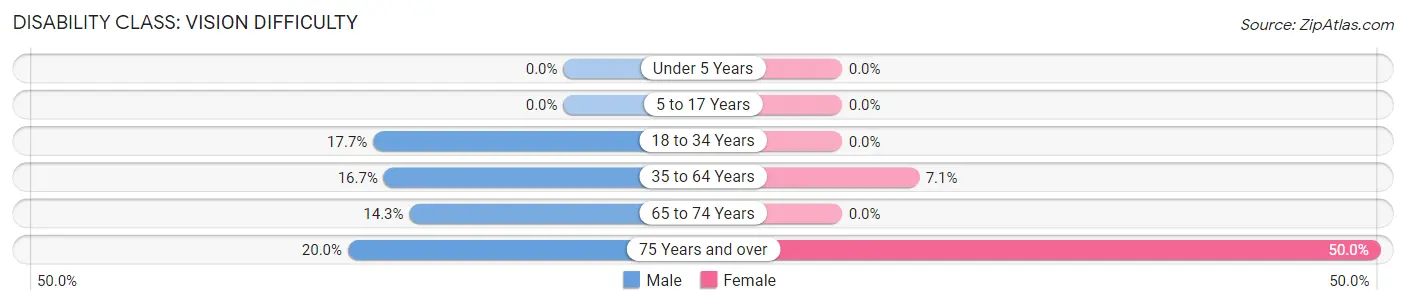
| Age Bracket | Male | Female |
| Under 5 Years | 0 (0.0%) | 0 (0.0%) |
| 5 to 17 Years | 0 (0.0%) | 0 (0.0%) |
| 18 to 34 Years | 3 (17.6%) | 0 (0.0%) |
| 35 to 64 Years | 2 (16.7%) | 1 (7.1%) |
| 65 to 74 Years | 2 (14.3%) | 0 (0.0%) |
| 75 Years and over | 1 (20.0%) | 2 (50.0%) |
Disability Class: Cognitive Difficulty
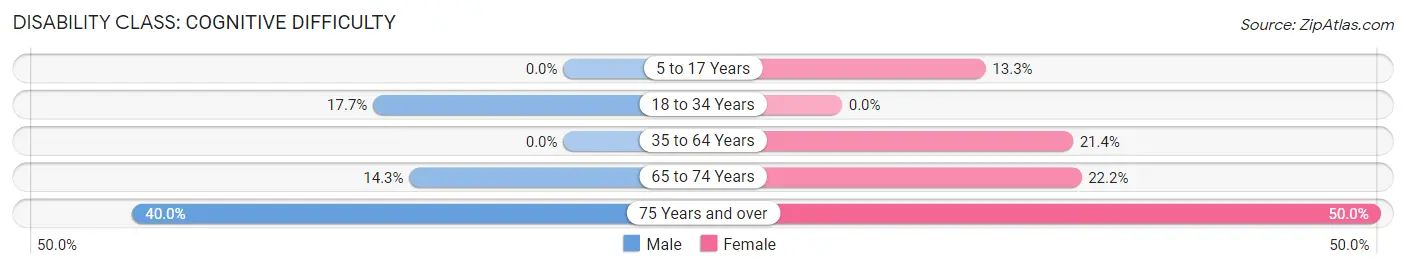
| Age Bracket | Male | Female |
| 5 to 17 Years | 0 (0.0%) | 2 (13.3%) |
| 18 to 34 Years | 3 (17.6%) | 0 (0.0%) |
| 35 to 64 Years | 0 (0.0%) | 3 (21.4%) |
| 65 to 74 Years | 2 (14.3%) | 2 (22.2%) |
| 75 Years and over | 2 (40.0%) | 2 (50.0%) |
Disability Class: Ambulatory Difficulty
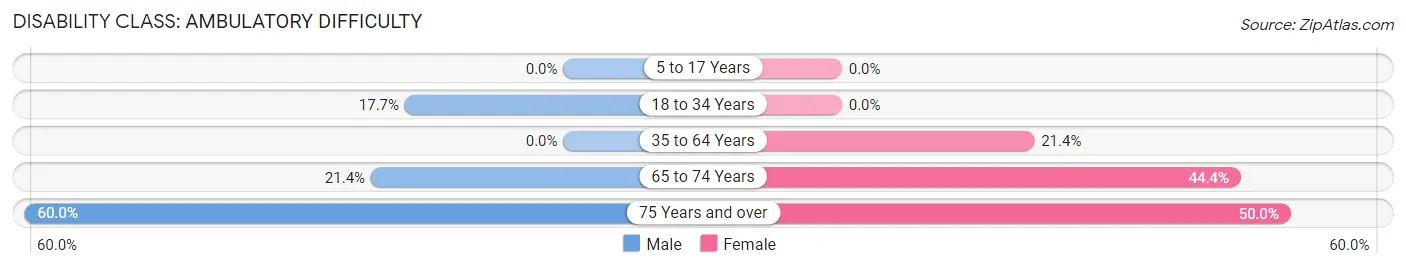
| Age Bracket | Male | Female |
| 5 to 17 Years | 0 (0.0%) | 0 (0.0%) |
| 18 to 34 Years | 3 (17.6%) | 0 (0.0%) |
| 35 to 64 Years | 0 (0.0%) | 3 (21.4%) |
| 65 to 74 Years | 3 (21.4%) | 4 (44.4%) |
| 75 Years and over | 3 (60.0%) | 2 (50.0%) |
Disability Class: Self-Care Difficulty
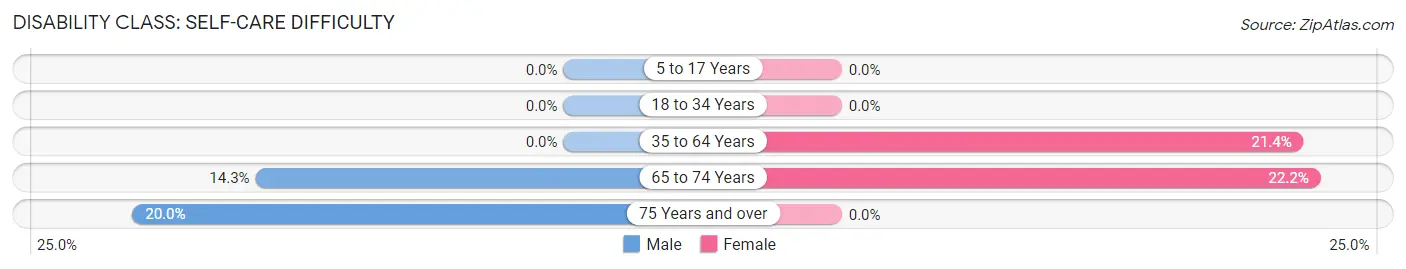
| Age Bracket | Male | Female |
| 5 to 17 Years | 0 (0.0%) | 0 (0.0%) |
| 18 to 34 Years | 0 (0.0%) | 0 (0.0%) |
| 35 to 64 Years | 0 (0.0%) | 3 (21.4%) |
| 65 to 74 Years | 2 (14.3%) | 2 (22.2%) |
| 75 Years and over | 1 (20.0%) | 0 (0.0%) |
Technology Access in Linden
Computing Device Access in Linden
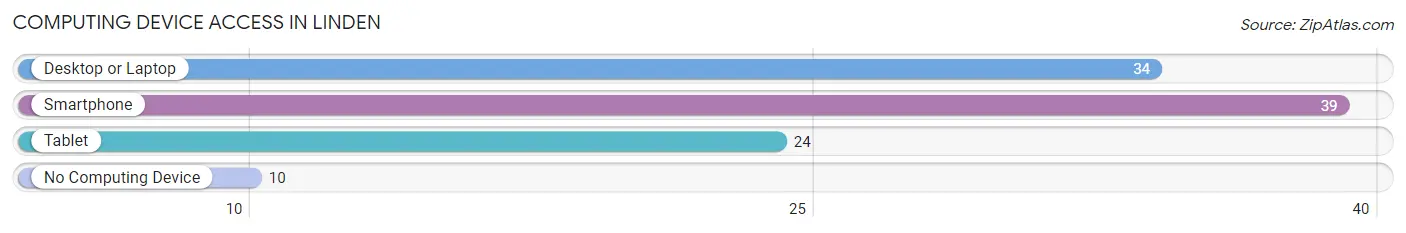
| Device Type | # Households | % Households |
| Desktop or Laptop | 34 | 68.0% |
| Smartphone | 39 | 78.0% |
| Tablet | 24 | 48.0% |
| No Computing Device | 10 | 20.0% |
| Total | 50 | 100.0% |
Internet Access in Linden
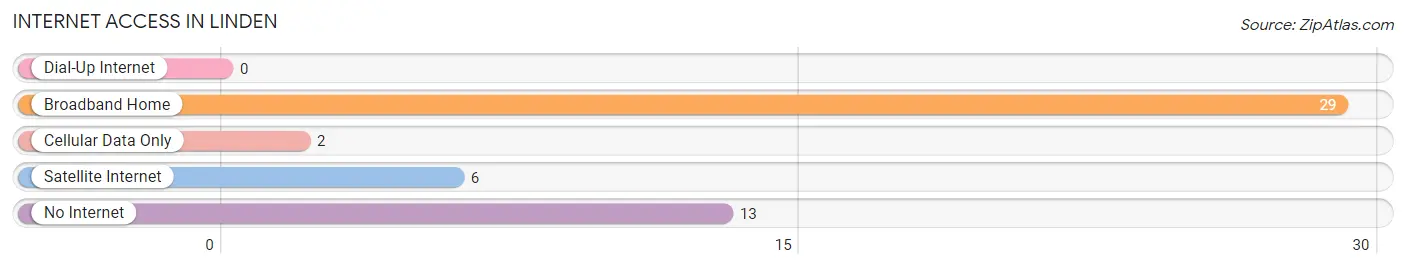
| Internet Type | # Households | % Households |
| Dial-Up Internet | 0 | 0.0% |
| Broadband Home | 29 | 58.0% |
| Cellular Data Only | 2 | 4.0% |
| Satellite Internet | 6 | 12.0% |
| No Internet | 13 | 26.0% |
| Total | 50 | 100.0% |
Linden Summary
Linden, North Carolina is a small town located in Cumberland County, North Carolina. It is situated on the banks of the Cape Fear River, approximately 20 miles south of Fayetteville. The town was founded in 1845 and has a population of approximately 1,500 people.
Geography
Linden is located in the Sandhills region of North Carolina, which is characterized by rolling hills and sandy soils. The town is situated on the banks of the Cape Fear River, which provides a natural boundary between Linden and the neighboring towns of Fayetteville and Hope Mills. The town is also located near the intersection of Interstate 95 and US Highway 401, providing easy access to the larger cities of Raleigh and Charlotte.
Climate
Linden has a humid subtropical climate, with hot, humid summers and mild winters. The average annual temperature is around 70 degrees Fahrenheit, with temperatures reaching as high as 95 degrees in the summer months and as low as 25 degrees in the winter months. The town receives an average of 48 inches of precipitation per year, with most of it falling in the form of rain.
Demographics
As of the 2010 census, the population of Linden was 1,521. The racial makeup of the town was 79.3% White, 16.2% African American, 0.7% Native American, 0.7% Asian, 0.1% Pacific Islander, and 2.9% from two or more races. The median household income was $35,938, and the median family income was $41,250.
Economy
The economy of Linden is largely based on agriculture and manufacturing. The town is home to several farms, which produce a variety of crops, including corn, soybeans, and cotton. The town is also home to several manufacturing companies, which produce a variety of products, including furniture, textiles, and automotive parts.
In addition to agriculture and manufacturing, Linden is home to several small businesses, including restaurants, retail stores, and service providers. The town is also home to a number of tourist attractions, including the historic Linden Mill, which is listed on the National Register of Historic Places.
Conclusion
Linden, North Carolina is a small town located in Cumberland County, North Carolina. It is situated on the banks of the Cape Fear River, approximately 20 miles south of Fayetteville. The town was founded in 1845 and has a population of approximately 1,500 people. The town has a humid subtropical climate, with hot, humid summers and mild winters. The economy of Linden is largely based on agriculture and manufacturing, and the town is home to several small businesses, including restaurants, retail stores, and service providers.
Common Questions
What is Per Capita Income in Linden?
Per Capita income in Linden is $27,236.
What is the Median Family Income in Linden?
Median Family Income in Linden is $76,250.
What is the Median Household income in Linden?
Median Household Income in Linden is $61,250.
What is Family Income Deficit in Linden?
Family Income Deficit in Linden is $10,520.
Families that are below poverty line in Linden earn $10,520 less on average than the poverty threshold level.
What is Inequality or Gini Index in Linden?
Inequality or Gini Index in Linden is 0.36.
What is the Total Population of Linden?
Total Population of Linden is 126.
What is the Total Male Population of Linden?
Total Male Population of Linden is 62.
What is the Total Female Population of Linden?
Total Female Population of Linden is 64.
What is the Ratio of Males per 100 Females in Linden?
There are 96.88 Males per 100 Females in Linden.
What is the Ratio of Females per 100 Males in Linden?
There are 103.23 Females per 100 Males in Linden.
What is the Median Population Age in Linden?
Median Population Age in Linden is 32.4 Years.
What is the Average Family Size in Linden
Average Family Size in Linden is 3.5 People.
What is the Average Household Size in Linden
Average Household Size in Linden is 2.5 People.
How Large is the Labor Force in Linden?
There are 50 People in the Labor Forcein in Linden.
What is the Percentage of People in the Labor Force in Linden?
54.9% of People are in the Labor Force in Linden.
What is the Unemployment Rate in Linden?
Unemployment Rate in Linden is 6.3%.