Lilesville, NC Map & Demographics
Lilesville Map
Lilesville Overview
$21,075
PER CAPITA INCOME
$60,962
AVG FAMILY INCOME
$51,538
AVG HOUSEHOLD INCOME
58.7%
WAGE / INCOME GAP [ % ]
41.3¢/ $1
WAGE / INCOME GAP [ $ ]
$7,723
FAMILY INCOME DEFICIT
0.42
INEQUALITY / GINI INDEX
779
TOTAL POPULATION
414
MALE POPULATION
365
FEMALE POPULATION
113.42
MALES / 100 FEMALES
88.16
FEMALES / 100 MALES
39.3
MEDIAN AGE
3.8
AVG FAMILY SIZE
2.8
AVG HOUSEHOLD SIZE
276
LABOR FORCE [ PEOPLE ]
46.4%
PERCENT IN LABOR FORCE
10.5%
UNEMPLOYMENT RATE
Lilesville Zip Codes
Lilesville Area Codes
Income in Lilesville
Income Overview in Lilesville
Per Capita Income in Lilesville is $21,075, while median incomes of families and households are $60,962 and $51,538 respectively.
| Characteristic | Number | Measure |
| Per Capita Income | 779 | $21,075 |
| Median Family Income | 178 | $60,962 |
| Mean Family Income | 178 | $70,507 |
| Median Household Income | 276 | $51,538 |
| Mean Household Income | 276 | $54,849 |
| Income Deficit | 178 | $7,723 |
| Wage / Income Gap (%) | 779 | 58.67% |
| Wage / Income Gap ($) | 779 | 41.33¢ per $1 |
| Gini / Inequality Index | 779 | 0.42 |
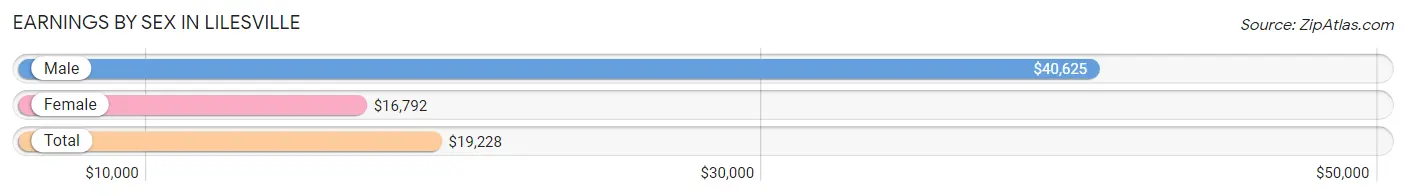
Earnings by Sex in Lilesville
Average Earnings in Lilesville are $19,228, $40,625 for men and $16,792 for women, a difference of 58.7%.
| Sex | Number | Average Earnings |
| Male | 95 (31.4%) | $40,625 |
| Female | 208 (68.6%) | $16,792 |
| Total | 303 (100.0%) | $19,228 |
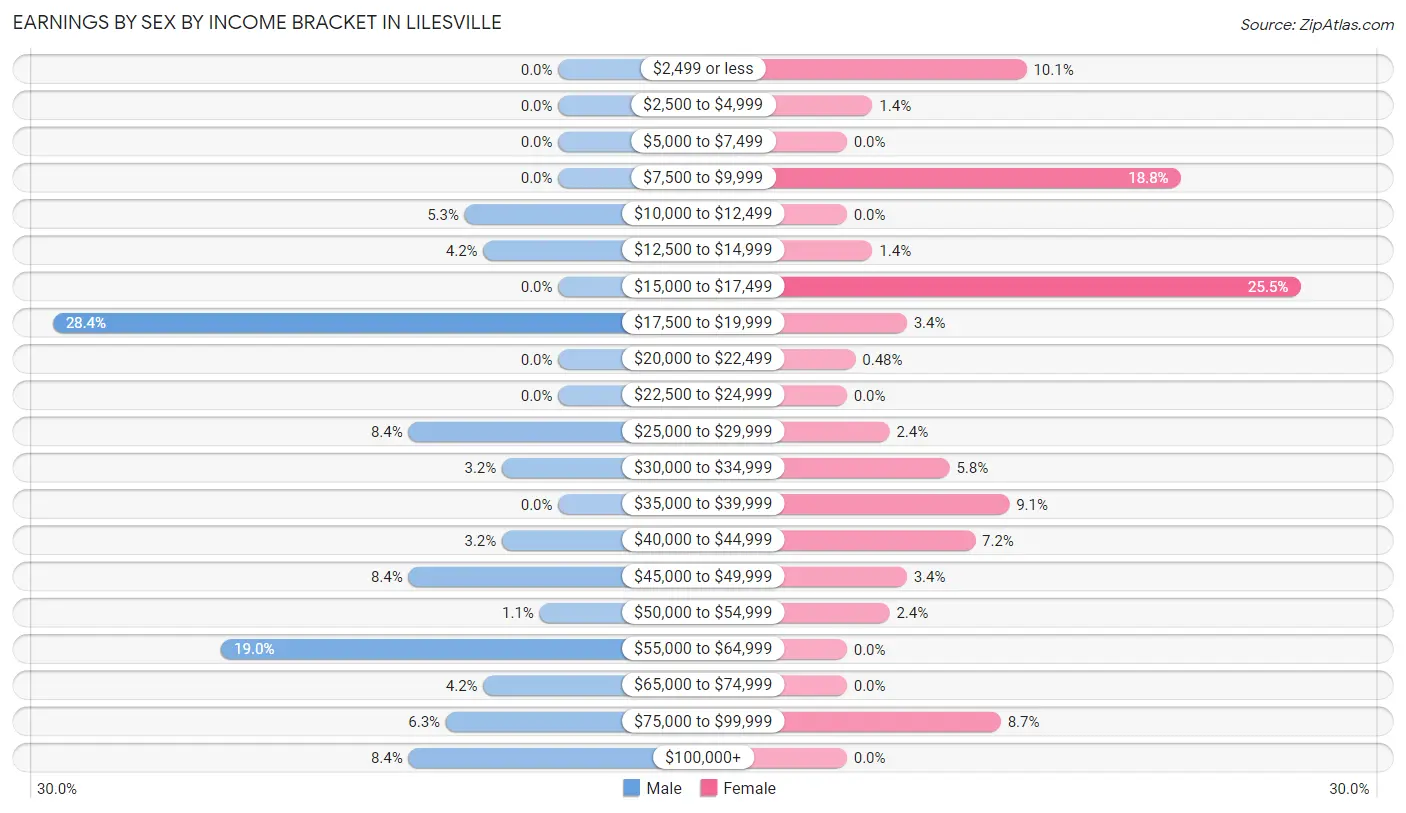
Earnings by Sex by Income Bracket in Lilesville
The most common earnings brackets in Lilesville are $17,500 to $19,999 for men (27 | 28.4%) and $15,000 to $17,499 for women (53 | 25.5%).
| Income | Male | Female |
| $2,499 or less | 0 (0.0%) | 21 (10.1%) |
| $2,500 to $4,999 | 0 (0.0%) | 3 (1.4%) |
| $5,000 to $7,499 | 0 (0.0%) | 0 (0.0%) |
| $7,500 to $9,999 | 0 (0.0%) | 39 (18.8%) |
| $10,000 to $12,499 | 5 (5.3%) | 0 (0.0%) |
| $12,500 to $14,999 | 4 (4.2%) | 3 (1.4%) |
| $15,000 to $17,499 | 0 (0.0%) | 53 (25.5%) |
| $17,500 to $19,999 | 27 (28.4%) | 7 (3.4%) |
| $20,000 to $22,499 | 0 (0.0%) | 1 (0.5%) |
| $22,500 to $24,999 | 0 (0.0%) | 0 (0.0%) |
| $25,000 to $29,999 | 8 (8.4%) | 5 (2.4%) |
| $30,000 to $34,999 | 3 (3.2%) | 12 (5.8%) |
| $35,000 to $39,999 | 0 (0.0%) | 19 (9.1%) |
| $40,000 to $44,999 | 3 (3.2%) | 15 (7.2%) |
| $45,000 to $49,999 | 8 (8.4%) | 7 (3.4%) |
| $50,000 to $54,999 | 1 (1.1%) | 5 (2.4%) |
| $55,000 to $64,999 | 18 (19.0%) | 0 (0.0%) |
| $65,000 to $74,999 | 4 (4.2%) | 0 (0.0%) |
| $75,000 to $99,999 | 6 (6.3%) | 18 (8.6%) |
| $100,000+ | 8 (8.4%) | 0 (0.0%) |
| Total | 95 (100.0%) | 208 (100.0%) |
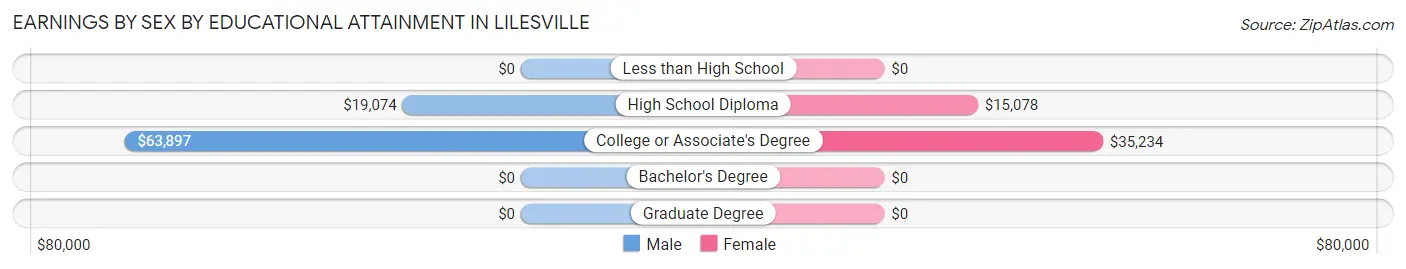
Earnings by Sex by Educational Attainment in Lilesville
Average earnings in Lilesville are $41,250 for men and $32,708 for women, a difference of 20.7%. Men with an educational attainment of college or associate's degree enjoy the highest average annual earnings of $63,897, while those with high school diploma education earn the least with $19,074. Women with an educational attainment of college or associate's degree earn the most with the average annual earnings of $35,234, while those with high school diploma education have the smallest earnings of $15,078.
| Educational Attainment | Male Income | Female Income |
| Less than High School | - | - |
| High School Diploma | $19,074 | $15,078 |
| College or Associate's Degree | $63,897 | $35,234 |
| Bachelor's Degree | - | - |
| Graduate Degree | - | - |
| Total | $41,250 | $32,708 |
Family Income in Lilesville
Family Income Brackets in Lilesville
According to the Lilesville family income data, there are 60 families falling into the $100,000 to $149,999 income range, which is the most common income bracket and makes up 33.7% of all families.
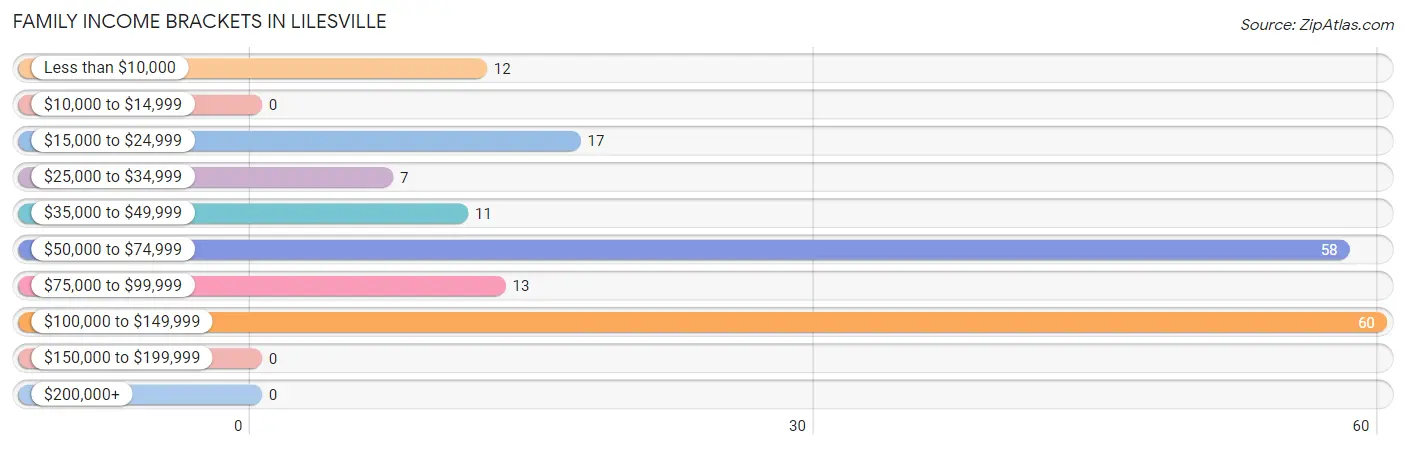
| Income Bracket | # Families | % Families |
| Less than $10,000 | 12 | 6.7% |
| $10,000 to $14,999 | 0 | 0.0% |
| $15,000 to $24,999 | 17 | 9.6% |
| $25,000 to $34,999 | 7 | 3.9% |
| $35,000 to $49,999 | 11 | 6.2% |
| $50,000 to $74,999 | 58 | 32.6% |
| $75,000 to $99,999 | 13 | 7.3% |
| $100,000 to $149,999 | 60 | 33.7% |
| $150,000 to $199,999 | 0 | 0.0% |
| $200,000+ | 0 | 0.0% |
Family Income by Famaliy Size in Lilesville
2-person families (103 | 57.9%) account for the highest median family income in Lilesville with $60,250 per family, while 2-person families (103 | 57.9%) have the highest median income of $30,125 per family member.
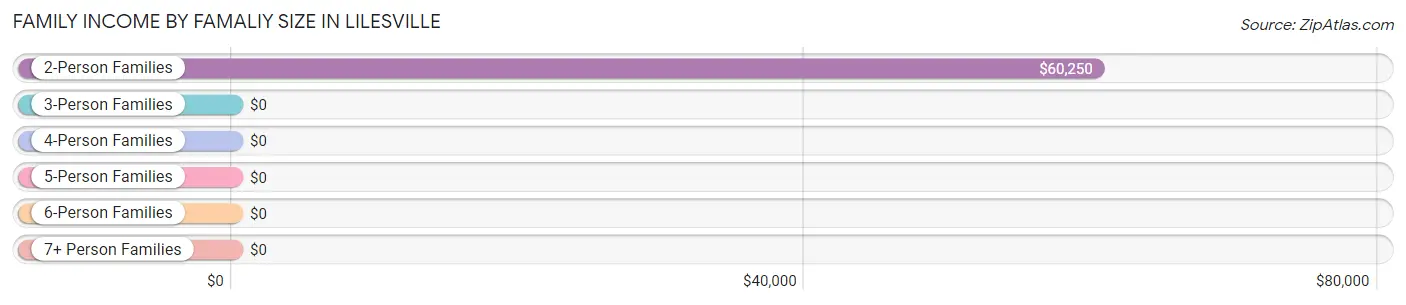
| Income Bracket | # Families | Median Income |
| 2-Person Families | 103 (57.9%) | $60,250 |
| 3-Person Families | 35 (19.7%) | $0 |
| 4-Person Families | 7 (3.9%) | $0 |
| 5-Person Families | 9 (5.1%) | $0 |
| 6-Person Families | 0 (0.0%) | $0 |
| 7+ Person Families | 24 (13.5%) | $0 |
| Total | 178 (100.0%) | $60,962 |
Family Income by Number of Earners in Lilesville
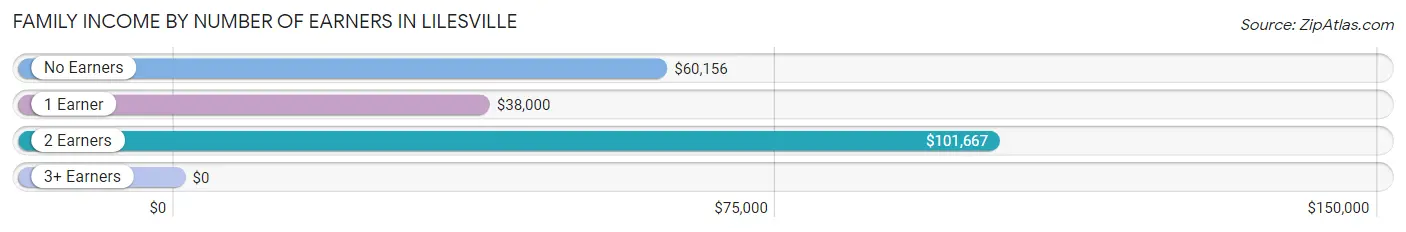
| Number of Earners | # Families | Median Income |
| No Earners | 57 (32.0%) | $60,156 |
| 1 Earner | 52 (29.2%) | $38,000 |
| 2 Earners | 46 (25.8%) | $101,667 |
| 3+ Earners | 23 (12.9%) | $0 |
| Total | 178 (100.0%) | $60,962 |
Household Income in Lilesville
Household Income Brackets in Lilesville
With 68 households falling in the category, the $100,000 to $149,999 income range is the most frequent in Lilesville, accounting for 24.6% of all households.
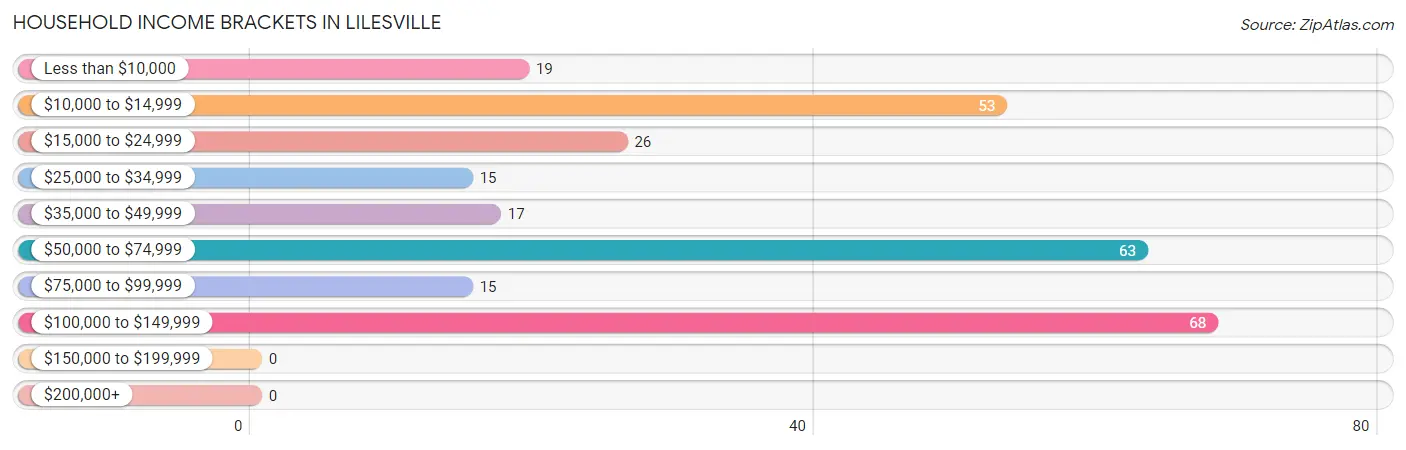
| Income Bracket | # Households | % Households |
| Less than $10,000 | 19 | 6.9% |
| $10,000 to $14,999 | 53 | 19.2% |
| $15,000 to $24,999 | 26 | 9.4% |
| $25,000 to $34,999 | 15 | 5.4% |
| $35,000 to $49,999 | 17 | 6.2% |
| $50,000 to $74,999 | 63 | 22.8% |
| $75,000 to $99,999 | 15 | 5.4% |
| $100,000 to $149,999 | 68 | 24.6% |
| $150,000 to $199,999 | 0 | 0.0% |
| $200,000+ | 0 | 0.0% |
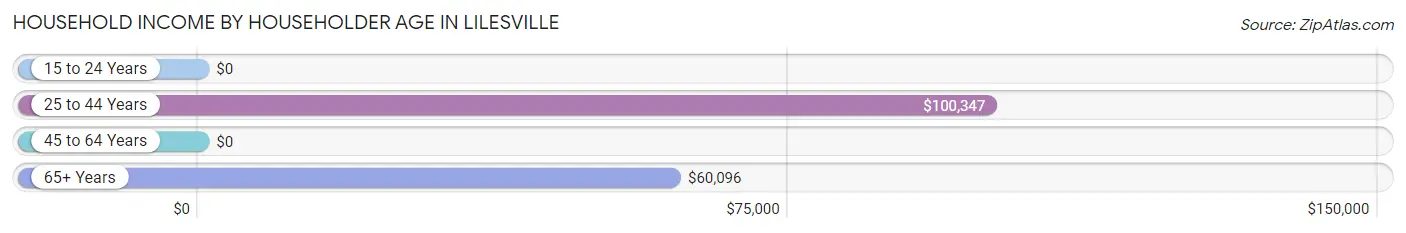
Household Income by Householder Age in Lilesville
The median household income in Lilesville is $51,538, with the highest median household income of $100,347 found in the 25 to 44 years age bracket for the primary householder. A total of 71 households (25.7%) fall into this category. Meanwhile, the 15 to 24 years age bracket for the primary householder has the lowest median household income of $0, with 1 households (0.4%) in this group.
| Income Bracket | # Households | Median Income |
| 15 to 24 Years | 1 (0.4%) | $0 |
| 25 to 44 Years | 71 (25.7%) | $100,347 |
| 45 to 64 Years | 106 (38.4%) | $0 |
| 65+ Years | 98 (35.5%) | $60,096 |
| Total | 276 (100.0%) | $51,538 |
Poverty in Lilesville
Income Below Poverty by Sex and Age in Lilesville
With 30.7% poverty level for males and 16.2% for females among the residents of Lilesville, 12 to 14 year old males and 75 year old and over females are the most vulnerable to poverty, with 21 males (100.0%) and 12 females (63.2%) in their respective age groups living below the poverty level.
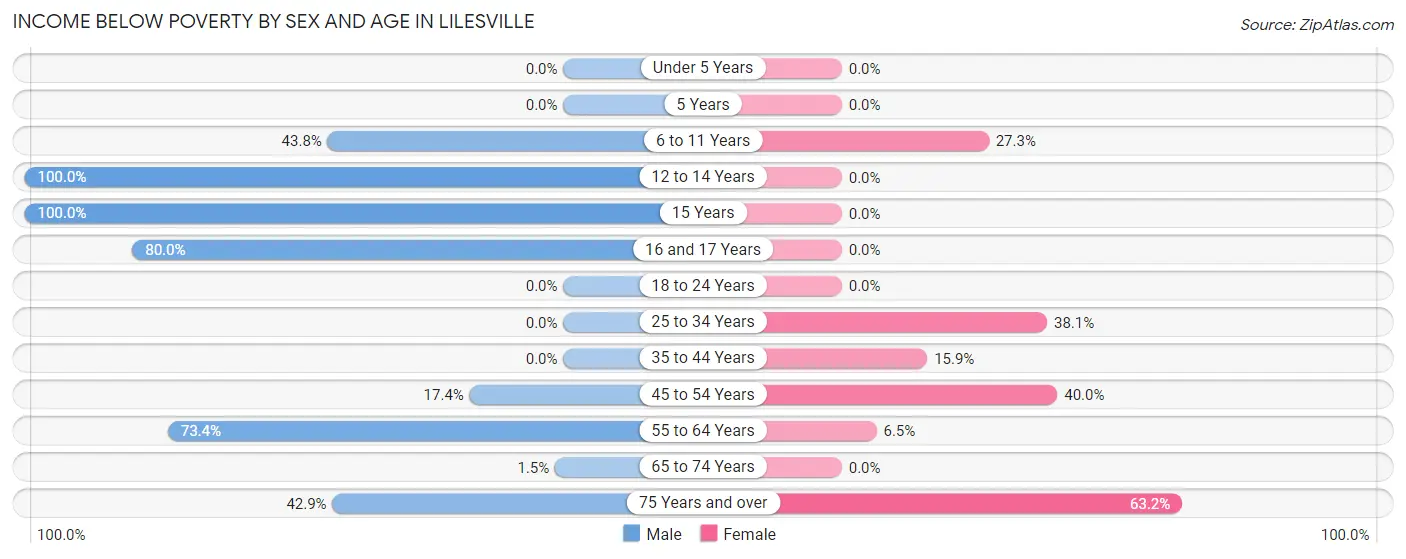
| Age Bracket | Male | Female |
| Under 5 Years | 0 (0.0%) | 0 (0.0%) |
| 5 Years | 0 (0.0%) | 0 (0.0%) |
| 6 to 11 Years | 21 (43.8%) | 6 (27.3%) |
| 12 to 14 Years | 21 (100.0%) | 0 (0.0%) |
| 15 Years | 8 (100.0%) | 0 (0.0%) |
| 16 and 17 Years | 8 (80.0%) | 0 (0.0%) |
| 18 to 24 Years | 0 (0.0%) | 0 (0.0%) |
| 25 to 34 Years | 0 (0.0%) | 16 (38.1%) |
| 35 to 44 Years | 0 (0.0%) | 13 (15.9%) |
| 45 to 54 Years | 4 (17.4%) | 10 (40.0%) |
| 55 to 64 Years | 58 (73.4%) | 2 (6.5%) |
| 65 to 74 Years | 1 (1.5%) | 0 (0.0%) |
| 75 Years and over | 6 (42.9%) | 12 (63.2%) |
| Total | 127 (30.7%) | 59 (16.2%) |
Income Above Poverty by Sex and Age in Lilesville
According to the poverty statistics in Lilesville, males aged under 5 years and females aged under 5 years are the age groups that are most secure financially, with 100.0% of males and 100.0% of females in these age groups living above the poverty line.
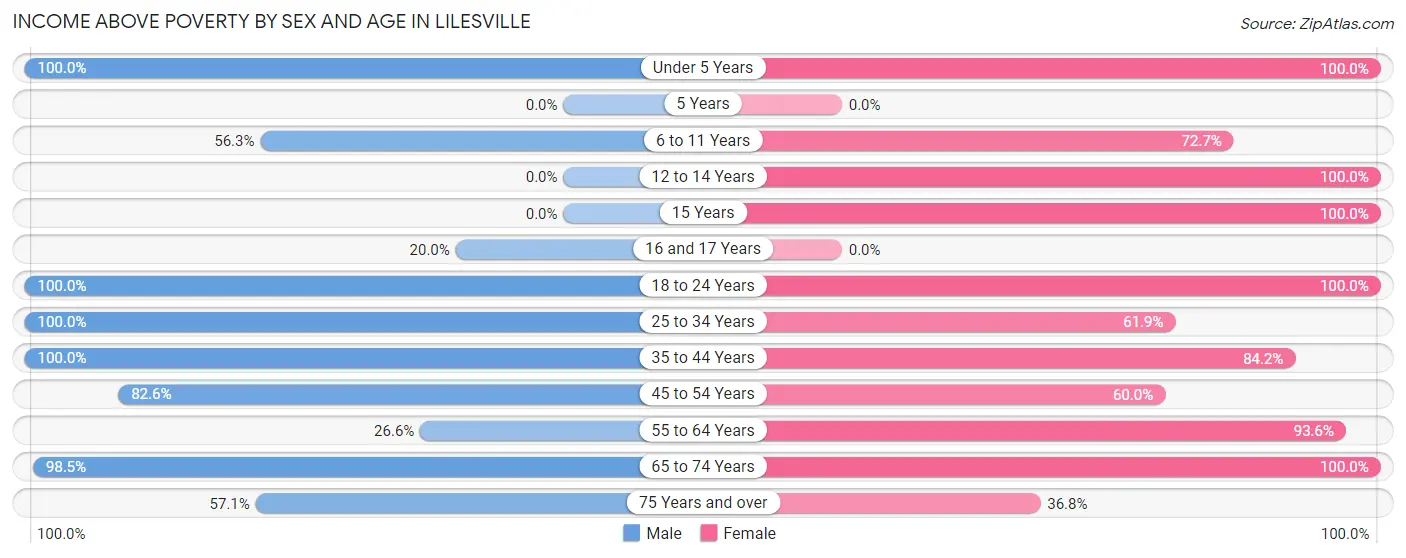
| Age Bracket | Male | Female |
| Under 5 Years | 67 (100.0%) | 3 (100.0%) |
| 5 Years | 0 (0.0%) | 0 (0.0%) |
| 6 to 11 Years | 27 (56.2%) | 16 (72.7%) |
| 12 to 14 Years | 0 (0.0%) | 2 (100.0%) |
| 15 Years | 0 (0.0%) | 13 (100.0%) |
| 16 and 17 Years | 2 (20.0%) | 0 (0.0%) |
| 18 to 24 Years | 1 (100.0%) | 62 (100.0%) |
| 25 to 34 Years | 35 (100.0%) | 26 (61.9%) |
| 35 to 44 Years | 43 (100.0%) | 69 (84.2%) |
| 45 to 54 Years | 19 (82.6%) | 15 (60.0%) |
| 55 to 64 Years | 21 (26.6%) | 29 (93.5%) |
| 65 to 74 Years | 64 (98.5%) | 64 (100.0%) |
| 75 Years and over | 8 (57.1%) | 7 (36.8%) |
| Total | 287 (69.3%) | 306 (83.8%) |
Income Below Poverty Among Married-Couple Families in Lilesville
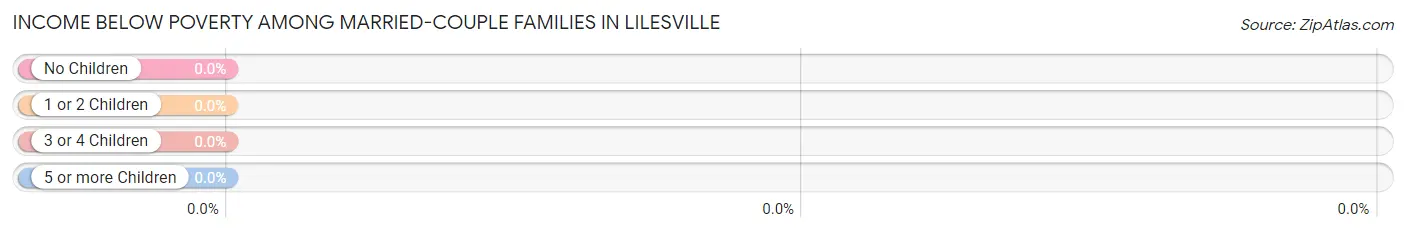
| Children | Above Poverty | Below Poverty |
| No Children | 73 (100.0%) | 0 (0.0%) |
| 1 or 2 Children | 33 (100.0%) | 0 (0.0%) |
| 3 or 4 Children | 0 (0.0%) | 0 (0.0%) |
| 5 or more Children | 3 (100.0%) | 0 (0.0%) |
| Total | 109 (100.0%) | 0 (0.0%) |
Income Below Poverty Among Single-Parent Households in Lilesville
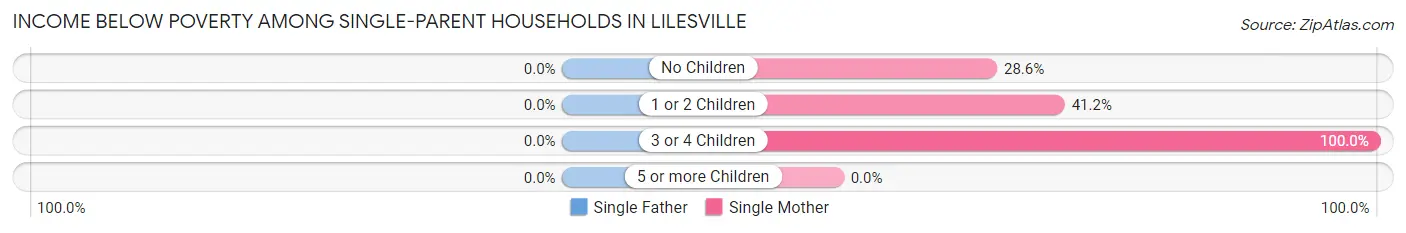
| Children | Single Father | Single Mother |
| No Children | 0 (0.0%) | 12 (28.6%) |
| 1 or 2 Children | 0 (0.0%) | 7 (41.2%) |
| 3 or 4 Children | 0 (0.0%) | 7 (100.0%) |
| 5 or more Children | 0 (0.0%) | 0 (0.0%) |
| Total | 0 (0.0%) | 26 (39.4%) |
Income Below Poverty Among Married-Couple vs Single-Parent Households in Lilesville
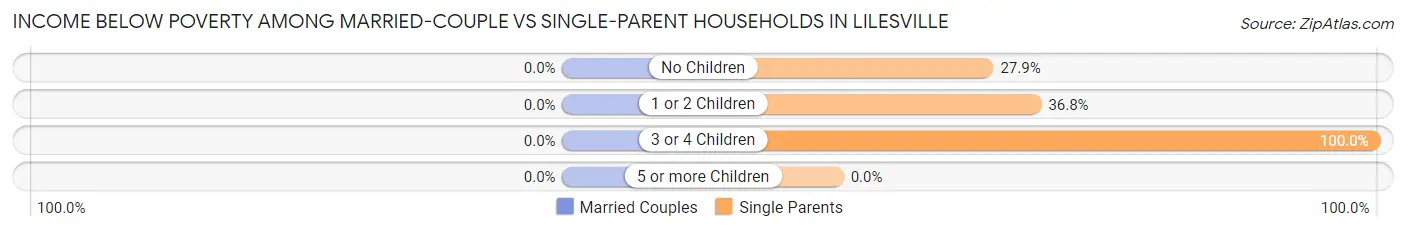
| Children | Married-Couple Families | Single-Parent Households |
| No Children | 0 (0.0%) | 12 (27.9%) |
| 1 or 2 Children | 0 (0.0%) | 7 (36.8%) |
| 3 or 4 Children | 0 (0.0%) | 7 (100.0%) |
| 5 or more Children | 0 (0.0%) | 0 (0.0%) |
| Total | 0 (0.0%) | 26 (37.7%) |
Race in Lilesville
The most populous races in Lilesville are Black / African American (543 | 69.7%), White / Caucasian (215 | 27.6%), and Two or more Races (21 | 2.7%).
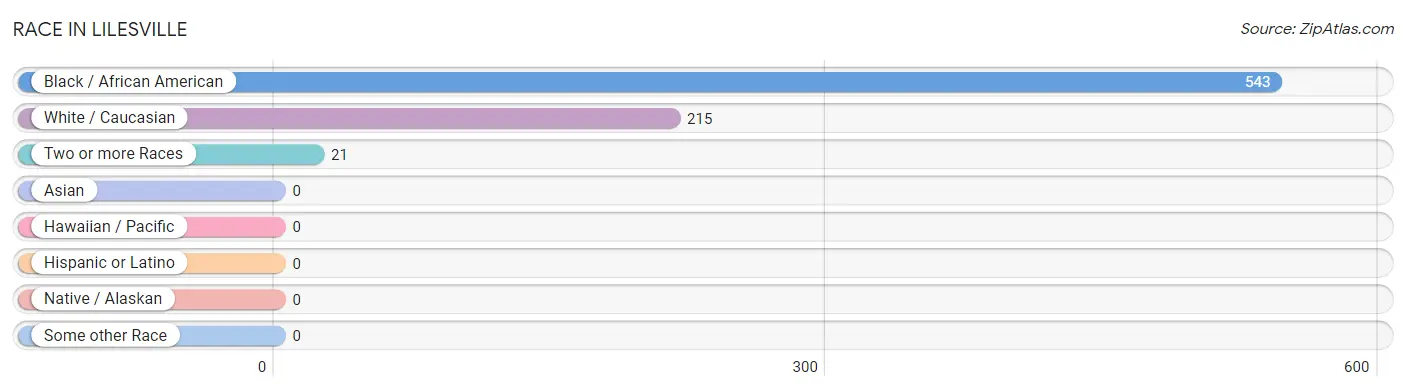
| Race | # Population | % Population |
| Asian | 0 | 0.0% |
| Black / African American | 543 | 69.7% |
| Hawaiian / Pacific | 0 | 0.0% |
| Hispanic or Latino | 0 | 0.0% |
| Native / Alaskan | 0 | 0.0% |
| White / Caucasian | 215 | 27.6% |
| Two or more Races | 21 | 2.7% |
| Some other Race | 0 | 0.0% |
| Total | 779 | 100.0% |
Ancestry in Lilesville
The most populous ancestries reported in Lilesville are English (32 | 4.1%), American (20 | 2.6%), Lumbee (18 | 2.3%), German (12 | 1.5%), and Irish (12 | 1.5%), together accounting for 12.1% of all Lilesville residents.
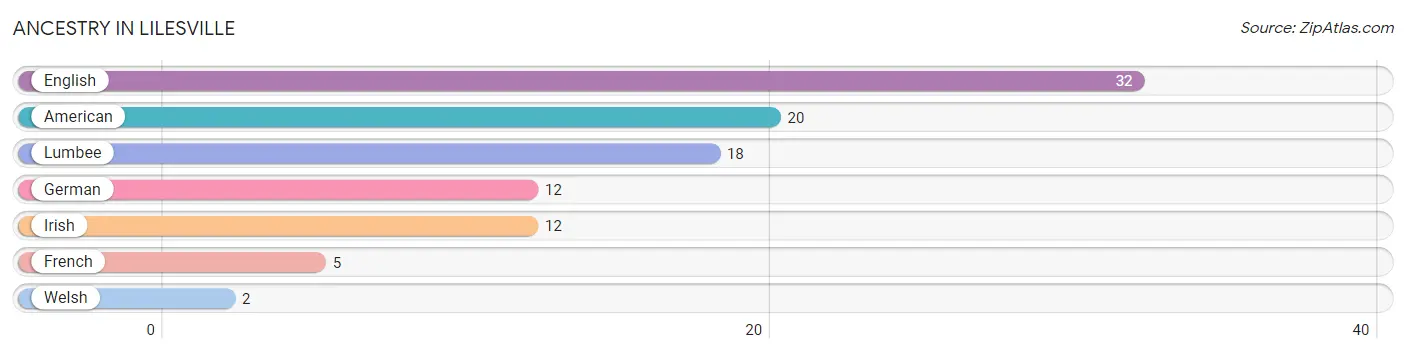
| Ancestry | # Population | % Population |
| American | 20 | 2.6% |
| English | 32 | 4.1% |
| French | 5 | 0.6% |
| German | 12 | 1.5% |
| Irish | 12 | 1.5% |
| Lumbee | 18 | 2.3% |
| Welsh | 2 | 0.3% | View All 7 Rows |
Immigrants in Lilesville

| Immigration Origin | # Population | % Population | View All 0 Rows |
Sex and Age in Lilesville
Sex and Age in Lilesville
The most populous age groups in Lilesville are Under 5 Years (67 | 16.2%) for men and 35 to 39 Years (57 | 15.6%) for women.
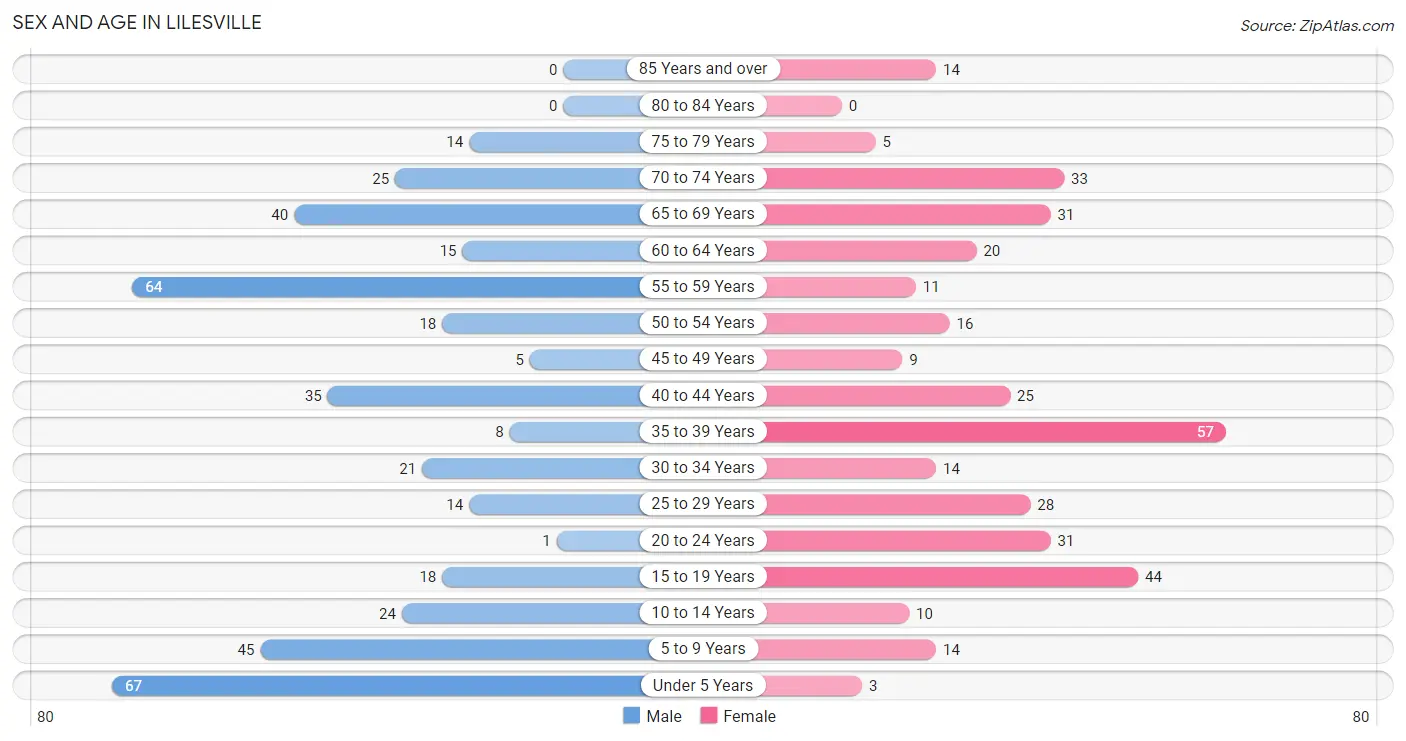
| Age Bracket | Male | Female |
| Under 5 Years | 67 (16.2%) | 3 (0.8%) |
| 5 to 9 Years | 45 (10.9%) | 14 (3.8%) |
| 10 to 14 Years | 24 (5.8%) | 10 (2.7%) |
| 15 to 19 Years | 18 (4.3%) | 44 (12.0%) |
| 20 to 24 Years | 1 (0.2%) | 31 (8.5%) |
| 25 to 29 Years | 14 (3.4%) | 28 (7.7%) |
| 30 to 34 Years | 21 (5.1%) | 14 (3.8%) |
| 35 to 39 Years | 8 (1.9%) | 57 (15.6%) |
| 40 to 44 Years | 35 (8.5%) | 25 (6.9%) |
| 45 to 49 Years | 5 (1.2%) | 9 (2.5%) |
| 50 to 54 Years | 18 (4.3%) | 16 (4.4%) |
| 55 to 59 Years | 64 (15.5%) | 11 (3.0%) |
| 60 to 64 Years | 15 (3.6%) | 20 (5.5%) |
| 65 to 69 Years | 40 (9.7%) | 31 (8.5%) |
| 70 to 74 Years | 25 (6.0%) | 33 (9.0%) |
| 75 to 79 Years | 14 (3.4%) | 5 (1.4%) |
| 80 to 84 Years | 0 (0.0%) | 0 (0.0%) |
| 85 Years and over | 0 (0.0%) | 14 (3.8%) |
| Total | 414 (100.0%) | 365 (100.0%) |
Families and Households in Lilesville
Median Family Size in Lilesville
The median family size in Lilesville is 3.79 persons per family, with single male/father families (3 | 1.7%) accounting for the largest median family size of 4 persons per family. On the other hand, single female/mother families (66 | 37.1%) represent the smallest median family size with 3.74 persons per family.
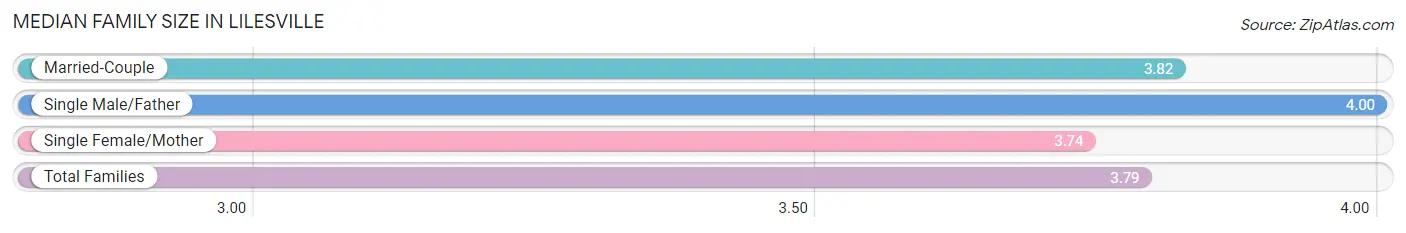
| Family Type | # Families | Family Size |
| Married-Couple | 109 (61.2%) | 3.82 |
| Single Male/Father | 3 (1.7%) | 4.00 |
| Single Female/Mother | 66 (37.1%) | 3.74 |
| Total Families | 178 (100.0%) | 3.79 |
Median Household Size in Lilesville
The median household size in Lilesville is 2.82 persons per household, with single male/father households (3 | 1.1%) accounting for the largest median household size of 4 persons per household. non-family households (98 | 35.5%) represent the smallest median household size with 1.06 persons per household.
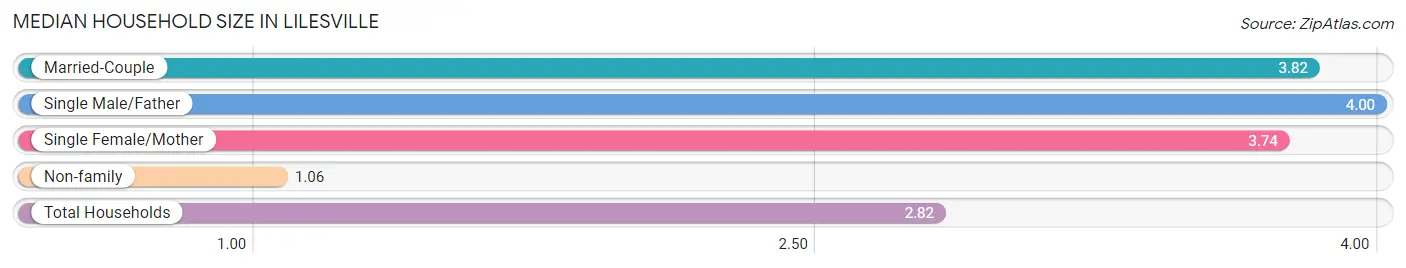
| Household Type | # Households | Household Size |
| Married-Couple | 109 (39.5%) | 3.82 |
| Single Male/Father | 3 (1.1%) | 4.00 |
| Single Female/Mother | 66 (23.9%) | 3.74 |
| Non-family | 98 (35.5%) | 1.06 |
| Total Households | 276 (100.0%) | 2.82 |
Household Size by Marriage Status in Lilesville
Out of a total of 276 households in Lilesville, 178 (64.5%) are family households, while 98 (35.5%) are nonfamily households. The most numerous type of family households are 2-person households, comprising 103, and the most common type of nonfamily households are 1-person households, comprising 94.
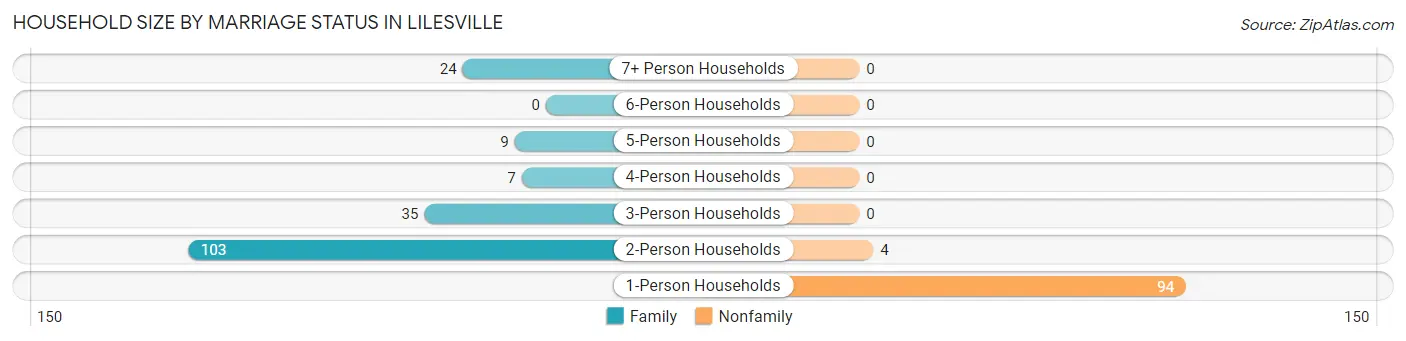
| Household Size | Family Households | Nonfamily Households |
| 1-Person Households | - | 94 (34.1%) |
| 2-Person Households | 103 (37.3%) | 4 (1.5%) |
| 3-Person Households | 35 (12.7%) | 0 (0.0%) |
| 4-Person Households | 7 (2.5%) | 0 (0.0%) |
| 5-Person Households | 9 (3.3%) | 0 (0.0%) |
| 6-Person Households | 0 (0.0%) | 0 (0.0%) |
| 7+ Person Households | 24 (8.7%) | 0 (0.0%) |
| Total | 178 (64.5%) | 98 (35.5%) |
Female Fertility in Lilesville
Fertility by Age in Lilesville
Average fertility rate in Lilesville is 14.0 births per 1,000 women. Women in the age bracket of 20 to 34 years have the highest fertility rate with 41.0 births per 1,000 women. Women in the age bracket of 20 to 34 years acount for 100.0% of all women with births.
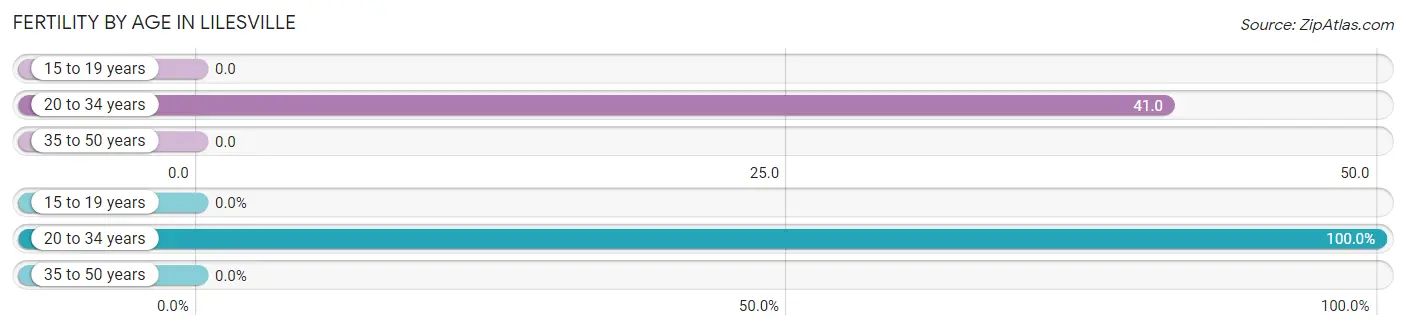
| Age Bracket | Women with Births | Births / 1,000 Women |
| 15 to 19 years | 0 (0.0%) | 0.0 |
| 20 to 34 years | 3 (100.0%) | 41.0 |
| 35 to 50 years | 0 (0.0%) | 0.0 |
| Total | 3 (100.0%) | 14.0 |
Fertility by Age by Marriage Status in Lilesville
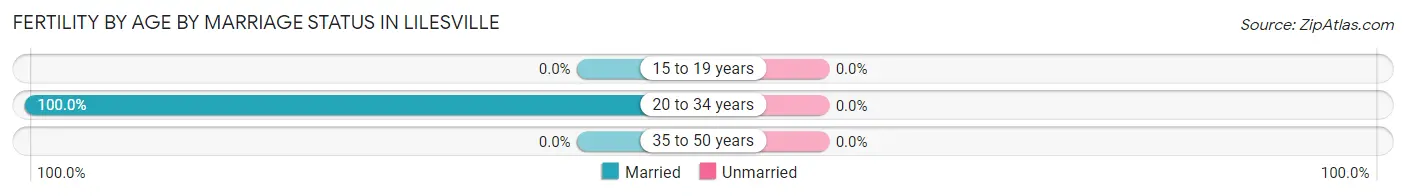
| Age Bracket | Married | Unmarried |
| 15 to 19 years | 0 (0.0%) | 0 (0.0%) |
| 20 to 34 years | 3 (100.0%) | 0 (0.0%) |
| 35 to 50 years | 0 (0.0%) | 0 (0.0%) |
| Total | 3 (100.0%) | 0 (0.0%) |
Fertility by Education in Lilesville
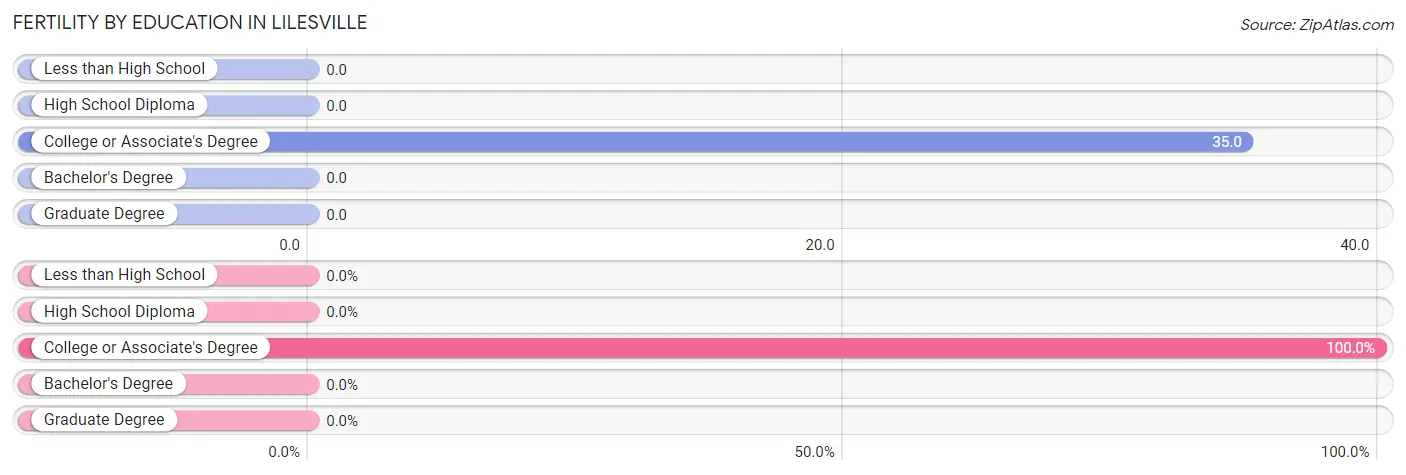
| Educational Attainment | Women with Births | Births / 1,000 Women |
| Less than High School | 0 (0.0%) | 0.0 |
| High School Diploma | 0 (0.0%) | 0.0 |
| College or Associate's Degree | 3 (100.0%) | 35.0 |
| Bachelor's Degree | 0 (0.0%) | 0.0 |
| Graduate Degree | 0 (0.0%) | 0.0 |
| Total | 3 (100.0%) | 14.0 |
Fertility by Education by Marriage Status in Lilesville
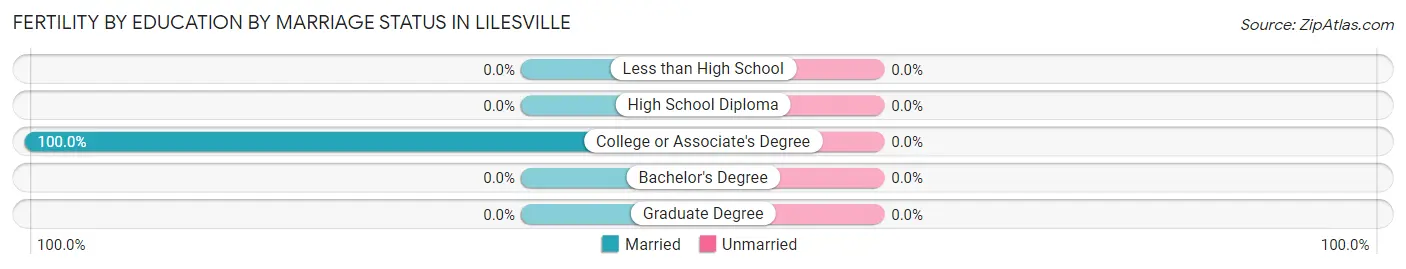
| Educational Attainment | Married | Unmarried |
| Less than High School | 0 (0.0%) | 0 (0.0%) |
| High School Diploma | 0 (0.0%) | 0 (0.0%) |
| College or Associate's Degree | 3 (100.0%) | 0 (0.0%) |
| Bachelor's Degree | 0 (0.0%) | 0 (0.0%) |
| Graduate Degree | 0 (0.0%) | 0 (0.0%) |
| Total | 3 (100.0%) | 0 (0.0%) |
Employment Characteristics in Lilesville
Employment by Class of Employer in Lilesville
Among the 240 employed individuals in Lilesville, private company employees (197 | 82.1%), not-for-profit organizations (15 | 6.2%), and self-employed (incorporated) (8 | 3.3%) make up the most common classes of employment.
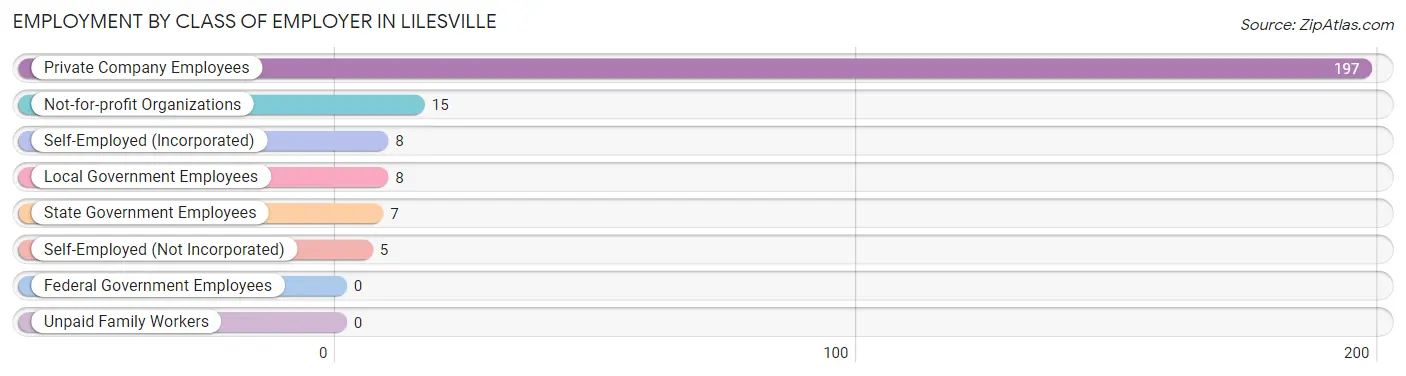
| Employer Class | # Employees | % Employees |
| Private Company Employees | 197 | 82.1% |
| Self-Employed (Incorporated) | 8 | 3.3% |
| Self-Employed (Not Incorporated) | 5 | 2.1% |
| Not-for-profit Organizations | 15 | 6.2% |
| Local Government Employees | 8 | 3.3% |
| State Government Employees | 7 | 2.9% |
| Federal Government Employees | 0 | 0.0% |
| Unpaid Family Workers | 0 | 0.0% |
| Total | 240 | 100.0% |
Employment Status by Age in Lilesville
According to the labor force statistics for Lilesville, out of the total population over 16 years of age (595), 46.4% or 276 individuals are in the labor force, with 10.5% or 29 of them unemployed. The age group with the highest labor force participation rate is 20 to 24 years, with 87.5% or 28 individuals in the labor force. Within the labor force, the 20 to 24 years age range has the highest percentage of unemployed individuals, with 96.4% or 27 of them being unemployed.
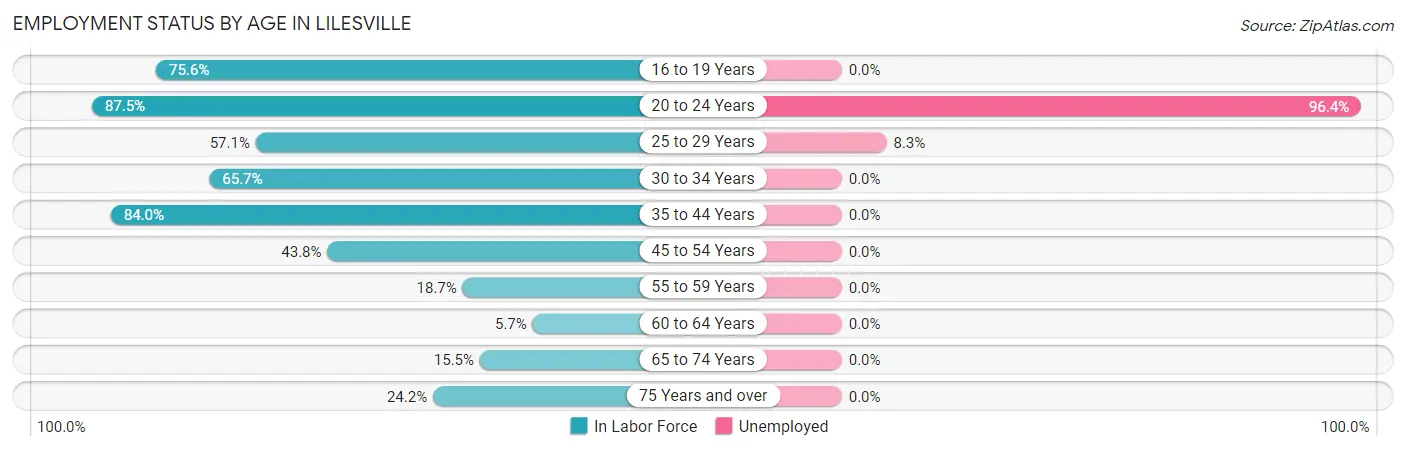
| Age Bracket | In Labor Force | Unemployed |
| 16 to 19 Years | 31 (75.6%) | 0 (0.0%) |
| 20 to 24 Years | 28 (87.5%) | 27 (96.4%) |
| 25 to 29 Years | 24 (57.1%) | 2 (8.3%) |
| 30 to 34 Years | 23 (65.7%) | 0 (0.0%) |
| 35 to 44 Years | 105 (84.0%) | 0 (0.0%) |
| 45 to 54 Years | 21 (43.8%) | 0 (0.0%) |
| 55 to 59 Years | 14 (18.7%) | 0 (0.0%) |
| 60 to 64 Years | 2 (5.7%) | 0 (0.0%) |
| 65 to 74 Years | 20 (15.5%) | 0 (0.0%) |
| 75 Years and over | 8 (24.2%) | 0 (0.0%) |
| Total | 276 (46.4%) | 29 (10.5%) |
Employment Status by Educational Attainment in Lilesville
According to labor force statistics for Lilesville, 52.5% of individuals (189) out of the total population between 25 and 64 years of age (360) are in the labor force, with 1.1% or 2 of them being unemployed. The group with the highest labor force participation rate are those with the educational attainment of college / associate degree, with 79.2% or 95 individuals in the labor force. Within the labor force, individuals with high school diploma education have the highest percentage of unemployment, with 3.3% or 2 of them being unemployed.
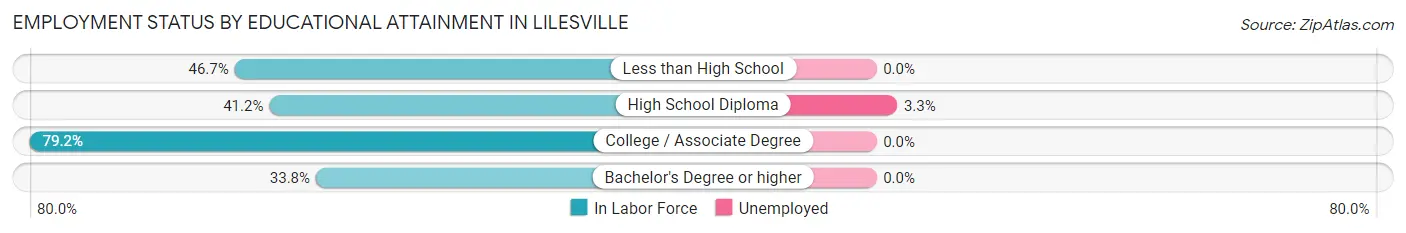
| Educational Attainment | In Labor Force | Unemployed |
| Less than High School | 7 (46.7%) | 0 (0.0%) |
| High School Diploma | 61 (41.2%) | 5 (3.3%) |
| College / Associate Degree | 95 (79.2%) | 0 (0.0%) |
| Bachelor's Degree or higher | 26 (33.8%) | 0 (0.0%) |
| Total | 189 (52.5%) | 4 (1.1%) |
Employment Occupations by Sex in Lilesville
Management, Business, Science and Arts Occupations
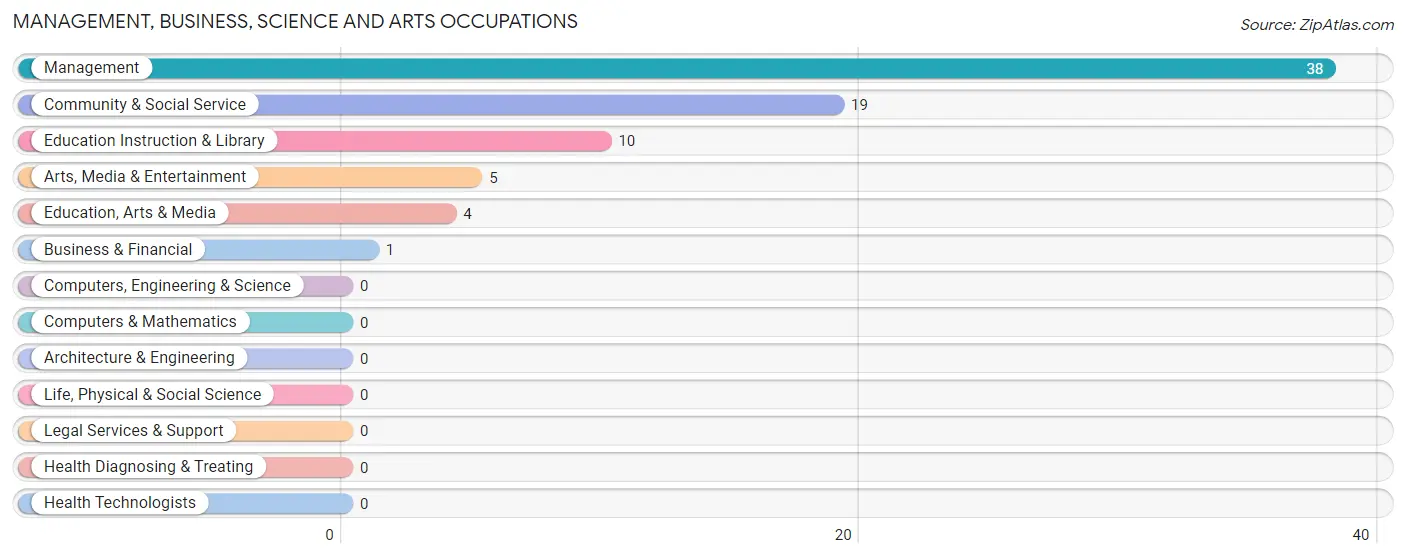
The most common Management, Business, Science and Arts occupations in Lilesville are Management (38 | 15.4%), Community & Social Service (19 | 7.7%), Education Instruction & Library (10 | 4.1%), Arts, Media & Entertainment (5 | 2.0%), and Education, Arts & Media (4 | 1.6%).
Management, Business, Science and Arts Occupations by Sex
Within the Management, Business, Science and Arts occupations in Lilesville, the most male-oriented occupations are Business & Financial (100.0%), Education, Arts & Media (50.0%), and Management (13.2%), while the most female-oriented occupations are Education Instruction & Library (100.0%), Arts, Media & Entertainment (100.0%), and Community & Social Service (89.5%).
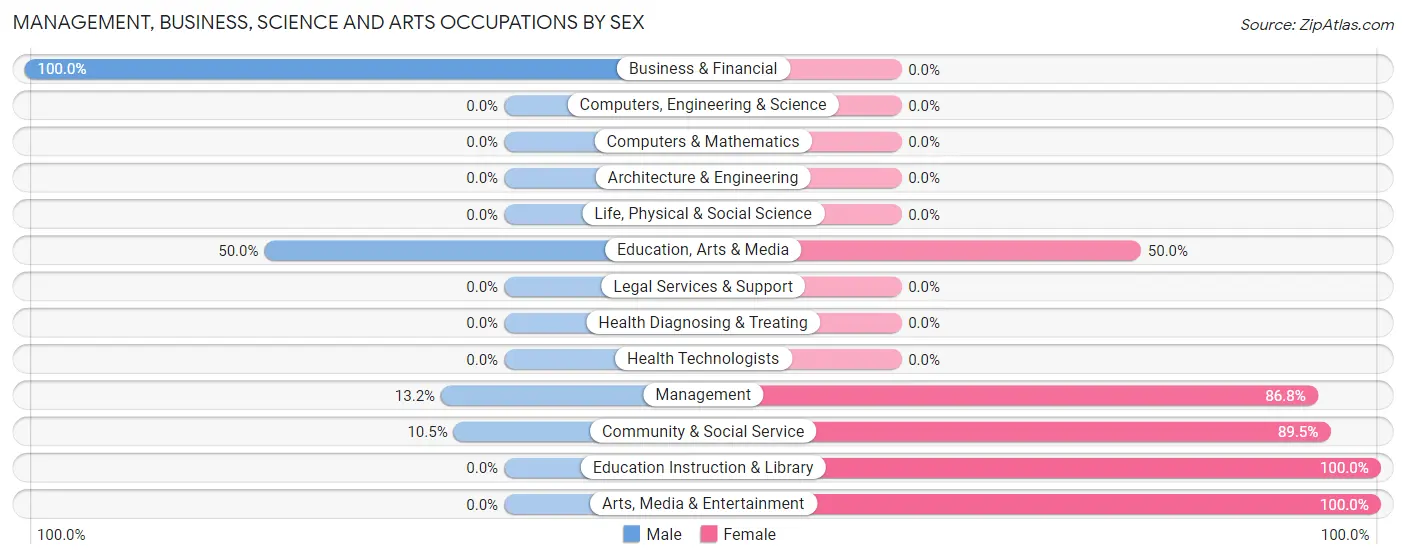
| Occupation | Male | Female |
| Management | 5 (13.2%) | 33 (86.8%) |
| Business & Financial | 1 (100.0%) | 0 (0.0%) |
| Computers, Engineering & Science | 0 (0.0%) | 0 (0.0%) |
| Computers & Mathematics | 0 (0.0%) | 0 (0.0%) |
| Architecture & Engineering | 0 (0.0%) | 0 (0.0%) |
| Life, Physical & Social Science | 0 (0.0%) | 0 (0.0%) |
| Community & Social Service | 2 (10.5%) | 17 (89.5%) |
| Education, Arts & Media | 2 (50.0%) | 2 (50.0%) |
| Legal Services & Support | 0 (0.0%) | 0 (0.0%) |
| Education Instruction & Library | 0 (0.0%) | 10 (100.0%) |
| Arts, Media & Entertainment | 0 (0.0%) | 5 (100.0%) |
| Health Diagnosing & Treating | 0 (0.0%) | 0 (0.0%) |
| Health Technologists | 0 (0.0%) | 0 (0.0%) |
| Total (Category) | 8 (13.8%) | 50 (86.2%) |
| Total (Overall) | 93 (37.7%) | 154 (62.4%) |
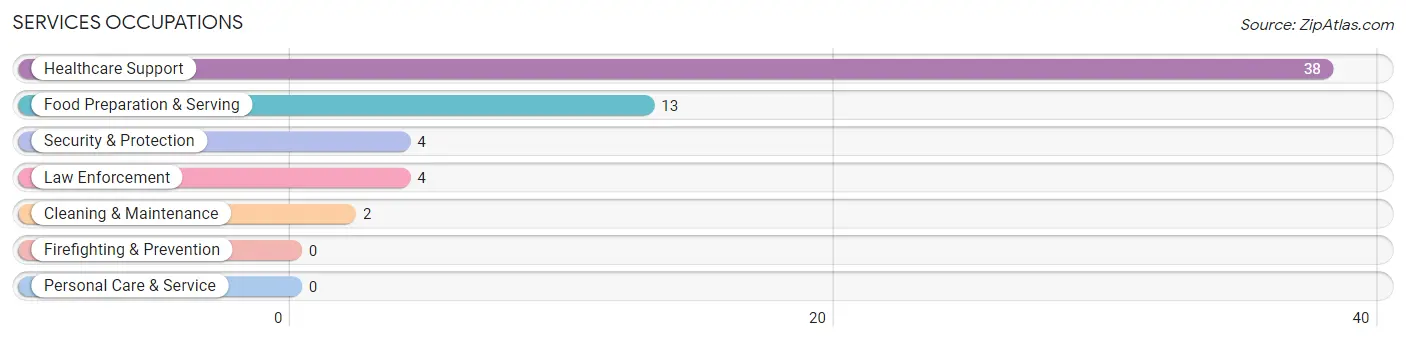
Services Occupations
The most common Services occupations in Lilesville are Healthcare Support (38 | 15.4%), Food Preparation & Serving (13 | 5.3%), Security & Protection (4 | 1.6%), Law Enforcement (4 | 1.6%), and Cleaning & Maintenance (2 | 0.8%).
Services Occupations by Sex
Within the Services occupations in Lilesville, the most male-oriented occupations are Security & Protection (100.0%), and Law Enforcement (100.0%), while the most female-oriented occupations are Healthcare Support (100.0%), Food Preparation & Serving (100.0%), and Cleaning & Maintenance (100.0%).
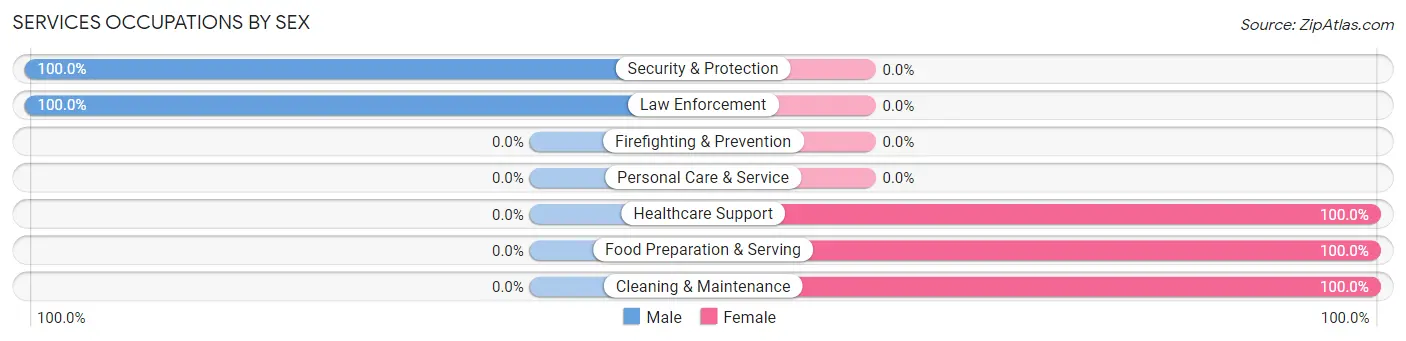
| Occupation | Male | Female |
| Healthcare Support | 0 (0.0%) | 38 (100.0%) |
| Security & Protection | 4 (100.0%) | 0 (0.0%) |
| Firefighting & Prevention | 0 (0.0%) | 0 (0.0%) |
| Law Enforcement | 4 (100.0%) | 0 (0.0%) |
| Food Preparation & Serving | 0 (0.0%) | 13 (100.0%) |
| Cleaning & Maintenance | 0 (0.0%) | 2 (100.0%) |
| Personal Care & Service | 0 (0.0%) | 0 (0.0%) |
| Total (Category) | 4 (7.0%) | 53 (93.0%) |
| Total (Overall) | 93 (37.7%) | 154 (62.4%) |
Sales and Office Occupations
The most common Sales and Office occupations in Lilesville are Sales & Related (31 | 12.6%), and Office & Administration (12 | 4.9%).

Sales and Office Occupations by Sex

| Occupation | Male | Female |
| Sales & Related | 1 (3.2%) | 30 (96.8%) |
| Office & Administration | 0 (0.0%) | 12 (100.0%) |
| Total (Category) | 1 (2.3%) | 42 (97.7%) |
| Total (Overall) | 93 (37.7%) | 154 (62.4%) |
Natural Resources, Construction and Maintenance Occupations
The most common Natural Resources, Construction and Maintenance occupations in Lilesville are Installation, Maintenance & Repair (16 | 6.5%), and Construction & Extraction (1 | 0.4%).

Natural Resources, Construction and Maintenance Occupations by Sex

| Occupation | Male | Female |
| Farming, Fishing & Forestry | 0 (0.0%) | 0 (0.0%) |
| Construction & Extraction | 1 (100.0%) | 0 (0.0%) |
| Installation, Maintenance & Repair | 16 (100.0%) | 0 (0.0%) |
| Total (Category) | 17 (100.0%) | 0 (0.0%) |
| Total (Overall) | 93 (37.7%) | 154 (62.4%) |
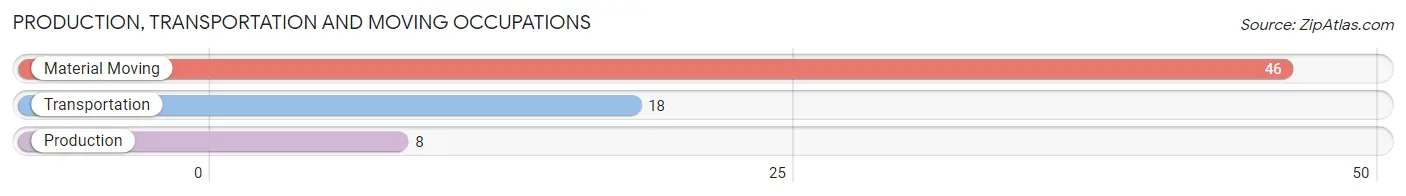
Production, Transportation and Moving Occupations
The most common Production, Transportation and Moving occupations in Lilesville are Material Moving (46 | 18.6%), Transportation (18 | 7.3%), and Production (8 | 3.2%).
Production, Transportation and Moving Occupations by Sex
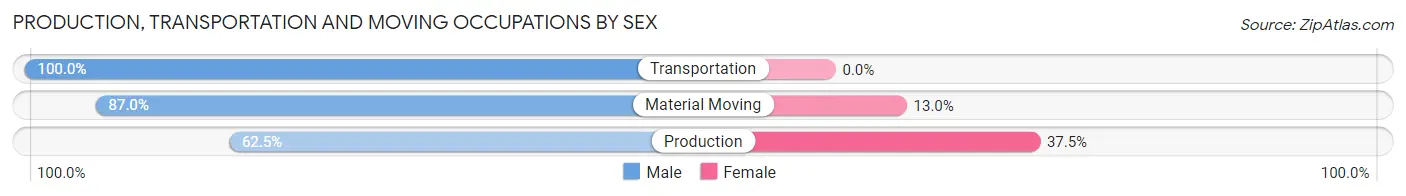
| Occupation | Male | Female |
| Production | 5 (62.5%) | 3 (37.5%) |
| Transportation | 18 (100.0%) | 0 (0.0%) |
| Material Moving | 40 (87.0%) | 6 (13.0%) |
| Total (Category) | 63 (87.5%) | 9 (12.5%) |
| Total (Overall) | 93 (37.7%) | 154 (62.4%) |
Employment Industries by Sex in Lilesville
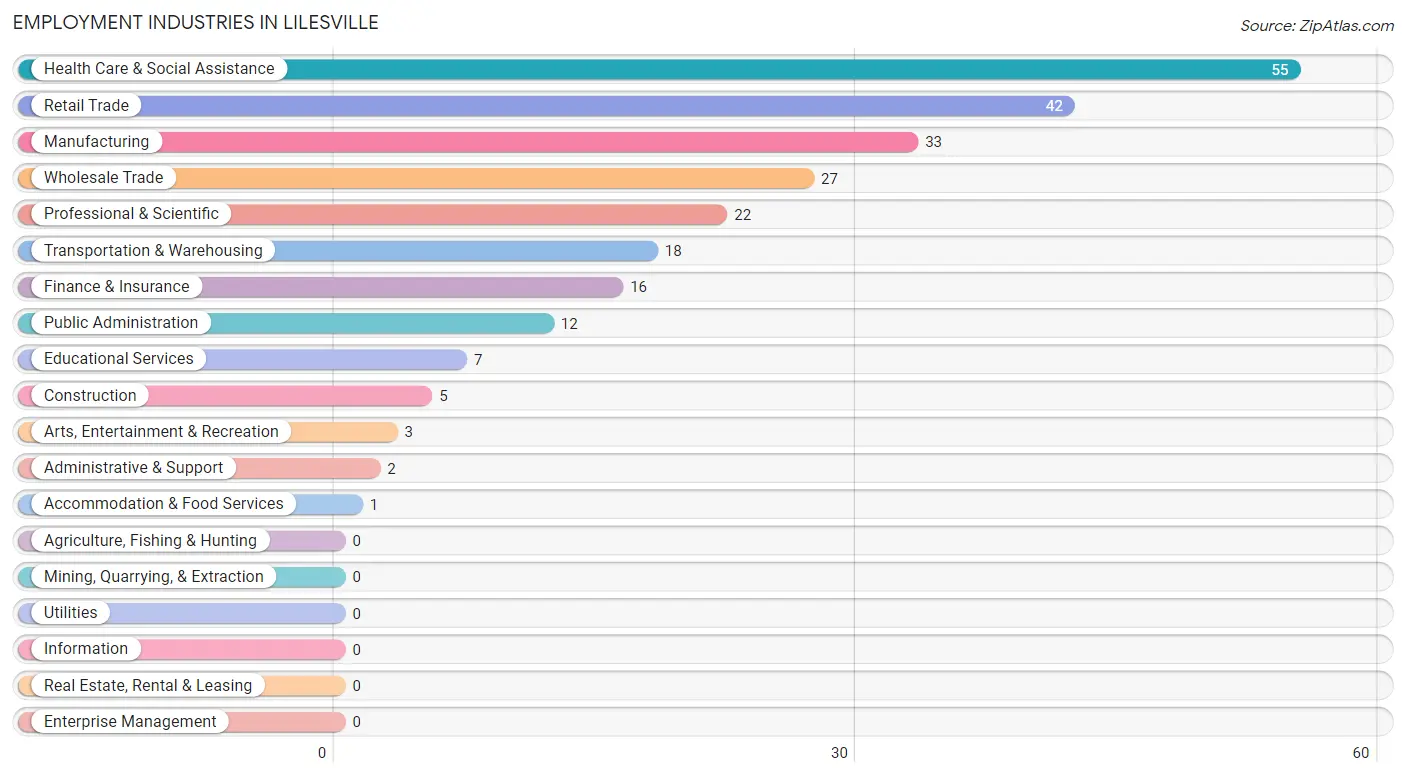
Employment Industries in Lilesville
The major employment industries in Lilesville include Health Care & Social Assistance (55 | 22.3%), Retail Trade (42 | 17.0%), Manufacturing (33 | 13.4%), Wholesale Trade (27 | 10.9%), and Professional & Scientific (22 | 8.9%).
Employment Industries by Sex in Lilesville
The Lilesville industries that see more men than women are Construction (100.0%), Wholesale Trade (100.0%), and Transportation & Warehousing (100.0%), whereas the industries that tend to have a higher number of women are Finance & Insurance (100.0%), Professional & Scientific (100.0%), and Administrative & Support (100.0%).
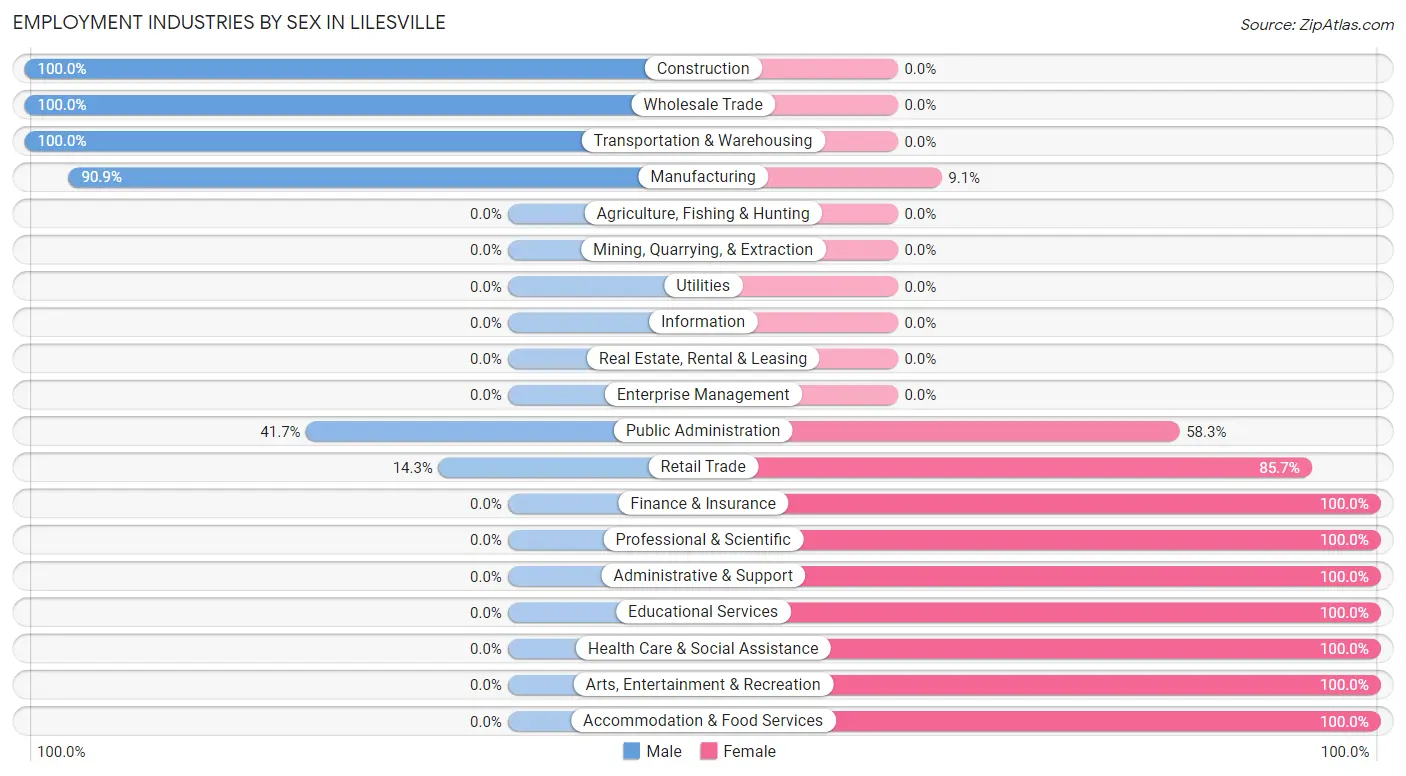
| Industry | Male | Female |
| Agriculture, Fishing & Hunting | 0 (0.0%) | 0 (0.0%) |
| Mining, Quarrying, & Extraction | 0 (0.0%) | 0 (0.0%) |
| Construction | 5 (100.0%) | 0 (0.0%) |
| Manufacturing | 30 (90.9%) | 3 (9.1%) |
| Wholesale Trade | 27 (100.0%) | 0 (0.0%) |
| Retail Trade | 6 (14.3%) | 36 (85.7%) |
| Transportation & Warehousing | 18 (100.0%) | 0 (0.0%) |
| Utilities | 0 (0.0%) | 0 (0.0%) |
| Information | 0 (0.0%) | 0 (0.0%) |
| Finance & Insurance | 0 (0.0%) | 16 (100.0%) |
| Real Estate, Rental & Leasing | 0 (0.0%) | 0 (0.0%) |
| Professional & Scientific | 0 (0.0%) | 22 (100.0%) |
| Enterprise Management | 0 (0.0%) | 0 (0.0%) |
| Administrative & Support | 0 (0.0%) | 2 (100.0%) |
| Educational Services | 0 (0.0%) | 7 (100.0%) |
| Health Care & Social Assistance | 0 (0.0%) | 55 (100.0%) |
| Arts, Entertainment & Recreation | 0 (0.0%) | 3 (100.0%) |
| Accommodation & Food Services | 0 (0.0%) | 1 (100.0%) |
| Public Administration | 5 (41.7%) | 7 (58.3%) |
| Total | 93 (37.7%) | 154 (62.4%) |
Education in Lilesville
School Enrollment in Lilesville
The most common levels of schooling among the 205 students in Lilesville are elementary school (59 | 28.8%), nursery / preschool (45 | 22.0%), and high school (36 | 17.6%).
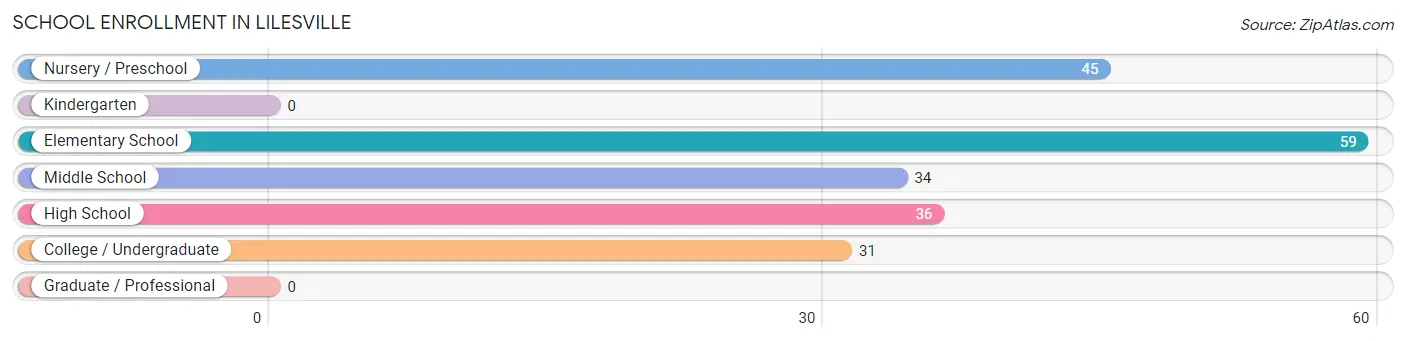
| School Level | # Students | % Students |
| Nursery / Preschool | 45 | 22.0% |
| Kindergarten | 0 | 0.0% |
| Elementary School | 59 | 28.8% |
| Middle School | 34 | 16.6% |
| High School | 36 | 17.6% |
| College / Undergraduate | 31 | 15.1% |
| Graduate / Professional | 0 | 0.0% |
| Total | 205 | 100.0% |
School Enrollment by Age by Funding Source in Lilesville
Out of a total of 205 students who are enrolled in schools in Lilesville, 30 (14.6%) attend a private institution, while the remaining 175 (85.4%) are enrolled in public schools. The age group of 18 to 19 year olds has the highest likelihood of being enrolled in private schools, with 30 (100.0% in the age bracket) enrolled. Conversely, the age group of 3 to 4 year olds has the lowest likelihood of being enrolled in a private school, with 45 (100.0% in the age bracket) attending a public institution.
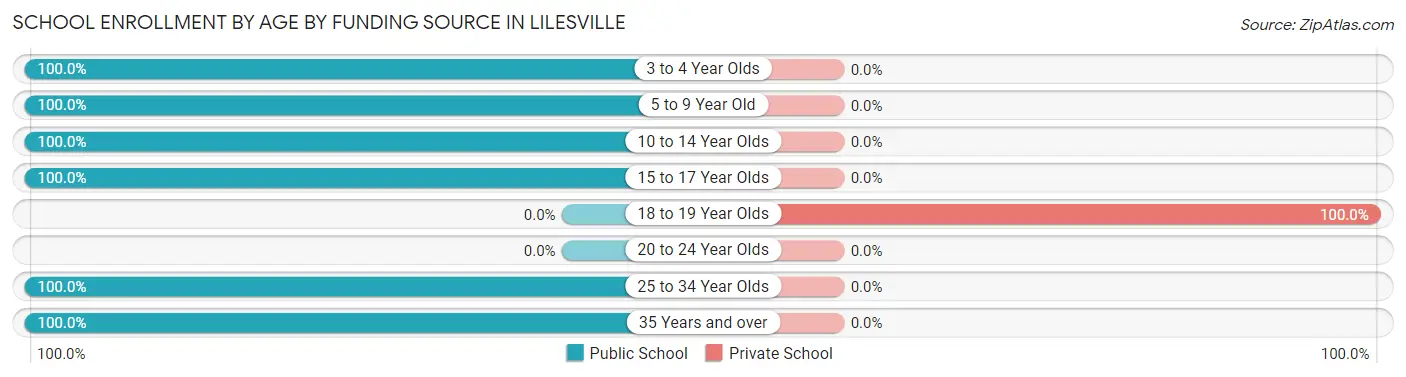
| Age Bracket | Public School | Private School |
| 3 to 4 Year Olds | 45 (100.0%) | 0 (0.0%) |
| 5 to 9 Year Old | 59 (100.0%) | 0 (0.0%) |
| 10 to 14 Year Olds | 34 (100.0%) | 0 (0.0%) |
| 15 to 17 Year Olds | 31 (100.0%) | 0 (0.0%) |
| 18 to 19 Year Olds | 0 (0.0%) | 30 (100.0%) |
| 20 to 24 Year Olds | 0 (0.0%) | 0 (0.0%) |
| 25 to 34 Year Olds | 1 (100.0%) | 0 (0.0%) |
| 35 Years and over | 5 (100.0%) | 0 (0.0%) |
| Total | 175 (85.4%) | 30 (14.6%) |
Educational Attainment by Field of Study in Lilesville
Literature & languages (46 | 50.0%), social sciences (19 | 20.6%), multidisciplinary studies (7 | 7.6%), visual & performing arts (7 | 7.6%), and computers & mathematics (4 | 4.3%) are the most common fields of study among 92 individuals in Lilesville who have obtained a bachelor's degree or higher.
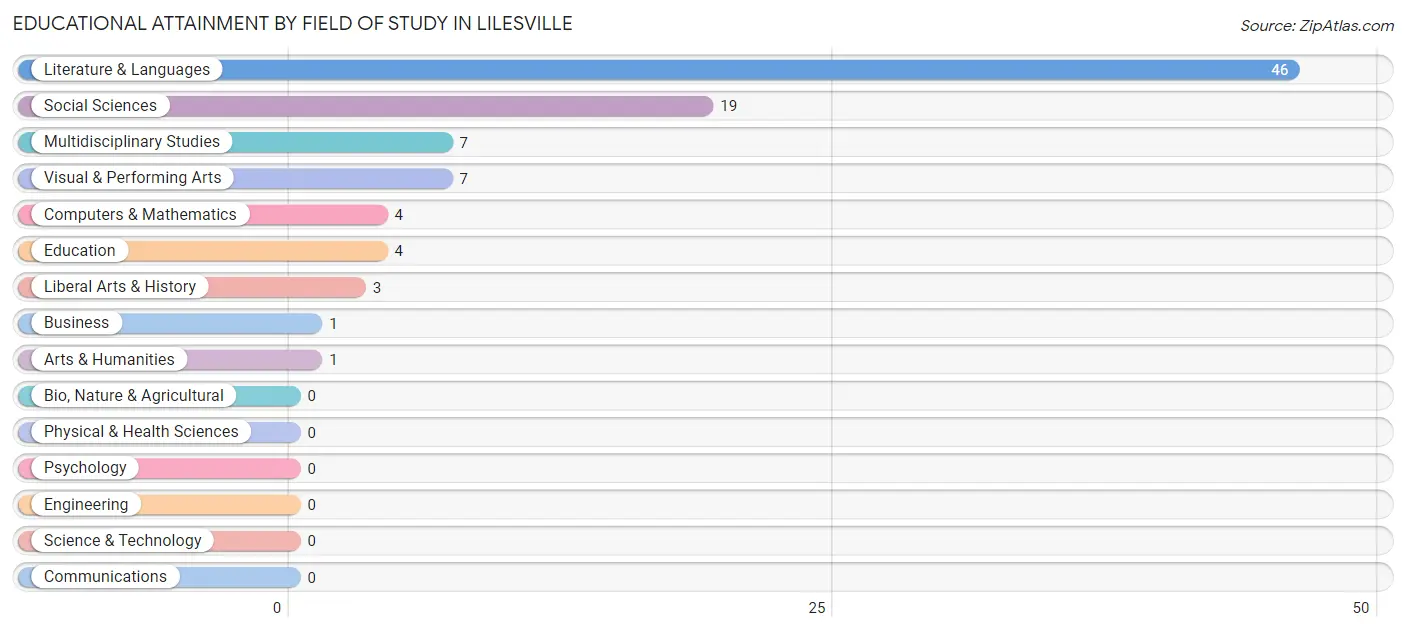
| Field of Study | # Graduates | % Graduates |
| Computers & Mathematics | 4 | 4.3% |
| Bio, Nature & Agricultural | 0 | 0.0% |
| Physical & Health Sciences | 0 | 0.0% |
| Psychology | 0 | 0.0% |
| Social Sciences | 19 | 20.6% |
| Engineering | 0 | 0.0% |
| Multidisciplinary Studies | 7 | 7.6% |
| Science & Technology | 0 | 0.0% |
| Business | 1 | 1.1% |
| Education | 4 | 4.3% |
| Literature & Languages | 46 | 50.0% |
| Liberal Arts & History | 3 | 3.3% |
| Visual & Performing Arts | 7 | 7.6% |
| Communications | 0 | 0.0% |
| Arts & Humanities | 1 | 1.1% |
| Total | 92 | 100.0% |
Transportation & Commute in Lilesville
Vehicle Availability by Sex in Lilesville
The most prevalent vehicle ownership categories in Lilesville are males with 5 or more vehicles (36, accounting for 38.7%) and females with 5 or more vehicles (15, making up 24.5%).
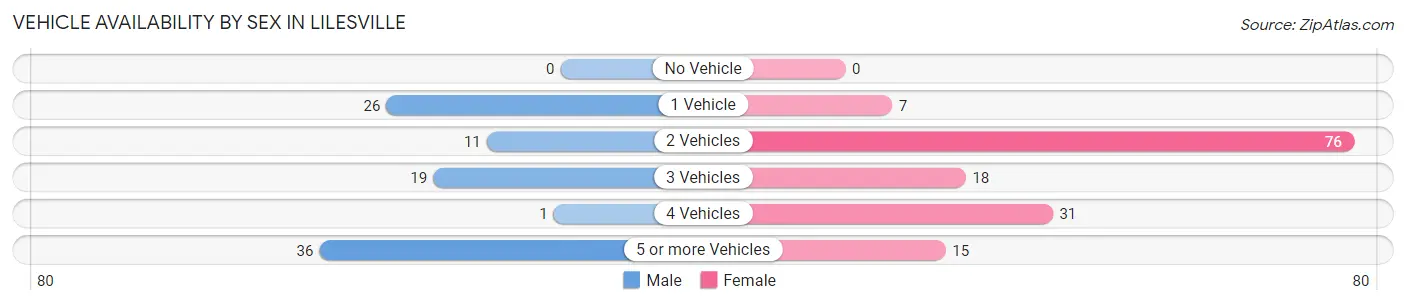
| Vehicles Available | Male | Female |
| No Vehicle | 0 (0.0%) | 0 (0.0%) |
| 1 Vehicle | 26 (28.0%) | 7 (4.8%) |
| 2 Vehicles | 11 (11.8%) | 76 (51.7%) |
| 3 Vehicles | 19 (20.4%) | 18 (12.2%) |
| 4 Vehicles | 1 (1.1%) | 31 (21.1%) |
| 5 or more Vehicles | 36 (38.7%) | 15 (10.2%) |
| Total | 93 (100.0%) | 147 (100.0%) |
Commute Time in Lilesville
The most frequently occuring commute durations in Lilesville are 45 to 59 minutes (103 commuters, 48.6%), 5 to 9 minutes (32 commuters, 15.1%), and 30 to 34 minutes (21 commuters, 9.9%).
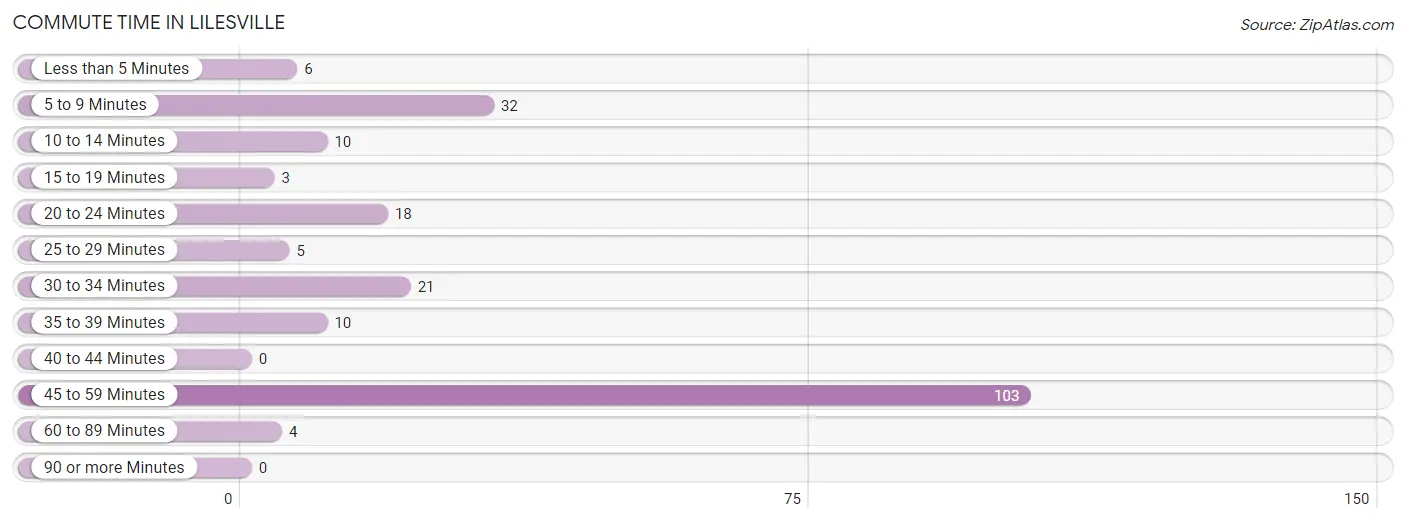
| Commute Time | # Commuters | % Commuters |
| Less than 5 Minutes | 6 | 2.8% |
| 5 to 9 Minutes | 32 | 15.1% |
| 10 to 14 Minutes | 10 | 4.7% |
| 15 to 19 Minutes | 3 | 1.4% |
| 20 to 24 Minutes | 18 | 8.5% |
| 25 to 29 Minutes | 5 | 2.4% |
| 30 to 34 Minutes | 21 | 9.9% |
| 35 to 39 Minutes | 10 | 4.7% |
| 40 to 44 Minutes | 0 | 0.0% |
| 45 to 59 Minutes | 103 | 48.6% |
| 60 to 89 Minutes | 4 | 1.9% |
| 90 or more Minutes | 0 | 0.0% |
Commute Time by Sex in Lilesville
The most common commute times in Lilesville are 45 to 59 minutes (56 commuters, 65.9%) for males and 45 to 59 minutes (47 commuters, 37.0%) for females.
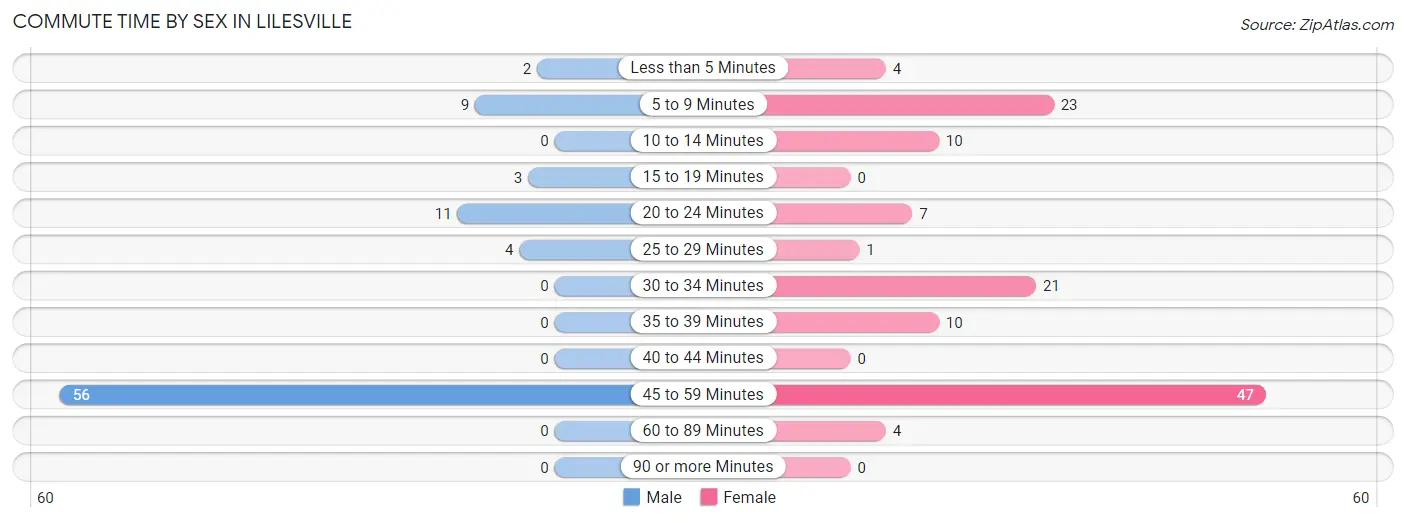
| Commute Time | Male | Female |
| Less than 5 Minutes | 2 (2.4%) | 4 (3.2%) |
| 5 to 9 Minutes | 9 (10.6%) | 23 (18.1%) |
| 10 to 14 Minutes | 0 (0.0%) | 10 (7.9%) |
| 15 to 19 Minutes | 3 (3.5%) | 0 (0.0%) |
| 20 to 24 Minutes | 11 (12.9%) | 7 (5.5%) |
| 25 to 29 Minutes | 4 (4.7%) | 1 (0.8%) |
| 30 to 34 Minutes | 0 (0.0%) | 21 (16.5%) |
| 35 to 39 Minutes | 0 (0.0%) | 10 (7.9%) |
| 40 to 44 Minutes | 0 (0.0%) | 0 (0.0%) |
| 45 to 59 Minutes | 56 (65.9%) | 47 (37.0%) |
| 60 to 89 Minutes | 0 (0.0%) | 4 (3.2%) |
| 90 or more Minutes | 0 (0.0%) | 0 (0.0%) |
Time of Departure to Work by Sex in Lilesville
The most frequent times of departure to work in Lilesville are 5:00 AM to 5:29 AM (27, 31.8%) for males and 7:30 AM to 7:59 AM (30, 23.6%) for females.
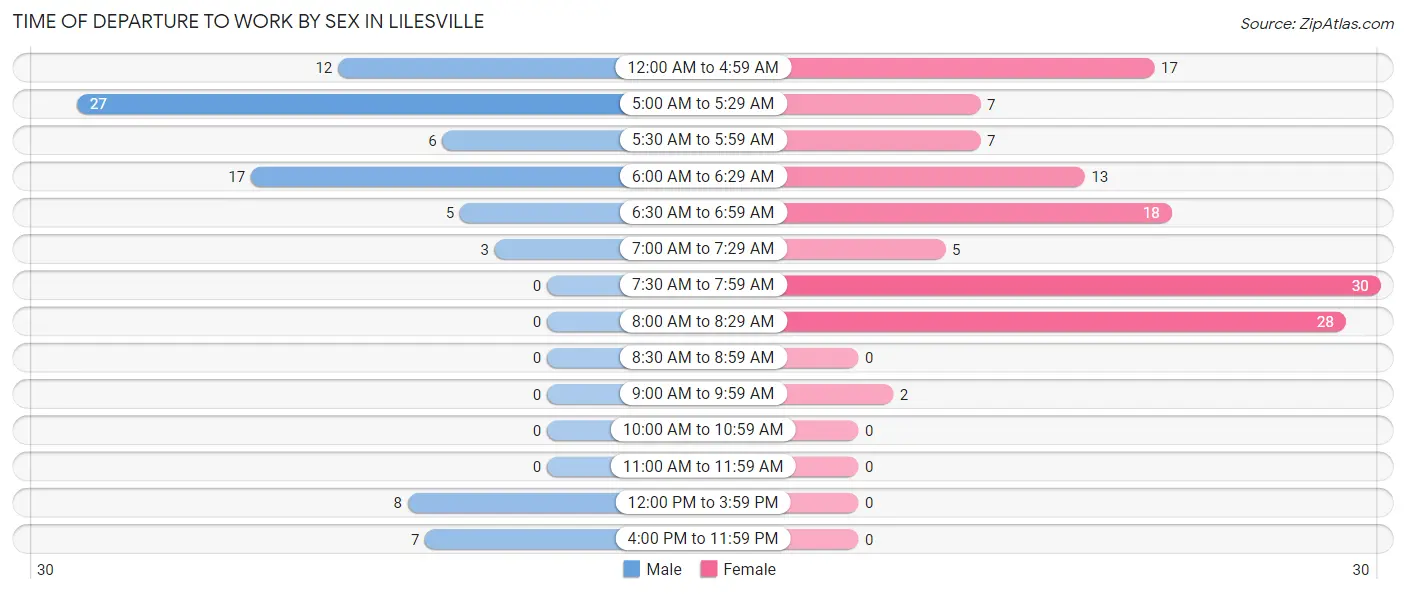
| Time of Departure | Male | Female |
| 12:00 AM to 4:59 AM | 12 (14.1%) | 17 (13.4%) |
| 5:00 AM to 5:29 AM | 27 (31.8%) | 7 (5.5%) |
| 5:30 AM to 5:59 AM | 6 (7.1%) | 7 (5.5%) |
| 6:00 AM to 6:29 AM | 17 (20.0%) | 13 (10.2%) |
| 6:30 AM to 6:59 AM | 5 (5.9%) | 18 (14.2%) |
| 7:00 AM to 7:29 AM | 3 (3.5%) | 5 (3.9%) |
| 7:30 AM to 7:59 AM | 0 (0.0%) | 30 (23.6%) |
| 8:00 AM to 8:29 AM | 0 (0.0%) | 28 (22.1%) |
| 8:30 AM to 8:59 AM | 0 (0.0%) | 0 (0.0%) |
| 9:00 AM to 9:59 AM | 0 (0.0%) | 2 (1.6%) |
| 10:00 AM to 10:59 AM | 0 (0.0%) | 0 (0.0%) |
| 11:00 AM to 11:59 AM | 0 (0.0%) | 0 (0.0%) |
| 12:00 PM to 3:59 PM | 8 (9.4%) | 0 (0.0%) |
| 4:00 PM to 11:59 PM | 7 (8.2%) | 0 (0.0%) |
| Total | 85 (100.0%) | 127 (100.0%) |
Housing Occupancy in Lilesville
Occupancy by Ownership in Lilesville
Of the total 276 dwellings in Lilesville, owner-occupied units account for 250 (90.6%), while renter-occupied units make up 26 (9.4%).
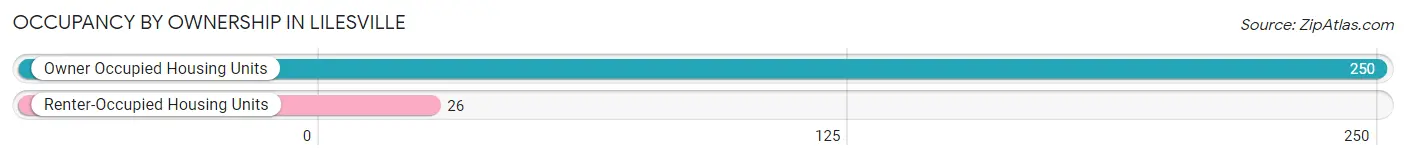
| Occupancy | # Housing Units | % Housing Units |
| Owner Occupied Housing Units | 250 | 90.6% |
| Renter-Occupied Housing Units | 26 | 9.4% |
| Total Occupied Housing Units | 276 | 100.0% |
Occupancy by Household Size in Lilesville
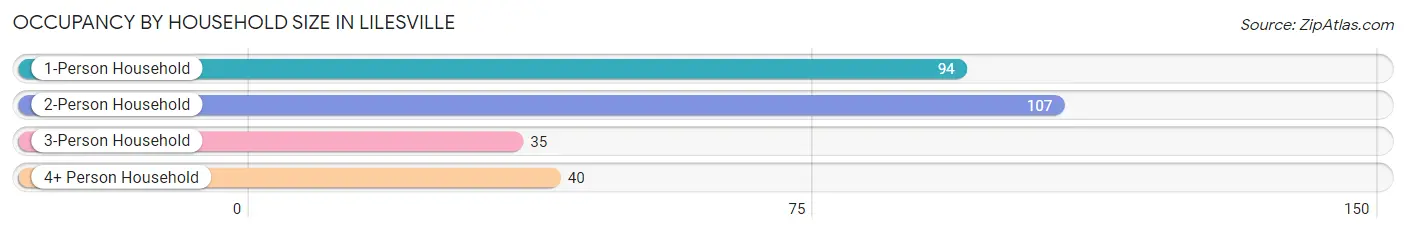
| Household Size | # Housing Units | % Housing Units |
| 1-Person Household | 94 | 34.1% |
| 2-Person Household | 107 | 38.8% |
| 3-Person Household | 35 | 12.7% |
| 4+ Person Household | 40 | 14.5% |
| Total Housing Units | 276 | 100.0% |
Occupancy by Ownership by Household Size in Lilesville
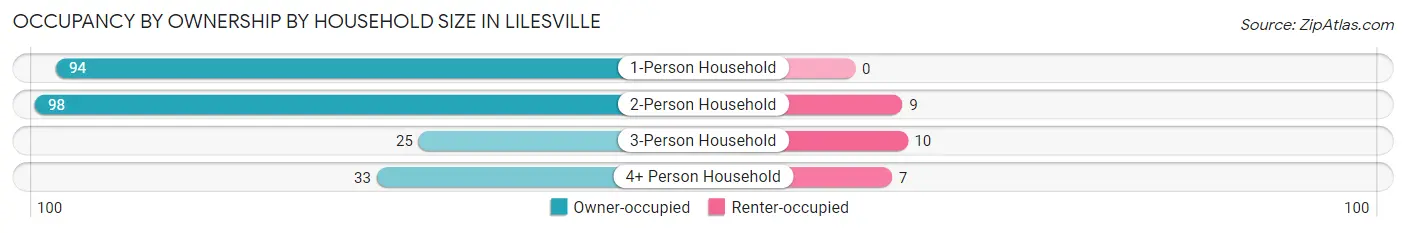
| Household Size | Owner-occupied | Renter-occupied |
| 1-Person Household | 94 (100.0%) | 0 (0.0%) |
| 2-Person Household | 98 (91.6%) | 9 (8.4%) |
| 3-Person Household | 25 (71.4%) | 10 (28.6%) |
| 4+ Person Household | 33 (82.5%) | 7 (17.5%) |
| Total Housing Units | 250 (90.6%) | 26 (9.4%) |
Occupancy by Educational Attainment in Lilesville
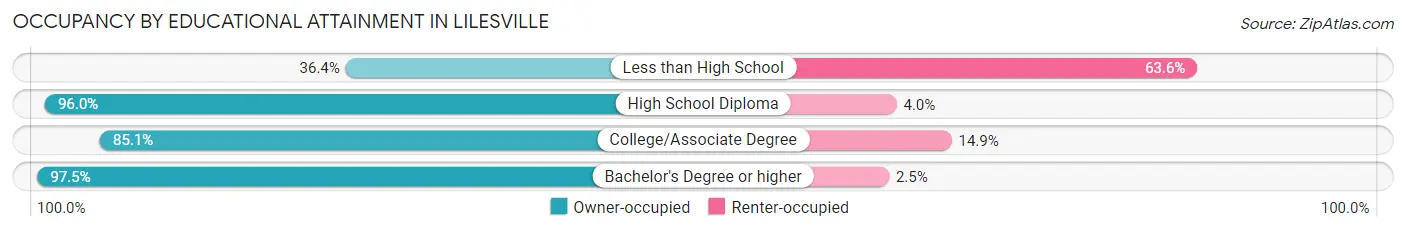
| Household Size | Owner-occupied | Renter-occupied |
| Less than High School | 4 (36.4%) | 7 (63.6%) |
| High School Diploma | 95 (96.0%) | 4 (4.0%) |
| College/Associate Degree | 74 (85.1%) | 13 (14.9%) |
| Bachelor's Degree or higher | 77 (97.5%) | 2 (2.5%) |
Occupancy by Age of Householder in Lilesville
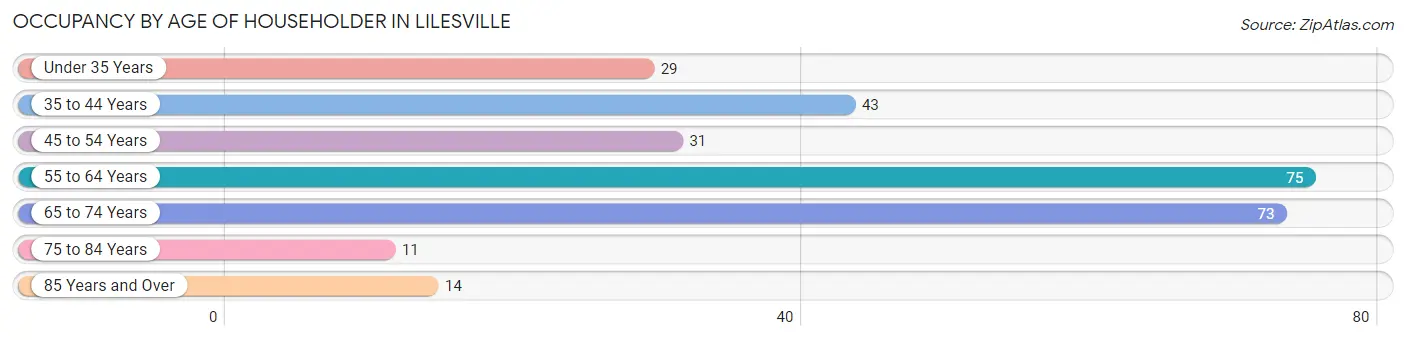
| Age Bracket | # Households | % Households |
| Under 35 Years | 29 | 10.5% |
| 35 to 44 Years | 43 | 15.6% |
| 45 to 54 Years | 31 | 11.2% |
| 55 to 64 Years | 75 | 27.2% |
| 65 to 74 Years | 73 | 26.5% |
| 75 to 84 Years | 11 | 4.0% |
| 85 Years and Over | 14 | 5.1% |
| Total | 276 | 100.0% |
Housing Finances in Lilesville
Median Income by Occupancy in Lilesville
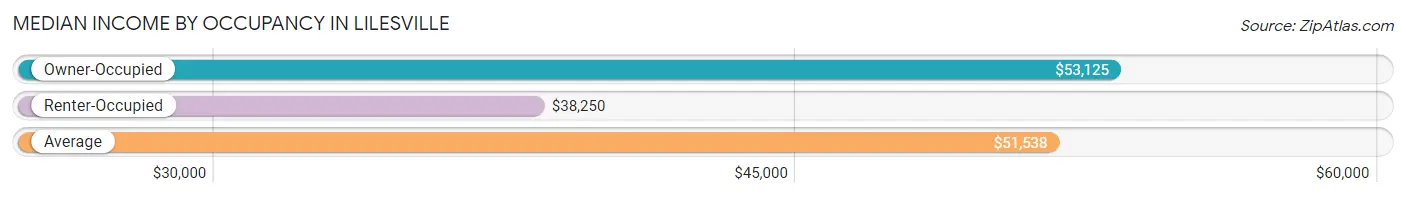
| Occupancy Type | # Households | Median Income |
| Owner-Occupied | 250 (90.6%) | $53,125 |
| Renter-Occupied | 26 (9.4%) | $38,250 |
| Average | 276 (100.0%) | $51,538 |
Occupancy by Householder Income Bracket in Lilesville
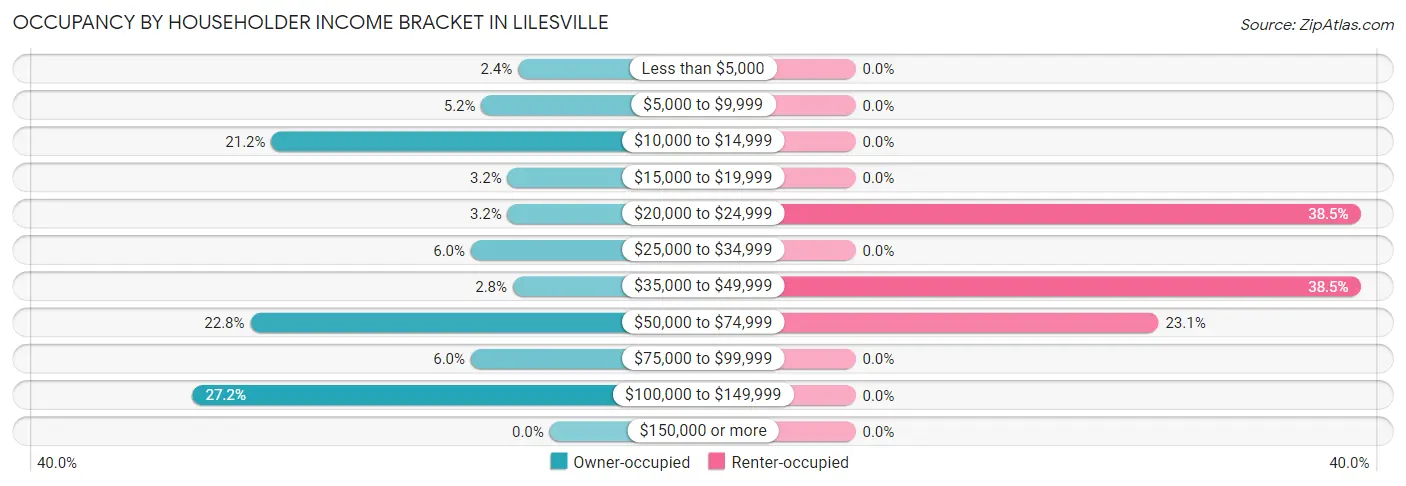
| Income Bracket | Owner-occupied | Renter-occupied |
| Less than $5,000 | 6 (2.4%) | 0 (0.0%) |
| $5,000 to $9,999 | 13 (5.2%) | 0 (0.0%) |
| $10,000 to $14,999 | 53 (21.2%) | 0 (0.0%) |
| $15,000 to $19,999 | 8 (3.2%) | 0 (0.0%) |
| $20,000 to $24,999 | 8 (3.2%) | 10 (38.5%) |
| $25,000 to $34,999 | 15 (6.0%) | 0 (0.0%) |
| $35,000 to $49,999 | 7 (2.8%) | 10 (38.5%) |
| $50,000 to $74,999 | 57 (22.8%) | 6 (23.1%) |
| $75,000 to $99,999 | 15 (6.0%) | 0 (0.0%) |
| $100,000 to $149,999 | 68 (27.2%) | 0 (0.0%) |
| $150,000 or more | 0 (0.0%) | 0 (0.0%) |
| Total | 250 (100.0%) | 26 (100.0%) |
Monthly Housing Cost Tiers in Lilesville
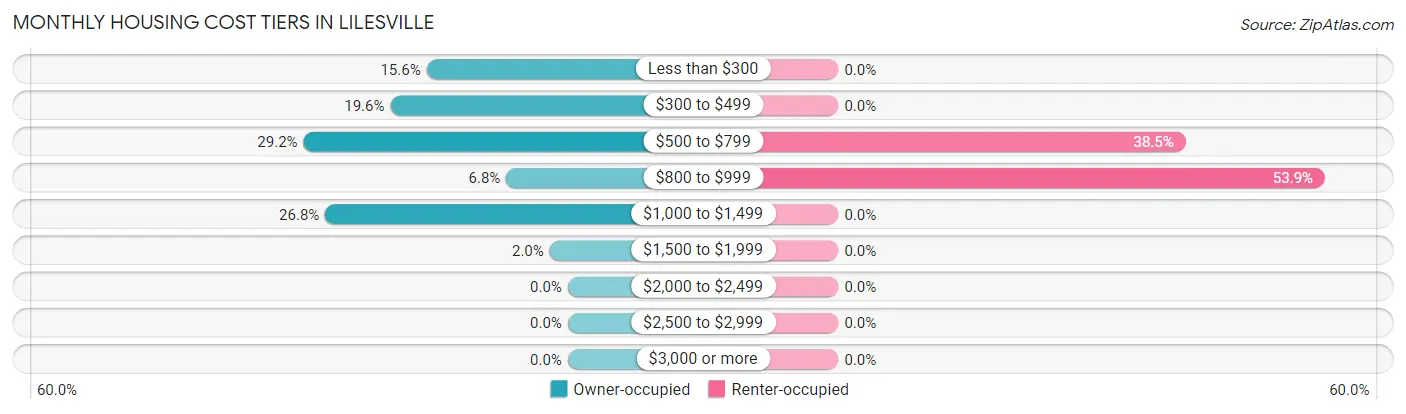
| Monthly Cost | Owner-occupied | Renter-occupied |
| Less than $300 | 39 (15.6%) | 0 (0.0%) |
| $300 to $499 | 49 (19.6%) | 0 (0.0%) |
| $500 to $799 | 73 (29.2%) | 10 (38.5%) |
| $800 to $999 | 17 (6.8%) | 14 (53.8%) |
| $1,000 to $1,499 | 67 (26.8%) | 0 (0.0%) |
| $1,500 to $1,999 | 5 (2.0%) | 0 (0.0%) |
| $2,000 to $2,499 | 0 (0.0%) | 0 (0.0%) |
| $2,500 to $2,999 | 0 (0.0%) | 0 (0.0%) |
| $3,000 or more | 0 (0.0%) | 0 (0.0%) |
| Total | 250 (100.0%) | 26 (100.0%) |
Physical Housing Characteristics in Lilesville
Housing Structures in Lilesville
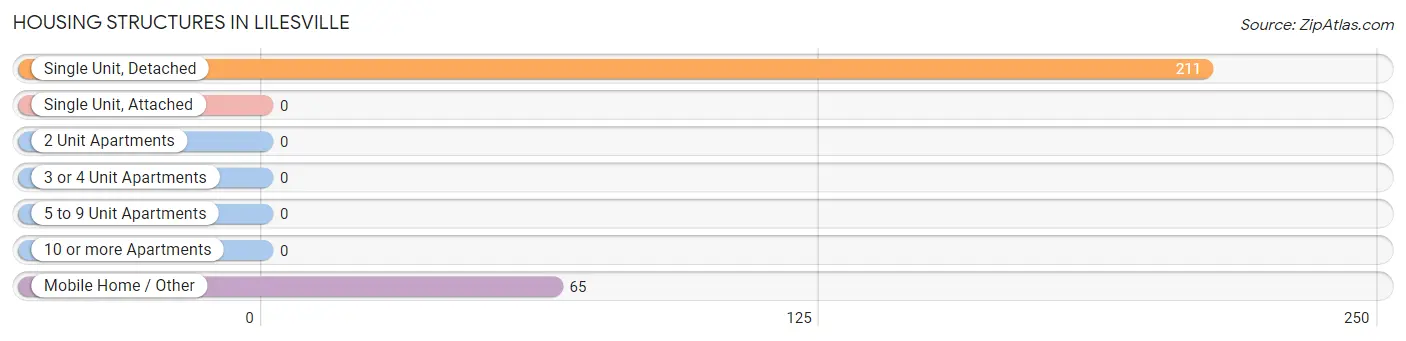
| Structure Type | # Housing Units | % Housing Units |
| Single Unit, Detached | 211 | 76.4% |
| Single Unit, Attached | 0 | 0.0% |
| 2 Unit Apartments | 0 | 0.0% |
| 3 or 4 Unit Apartments | 0 | 0.0% |
| 5 to 9 Unit Apartments | 0 | 0.0% |
| 10 or more Apartments | 0 | 0.0% |
| Mobile Home / Other | 65 | 23.5% |
| Total | 276 | 100.0% |
Housing Structures by Occupancy in Lilesville
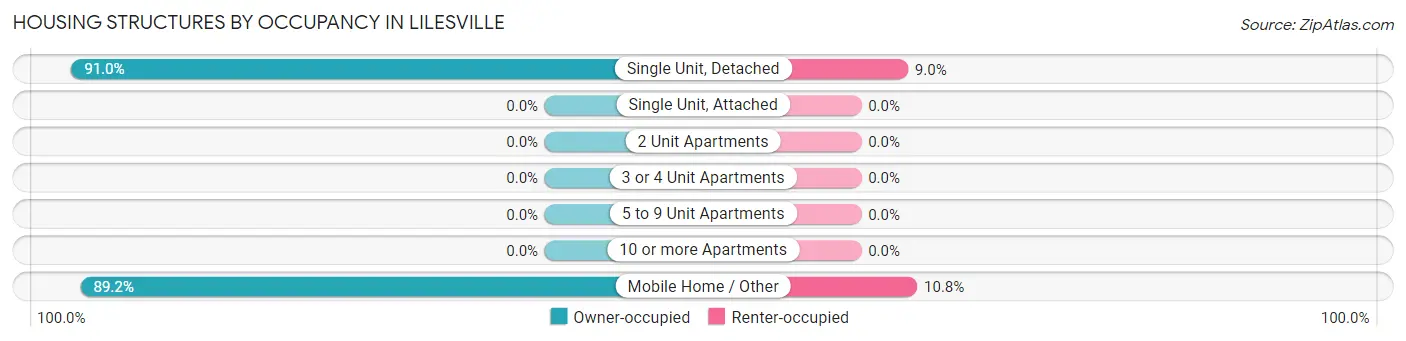
| Structure Type | Owner-occupied | Renter-occupied |
| Single Unit, Detached | 192 (91.0%) | 19 (9.0%) |
| Single Unit, Attached | 0 (0.0%) | 0 (0.0%) |
| 2 Unit Apartments | 0 (0.0%) | 0 (0.0%) |
| 3 or 4 Unit Apartments | 0 (0.0%) | 0 (0.0%) |
| 5 to 9 Unit Apartments | 0 (0.0%) | 0 (0.0%) |
| 10 or more Apartments | 0 (0.0%) | 0 (0.0%) |
| Mobile Home / Other | 58 (89.2%) | 7 (10.8%) |
| Total | 250 (90.6%) | 26 (9.4%) |
Housing Structures by Number of Rooms in Lilesville
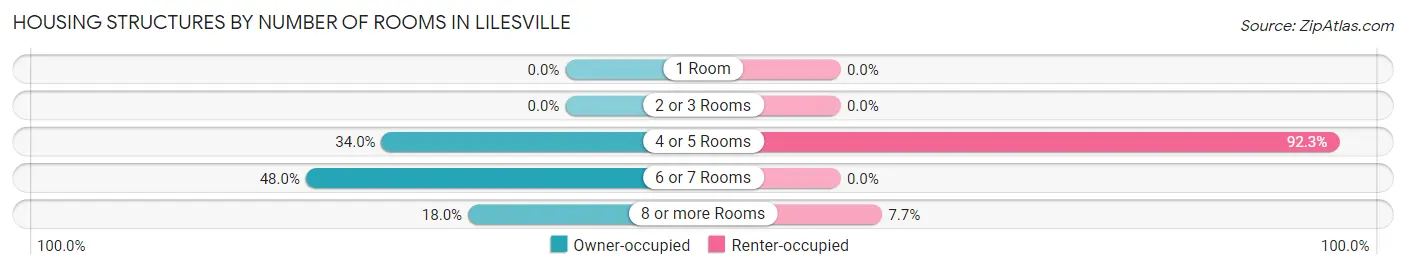
| Number of Rooms | Owner-occupied | Renter-occupied |
| 1 Room | 0 (0.0%) | 0 (0.0%) |
| 2 or 3 Rooms | 0 (0.0%) | 0 (0.0%) |
| 4 or 5 Rooms | 85 (34.0%) | 24 (92.3%) |
| 6 or 7 Rooms | 120 (48.0%) | 0 (0.0%) |
| 8 or more Rooms | 45 (18.0%) | 2 (7.7%) |
| Total | 250 (100.0%) | 26 (100.0%) |
Housing Structure by Heating Type in Lilesville
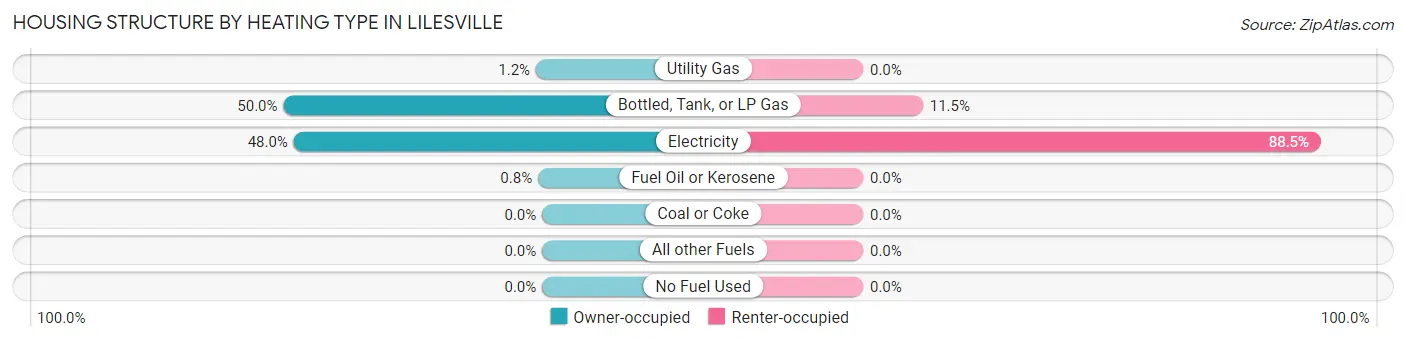
| Heating Type | Owner-occupied | Renter-occupied |
| Utility Gas | 3 (1.2%) | 0 (0.0%) |
| Bottled, Tank, or LP Gas | 125 (50.0%) | 3 (11.5%) |
| Electricity | 120 (48.0%) | 23 (88.5%) |
| Fuel Oil or Kerosene | 2 (0.8%) | 0 (0.0%) |
| Coal or Coke | 0 (0.0%) | 0 (0.0%) |
| All other Fuels | 0 (0.0%) | 0 (0.0%) |
| No Fuel Used | 0 (0.0%) | 0 (0.0%) |
| Total | 250 (100.0%) | 26 (100.0%) |
Household Vehicle Usage in Lilesville
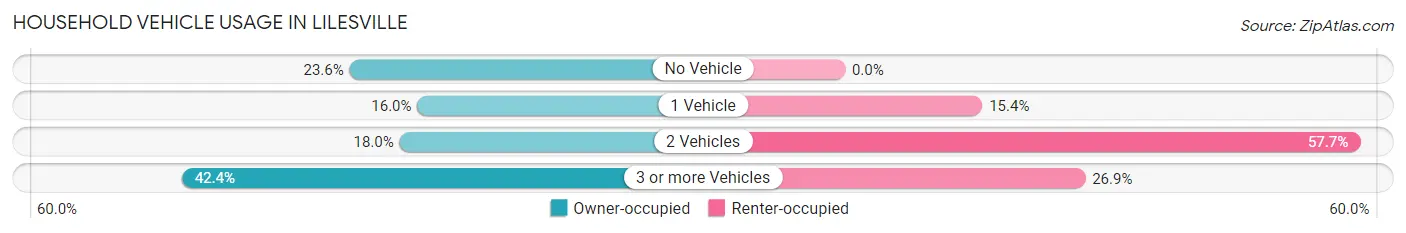
| Vehicles per Household | Owner-occupied | Renter-occupied |
| No Vehicle | 59 (23.6%) | 0 (0.0%) |
| 1 Vehicle | 40 (16.0%) | 4 (15.4%) |
| 2 Vehicles | 45 (18.0%) | 15 (57.7%) |
| 3 or more Vehicles | 106 (42.4%) | 7 (26.9%) |
| Total | 250 (100.0%) | 26 (100.0%) |
Real Estate & Mortgages in Lilesville
Real Estate and Mortgage Overview in Lilesville
| Characteristic | Without Mortgage | With Mortgage |
| Housing Units | 135 | 115 |
| Median Property Value | $180,400 | $107,100 |
| Median Household Income | - | - |
| Monthly Housing Costs | $464 | $0 |
| Real Estate Taxes | $1,900 | $6 |
Property Value by Mortgage Status in Lilesville
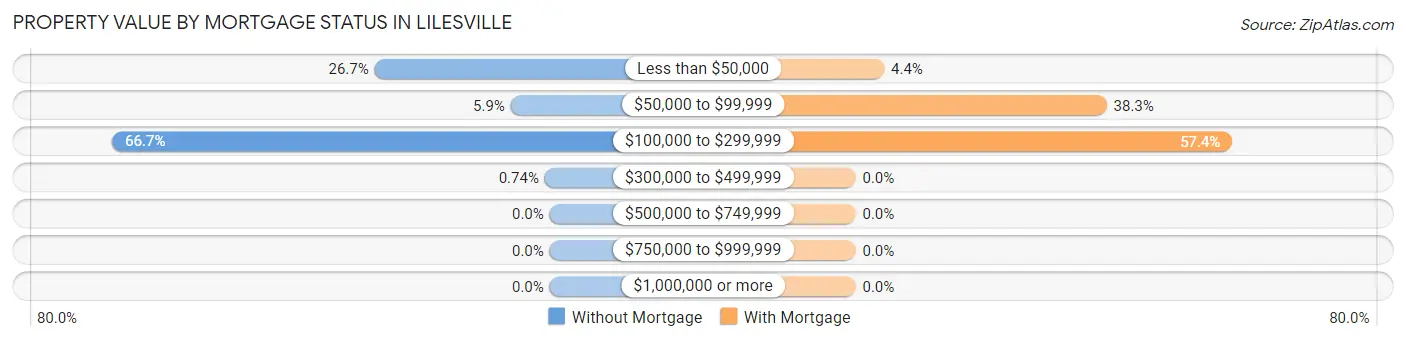
| Property Value | Without Mortgage | With Mortgage |
| Less than $50,000 | 36 (26.7%) | 5 (4.3%) |
| $50,000 to $99,999 | 8 (5.9%) | 44 (38.3%) |
| $100,000 to $299,999 | 90 (66.7%) | 66 (57.4%) |
| $300,000 to $499,999 | 1 (0.7%) | 0 (0.0%) |
| $500,000 to $749,999 | 0 (0.0%) | 0 (0.0%) |
| $750,000 to $999,999 | 0 (0.0%) | 0 (0.0%) |
| $1,000,000 or more | 0 (0.0%) | 0 (0.0%) |
| Total | 135 (100.0%) | 115 (100.0%) |
Household Income by Mortgage Status in Lilesville
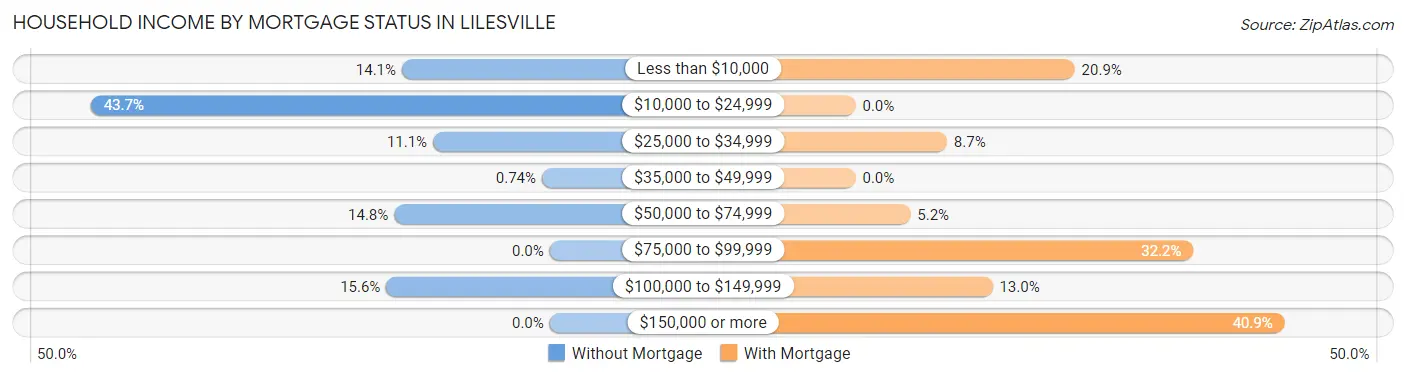
| Household Income | Without Mortgage | With Mortgage |
| Less than $10,000 | 19 (14.1%) | 24 (20.9%) |
| $10,000 to $24,999 | 59 (43.7%) | 0 (0.0%) |
| $25,000 to $34,999 | 15 (11.1%) | 10 (8.7%) |
| $35,000 to $49,999 | 1 (0.7%) | 0 (0.0%) |
| $50,000 to $74,999 | 20 (14.8%) | 6 (5.2%) |
| $75,000 to $99,999 | 0 (0.0%) | 37 (32.2%) |
| $100,000 to $149,999 | 21 (15.6%) | 15 (13.0%) |
| $150,000 or more | 0 (0.0%) | 47 (40.9%) |
| Total | 135 (100.0%) | 115 (100.0%) |
Property Value to Household Income Ratio in Lilesville
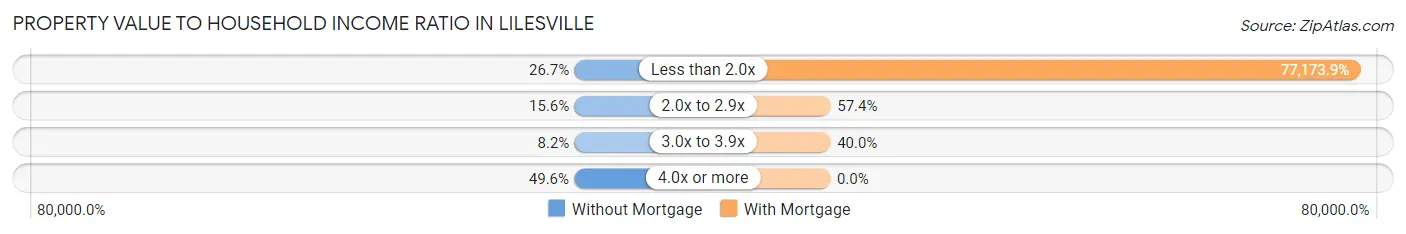
| Value-to-Income Ratio | Without Mortgage | With Mortgage |
| Less than 2.0x | 36 (26.7%) | 88,750 (77,173.9%) |
| 2.0x to 2.9x | 21 (15.6%) | 66 (57.4%) |
| 3.0x to 3.9x | 11 (8.2%) | 46 (40.0%) |
| 4.0x or more | 67 (49.6%) | 0 (0.0%) |
| Total | 135 (100.0%) | 115 (100.0%) |
Real Estate Taxes by Mortgage Status in Lilesville
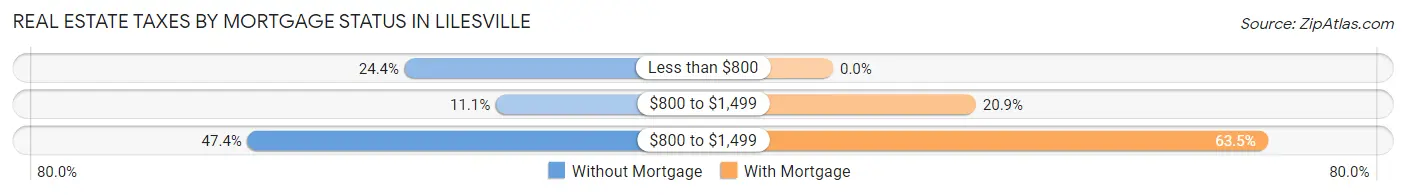
| Property Taxes | Without Mortgage | With Mortgage |
| Less than $800 | 33 (24.4%) | 0 (0.0%) |
| $800 to $1,499 | 15 (11.1%) | 24 (20.9%) |
| $800 to $1,499 | 64 (47.4%) | 73 (63.5%) |
| Total | 135 (100.0%) | 115 (100.0%) |
Health & Disability in Lilesville
Health Insurance Coverage by Age in Lilesville
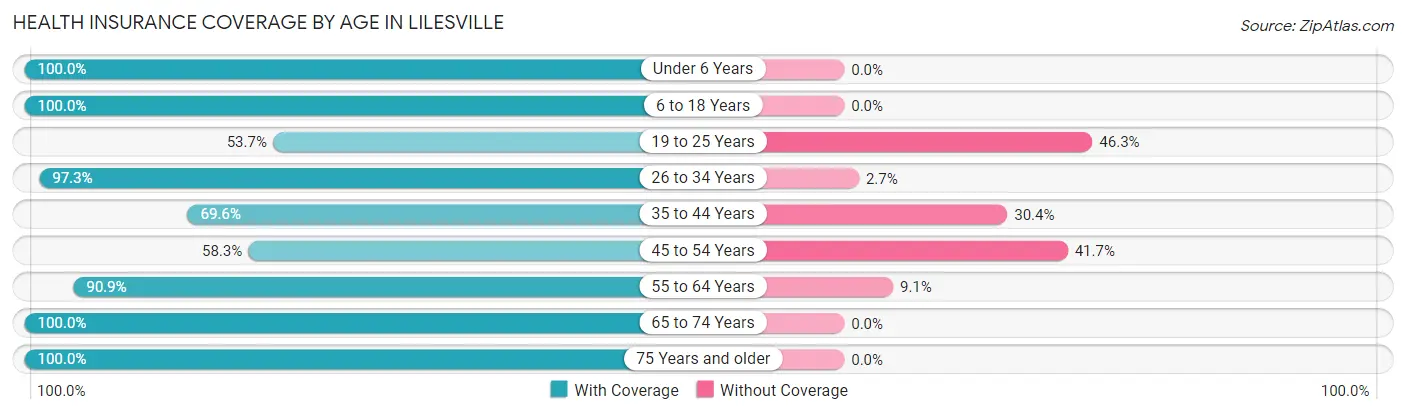
| Age Bracket | With Coverage | Without Coverage |
| Under 6 Years | 70 (100.0%) | 0 (0.0%) |
| 6 to 18 Years | 124 (100.0%) | 0 (0.0%) |
| 19 to 25 Years | 36 (53.7%) | 31 (46.3%) |
| 26 to 34 Years | 71 (97.3%) | 2 (2.7%) |
| 35 to 44 Years | 87 (69.6%) | 38 (30.4%) |
| 45 to 54 Years | 28 (58.3%) | 20 (41.7%) |
| 55 to 64 Years | 100 (90.9%) | 10 (9.1%) |
| 65 to 74 Years | 129 (100.0%) | 0 (0.0%) |
| 75 Years and older | 33 (100.0%) | 0 (0.0%) |
| Total | 678 (87.0%) | 101 (13.0%) |
Health Insurance Coverage by Citizenship Status in Lilesville
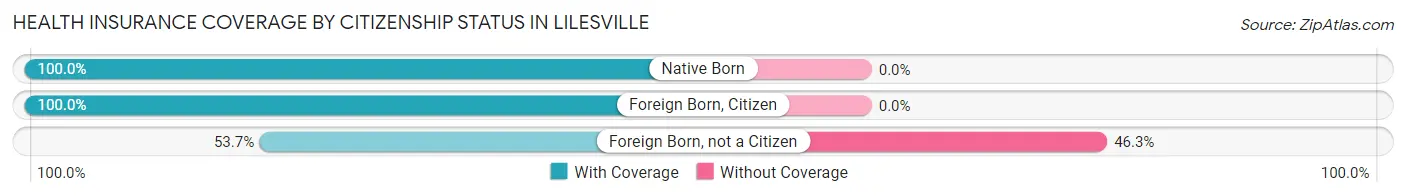
| Citizenship Status | With Coverage | Without Coverage |
| Native Born | 70 (100.0%) | 0 (0.0%) |
| Foreign Born, Citizen | 124 (100.0%) | 0 (0.0%) |
| Foreign Born, not a Citizen | 36 (53.7%) | 31 (46.3%) |
Health Insurance Coverage by Household Income in Lilesville
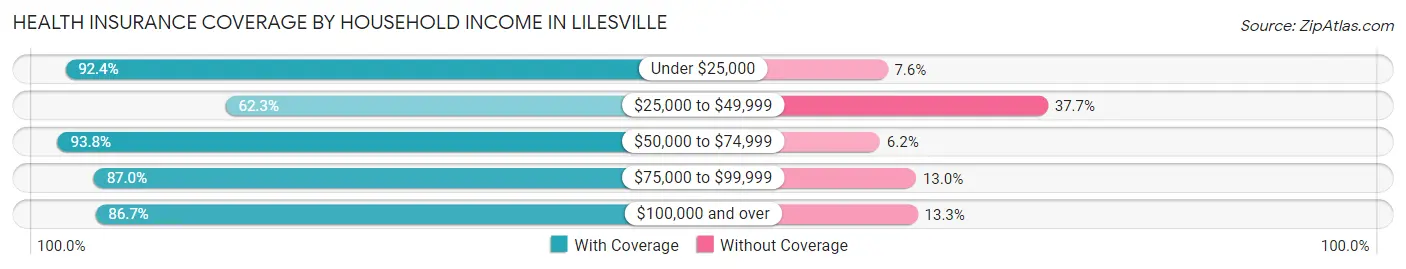
| Household Income | With Coverage | Without Coverage |
| Under $25,000 | 194 (92.4%) | 16 (7.6%) |
| $25,000 to $49,999 | 48 (62.3%) | 29 (37.7%) |
| $50,000 to $74,999 | 121 (93.8%) | 8 (6.2%) |
| $75,000 to $99,999 | 47 (87.0%) | 7 (13.0%) |
| $100,000 and over | 268 (86.7%) | 41 (13.3%) |
Public vs Private Health Insurance Coverage by Age in Lilesville
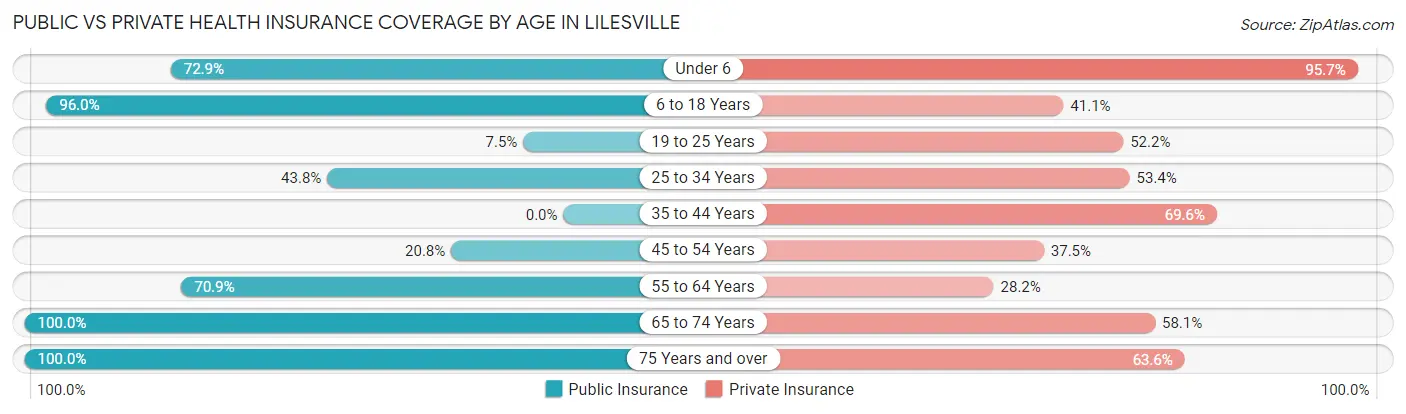
| Age Bracket | Public Insurance | Private Insurance |
| Under 6 | 51 (72.9%) | 67 (95.7%) |
| 6 to 18 Years | 119 (96.0%) | 51 (41.1%) |
| 19 to 25 Years | 5 (7.5%) | 35 (52.2%) |
| 25 to 34 Years | 32 (43.8%) | 39 (53.4%) |
| 35 to 44 Years | 0 (0.0%) | 87 (69.6%) |
| 45 to 54 Years | 10 (20.8%) | 18 (37.5%) |
| 55 to 64 Years | 78 (70.9%) | 31 (28.2%) |
| 65 to 74 Years | 129 (100.0%) | 75 (58.1%) |
| 75 Years and over | 33 (100.0%) | 21 (63.6%) |
| Total | 457 (58.7%) | 424 (54.4%) |
Disability Status by Sex by Age in Lilesville
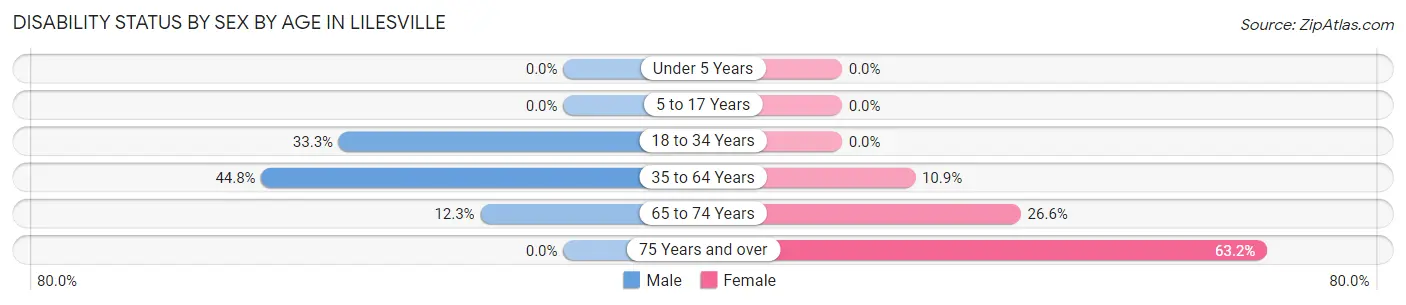
| Age Bracket | Male | Female |
| Under 5 Years | 0 (0.0%) | 0 (0.0%) |
| 5 to 17 Years | 0 (0.0%) | 0 (0.0%) |
| 18 to 34 Years | 12 (33.3%) | 0 (0.0%) |
| 35 to 64 Years | 65 (44.8%) | 15 (10.9%) |
| 65 to 74 Years | 8 (12.3%) | 17 (26.6%) |
| 75 Years and over | 0 (0.0%) | 12 (63.2%) |
Disability Class by Sex by Age in Lilesville
Disability Class: Hearing Difficulty
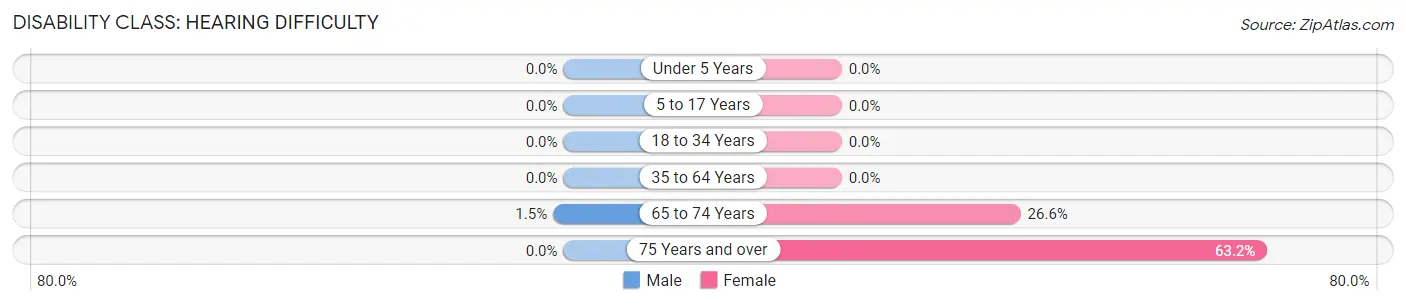
| Age Bracket | Male | Female |
| Under 5 Years | 0 (0.0%) | 0 (0.0%) |
| 5 to 17 Years | 0 (0.0%) | 0 (0.0%) |
| 18 to 34 Years | 0 (0.0%) | 0 (0.0%) |
| 35 to 64 Years | 0 (0.0%) | 0 (0.0%) |
| 65 to 74 Years | 1 (1.5%) | 17 (26.6%) |
| 75 Years and over | 0 (0.0%) | 12 (63.2%) |
Disability Class: Vision Difficulty
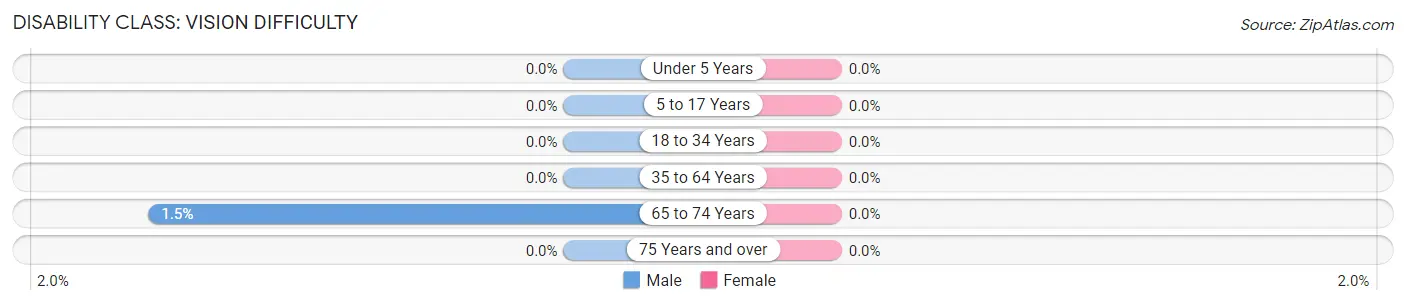
| Age Bracket | Male | Female |
| Under 5 Years | 0 (0.0%) | 0 (0.0%) |
| 5 to 17 Years | 0 (0.0%) | 0 (0.0%) |
| 18 to 34 Years | 0 (0.0%) | 0 (0.0%) |
| 35 to 64 Years | 0 (0.0%) | 0 (0.0%) |
| 65 to 74 Years | 1 (1.5%) | 0 (0.0%) |
| 75 Years and over | 0 (0.0%) | 0 (0.0%) |
Disability Class: Cognitive Difficulty
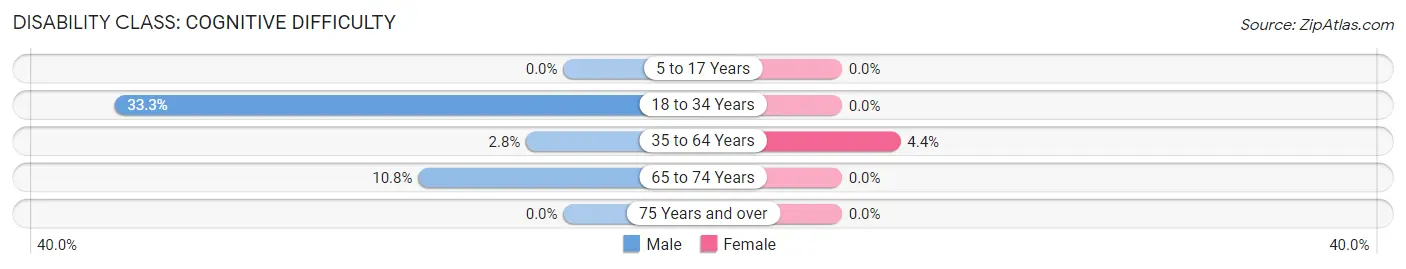
| Age Bracket | Male | Female |
| 5 to 17 Years | 0 (0.0%) | 0 (0.0%) |
| 18 to 34 Years | 12 (33.3%) | 0 (0.0%) |
| 35 to 64 Years | 4 (2.8%) | 6 (4.3%) |
| 65 to 74 Years | 7 (10.8%) | 0 (0.0%) |
| 75 Years and over | 0 (0.0%) | 0 (0.0%) |
Disability Class: Ambulatory Difficulty
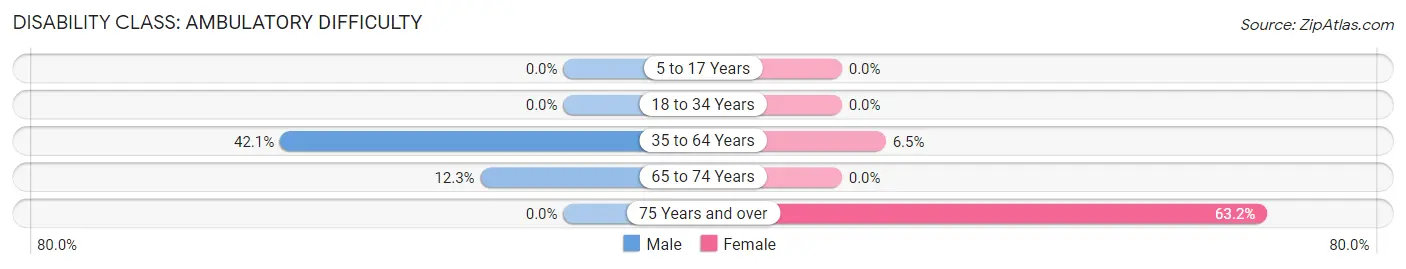
| Age Bracket | Male | Female |
| 5 to 17 Years | 0 (0.0%) | 0 (0.0%) |
| 18 to 34 Years | 0 (0.0%) | 0 (0.0%) |
| 35 to 64 Years | 61 (42.1%) | 9 (6.5%) |
| 65 to 74 Years | 8 (12.3%) | 0 (0.0%) |
| 75 Years and over | 0 (0.0%) | 12 (63.2%) |
Disability Class: Self-Care Difficulty
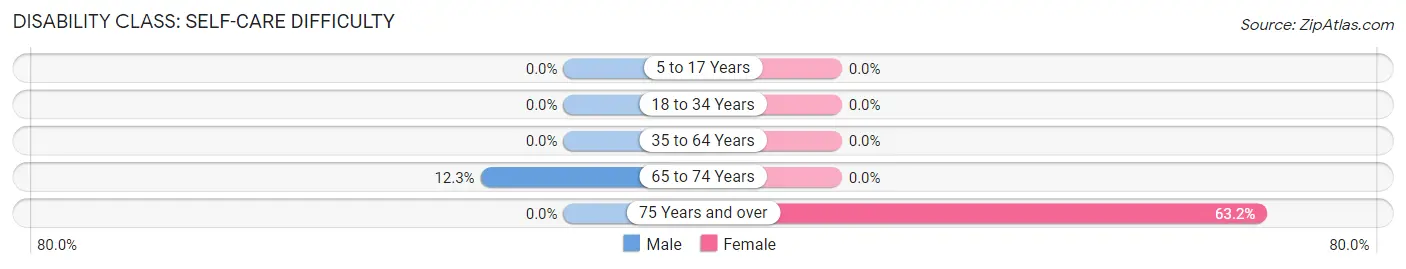
| Age Bracket | Male | Female |
| 5 to 17 Years | 0 (0.0%) | 0 (0.0%) |
| 18 to 34 Years | 0 (0.0%) | 0 (0.0%) |
| 35 to 64 Years | 0 (0.0%) | 0 (0.0%) |
| 65 to 74 Years | 8 (12.3%) | 0 (0.0%) |
| 75 Years and over | 0 (0.0%) | 12 (63.2%) |
Technology Access in Lilesville
Computing Device Access in Lilesville
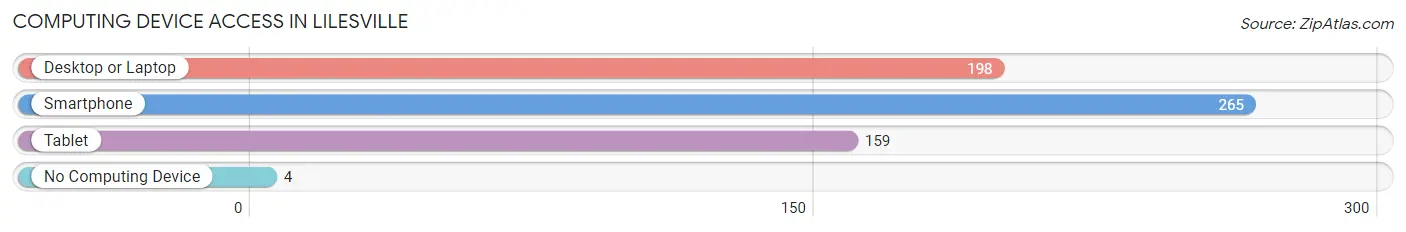
| Device Type | # Households | % Households |
| Desktop or Laptop | 198 | 71.7% |
| Smartphone | 265 | 96.0% |
| Tablet | 159 | 57.6% |
| No Computing Device | 4 | 1.5% |
| Total | 276 | 100.0% |
Internet Access in Lilesville
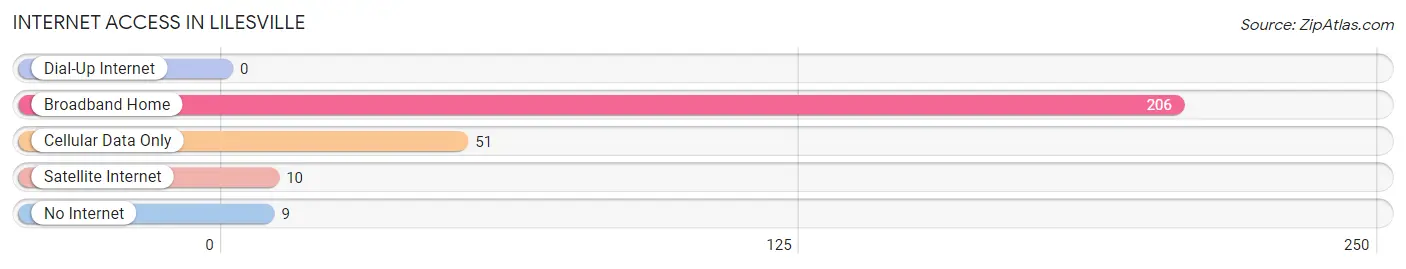
| Internet Type | # Households | % Households |
| Dial-Up Internet | 0 | 0.0% |
| Broadband Home | 206 | 74.6% |
| Cellular Data Only | 51 | 18.5% |
| Satellite Internet | 10 | 3.6% |
| No Internet | 9 | 3.3% |
| Total | 276 | 100.0% |
Lilesville Summary
Lilesville is a small town located in Anson County, North Carolina. It is situated in the Pee Dee region of the state, approximately 40 miles east of Charlotte. The town was founded in 1887 and named after the Liles family, who were early settlers in the area. The population of Lilesville was estimated to be 545 in 2019.
Geography
Lilesville is located in the Pee Dee region of North Carolina, in the southeastern part of the state. It is situated in Anson County, approximately 40 miles east of Charlotte. The town is located on the banks of the Pee Dee River, which is a major tributary of the Cape Fear River. The town is surrounded by rolling hills and farmland, and is home to several small lakes. The climate in Lilesville is humid subtropical, with hot summers and mild winters.
Economy
The economy of Lilesville is largely based on agriculture. The town is home to several farms, which produce a variety of crops, including corn, soybeans, cotton, and tobacco. The town is also home to several small businesses, including a grocery store, a hardware store, and a few restaurants. The town is also home to a few manufacturing companies, which produce a variety of products, including furniture, textiles, and automotive parts.
Demographics
As of 2019, the population of Lilesville was estimated to be 545. The town is predominantly white, with a small African American population. The median household income in Lilesville is $35,000, and the median home value is $90,000. The town has a low unemployment rate, and the majority of the population is employed in the agricultural and manufacturing industries.
History
Lilesville was founded in 1887 and named after the Liles family, who were early settlers in the area. The town was originally a farming community, and the economy was largely based on agriculture. In the early 1900s, the town began to grow and develop, and several small businesses were established. In the 1950s, the town began to experience a decline in population, as many of the residents moved to larger cities in search of better job opportunities. In recent years, the town has seen a resurgence in population, as many people have moved back to the area in search of a more rural lifestyle.
Lilesville is a small town with a rich history and a bright future. The town is home to a diverse population, and the economy is largely based on agriculture and small businesses. The town is also home to several lakes and rolling hills, making it a great place to live and visit.
Common Questions
What is Per Capita Income in Lilesville?
Per Capita income in Lilesville is $21,075.
What is the Median Family Income in Lilesville?
Median Family Income in Lilesville is $60,962.
What is the Median Household income in Lilesville?
Median Household Income in Lilesville is $51,538.
What is Income or Wage Gap in Lilesville?
Income or Wage Gap in Lilesville is 58.7%.
Women in Lilesville earn 41.3 cents for every dollar earned by a man.
What is Family Income Deficit in Lilesville?
Family Income Deficit in Lilesville is $7,723.
Families that are below poverty line in Lilesville earn $7,723 less on average than the poverty threshold level.
What is Inequality or Gini Index in Lilesville?
Inequality or Gini Index in Lilesville is 0.42.
What is the Total Population of Lilesville?
Total Population of Lilesville is 779.
What is the Total Male Population of Lilesville?
Total Male Population of Lilesville is 414.
What is the Total Female Population of Lilesville?
Total Female Population of Lilesville is 365.
What is the Ratio of Males per 100 Females in Lilesville?
There are 113.42 Males per 100 Females in Lilesville.
What is the Ratio of Females per 100 Males in Lilesville?
There are 88.16 Females per 100 Males in Lilesville.
What is the Median Population Age in Lilesville?
Median Population Age in Lilesville is 39.3 Years.
What is the Average Family Size in Lilesville
Average Family Size in Lilesville is 3.8 People.
What is the Average Household Size in Lilesville
Average Household Size in Lilesville is 2.8 People.
How Large is the Labor Force in Lilesville?
There are 276 People in the Labor Forcein in Lilesville.
What is the Percentage of People in the Labor Force in Lilesville?
46.4% of People are in the Labor Force in Lilesville.
What is the Unemployment Rate in Lilesville?
Unemployment Rate in Lilesville is 10.5%.