Lattimore, NC Map & Demographics
Lattimore Map
Lattimore Overview
$18,634
PER CAPITA INCOME
$73,500
AVG FAMILY INCOME
$68,125
AVG HOUSEHOLD INCOME
0.32
INEQUALITY / GINI INDEX
557
TOTAL POPULATION
321
MALE POPULATION
236
FEMALE POPULATION
136.02
MALES / 100 FEMALES
73.52
FEMALES / 100 MALES
31.7
MEDIAN AGE
4.8
AVG FAMILY SIZE
4.2
AVG HOUSEHOLD SIZE
299
LABOR FORCE [ PEOPLE ]
61.9%
PERCENT IN LABOR FORCE
1.7%
UNEMPLOYMENT RATE
Lattimore Zip Codes
Lattimore Area Codes
Income in Lattimore
Income Overview in Lattimore
Per Capita Income in Lattimore is $18,634, while median incomes of families and households are $73,500 and $68,125 respectively.
| Characteristic | Number | Measure |
| Per Capita Income | 557 | $18,634 |
| Median Family Income | 92 | $73,500 |
| Mean Family Income | 92 | $73,703 |
| Median Household Income | 115 | $68,125 |
| Mean Household Income | 115 | $69,498 |
| Income Deficit | 92 | $0 |
| Wage / Income Gap (%) | 557 | 0.00% |
| Wage / Income Gap ($) | 557 | 100.00¢ per $1 |
| Gini / Inequality Index | 557 | 0.32 |
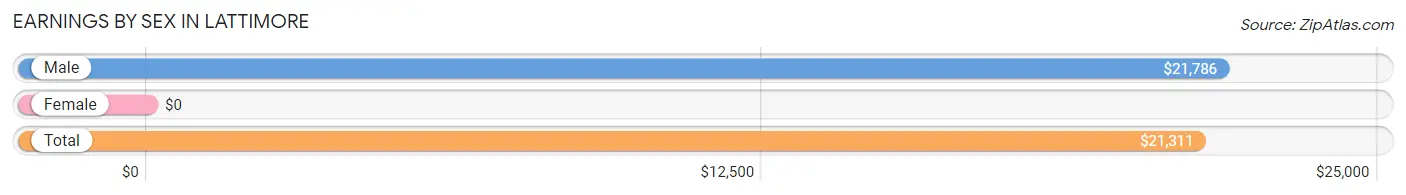
Earnings by Sex in Lattimore
| Sex | Number | Average Earnings |
| Male | 168 (54.7%) | $21,786 |
| Female | 139 (45.3%) | $0 |
| Total | 307 (100.0%) | $21,311 |
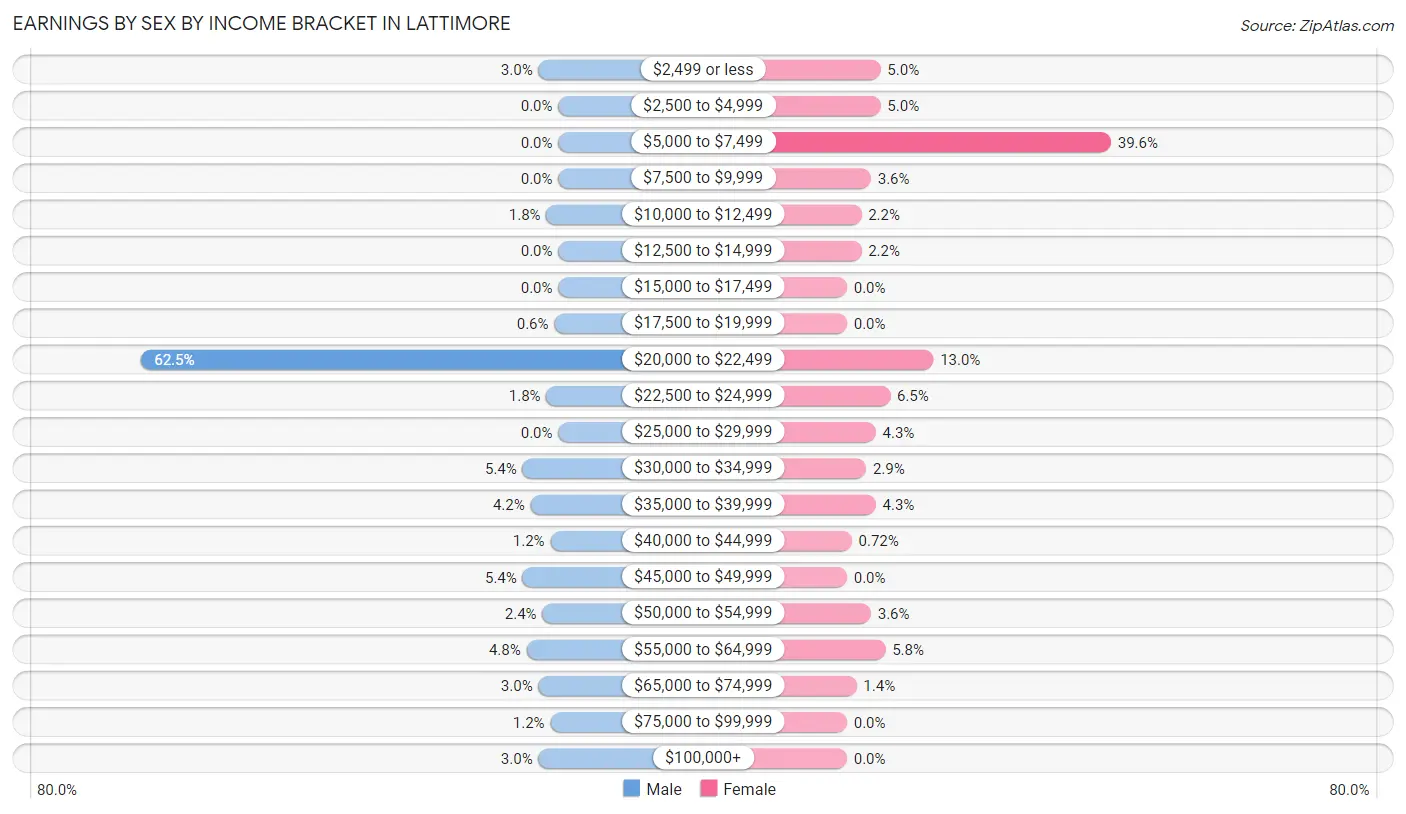
Earnings by Sex by Income Bracket in Lattimore
The most common earnings brackets in Lattimore are $20,000 to $22,499 for men (105 | 62.5%) and $5,000 to $7,499 for women (55 | 39.6%).
| Income | Male | Female |
| $2,499 or less | 5 (3.0%) | 7 (5.0%) |
| $2,500 to $4,999 | 0 (0.0%) | 7 (5.0%) |
| $5,000 to $7,499 | 0 (0.0%) | 55 (39.6%) |
| $7,500 to $9,999 | 0 (0.0%) | 5 (3.6%) |
| $10,000 to $12,499 | 3 (1.8%) | 3 (2.2%) |
| $12,500 to $14,999 | 0 (0.0%) | 3 (2.2%) |
| $15,000 to $17,499 | 0 (0.0%) | 0 (0.0%) |
| $17,500 to $19,999 | 1 (0.6%) | 0 (0.0%) |
| $20,000 to $22,499 | 105 (62.5%) | 18 (13.0%) |
| $22,500 to $24,999 | 3 (1.8%) | 9 (6.5%) |
| $25,000 to $29,999 | 0 (0.0%) | 6 (4.3%) |
| $30,000 to $34,999 | 9 (5.4%) | 4 (2.9%) |
| $35,000 to $39,999 | 7 (4.2%) | 6 (4.3%) |
| $40,000 to $44,999 | 2 (1.2%) | 1 (0.7%) |
| $45,000 to $49,999 | 9 (5.4%) | 0 (0.0%) |
| $50,000 to $54,999 | 4 (2.4%) | 5 (3.6%) |
| $55,000 to $64,999 | 8 (4.8%) | 8 (5.8%) |
| $65,000 to $74,999 | 5 (3.0%) | 2 (1.4%) |
| $75,000 to $99,999 | 2 (1.2%) | 0 (0.0%) |
| $100,000+ | 5 (3.0%) | 0 (0.0%) |
| Total | 168 (100.0%) | 139 (100.0%) |
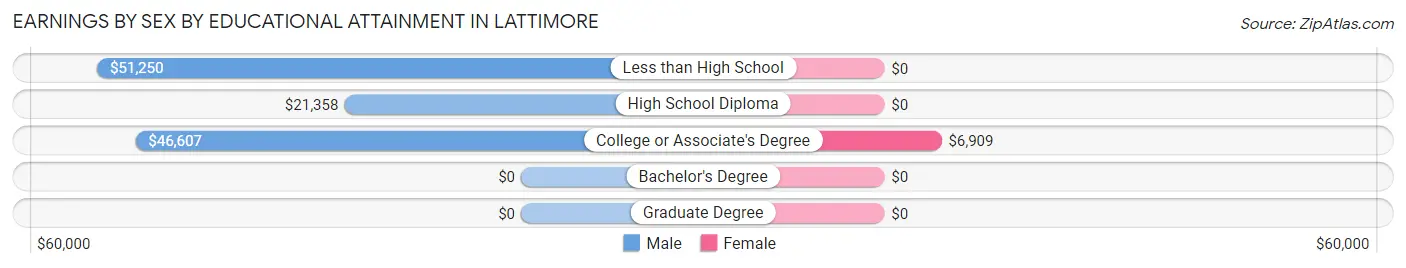
Earnings by Sex by Educational Attainment in Lattimore
| Educational Attainment | Male Income | Female Income |
| Less than High School | $51,250 | $0 |
| High School Diploma | $21,358 | $0 |
| College or Associate's Degree | $46,607 | $6,909 |
| Bachelor's Degree | - | - |
| Graduate Degree | - | - |
| Total | $21,607 | $0 |
Family Income in Lattimore
Family Income Brackets in Lattimore
According to the Lattimore family income data, there are 26 families falling into the $50,000 to $74,999 income range, which is the most common income bracket and makes up 28.3% of all families.
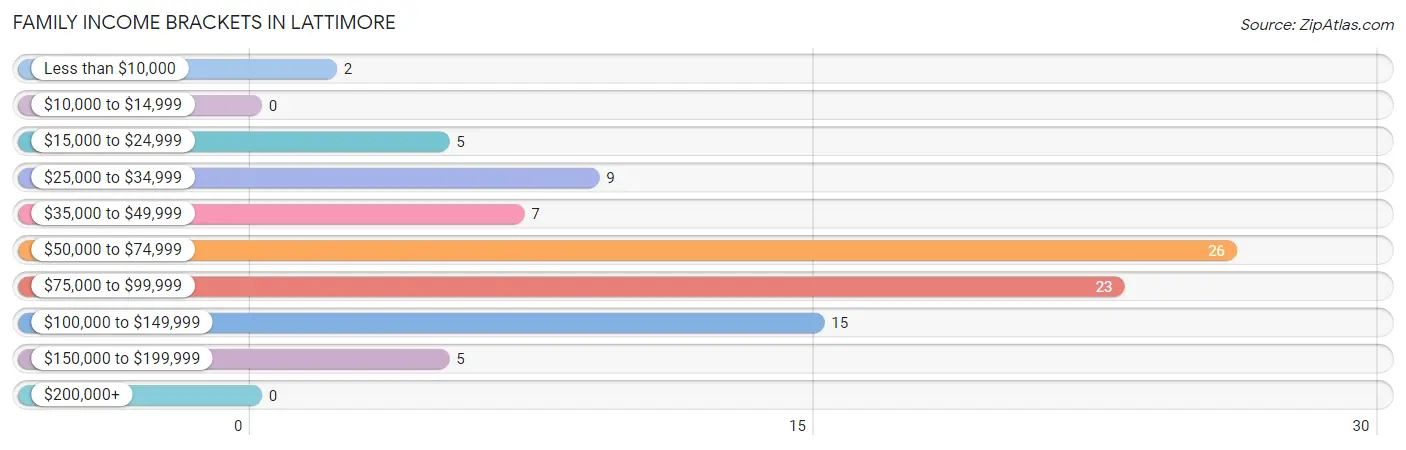
| Income Bracket | # Families | % Families |
| Less than $10,000 | 2 | 2.2% |
| $10,000 to $14,999 | 0 | 0.0% |
| $15,000 to $24,999 | 5 | 5.4% |
| $25,000 to $34,999 | 9 | 9.8% |
| $35,000 to $49,999 | 7 | 7.6% |
| $50,000 to $74,999 | 26 | 28.3% |
| $75,000 to $99,999 | 23 | 25.0% |
| $100,000 to $149,999 | 15 | 16.3% |
| $150,000 to $199,999 | 5 | 5.4% |
| $200,000+ | 0 | 0.0% |
Family Income by Famaliy Size in Lattimore
5-person families (11 | 12.0%) account for the highest median family income in Lattimore with $94,375 per family, while 3-person families (36 | 39.1%) have the highest median income of $26,204 per family member.
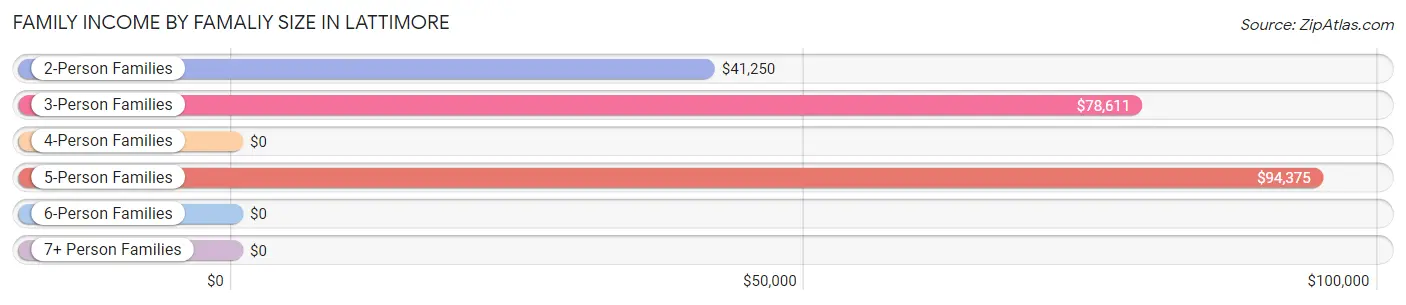
| Income Bracket | # Families | Median Income |
| 2-Person Families | 36 (39.1%) | $41,250 |
| 3-Person Families | 36 (39.1%) | $78,611 |
| 4-Person Families | 8 (8.7%) | $0 |
| 5-Person Families | 11 (12.0%) | $94,375 |
| 6-Person Families | 1 (1.1%) | $0 |
| 7+ Person Families | 0 (0.0%) | $0 |
| Total | 92 (100.0%) | $73,500 |
Family Income by Number of Earners in Lattimore
The median family income in Lattimore is $73,500, with families comprising 2 earners (22) having the highest median family income of $93,750, while families with 1 earner (21) have the lowest median family income of $39,792, accounting for 23.9% and 22.8% of families, respectively.
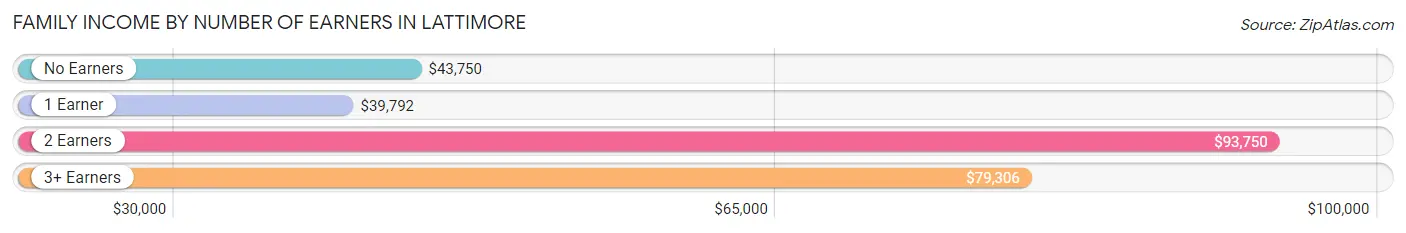
| Number of Earners | # Families | Median Income |
| No Earners | 23 (25.0%) | $43,750 |
| 1 Earner | 21 (22.8%) | $39,792 |
| 2 Earners | 22 (23.9%) | $93,750 |
| 3+ Earners | 26 (28.3%) | $79,306 |
| Total | 92 (100.0%) | $73,500 |
Household Income in Lattimore
Household Income Brackets in Lattimore
With 33 households falling in the category, the $50,000 to $74,999 income range is the most frequent in Lattimore, accounting for 28.7% of all households.
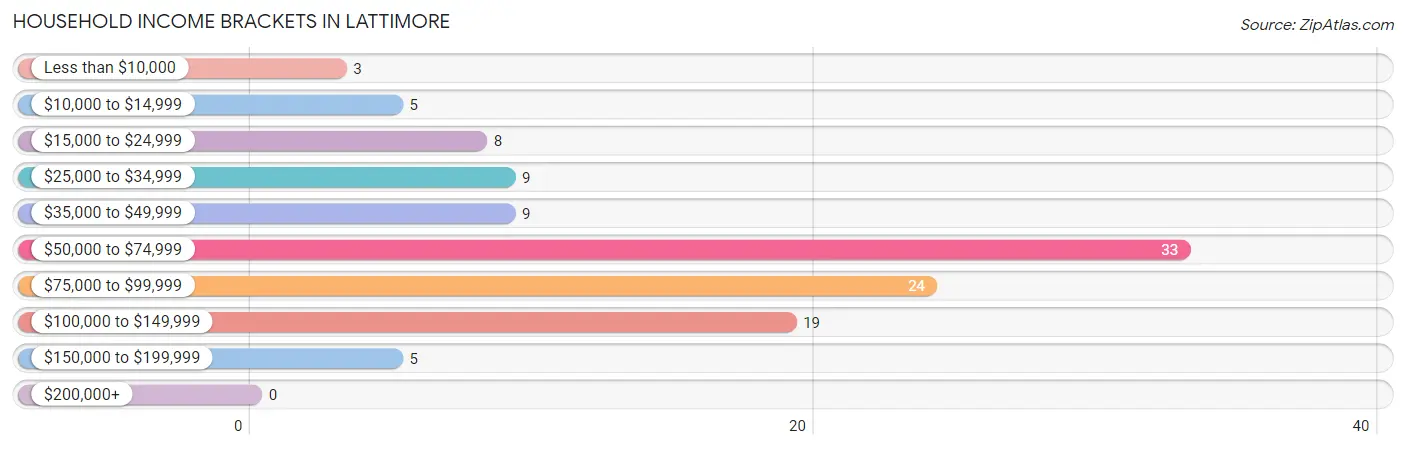
| Income Bracket | # Households | % Households |
| Less than $10,000 | 3 | 2.6% |
| $10,000 to $14,999 | 5 | 4.3% |
| $15,000 to $24,999 | 8 | 7.0% |
| $25,000 to $34,999 | 9 | 7.8% |
| $35,000 to $49,999 | 9 | 7.8% |
| $50,000 to $74,999 | 33 | 28.7% |
| $75,000 to $99,999 | 24 | 20.9% |
| $100,000 to $149,999 | 19 | 16.5% |
| $150,000 to $199,999 | 5 | 4.3% |
| $200,000+ | 0 | 0.0% |
Household Income by Householder Age in Lattimore
The median household income in Lattimore is $68,125, with the highest median household income of $93,750 found in the 45 to 64 years age bracket for the primary householder. A total of 26 households (22.6%) fall into this category. Meanwhile, the 15 to 24 years age bracket for the primary householder has the lowest median household income of $56,875, with 14 households (12.2%) in this group.
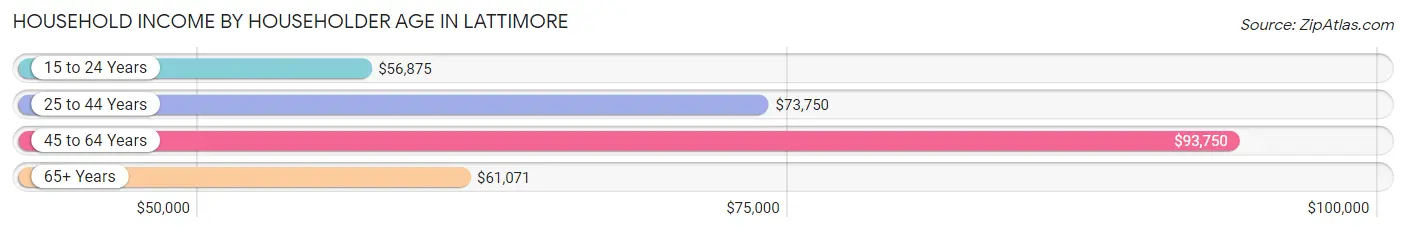
| Income Bracket | # Households | Median Income |
| 15 to 24 Years | 14 (12.2%) | $56,875 |
| 25 to 44 Years | 15 (13.0%) | $73,750 |
| 45 to 64 Years | 26 (22.6%) | $93,750 |
| 65+ Years | 60 (52.2%) | $61,071 |
| Total | 115 (100.0%) | $68,125 |
Poverty in Lattimore
Income Below Poverty by Sex and Age in Lattimore
With 2.5% poverty level for males and 4.6% for females among the residents of Lattimore, 65 to 74 year old males and 65 to 74 year old females are the most vulnerable to poverty, with 5 males (20.8%) and 7 females (29.2%) in their respective age groups living below the poverty level.
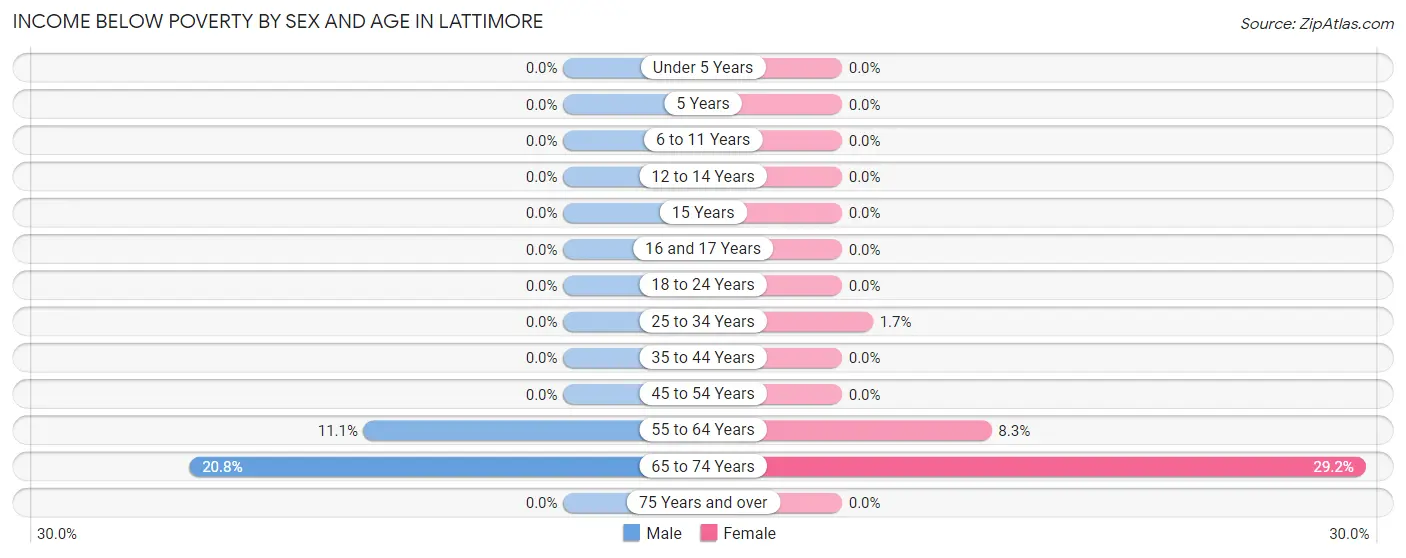
| Age Bracket | Male | Female |
| Under 5 Years | 0 (0.0%) | 0 (0.0%) |
| 5 Years | 0 (0.0%) | 0 (0.0%) |
| 6 to 11 Years | 0 (0.0%) | 0 (0.0%) |
| 12 to 14 Years | 0 (0.0%) | 0 (0.0%) |
| 15 Years | 0 (0.0%) | 0 (0.0%) |
| 16 and 17 Years | 0 (0.0%) | 0 (0.0%) |
| 18 to 24 Years | 0 (0.0%) | 0 (0.0%) |
| 25 to 34 Years | 0 (0.0%) | 1 (1.7%) |
| 35 to 44 Years | 0 (0.0%) | 0 (0.0%) |
| 45 to 54 Years | 0 (0.0%) | 0 (0.0%) |
| 55 to 64 Years | 2 (11.1%) | 1 (8.3%) |
| 65 to 74 Years | 5 (20.8%) | 7 (29.2%) |
| 75 Years and over | 0 (0.0%) | 0 (0.0%) |
| Total | 7 (2.5%) | 9 (4.6%) |
Income Above Poverty by Sex and Age in Lattimore
According to the poverty statistics in Lattimore, males aged under 5 years and females aged under 5 years are the age groups that are most secure financially, with 100.0% of males and 100.0% of females in these age groups living above the poverty line.
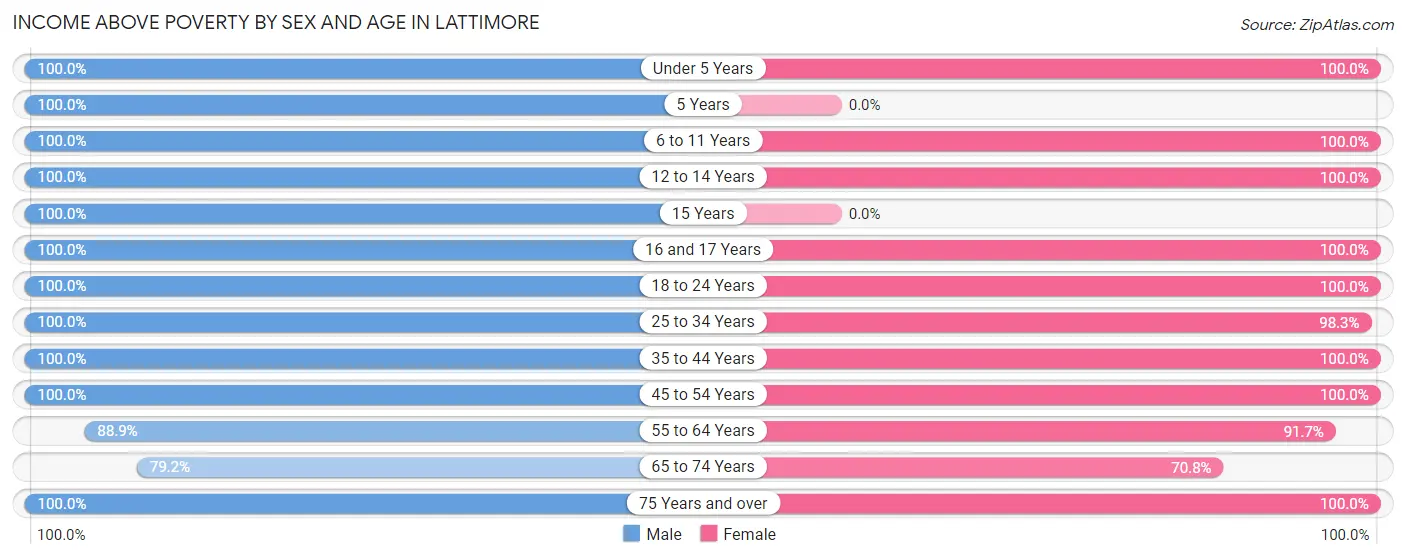
| Age Bracket | Male | Female |
| Under 5 Years | 13 (100.0%) | 11 (100.0%) |
| 5 Years | 8 (100.0%) | 0 (0.0%) |
| 6 to 11 Years | 15 (100.0%) | 2 (100.0%) |
| 12 to 14 Years | 18 (100.0%) | 5 (100.0%) |
| 15 Years | 2 (100.0%) | 0 (0.0%) |
| 16 and 17 Years | 6 (100.0%) | 5 (100.0%) |
| 18 to 24 Years | 30 (100.0%) | 10 (100.0%) |
| 25 to 34 Years | 105 (100.0%) | 57 (98.3%) |
| 35 to 44 Years | 8 (100.0%) | 8 (100.0%) |
| 45 to 54 Years | 23 (100.0%) | 29 (100.0%) |
| 55 to 64 Years | 16 (88.9%) | 11 (91.7%) |
| 65 to 74 Years | 19 (79.2%) | 17 (70.8%) |
| 75 Years and over | 12 (100.0%) | 32 (100.0%) |
| Total | 275 (97.5%) | 187 (95.4%) |
Income Below Poverty Among Married-Couple Families in Lattimore
The poverty statistics for married-couple families in Lattimore show that 3.2% or 2 of the total 62 families live below the poverty line. Families with no children have the highest poverty rate of 4.9%, comprising of 2 families. On the other hand, families with 1 or 2 children have the lowest poverty rate of 0.0%, which includes 0 families.
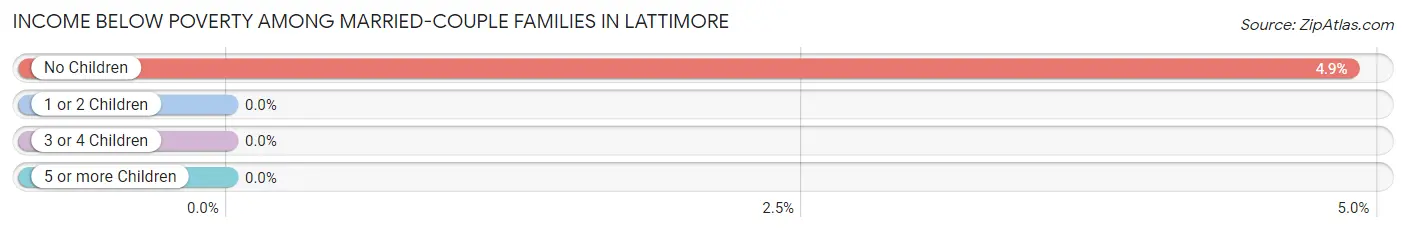
| Children | Above Poverty | Below Poverty |
| No Children | 39 (95.1%) | 2 (4.9%) |
| 1 or 2 Children | 15 (100.0%) | 0 (0.0%) |
| 3 or 4 Children | 6 (100.0%) | 0 (0.0%) |
| 5 or more Children | 0 (0.0%) | 0 (0.0%) |
| Total | 60 (96.8%) | 2 (3.2%) |
Income Below Poverty Among Single-Parent Households in Lattimore
| Children | Single Father | Single Mother |
| No Children | 0 (0.0%) | 0 (0.0%) |
| 1 or 2 Children | 0 (0.0%) | 0 (0.0%) |
| 3 or 4 Children | 0 (0.0%) | 0 (0.0%) |
| 5 or more Children | 0 (0.0%) | 0 (0.0%) |
| Total | 0 (0.0%) | 0 (0.0%) |
Income Below Poverty Among Married-Couple vs Single-Parent Households in Lattimore
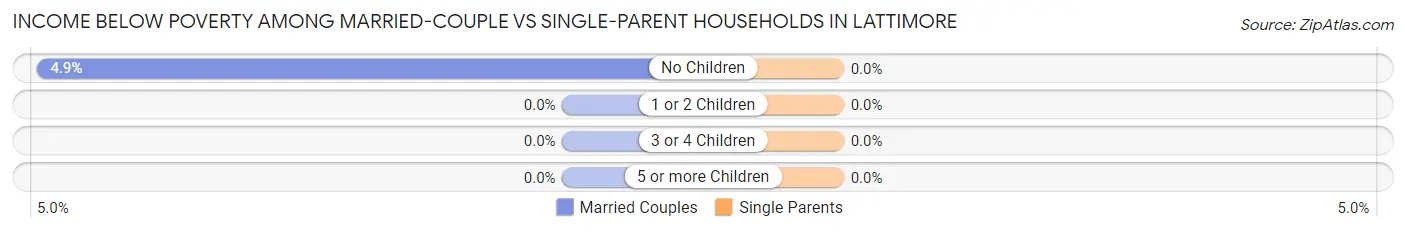
| Children | Married-Couple Families | Single-Parent Households |
| No Children | 2 (4.9%) | 0 (0.0%) |
| 1 or 2 Children | 0 (0.0%) | 0 (0.0%) |
| 3 or 4 Children | 0 (0.0%) | 0 (0.0%) |
| 5 or more Children | 0 (0.0%) | 0 (0.0%) |
| Total | 2 (3.2%) | 0 (0.0%) |
Race in Lattimore
The most populous races in Lattimore are White / Caucasian (542 | 97.3%), Hispanic or Latino (12 | 2.1%), and Two or more Races (12 | 2.1%).
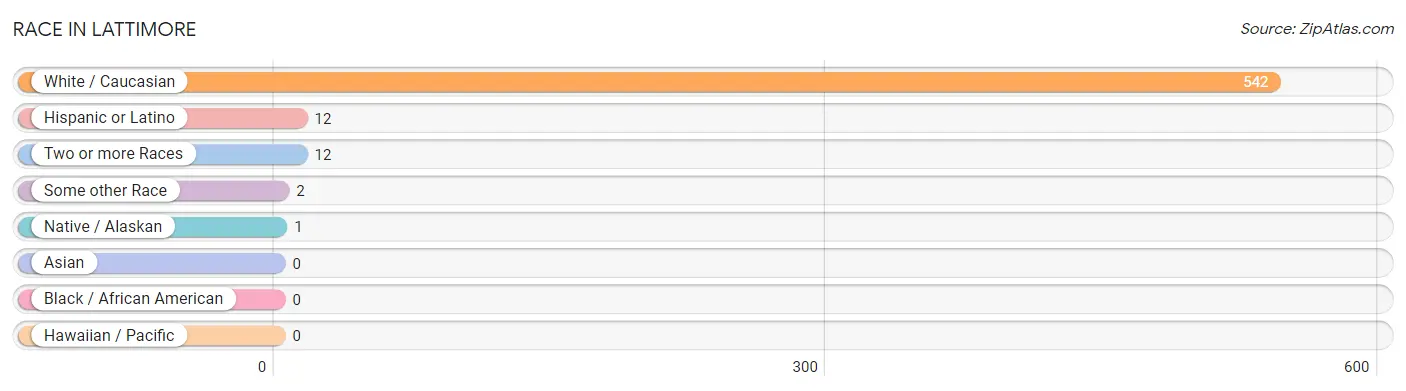
| Race | # Population | % Population |
| Asian | 0 | 0.0% |
| Black / African American | 0 | 0.0% |
| Hawaiian / Pacific | 0 | 0.0% |
| Hispanic or Latino | 12 | 2.1% |
| Native / Alaskan | 1 | 0.2% |
| White / Caucasian | 542 | 97.3% |
| Two or more Races | 12 | 2.1% |
| Some other Race | 2 | 0.4% |
| Total | 557 | 100.0% |
Ancestry in Lattimore
The most populous ancestries reported in Lattimore are American (326 | 58.5%), English (43 | 7.7%), German (17 | 3.0%), Scotch-Irish (15 | 2.7%), and Italian (13 | 2.3%), together accounting for 74.3% of all Lattimore residents.
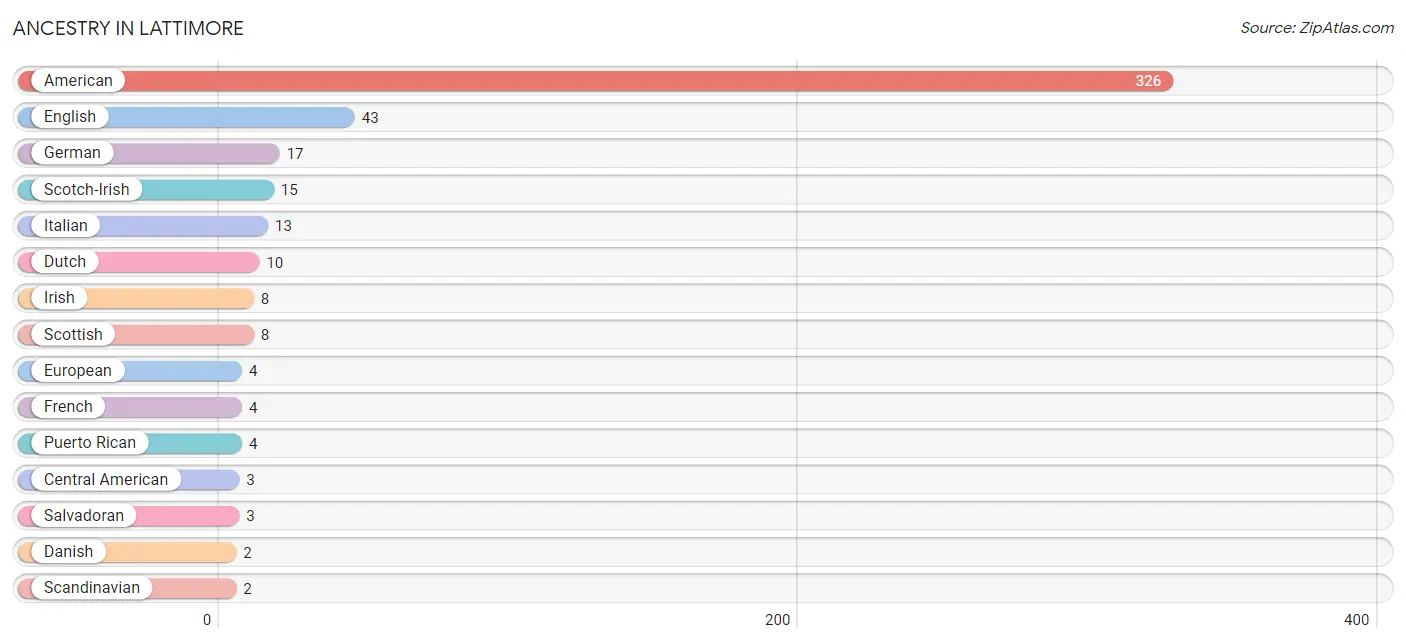
| Ancestry | # Population | % Population |
| American | 326 | 58.5% |
| Belgian | 1 | 0.2% |
| Central American | 3 | 0.5% |
| Danish | 2 | 0.4% |
| Dutch | 10 | 1.8% |
| English | 43 | 7.7% |
| European | 4 | 0.7% |
| French | 4 | 0.7% |
| German | 17 | 3.0% |
| Irish | 8 | 1.4% |
| Italian | 13 | 2.3% |
| Lumbee | 1 | 0.2% |
| Mexican | 1 | 0.2% |
| Puerto Rican | 4 | 0.7% |
| Salvadoran | 3 | 0.5% |
| Scandinavian | 2 | 0.4% |
| Scotch-Irish | 15 | 2.7% |
| Scottish | 8 | 1.4% |
| Ukrainian | 1 | 0.2% | View All 19 Rows |
Immigrants in Lattimore
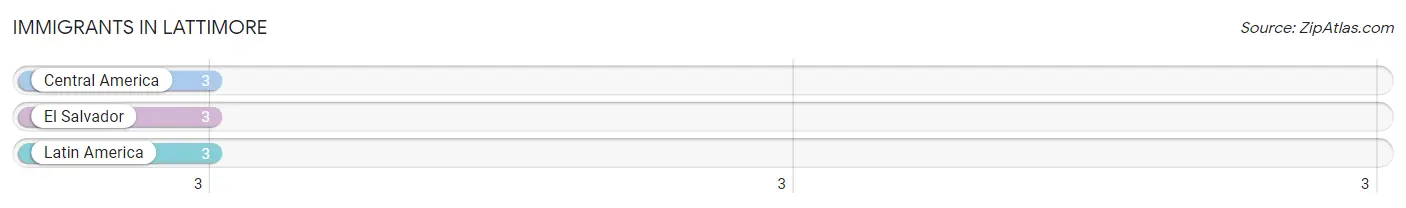
The most numerous immigrant groups reported in Lattimore came from Central America (3 | 0.5%), El Salvador (3 | 0.5%), and Latin America (3 | 0.5%), together accounting for 1.6% of all Lattimore residents.
| Immigration Origin | # Population | % Population |
| Central America | 3 | 0.5% |
| El Salvador | 3 | 0.5% |
| Latin America | 3 | 0.5% | View All 3 Rows |
Sex and Age in Lattimore
Sex and Age in Lattimore
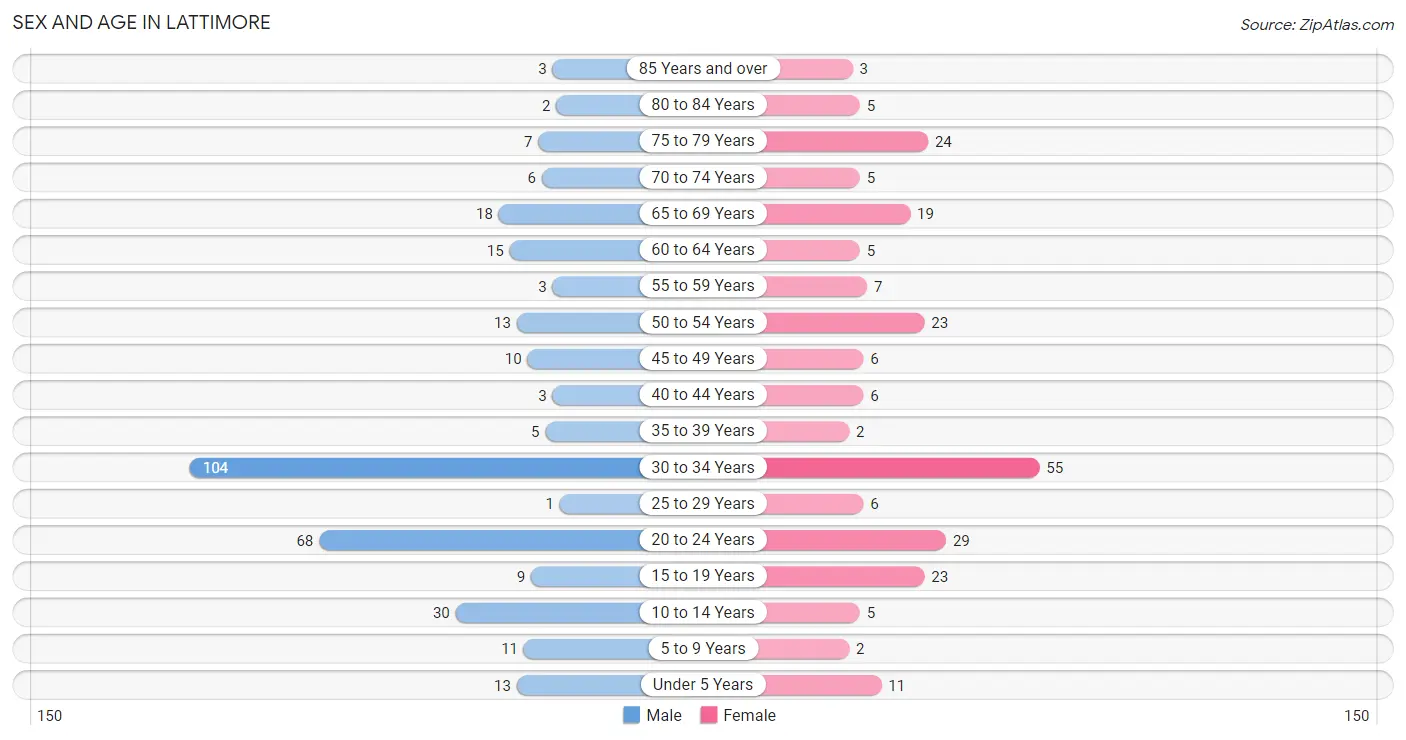
The most populous age groups in Lattimore are 30 to 34 Years (104 | 32.4%) for men and 30 to 34 Years (55 | 23.3%) for women.
| Age Bracket | Male | Female |
| Under 5 Years | 13 (4.1%) | 11 (4.7%) |
| 5 to 9 Years | 11 (3.4%) | 2 (0.9%) |
| 10 to 14 Years | 30 (9.3%) | 5 (2.1%) |
| 15 to 19 Years | 9 (2.8%) | 23 (9.8%) |
| 20 to 24 Years | 68 (21.2%) | 29 (12.3%) |
| 25 to 29 Years | 1 (0.3%) | 6 (2.5%) |
| 30 to 34 Years | 104 (32.4%) | 55 (23.3%) |
| 35 to 39 Years | 5 (1.6%) | 2 (0.9%) |
| 40 to 44 Years | 3 (0.9%) | 6 (2.5%) |
| 45 to 49 Years | 10 (3.1%) | 6 (2.5%) |
| 50 to 54 Years | 13 (4.1%) | 23 (9.8%) |
| 55 to 59 Years | 3 (0.9%) | 7 (3.0%) |
| 60 to 64 Years | 15 (4.7%) | 5 (2.1%) |
| 65 to 69 Years | 18 (5.6%) | 19 (8.1%) |
| 70 to 74 Years | 6 (1.9%) | 5 (2.1%) |
| 75 to 79 Years | 7 (2.2%) | 24 (10.2%) |
| 80 to 84 Years | 2 (0.6%) | 5 (2.1%) |
| 85 Years and over | 3 (0.9%) | 3 (1.3%) |
| Total | 321 (100.0%) | 236 (100.0%) |
Families and Households in Lattimore
Median Family Size in Lattimore
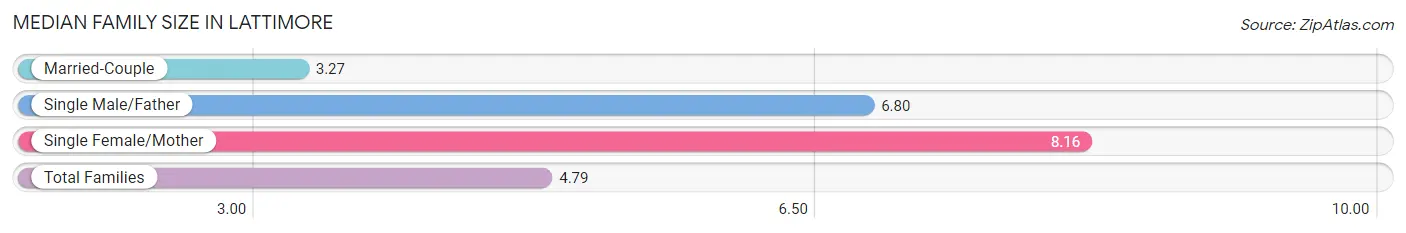
The median family size in Lattimore is 4.79 persons per family, with single female/mother families (25 | 27.2%) accounting for the largest median family size of 8.16 persons per family. On the other hand, married-couple families (62 | 67.4%) represent the smallest median family size with 3.27 persons per family.
| Family Type | # Families | Family Size |
| Married-Couple | 62 (67.4%) | 3.27 |
| Single Male/Father | 5 (5.4%) | 6.80 |
| Single Female/Mother | 25 (27.2%) | 8.16 |
| Total Families | 92 (100.0%) | 4.79 |
Median Household Size in Lattimore
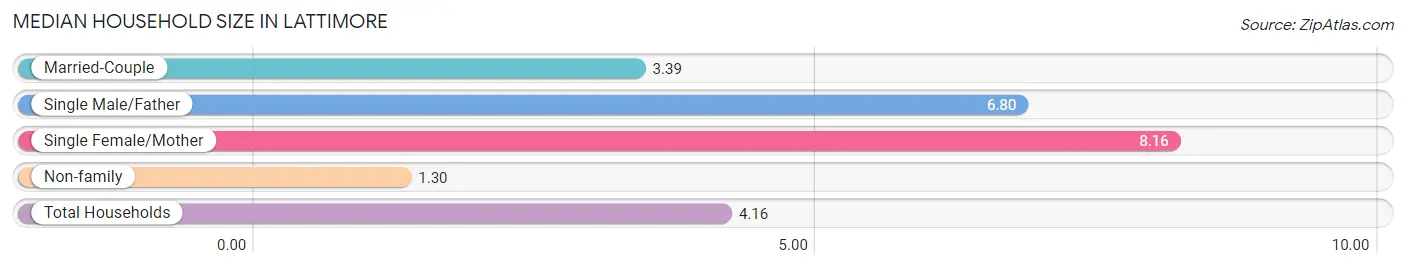
The median household size in Lattimore is 4.16 persons per household, with single female/mother households (25 | 21.7%) accounting for the largest median household size of 8.16 persons per household. non-family households (23 | 20.0%) represent the smallest median household size with 1.30 persons per household.
| Household Type | # Households | Household Size |
| Married-Couple | 62 (53.9%) | 3.39 |
| Single Male/Father | 5 (4.3%) | 6.80 |
| Single Female/Mother | 25 (21.7%) | 8.16 |
| Non-family | 23 (20.0%) | 1.30 |
| Total Households | 115 (100.0%) | 4.16 |
Household Size by Marriage Status in Lattimore
Out of a total of 115 households in Lattimore, 92 (80.0%) are family households, while 23 (20.0%) are nonfamily households. The most numerous type of family households are 3-person households, comprising 41, and the most common type of nonfamily households are 1-person households, comprising 17.
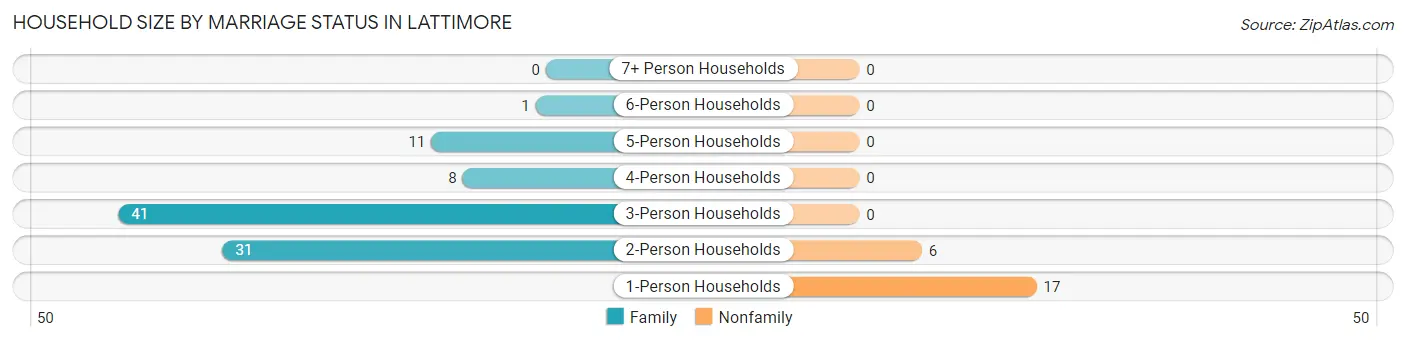
| Household Size | Family Households | Nonfamily Households |
| 1-Person Households | - | 17 (14.8%) |
| 2-Person Households | 31 (27.0%) | 6 (5.2%) |
| 3-Person Households | 41 (35.6%) | 0 (0.0%) |
| 4-Person Households | 8 (7.0%) | 0 (0.0%) |
| 5-Person Households | 11 (9.6%) | 0 (0.0%) |
| 6-Person Households | 1 (0.9%) | 0 (0.0%) |
| 7+ Person Households | 0 (0.0%) | 0 (0.0%) |
| Total | 92 (80.0%) | 23 (20.0%) |
Female Fertility in Lattimore
Fertility by Age in Lattimore
Average fertility rate in Lattimore is 15.0 births per 1,000 women. Women in the age bracket of 20 to 34 years have the highest fertility rate with 22.0 births per 1,000 women. Women in the age bracket of 20 to 34 years acount for 100.0% of all women with births.
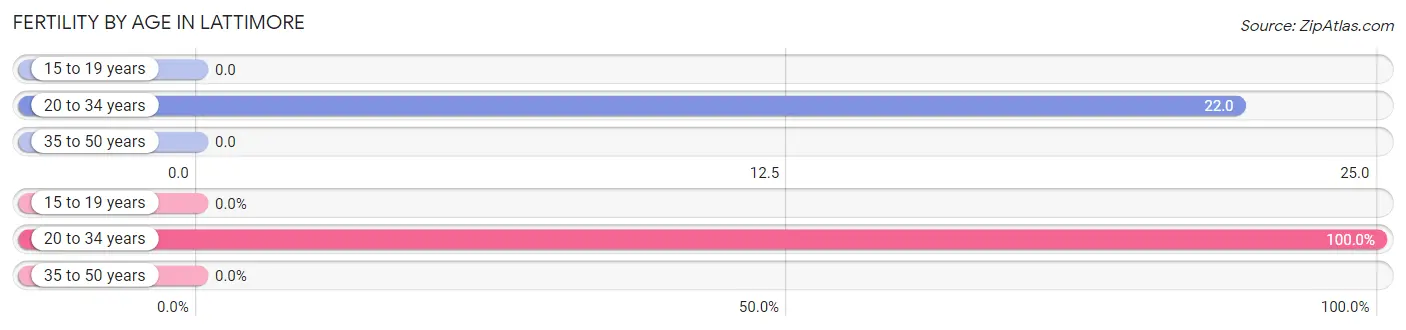
| Age Bracket | Women with Births | Births / 1,000 Women |
| 15 to 19 years | 0 (0.0%) | 0.0 |
| 20 to 34 years | 2 (100.0%) | 22.0 |
| 35 to 50 years | 0 (0.0%) | 0.0 |
| Total | 2 (100.0%) | 15.0 |
Fertility by Age by Marriage Status in Lattimore
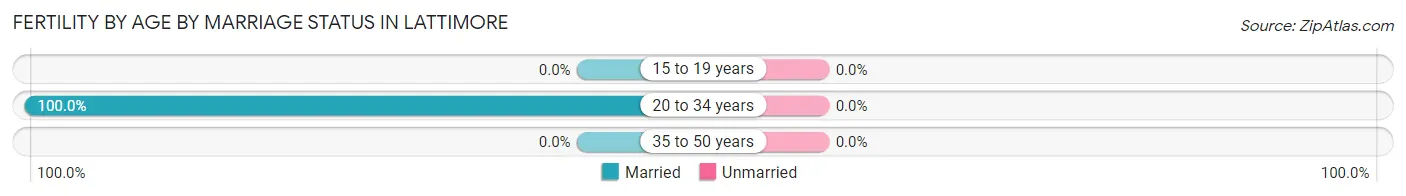
| Age Bracket | Married | Unmarried |
| 15 to 19 years | 0 (0.0%) | 0 (0.0%) |
| 20 to 34 years | 2 (100.0%) | 0 (0.0%) |
| 35 to 50 years | 0 (0.0%) | 0 (0.0%) |
| Total | 2 (100.0%) | 0 (0.0%) |
Fertility by Education in Lattimore
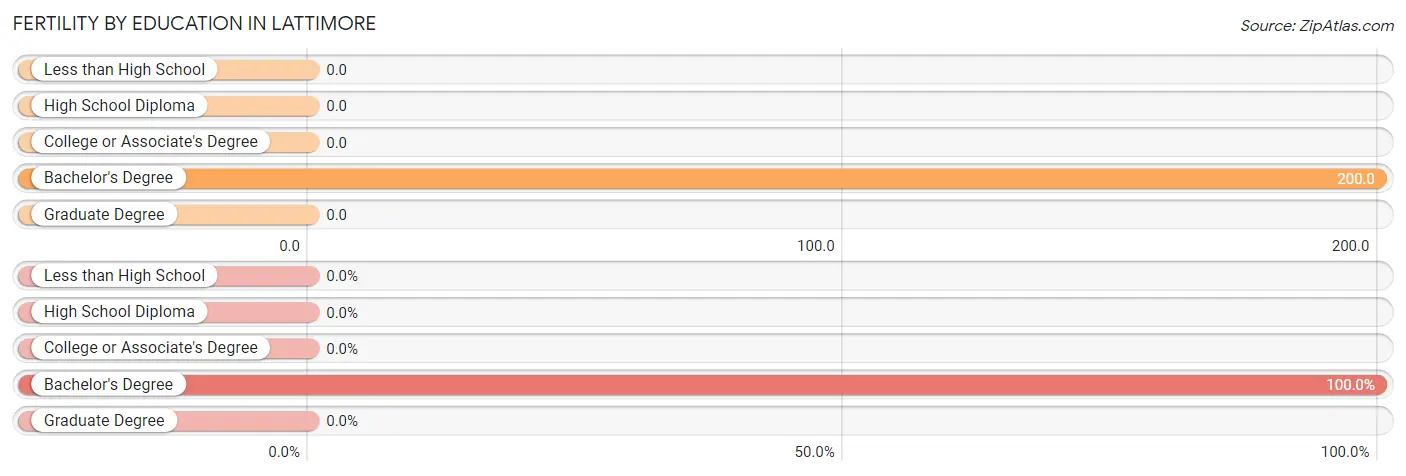
| Educational Attainment | Women with Births | Births / 1,000 Women |
| Less than High School | 0 (0.0%) | 0.0 |
| High School Diploma | 0 (0.0%) | 0.0 |
| College or Associate's Degree | 0 (0.0%) | 0.0 |
| Bachelor's Degree | 2 (100.0%) | 200.0 |
| Graduate Degree | 0 (0.0%) | 0.0 |
| Total | 2 (100.0%) | 15.0 |
Fertility by Education by Marriage Status in Lattimore
| Educational Attainment | Married | Unmarried |
| Less than High School | 0 (0.0%) | 0 (0.0%) |
| High School Diploma | 0 (0.0%) | 0 (0.0%) |
| College or Associate's Degree | 0 (0.0%) | 0 (0.0%) |
| Bachelor's Degree | 2 (100.0%) | 0 (0.0%) |
| Graduate Degree | 0 (0.0%) | 0 (0.0%) |
| Total | 2 (100.0%) | 0 (0.0%) |
Employment Characteristics in Lattimore
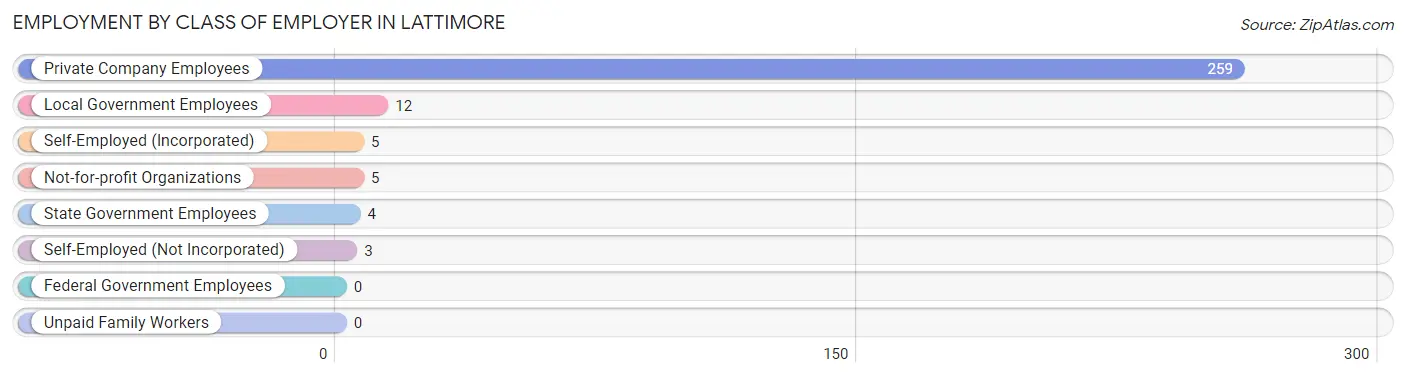
Employment by Class of Employer in Lattimore
Among the 288 employed individuals in Lattimore, private company employees (259 | 89.9%), local government employees (12 | 4.2%), and self-employed (incorporated) (5 | 1.7%) make up the most common classes of employment.
| Employer Class | # Employees | % Employees |
| Private Company Employees | 259 | 89.9% |
| Self-Employed (Incorporated) | 5 | 1.7% |
| Self-Employed (Not Incorporated) | 3 | 1.0% |
| Not-for-profit Organizations | 5 | 1.7% |
| Local Government Employees | 12 | 4.2% |
| State Government Employees | 4 | 1.4% |
| Federal Government Employees | 0 | 0.0% |
| Unpaid Family Workers | 0 | 0.0% |
| Total | 288 | 100.0% |
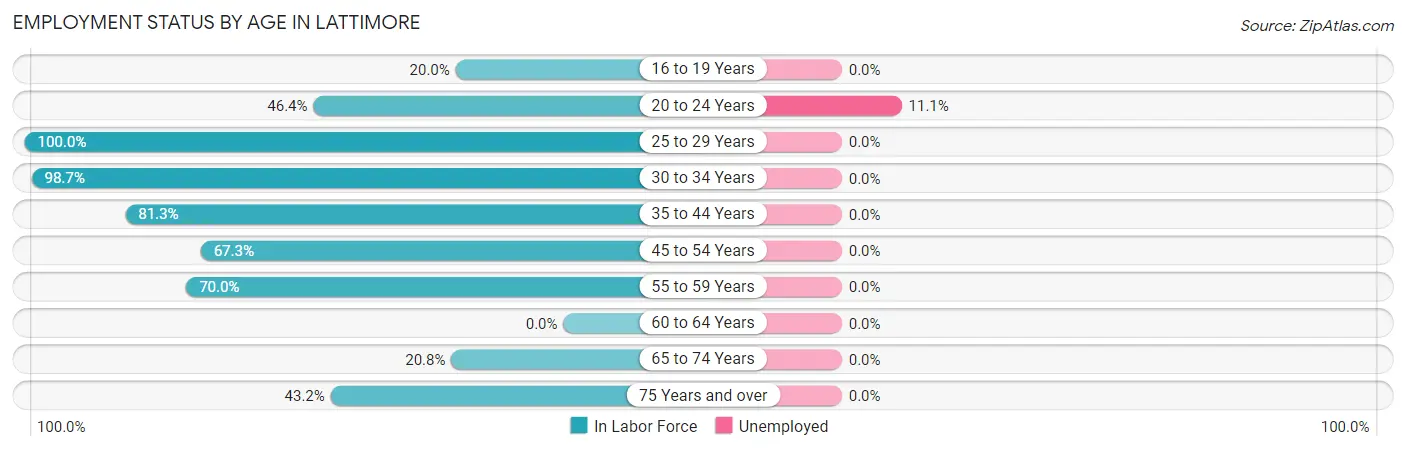
Employment Status by Age in Lattimore
According to the labor force statistics for Lattimore, out of the total population over 16 years of age (483), 61.9% or 299 individuals are in the labor force, with 1.7% or 5 of them unemployed. The age group with the highest labor force participation rate is 25 to 29 years, with 100.0% or 7 individuals in the labor force. Within the labor force, the 20 to 24 years age range has the highest percentage of unemployed individuals, with 11.1% or 5 of them being unemployed.
| Age Bracket | In Labor Force | Unemployed |
| 16 to 19 Years | 6 (20.0%) | 0 (0.0%) |
| 20 to 24 Years | 45 (46.4%) | 5 (11.1%) |
| 25 to 29 Years | 7 (100.0%) | 0 (0.0%) |
| 30 to 34 Years | 157 (98.7%) | 0 (0.0%) |
| 35 to 44 Years | 13 (81.3%) | 0 (0.0%) |
| 45 to 54 Years | 35 (67.3%) | 0 (0.0%) |
| 55 to 59 Years | 7 (70.0%) | 0 (0.0%) |
| 60 to 64 Years | 0 (0.0%) | 0 (0.0%) |
| 65 to 74 Years | 10 (20.8%) | 0 (0.0%) |
| 75 Years and over | 19 (43.2%) | 0 (0.0%) |
| Total | 299 (61.9%) | 5 (1.7%) |
Employment Status by Educational Attainment in Lattimore
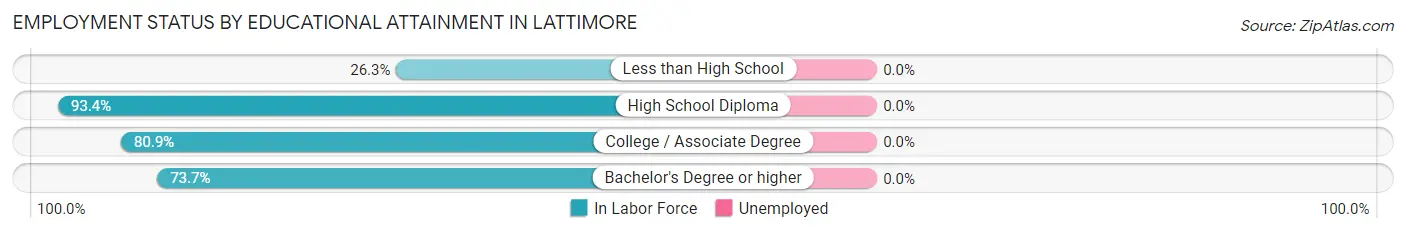
| Educational Attainment | In Labor Force | Unemployed |
| Less than High School | 5 (26.3%) | 0 (0.0%) |
| High School Diploma | 128 (93.4%) | 0 (0.0%) |
| College / Associate Degree | 72 (80.9%) | 0 (0.0%) |
| Bachelor's Degree or higher | 14 (73.7%) | 0 (0.0%) |
| Total | 219 (83.0%) | 0 (0.0%) |
Employment Occupations by Sex in Lattimore
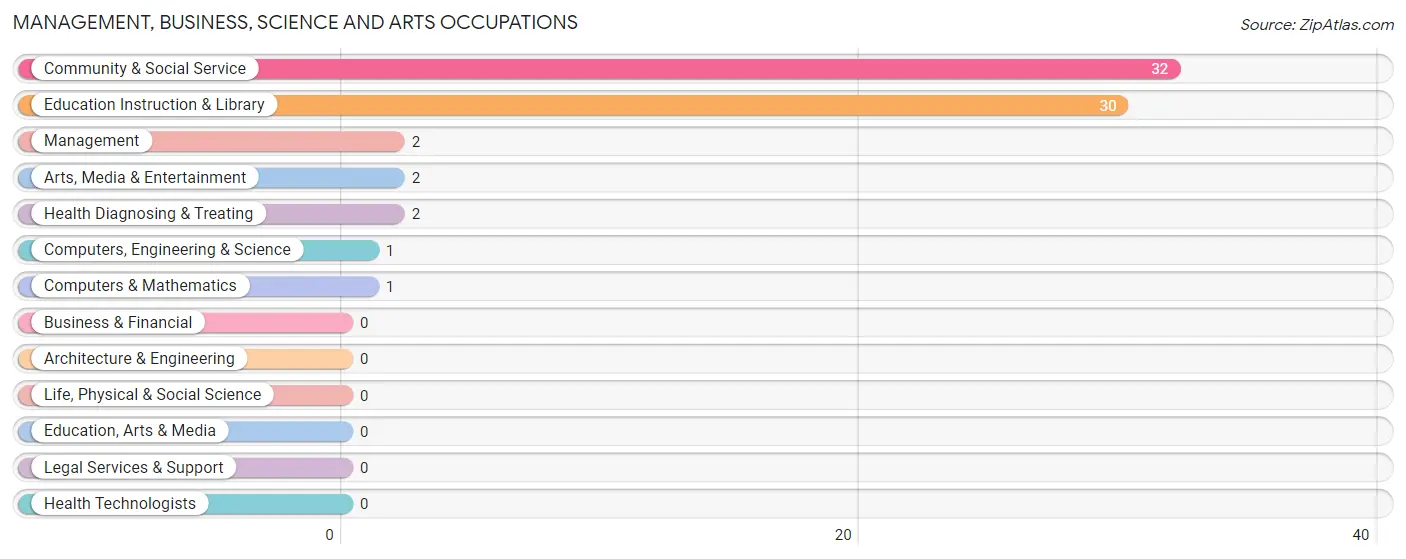
Management, Business, Science and Arts Occupations
The most common Management, Business, Science and Arts occupations in Lattimore are Community & Social Service (32 | 10.9%), Education Instruction & Library (30 | 10.2%), Management (2 | 0.7%), Arts, Media & Entertainment (2 | 0.7%), and Health Diagnosing & Treating (2 | 0.7%).
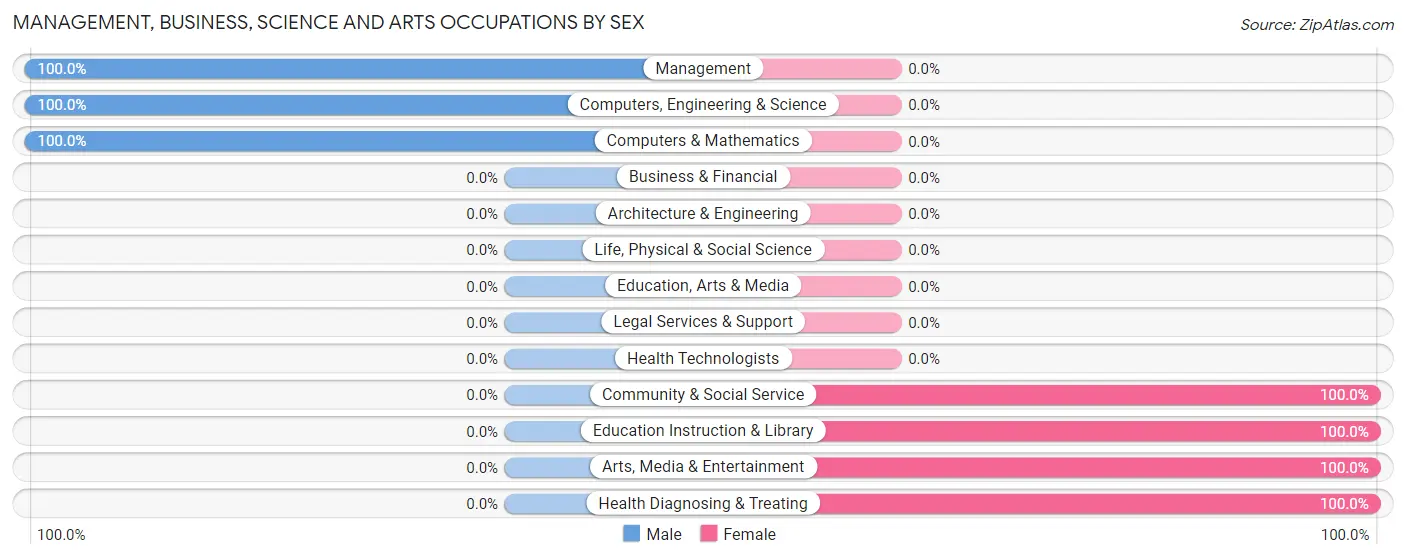
Management, Business, Science and Arts Occupations by Sex
Within the Management, Business, Science and Arts occupations in Lattimore, the most male-oriented occupations are Management (100.0%), Computers, Engineering & Science (100.0%), and Computers & Mathematics (100.0%), while the most female-oriented occupations are Community & Social Service (100.0%), Education Instruction & Library (100.0%), and Arts, Media & Entertainment (100.0%).
| Occupation | Male | Female |
| Management | 2 (100.0%) | 0 (0.0%) |
| Business & Financial | 0 (0.0%) | 0 (0.0%) |
| Computers, Engineering & Science | 1 (100.0%) | 0 (0.0%) |
| Computers & Mathematics | 1 (100.0%) | 0 (0.0%) |
| Architecture & Engineering | 0 (0.0%) | 0 (0.0%) |
| Life, Physical & Social Science | 0 (0.0%) | 0 (0.0%) |
| Community & Social Service | 0 (0.0%) | 32 (100.0%) |
| Education, Arts & Media | 0 (0.0%) | 0 (0.0%) |
| Legal Services & Support | 0 (0.0%) | 0 (0.0%) |
| Education Instruction & Library | 0 (0.0%) | 30 (100.0%) |
| Arts, Media & Entertainment | 0 (0.0%) | 2 (100.0%) |
| Health Diagnosing & Treating | 0 (0.0%) | 2 (100.0%) |
| Health Technologists | 0 (0.0%) | 0 (0.0%) |
| Total (Category) | 3 (8.1%) | 34 (91.9%) |
| Total (Overall) | 166 (56.5%) | 128 (43.5%) |
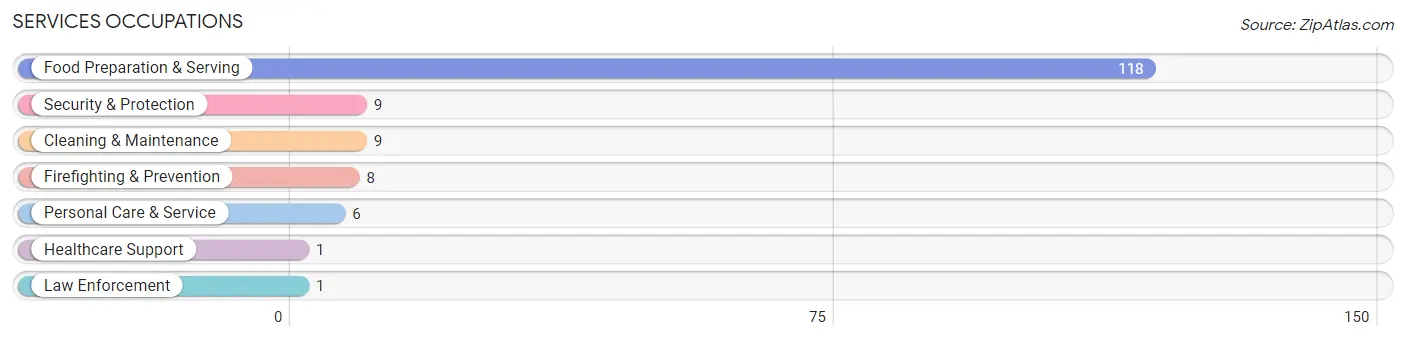
Services Occupations
The most common Services occupations in Lattimore are Food Preparation & Serving (118 | 40.1%), Security & Protection (9 | 3.1%), Cleaning & Maintenance (9 | 3.1%), Firefighting & Prevention (8 | 2.7%), and Personal Care & Service (6 | 2.0%).
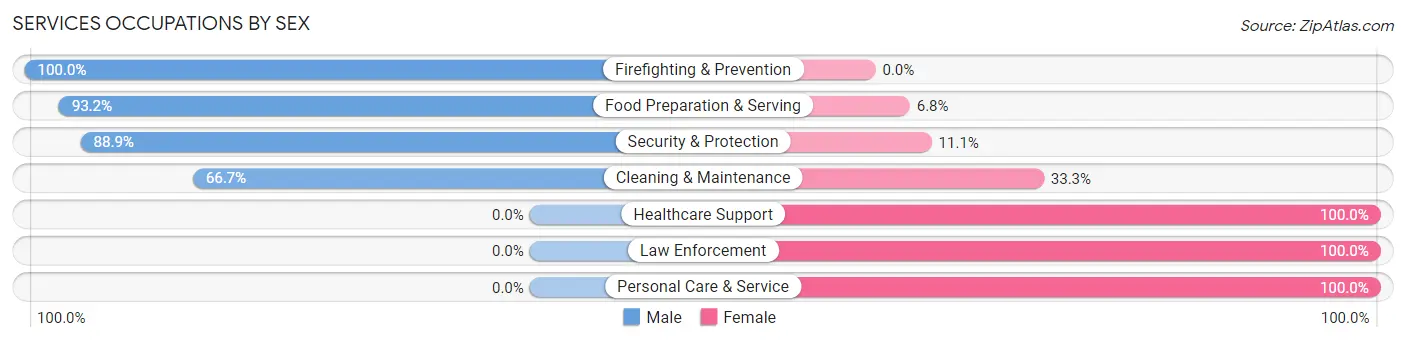
Services Occupations by Sex
Within the Services occupations in Lattimore, the most male-oriented occupations are Firefighting & Prevention (100.0%), Food Preparation & Serving (93.2%), and Security & Protection (88.9%), while the most female-oriented occupations are Healthcare Support (100.0%), Law Enforcement (100.0%), and Personal Care & Service (100.0%).
| Occupation | Male | Female |
| Healthcare Support | 0 (0.0%) | 1 (100.0%) |
| Security & Protection | 8 (88.9%) | 1 (11.1%) |
| Firefighting & Prevention | 8 (100.0%) | 0 (0.0%) |
| Law Enforcement | 0 (0.0%) | 1 (100.0%) |
| Food Preparation & Serving | 110 (93.2%) | 8 (6.8%) |
| Cleaning & Maintenance | 6 (66.7%) | 3 (33.3%) |
| Personal Care & Service | 0 (0.0%) | 6 (100.0%) |
| Total (Category) | 124 (86.7%) | 19 (13.3%) |
| Total (Overall) | 166 (56.5%) | 128 (43.5%) |
Sales and Office Occupations
The most common Sales and Office occupations in Lattimore are Sales & Related (64 | 21.8%), and Office & Administration (7 | 2.4%).
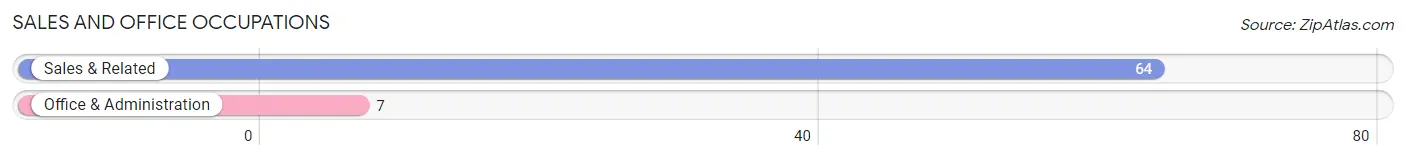
Sales and Office Occupations by Sex
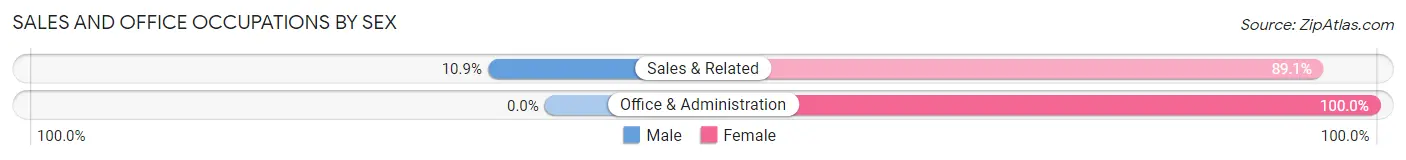
| Occupation | Male | Female |
| Sales & Related | 7 (10.9%) | 57 (89.1%) |
| Office & Administration | 0 (0.0%) | 7 (100.0%) |
| Total (Category) | 7 (9.9%) | 64 (90.1%) |
| Total (Overall) | 166 (56.5%) | 128 (43.5%) |
Natural Resources, Construction and Maintenance Occupations
The most common Natural Resources, Construction and Maintenance occupations in Lattimore are Installation, Maintenance & Repair (5 | 1.7%), and Construction & Extraction (1 | 0.3%).
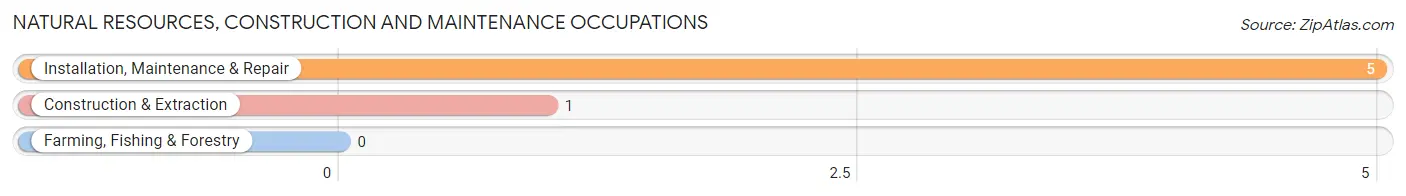
Natural Resources, Construction and Maintenance Occupations by Sex
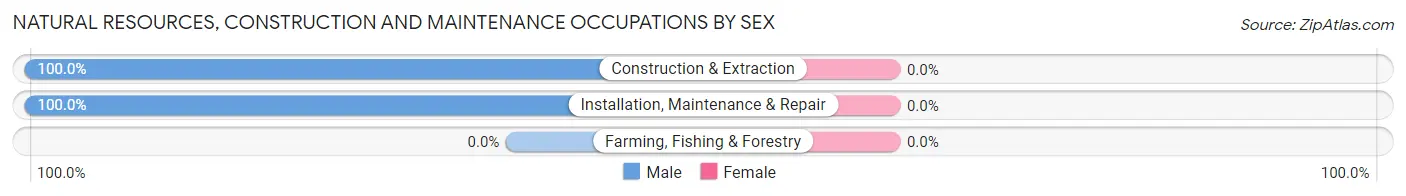
| Occupation | Male | Female |
| Farming, Fishing & Forestry | 0 (0.0%) | 0 (0.0%) |
| Construction & Extraction | 1 (100.0%) | 0 (0.0%) |
| Installation, Maintenance & Repair | 5 (100.0%) | 0 (0.0%) |
| Total (Category) | 6 (100.0%) | 0 (0.0%) |
| Total (Overall) | 166 (56.5%) | 128 (43.5%) |
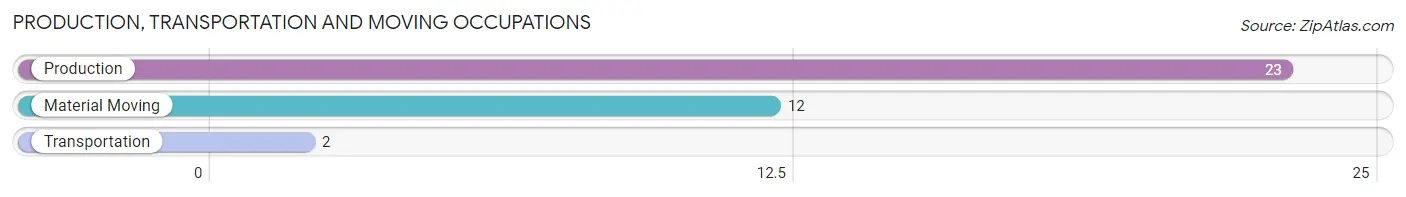
Production, Transportation and Moving Occupations
The most common Production, Transportation and Moving occupations in Lattimore are Production (23 | 7.8%), Material Moving (12 | 4.1%), and Transportation (2 | 0.7%).
Production, Transportation and Moving Occupations by Sex
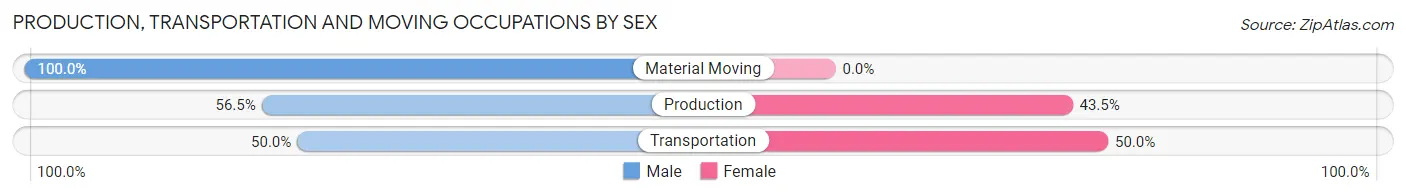
| Occupation | Male | Female |
| Production | 13 (56.5%) | 10 (43.5%) |
| Transportation | 1 (50.0%) | 1 (50.0%) |
| Material Moving | 12 (100.0%) | 0 (0.0%) |
| Total (Category) | 26 (70.3%) | 11 (29.7%) |
| Total (Overall) | 166 (56.5%) | 128 (43.5%) |
Employment Industries by Sex in Lattimore
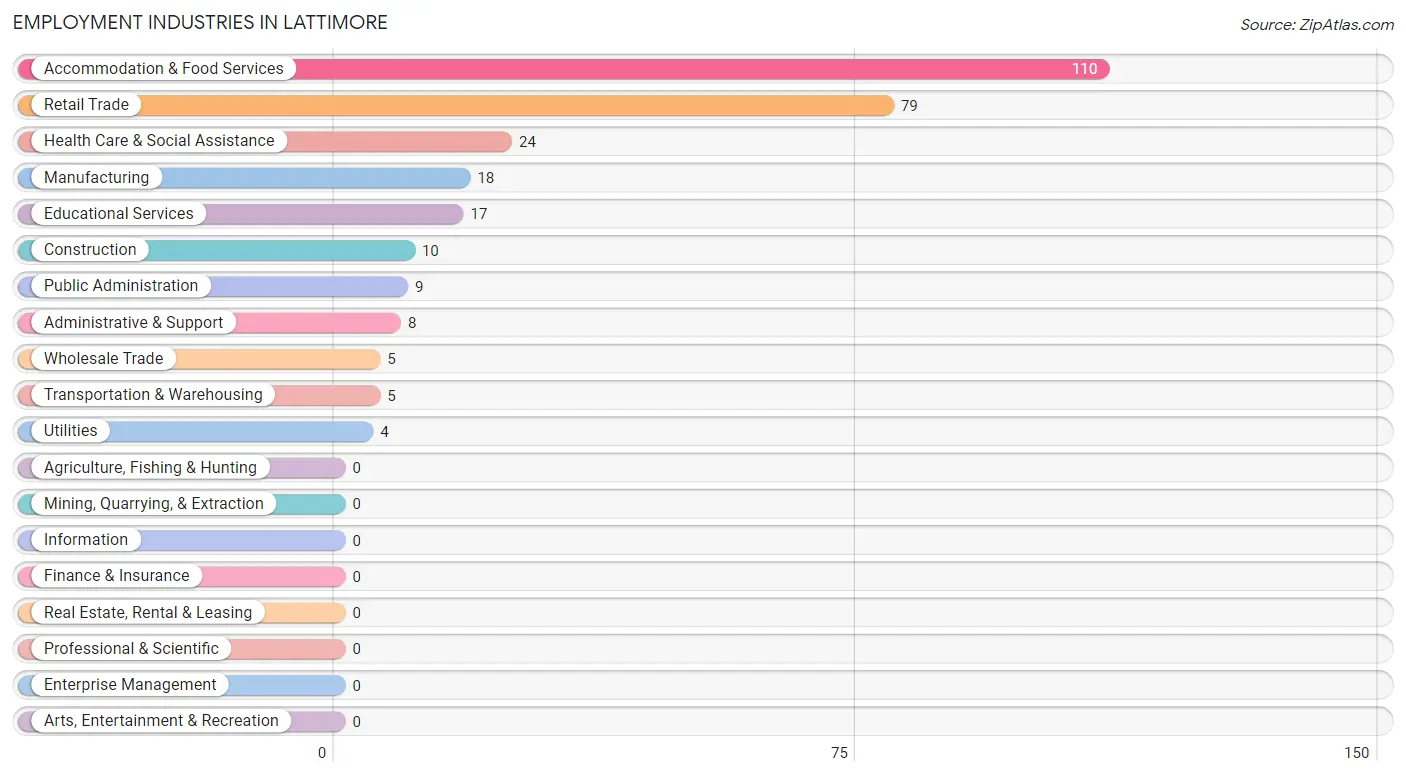
Employment Industries in Lattimore
The major employment industries in Lattimore include Accommodation & Food Services (110 | 37.4%), Retail Trade (79 | 26.9%), Health Care & Social Assistance (24 | 8.2%), Manufacturing (18 | 6.1%), and Educational Services (17 | 5.8%).
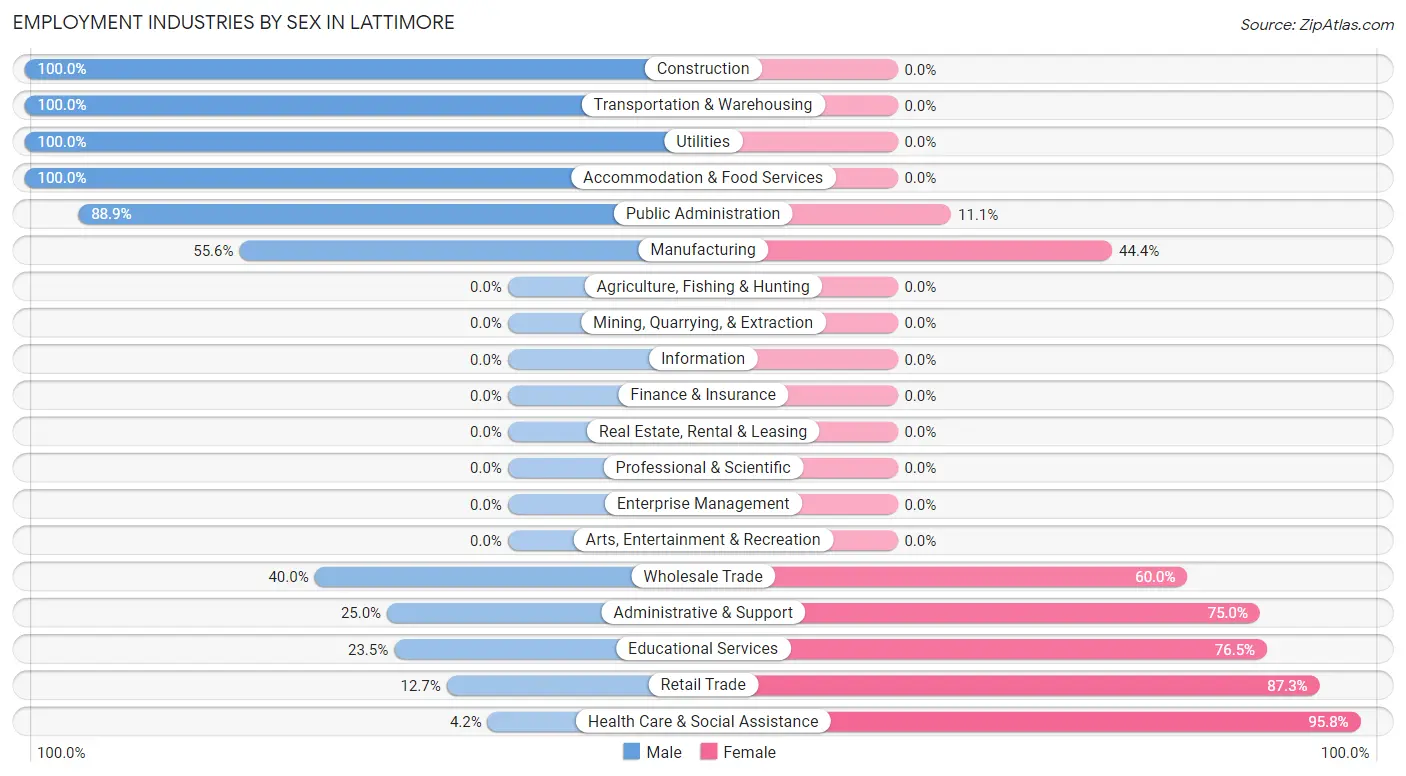
Employment Industries by Sex in Lattimore
The Lattimore industries that see more men than women are Construction (100.0%), Transportation & Warehousing (100.0%), and Utilities (100.0%), whereas the industries that tend to have a higher number of women are Health Care & Social Assistance (95.8%), Retail Trade (87.3%), and Educational Services (76.5%).
| Industry | Male | Female |
| Agriculture, Fishing & Hunting | 0 (0.0%) | 0 (0.0%) |
| Mining, Quarrying, & Extraction | 0 (0.0%) | 0 (0.0%) |
| Construction | 10 (100.0%) | 0 (0.0%) |
| Manufacturing | 10 (55.6%) | 8 (44.4%) |
| Wholesale Trade | 2 (40.0%) | 3 (60.0%) |
| Retail Trade | 10 (12.7%) | 69 (87.3%) |
| Transportation & Warehousing | 5 (100.0%) | 0 (0.0%) |
| Utilities | 4 (100.0%) | 0 (0.0%) |
| Information | 0 (0.0%) | 0 (0.0%) |
| Finance & Insurance | 0 (0.0%) | 0 (0.0%) |
| Real Estate, Rental & Leasing | 0 (0.0%) | 0 (0.0%) |
| Professional & Scientific | 0 (0.0%) | 0 (0.0%) |
| Enterprise Management | 0 (0.0%) | 0 (0.0%) |
| Administrative & Support | 2 (25.0%) | 6 (75.0%) |
| Educational Services | 4 (23.5%) | 13 (76.5%) |
| Health Care & Social Assistance | 1 (4.2%) | 23 (95.8%) |
| Arts, Entertainment & Recreation | 0 (0.0%) | 0 (0.0%) |
| Accommodation & Food Services | 110 (100.0%) | 0 (0.0%) |
| Public Administration | 8 (88.9%) | 1 (11.1%) |
| Total | 166 (56.5%) | 128 (43.5%) |
Education in Lattimore
School Enrollment in Lattimore
The most common levels of schooling among the 156 students in Lattimore are college / undergraduate (88 | 56.4%), middle school (34 | 21.8%), and high school (14 | 9.0%).
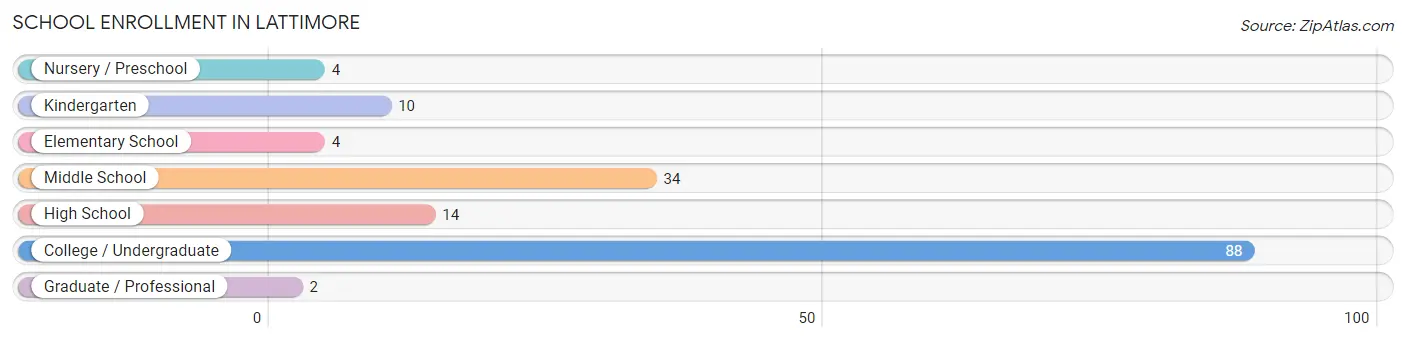
| School Level | # Students | % Students |
| Nursery / Preschool | 4 | 2.6% |
| Kindergarten | 10 | 6.4% |
| Elementary School | 4 | 2.6% |
| Middle School | 34 | 21.8% |
| High School | 14 | 9.0% |
| College / Undergraduate | 88 | 56.4% |
| Graduate / Professional | 2 | 1.3% |
| Total | 156 | 100.0% |
School Enrollment by Age by Funding Source in Lattimore
Out of a total of 156 students who are enrolled in schools in Lattimore, 98 (62.8%) attend a private institution, while the remaining 58 (37.2%) are enrolled in public schools. The age group of 20 to 24 year olds has the highest likelihood of being enrolled in private schools, with 64 (100.0% in the age bracket) enrolled. Conversely, the age group of 25 to 34 year olds has the lowest likelihood of being enrolled in a private school, with 3 (100.0% in the age bracket) attending a public institution.
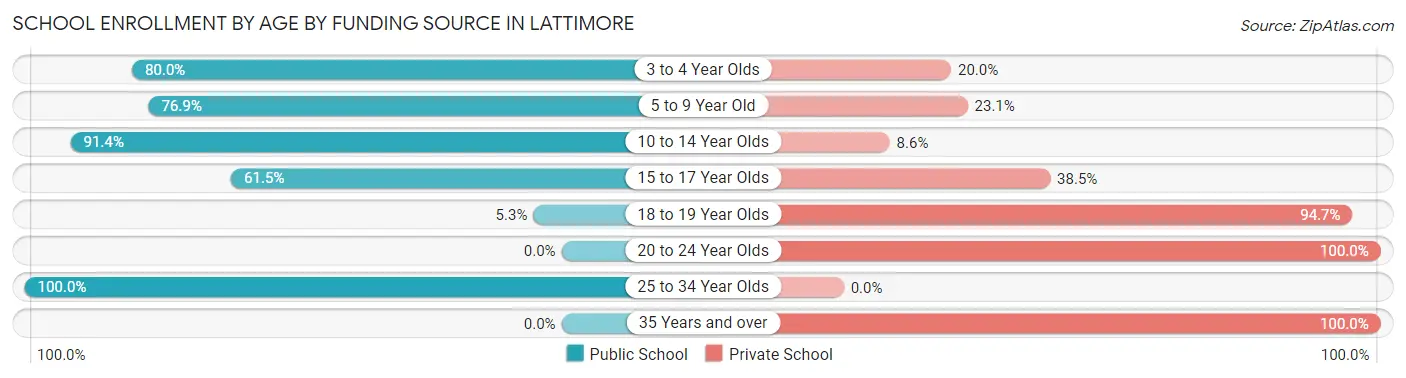
| Age Bracket | Public School | Private School |
| 3 to 4 Year Olds | 4 (80.0%) | 1 (20.0%) |
| 5 to 9 Year Old | 10 (76.9%) | 3 (23.1%) |
| 10 to 14 Year Olds | 32 (91.4%) | 3 (8.6%) |
| 15 to 17 Year Olds | 8 (61.5%) | 5 (38.5%) |
| 18 to 19 Year Olds | 1 (5.3%) | 18 (94.7%) |
| 20 to 24 Year Olds | 0 (0.0%) | 64 (100.0%) |
| 25 to 34 Year Olds | 3 (100.0%) | 0 (0.0%) |
| 35 Years and over | 0 (0.0%) | 4 (100.0%) |
| Total | 58 (37.2%) | 98 (62.8%) |
Educational Attainment by Field of Study in Lattimore
Education (11 | 22.0%), business (9 | 18.0%), arts & humanities (8 | 16.0%), physical & health sciences (5 | 10.0%), and visual & performing arts (5 | 10.0%) are the most common fields of study among 50 individuals in Lattimore who have obtained a bachelor's degree or higher.

| Field of Study | # Graduates | % Graduates |
| Computers & Mathematics | 0 | 0.0% |
| Bio, Nature & Agricultural | 1 | 2.0% |
| Physical & Health Sciences | 5 | 10.0% |
| Psychology | 2 | 4.0% |
| Social Sciences | 4 | 8.0% |
| Engineering | 0 | 0.0% |
| Multidisciplinary Studies | 0 | 0.0% |
| Science & Technology | 3 | 6.0% |
| Business | 9 | 18.0% |
| Education | 11 | 22.0% |
| Literature & Languages | 0 | 0.0% |
| Liberal Arts & History | 2 | 4.0% |
| Visual & Performing Arts | 5 | 10.0% |
| Communications | 0 | 0.0% |
| Arts & Humanities | 8 | 16.0% |
| Total | 50 | 100.0% |
Transportation & Commute in Lattimore
Vehicle Availability by Sex in Lattimore
The most prevalent vehicle ownership categories in Lattimore are males with 4 vehicles (122, accounting for 76.2%) and females with 4 vehicles (78, making up 101.7%).
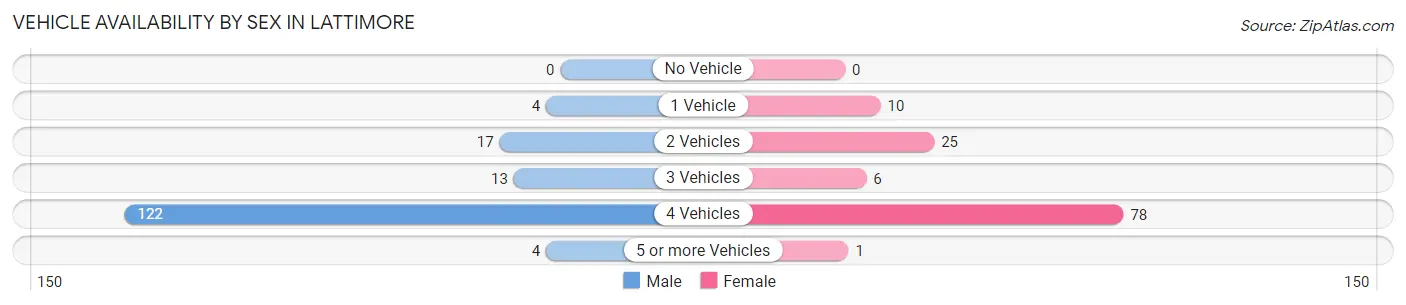
| Vehicles Available | Male | Female |
| No Vehicle | 0 (0.0%) | 0 (0.0%) |
| 1 Vehicle | 4 (2.5%) | 10 (8.3%) |
| 2 Vehicles | 17 (10.6%) | 25 (20.8%) |
| 3 Vehicles | 13 (8.1%) | 6 (5.0%) |
| 4 Vehicles | 122 (76.2%) | 78 (65.0%) |
| 5 or more Vehicles | 4 (2.5%) | 1 (0.8%) |
| Total | 160 (100.0%) | 120 (100.0%) |
Commute Time in Lattimore
The most frequently occuring commute durations in Lattimore are 15 to 19 minutes (143 commuters, 50.0%), 30 to 34 minutes (52 commuters, 18.2%), and 10 to 14 minutes (30 commuters, 10.5%).
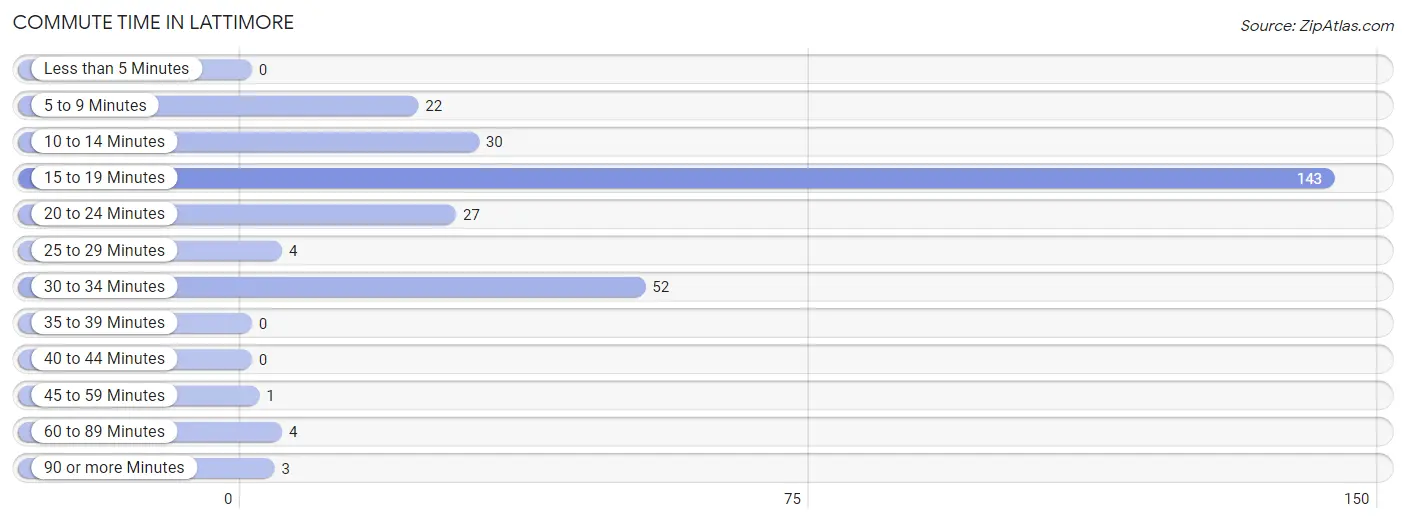
| Commute Time | # Commuters | % Commuters |
| Less than 5 Minutes | 0 | 0.0% |
| 5 to 9 Minutes | 22 | 7.7% |
| 10 to 14 Minutes | 30 | 10.5% |
| 15 to 19 Minutes | 143 | 50.0% |
| 20 to 24 Minutes | 27 | 9.4% |
| 25 to 29 Minutes | 4 | 1.4% |
| 30 to 34 Minutes | 52 | 18.2% |
| 35 to 39 Minutes | 0 | 0.0% |
| 40 to 44 Minutes | 0 | 0.0% |
| 45 to 59 Minutes | 1 | 0.4% |
| 60 to 89 Minutes | 4 | 1.4% |
| 90 or more Minutes | 3 | 1.1% |
Commute Time by Sex in Lattimore
The most common commute times in Lattimore are 15 to 19 minutes (135 commuters, 85.4%) for males and 30 to 34 minutes (51 commuters, 39.8%) for females.
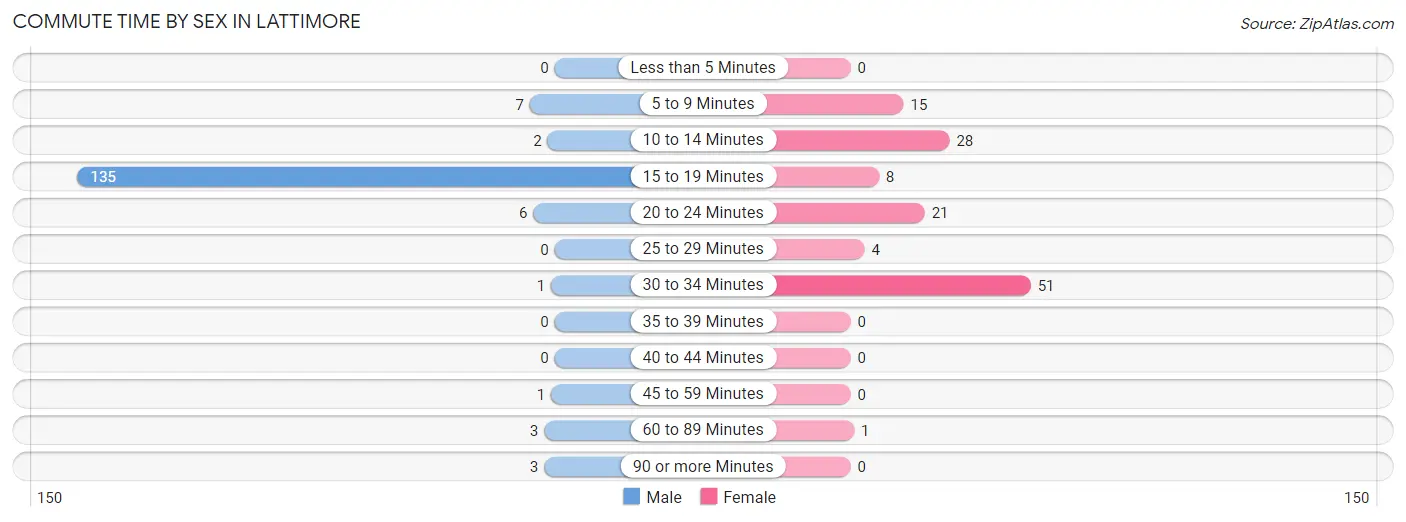
| Commute Time | Male | Female |
| Less than 5 Minutes | 0 (0.0%) | 0 (0.0%) |
| 5 to 9 Minutes | 7 (4.4%) | 15 (11.7%) |
| 10 to 14 Minutes | 2 (1.3%) | 28 (21.9%) |
| 15 to 19 Minutes | 135 (85.4%) | 8 (6.2%) |
| 20 to 24 Minutes | 6 (3.8%) | 21 (16.4%) |
| 25 to 29 Minutes | 0 (0.0%) | 4 (3.1%) |
| 30 to 34 Minutes | 1 (0.6%) | 51 (39.8%) |
| 35 to 39 Minutes | 0 (0.0%) | 0 (0.0%) |
| 40 to 44 Minutes | 0 (0.0%) | 0 (0.0%) |
| 45 to 59 Minutes | 1 (0.6%) | 0 (0.0%) |
| 60 to 89 Minutes | 3 (1.9%) | 1 (0.8%) |
| 90 or more Minutes | 3 (1.9%) | 0 (0.0%) |
Time of Departure to Work by Sex in Lattimore
The most frequent times of departure to work in Lattimore are 8:30 AM to 8:59 AM (106, 67.1%) for males and 12:00 PM to 3:59 PM (59, 46.1%) for females.
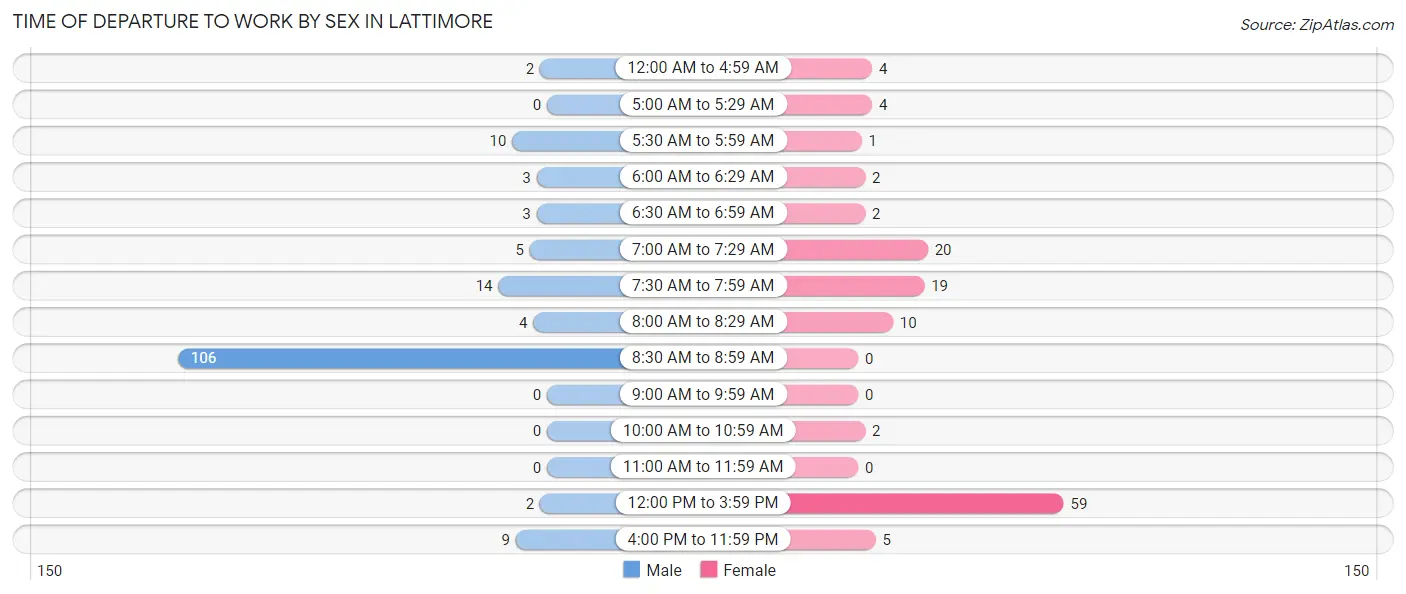
| Time of Departure | Male | Female |
| 12:00 AM to 4:59 AM | 2 (1.3%) | 4 (3.1%) |
| 5:00 AM to 5:29 AM | 0 (0.0%) | 4 (3.1%) |
| 5:30 AM to 5:59 AM | 10 (6.3%) | 1 (0.8%) |
| 6:00 AM to 6:29 AM | 3 (1.9%) | 2 (1.6%) |
| 6:30 AM to 6:59 AM | 3 (1.9%) | 2 (1.6%) |
| 7:00 AM to 7:29 AM | 5 (3.2%) | 20 (15.6%) |
| 7:30 AM to 7:59 AM | 14 (8.9%) | 19 (14.8%) |
| 8:00 AM to 8:29 AM | 4 (2.5%) | 10 (7.8%) |
| 8:30 AM to 8:59 AM | 106 (67.1%) | 0 (0.0%) |
| 9:00 AM to 9:59 AM | 0 (0.0%) | 0 (0.0%) |
| 10:00 AM to 10:59 AM | 0 (0.0%) | 2 (1.6%) |
| 11:00 AM to 11:59 AM | 0 (0.0%) | 0 (0.0%) |
| 12:00 PM to 3:59 PM | 2 (1.3%) | 59 (46.1%) |
| 4:00 PM to 11:59 PM | 9 (5.7%) | 5 (3.9%) |
| Total | 158 (100.0%) | 128 (100.0%) |
Housing Occupancy in Lattimore
Occupancy by Ownership in Lattimore
Of the total 115 dwellings in Lattimore, owner-occupied units account for 90 (78.3%), while renter-occupied units make up 25 (21.7%).
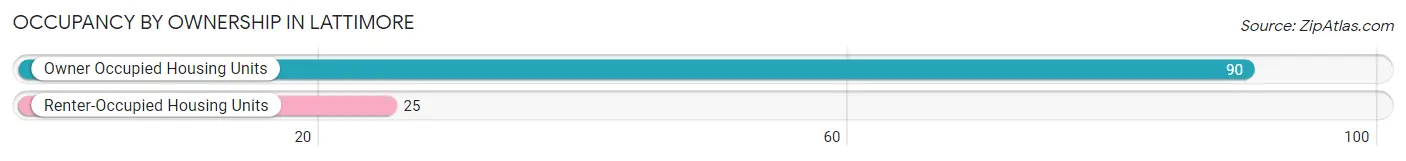
| Occupancy | # Housing Units | % Housing Units |
| Owner Occupied Housing Units | 90 | 78.3% |
| Renter-Occupied Housing Units | 25 | 21.7% |
| Total Occupied Housing Units | 115 | 100.0% |
Occupancy by Household Size in Lattimore
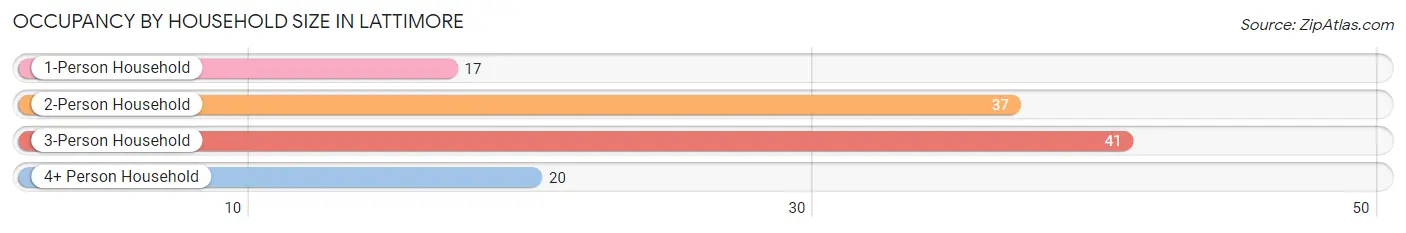
| Household Size | # Housing Units | % Housing Units |
| 1-Person Household | 17 | 14.8% |
| 2-Person Household | 37 | 32.2% |
| 3-Person Household | 41 | 35.6% |
| 4+ Person Household | 20 | 17.4% |
| Total Housing Units | 115 | 100.0% |
Occupancy by Ownership by Household Size in Lattimore
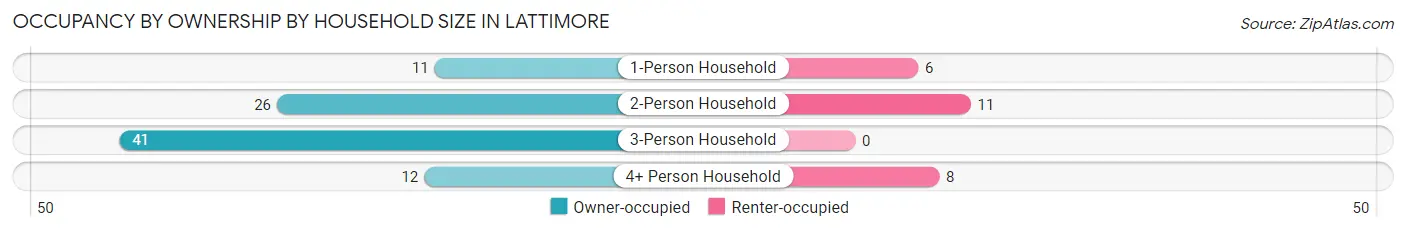
| Household Size | Owner-occupied | Renter-occupied |
| 1-Person Household | 11 (64.7%) | 6 (35.3%) |
| 2-Person Household | 26 (70.3%) | 11 (29.7%) |
| 3-Person Household | 41 (100.0%) | 0 (0.0%) |
| 4+ Person Household | 12 (60.0%) | 8 (40.0%) |
| Total Housing Units | 90 (78.3%) | 25 (21.7%) |
Occupancy by Educational Attainment in Lattimore
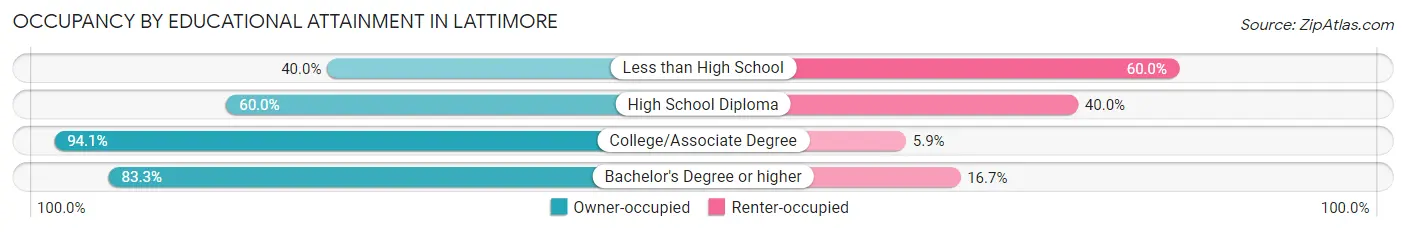
| Household Size | Owner-occupied | Renter-occupied |
| Less than High School | 4 (40.0%) | 6 (60.0%) |
| High School Diploma | 18 (60.0%) | 12 (40.0%) |
| College/Associate Degree | 48 (94.1%) | 3 (5.9%) |
| Bachelor's Degree or higher | 20 (83.3%) | 4 (16.7%) |
Occupancy by Age of Householder in Lattimore
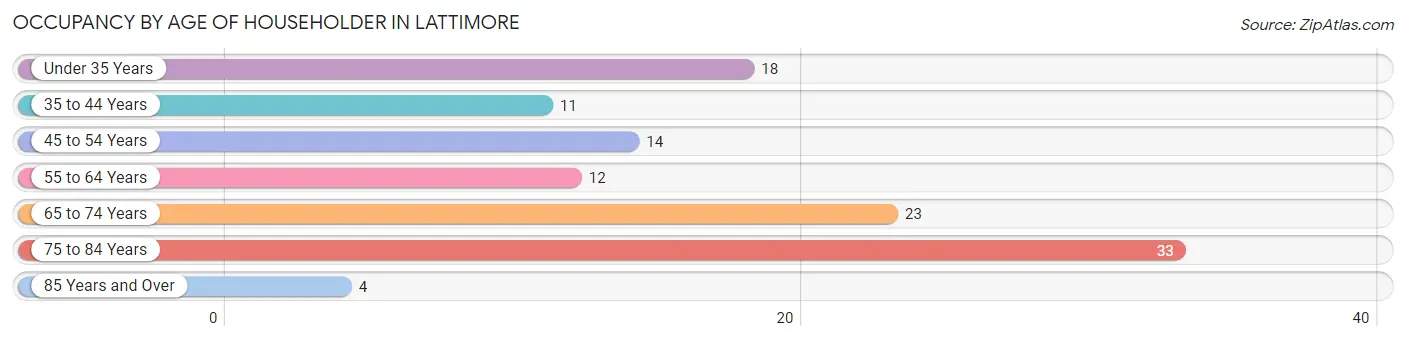
| Age Bracket | # Households | % Households |
| Under 35 Years | 18 | 15.7% |
| 35 to 44 Years | 11 | 9.6% |
| 45 to 54 Years | 14 | 12.2% |
| 55 to 64 Years | 12 | 10.4% |
| 65 to 74 Years | 23 | 20.0% |
| 75 to 84 Years | 33 | 28.7% |
| 85 Years and Over | 4 | 3.5% |
| Total | 115 | 100.0% |
Housing Finances in Lattimore
Median Income by Occupancy in Lattimore
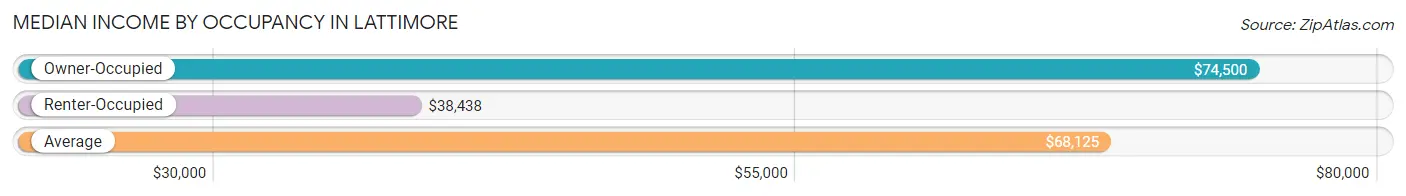
| Occupancy Type | # Households | Median Income |
| Owner-Occupied | 90 (78.3%) | $74,500 |
| Renter-Occupied | 25 (21.7%) | $38,438 |
| Average | 115 (100.0%) | $68,125 |
Occupancy by Householder Income Bracket in Lattimore
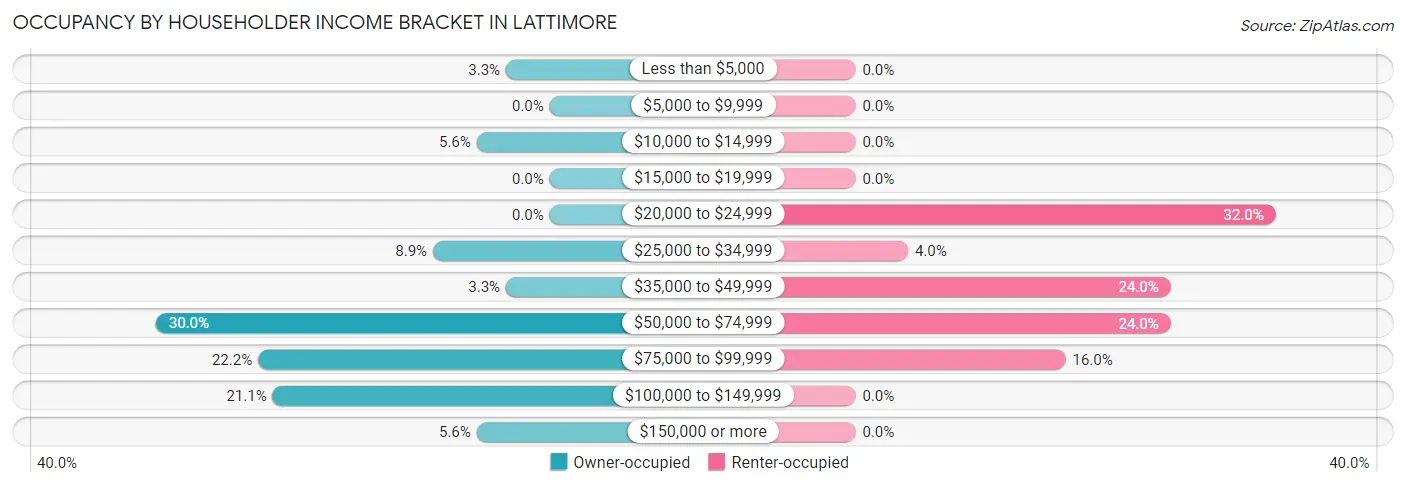
| Income Bracket | Owner-occupied | Renter-occupied |
| Less than $5,000 | 3 (3.3%) | 0 (0.0%) |
| $5,000 to $9,999 | 0 (0.0%) | 0 (0.0%) |
| $10,000 to $14,999 | 5 (5.6%) | 0 (0.0%) |
| $15,000 to $19,999 | 0 (0.0%) | 0 (0.0%) |
| $20,000 to $24,999 | 0 (0.0%) | 8 (32.0%) |
| $25,000 to $34,999 | 8 (8.9%) | 1 (4.0%) |
| $35,000 to $49,999 | 3 (3.3%) | 6 (24.0%) |
| $50,000 to $74,999 | 27 (30.0%) | 6 (24.0%) |
| $75,000 to $99,999 | 20 (22.2%) | 4 (16.0%) |
| $100,000 to $149,999 | 19 (21.1%) | 0 (0.0%) |
| $150,000 or more | 5 (5.6%) | 0 (0.0%) |
| Total | 90 (100.0%) | 25 (100.0%) |
Monthly Housing Cost Tiers in Lattimore
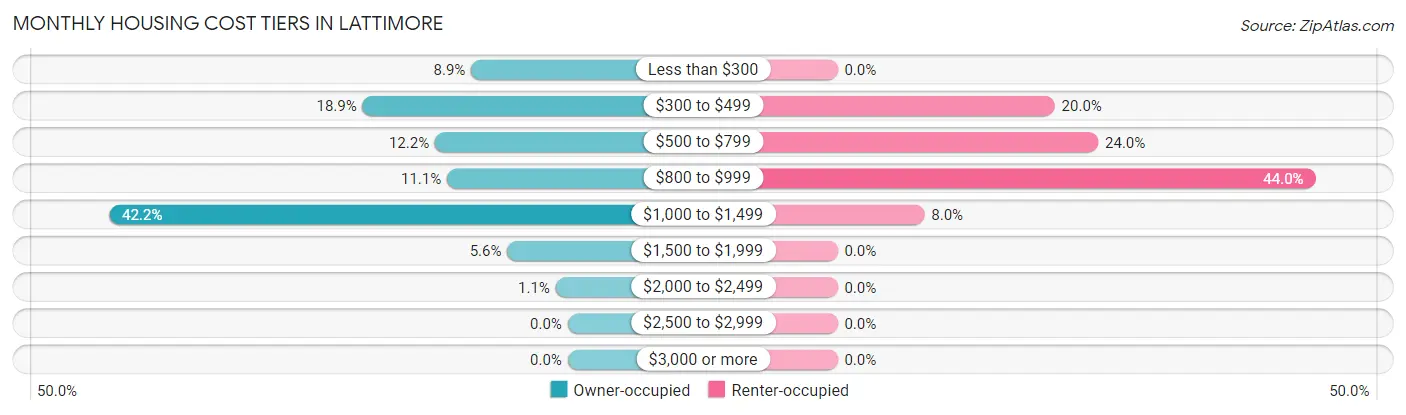
| Monthly Cost | Owner-occupied | Renter-occupied |
| Less than $300 | 8 (8.9%) | 0 (0.0%) |
| $300 to $499 | 17 (18.9%) | 5 (20.0%) |
| $500 to $799 | 11 (12.2%) | 6 (24.0%) |
| $800 to $999 | 10 (11.1%) | 11 (44.0%) |
| $1,000 to $1,499 | 38 (42.2%) | 2 (8.0%) |
| $1,500 to $1,999 | 5 (5.6%) | 0 (0.0%) |
| $2,000 to $2,499 | 1 (1.1%) | 0 (0.0%) |
| $2,500 to $2,999 | 0 (0.0%) | 0 (0.0%) |
| $3,000 or more | 0 (0.0%) | 0 (0.0%) |
| Total | 90 (100.0%) | 25 (100.0%) |
Physical Housing Characteristics in Lattimore
Housing Structures in Lattimore
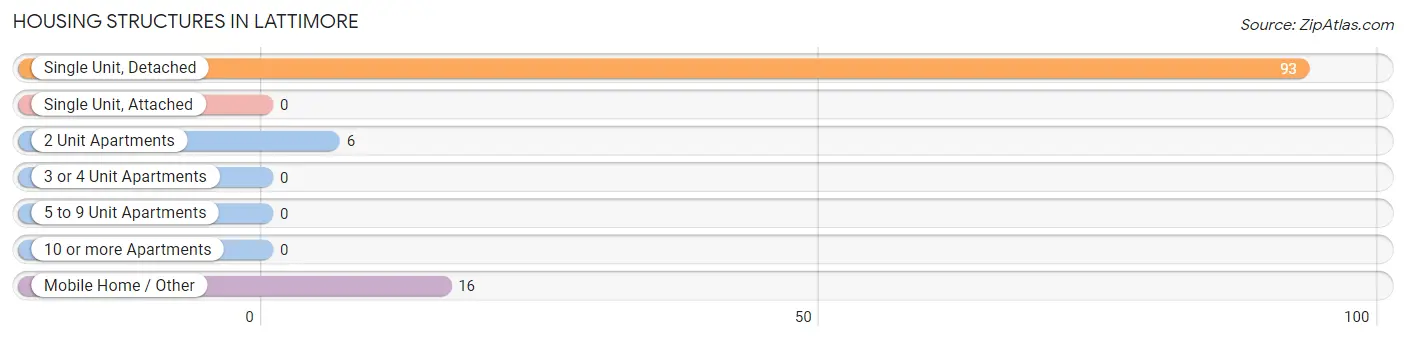
| Structure Type | # Housing Units | % Housing Units |
| Single Unit, Detached | 93 | 80.9% |
| Single Unit, Attached | 0 | 0.0% |
| 2 Unit Apartments | 6 | 5.2% |
| 3 or 4 Unit Apartments | 0 | 0.0% |
| 5 to 9 Unit Apartments | 0 | 0.0% |
| 10 or more Apartments | 0 | 0.0% |
| Mobile Home / Other | 16 | 13.9% |
| Total | 115 | 100.0% |
Housing Structures by Occupancy in Lattimore
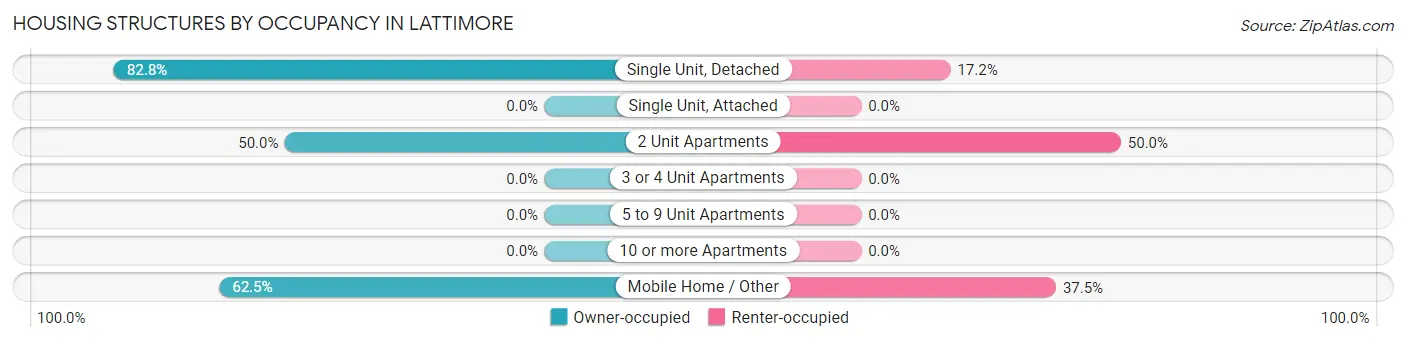
| Structure Type | Owner-occupied | Renter-occupied |
| Single Unit, Detached | 77 (82.8%) | 16 (17.2%) |
| Single Unit, Attached | 0 (0.0%) | 0 (0.0%) |
| 2 Unit Apartments | 3 (50.0%) | 3 (50.0%) |
| 3 or 4 Unit Apartments | 0 (0.0%) | 0 (0.0%) |
| 5 to 9 Unit Apartments | 0 (0.0%) | 0 (0.0%) |
| 10 or more Apartments | 0 (0.0%) | 0 (0.0%) |
| Mobile Home / Other | 10 (62.5%) | 6 (37.5%) |
| Total | 90 (78.3%) | 25 (21.7%) |
Housing Structures by Number of Rooms in Lattimore
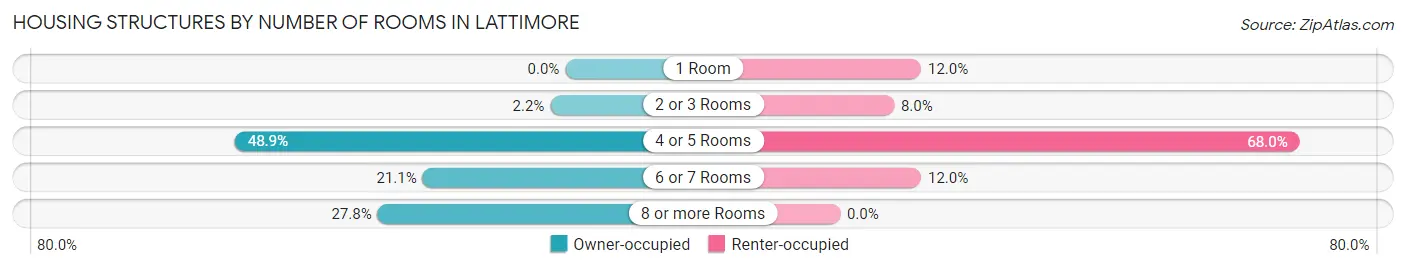
| Number of Rooms | Owner-occupied | Renter-occupied |
| 1 Room | 0 (0.0%) | 3 (12.0%) |
| 2 or 3 Rooms | 2 (2.2%) | 2 (8.0%) |
| 4 or 5 Rooms | 44 (48.9%) | 17 (68.0%) |
| 6 or 7 Rooms | 19 (21.1%) | 3 (12.0%) |
| 8 or more Rooms | 25 (27.8%) | 0 (0.0%) |
| Total | 90 (100.0%) | 25 (100.0%) |
Housing Structure by Heating Type in Lattimore
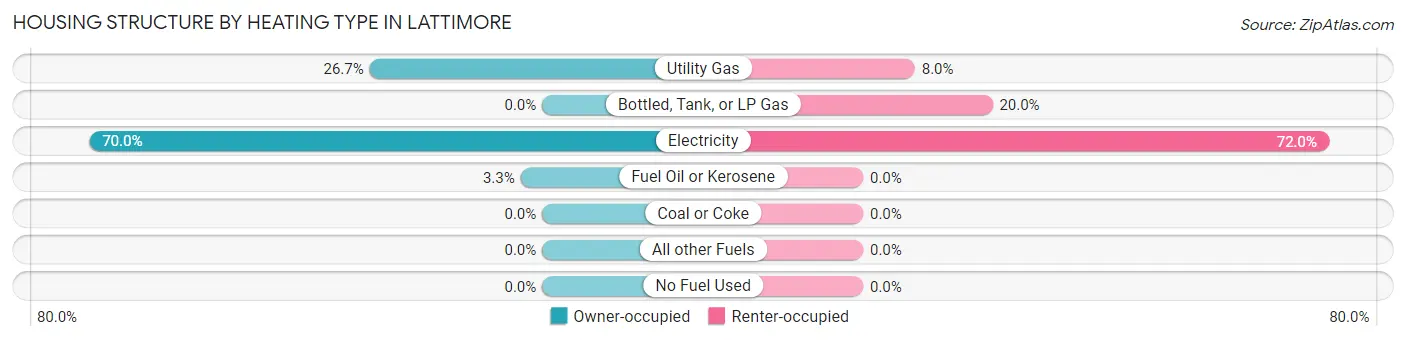
| Heating Type | Owner-occupied | Renter-occupied |
| Utility Gas | 24 (26.7%) | 2 (8.0%) |
| Bottled, Tank, or LP Gas | 0 (0.0%) | 5 (20.0%) |
| Electricity | 63 (70.0%) | 18 (72.0%) |
| Fuel Oil or Kerosene | 3 (3.3%) | 0 (0.0%) |
| Coal or Coke | 0 (0.0%) | 0 (0.0%) |
| All other Fuels | 0 (0.0%) | 0 (0.0%) |
| No Fuel Used | 0 (0.0%) | 0 (0.0%) |
| Total | 90 (100.0%) | 25 (100.0%) |
Household Vehicle Usage in Lattimore
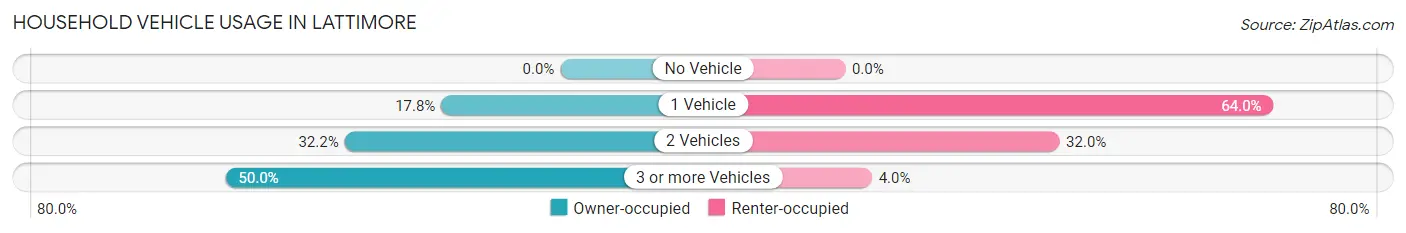
| Vehicles per Household | Owner-occupied | Renter-occupied |
| No Vehicle | 0 (0.0%) | 0 (0.0%) |
| 1 Vehicle | 16 (17.8%) | 16 (64.0%) |
| 2 Vehicles | 29 (32.2%) | 8 (32.0%) |
| 3 or more Vehicles | 45 (50.0%) | 1 (4.0%) |
| Total | 90 (100.0%) | 25 (100.0%) |
Real Estate & Mortgages in Lattimore
Real Estate and Mortgage Overview in Lattimore
| Characteristic | Without Mortgage | With Mortgage |
| Housing Units | 37 | 53 |
| Median Property Value | - | - |
| Median Household Income | $60,625 | $3 |
| Monthly Housing Costs | $375 | $0 |
| Real Estate Taxes | $1,542 | $0 |
Property Value by Mortgage Status in Lattimore
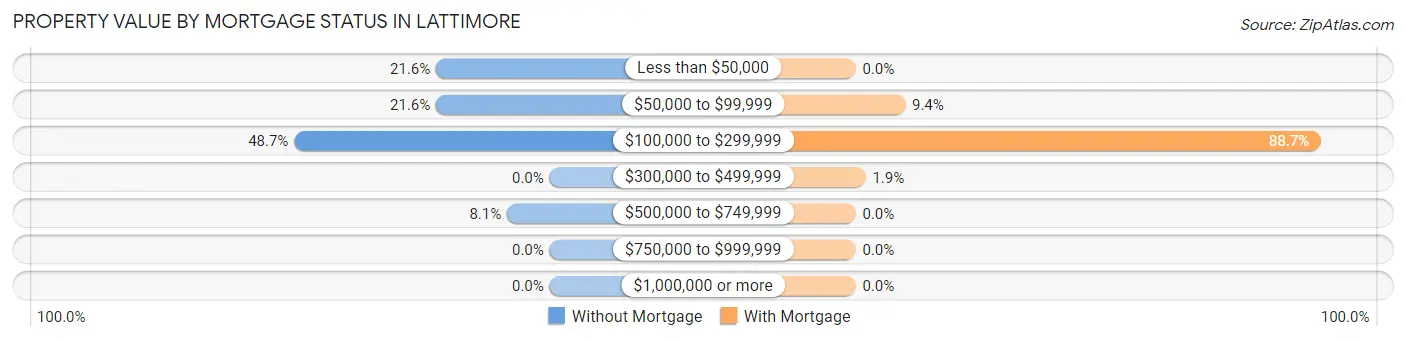
| Property Value | Without Mortgage | With Mortgage |
| Less than $50,000 | 8 (21.6%) | 0 (0.0%) |
| $50,000 to $99,999 | 8 (21.6%) | 5 (9.4%) |
| $100,000 to $299,999 | 18 (48.6%) | 47 (88.7%) |
| $300,000 to $499,999 | 0 (0.0%) | 1 (1.9%) |
| $500,000 to $749,999 | 3 (8.1%) | 0 (0.0%) |
| $750,000 to $999,999 | 0 (0.0%) | 0 (0.0%) |
| $1,000,000 or more | 0 (0.0%) | 0 (0.0%) |
| Total | 37 (100.0%) | 53 (100.0%) |
Household Income by Mortgage Status in Lattimore
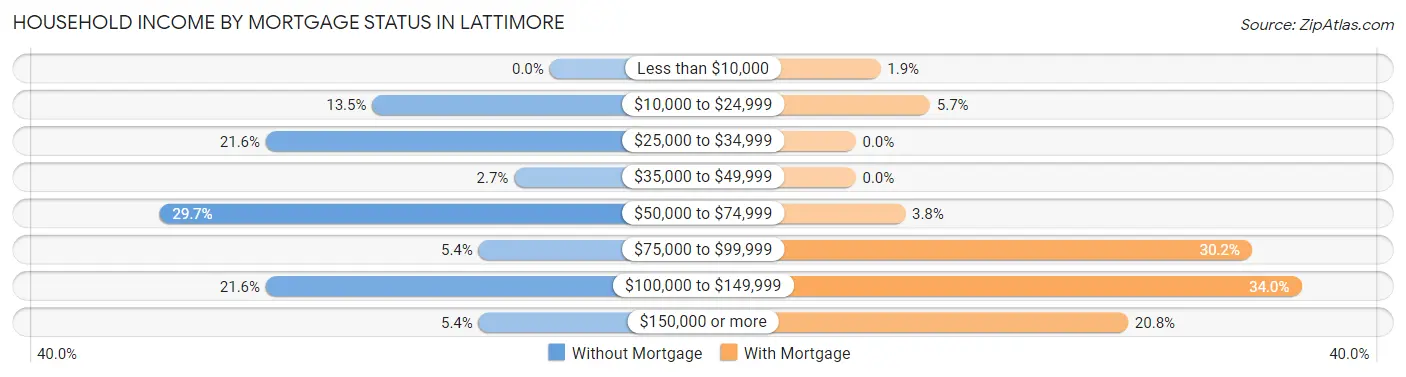
| Household Income | Without Mortgage | With Mortgage |
| Less than $10,000 | 0 (0.0%) | 1 (1.9%) |
| $10,000 to $24,999 | 5 (13.5%) | 3 (5.7%) |
| $25,000 to $34,999 | 8 (21.6%) | 0 (0.0%) |
| $35,000 to $49,999 | 1 (2.7%) | 0 (0.0%) |
| $50,000 to $74,999 | 11 (29.7%) | 2 (3.8%) |
| $75,000 to $99,999 | 2 (5.4%) | 16 (30.2%) |
| $100,000 to $149,999 | 8 (21.6%) | 18 (34.0%) |
| $150,000 or more | 2 (5.4%) | 11 (20.7%) |
| Total | 37 (100.0%) | 53 (100.0%) |
Property Value to Household Income Ratio in Lattimore
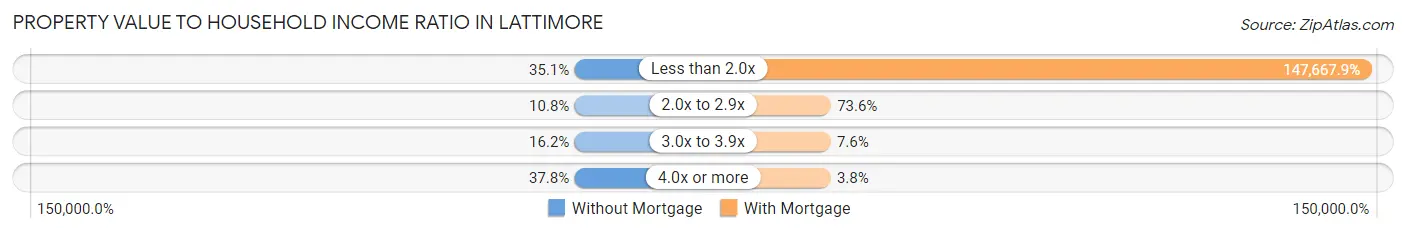
| Value-to-Income Ratio | Without Mortgage | With Mortgage |
| Less than 2.0x | 13 (35.1%) | 78,264 (147,667.9%) |
| 2.0x to 2.9x | 4 (10.8%) | 39 (73.6%) |
| 3.0x to 3.9x | 6 (16.2%) | 4 (7.5%) |
| 4.0x or more | 14 (37.8%) | 2 (3.8%) |
| Total | 37 (100.0%) | 53 (100.0%) |
Real Estate Taxes by Mortgage Status in Lattimore
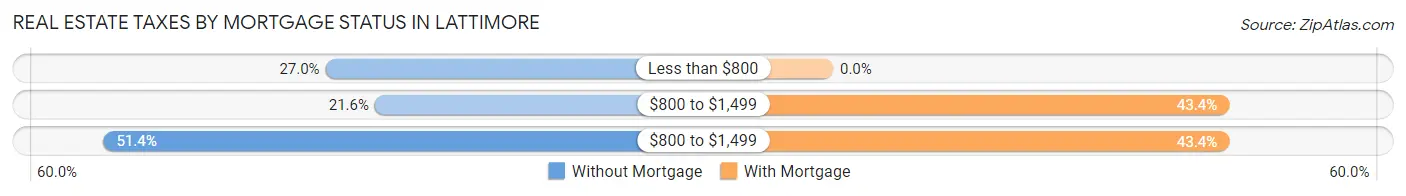
| Property Taxes | Without Mortgage | With Mortgage |
| Less than $800 | 10 (27.0%) | 0 (0.0%) |
| $800 to $1,499 | 8 (21.6%) | 23 (43.4%) |
| $800 to $1,499 | 19 (51.3%) | 23 (43.4%) |
| Total | 37 (100.0%) | 53 (100.0%) |
Health & Disability in Lattimore
Health Insurance Coverage by Age in Lattimore
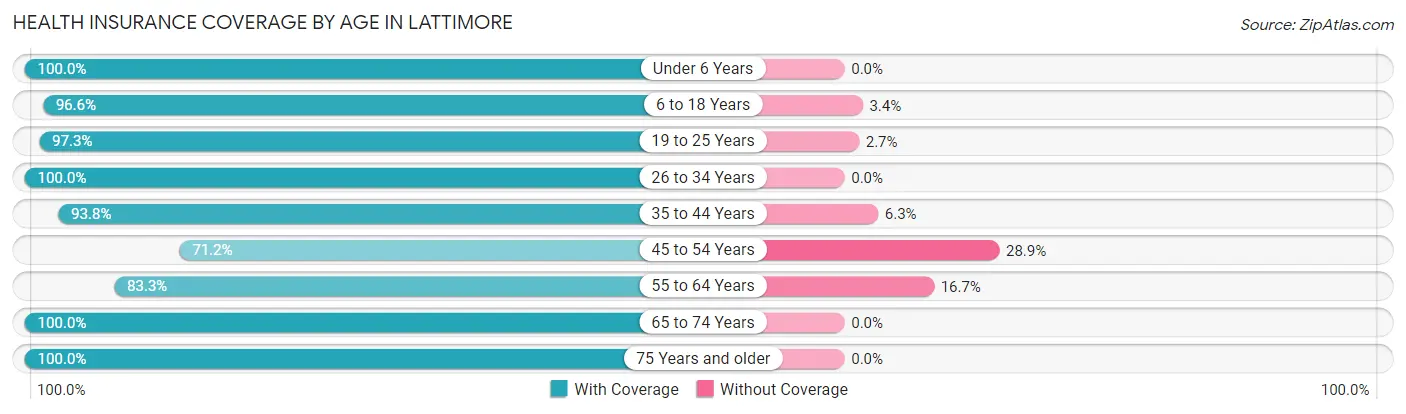
| Age Bracket | With Coverage | Without Coverage |
| Under 6 Years | 32 (100.0%) | 0 (0.0%) |
| 6 to 18 Years | 57 (96.6%) | 2 (3.4%) |
| 19 to 25 Years | 108 (97.3%) | 3 (2.7%) |
| 26 to 34 Years | 165 (100.0%) | 0 (0.0%) |
| 35 to 44 Years | 15 (93.8%) | 1 (6.2%) |
| 45 to 54 Years | 37 (71.2%) | 15 (28.8%) |
| 55 to 64 Years | 25 (83.3%) | 5 (16.7%) |
| 65 to 74 Years | 48 (100.0%) | 0 (0.0%) |
| 75 Years and older | 44 (100.0%) | 0 (0.0%) |
| Total | 531 (95.3%) | 26 (4.7%) |
Health Insurance Coverage by Citizenship Status in Lattimore
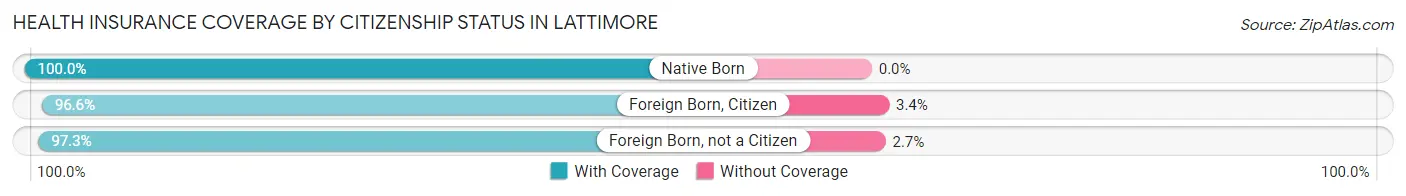
| Citizenship Status | With Coverage | Without Coverage |
| Native Born | 32 (100.0%) | 0 (0.0%) |
| Foreign Born, Citizen | 57 (96.6%) | 2 (3.4%) |
| Foreign Born, not a Citizen | 108 (97.3%) | 3 (2.7%) |
Health Insurance Coverage by Household Income in Lattimore
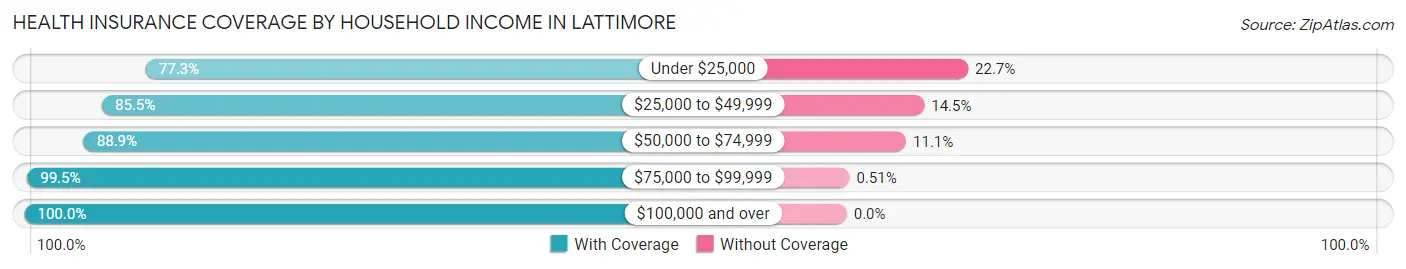
| Household Income | With Coverage | Without Coverage |
| Under $25,000 | 17 (77.3%) | 5 (22.7%) |
| $25,000 to $49,999 | 53 (85.5%) | 9 (14.5%) |
| $50,000 to $74,999 | 88 (88.9%) | 11 (11.1%) |
| $75,000 to $99,999 | 196 (99.5%) | 1 (0.5%) |
| $100,000 and over | 98 (100.0%) | 0 (0.0%) |
Public vs Private Health Insurance Coverage by Age in Lattimore
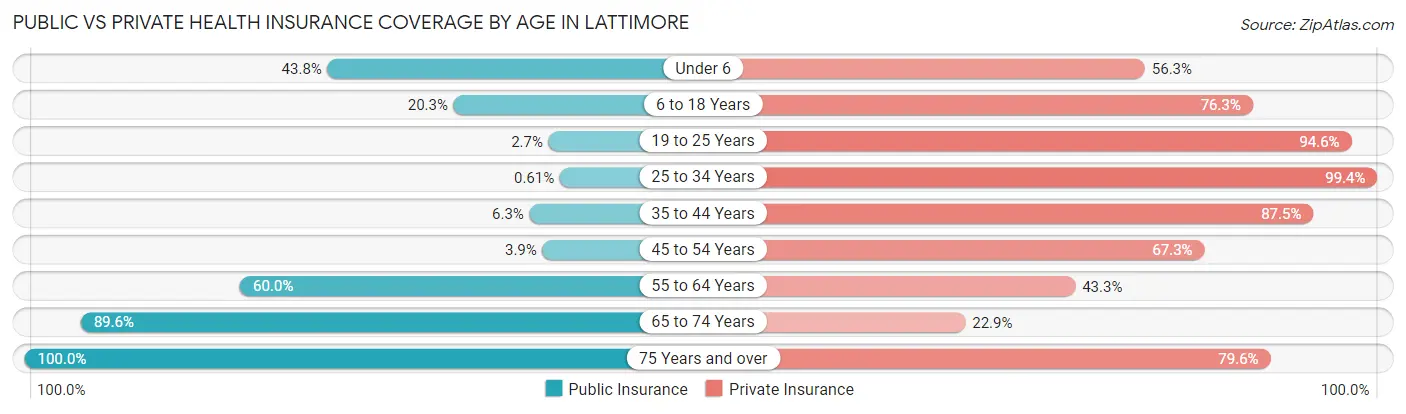
| Age Bracket | Public Insurance | Private Insurance |
| Under 6 | 14 (43.8%) | 18 (56.2%) |
| 6 to 18 Years | 12 (20.3%) | 45 (76.3%) |
| 19 to 25 Years | 3 (2.7%) | 105 (94.6%) |
| 25 to 34 Years | 1 (0.6%) | 164 (99.4%) |
| 35 to 44 Years | 1 (6.2%) | 14 (87.5%) |
| 45 to 54 Years | 2 (3.8%) | 35 (67.3%) |
| 55 to 64 Years | 18 (60.0%) | 13 (43.3%) |
| 65 to 74 Years | 43 (89.6%) | 11 (22.9%) |
| 75 Years and over | 44 (100.0%) | 35 (79.5%) |
| Total | 138 (24.8%) | 440 (79.0%) |
Disability Status by Sex by Age in Lattimore
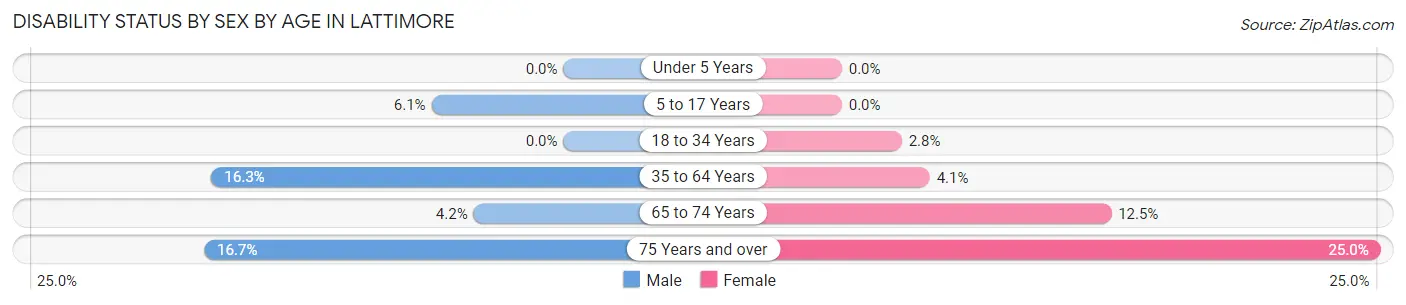
| Age Bracket | Male | Female |
| Under 5 Years | 0 (0.0%) | 0 (0.0%) |
| 5 to 17 Years | 3 (6.1%) | 0 (0.0%) |
| 18 to 34 Years | 0 (0.0%) | 3 (2.8%) |
| 35 to 64 Years | 8 (16.3%) | 2 (4.1%) |
| 65 to 74 Years | 1 (4.2%) | 3 (12.5%) |
| 75 Years and over | 2 (16.7%) | 8 (25.0%) |
Disability Class by Sex by Age in Lattimore
Disability Class: Hearing Difficulty
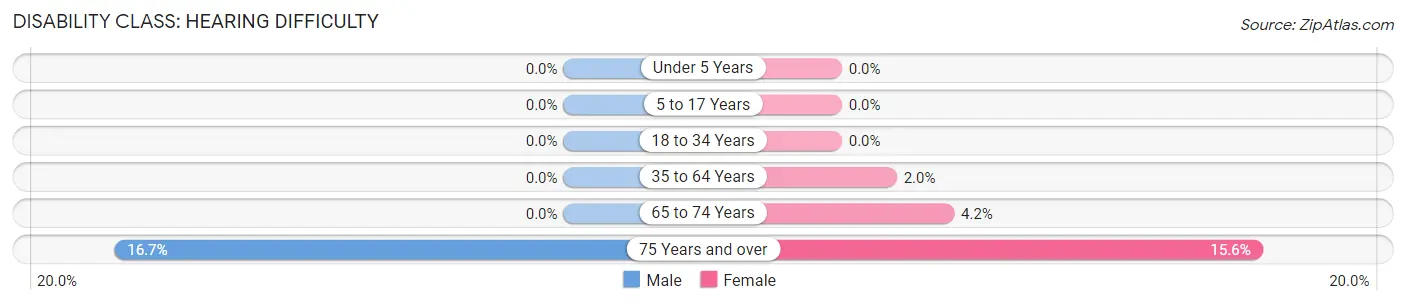
| Age Bracket | Male | Female |
| Under 5 Years | 0 (0.0%) | 0 (0.0%) |
| 5 to 17 Years | 0 (0.0%) | 0 (0.0%) |
| 18 to 34 Years | 0 (0.0%) | 0 (0.0%) |
| 35 to 64 Years | 0 (0.0%) | 1 (2.0%) |
| 65 to 74 Years | 0 (0.0%) | 1 (4.2%) |
| 75 Years and over | 2 (16.7%) | 5 (15.6%) |
Disability Class: Vision Difficulty
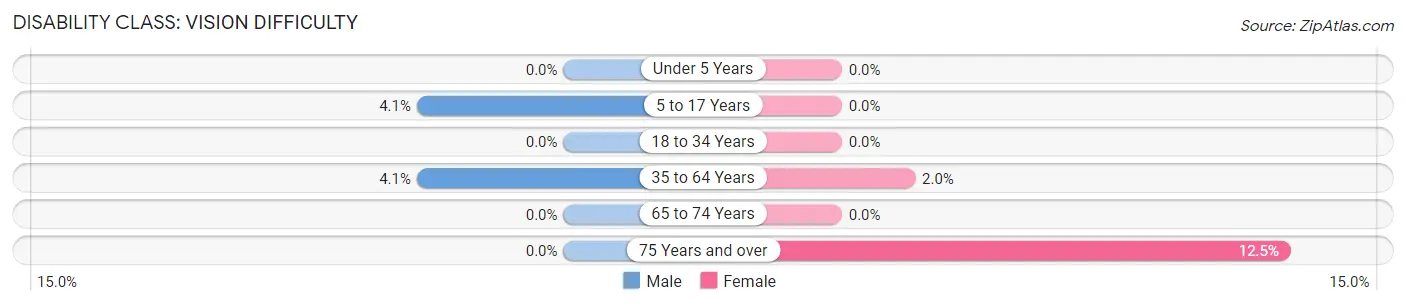
| Age Bracket | Male | Female |
| Under 5 Years | 0 (0.0%) | 0 (0.0%) |
| 5 to 17 Years | 2 (4.1%) | 0 (0.0%) |
| 18 to 34 Years | 0 (0.0%) | 0 (0.0%) |
| 35 to 64 Years | 2 (4.1%) | 1 (2.0%) |
| 65 to 74 Years | 0 (0.0%) | 0 (0.0%) |
| 75 Years and over | 0 (0.0%) | 4 (12.5%) |
Disability Class: Cognitive Difficulty
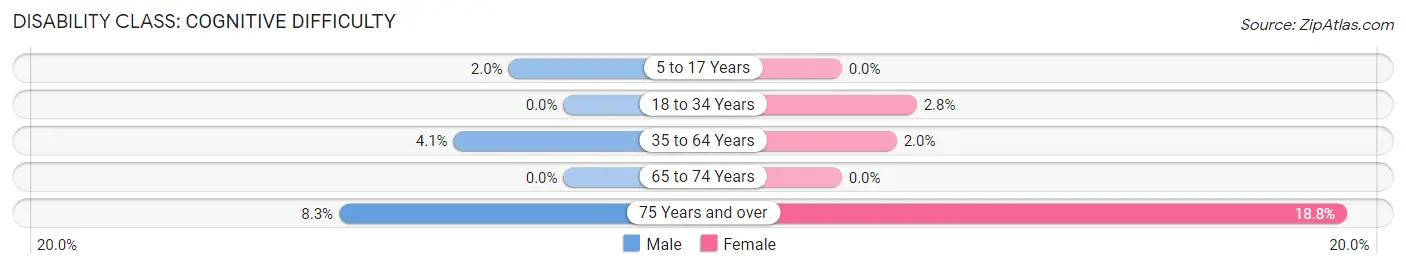
| Age Bracket | Male | Female |
| 5 to 17 Years | 1 (2.0%) | 0 (0.0%) |
| 18 to 34 Years | 0 (0.0%) | 3 (2.8%) |
| 35 to 64 Years | 2 (4.1%) | 1 (2.0%) |
| 65 to 74 Years | 0 (0.0%) | 0 (0.0%) |
| 75 Years and over | 1 (8.3%) | 6 (18.8%) |
Disability Class: Ambulatory Difficulty
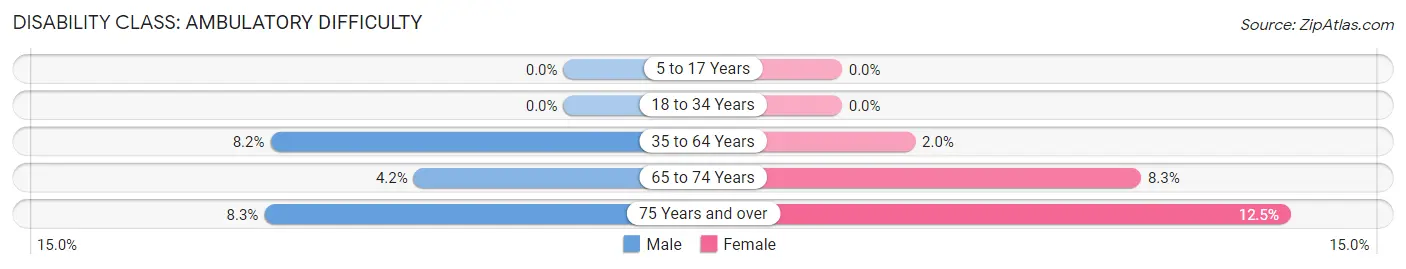
| Age Bracket | Male | Female |
| 5 to 17 Years | 0 (0.0%) | 0 (0.0%) |
| 18 to 34 Years | 0 (0.0%) | 0 (0.0%) |
| 35 to 64 Years | 4 (8.2%) | 1 (2.0%) |
| 65 to 74 Years | 1 (4.2%) | 2 (8.3%) |
| 75 Years and over | 1 (8.3%) | 4 (12.5%) |
Disability Class: Self-Care Difficulty
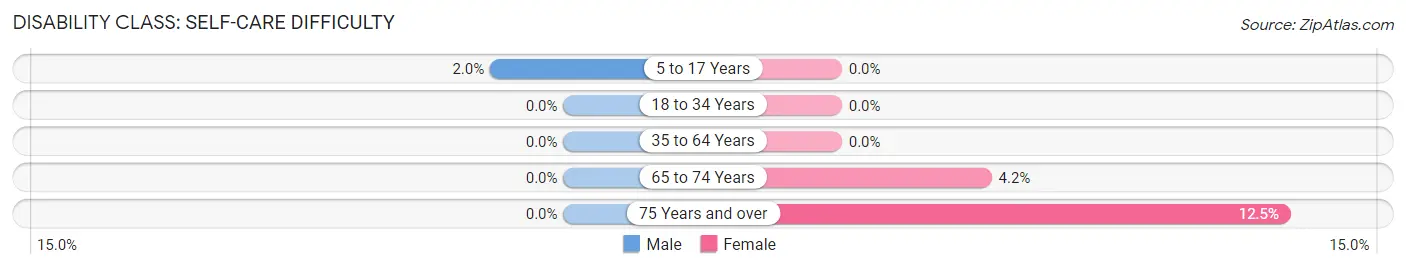
| Age Bracket | Male | Female |
| 5 to 17 Years | 1 (2.0%) | 0 (0.0%) |
| 18 to 34 Years | 0 (0.0%) | 0 (0.0%) |
| 35 to 64 Years | 0 (0.0%) | 0 (0.0%) |
| 65 to 74 Years | 0 (0.0%) | 1 (4.2%) |
| 75 Years and over | 0 (0.0%) | 4 (12.5%) |
Technology Access in Lattimore
Computing Device Access in Lattimore
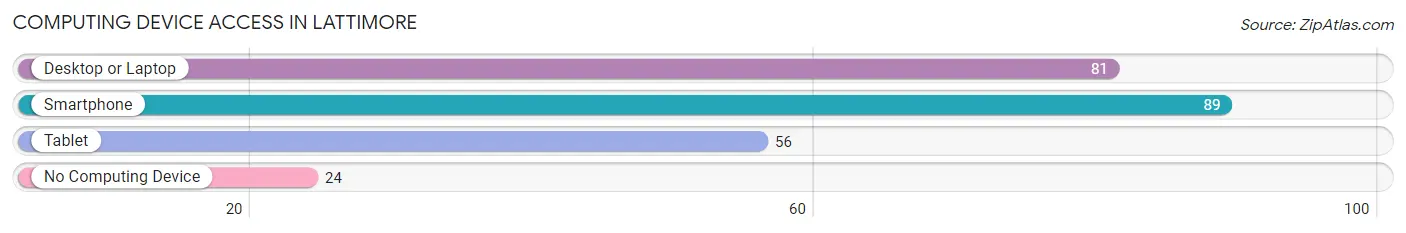
| Device Type | # Households | % Households |
| Desktop or Laptop | 81 | 70.4% |
| Smartphone | 89 | 77.4% |
| Tablet | 56 | 48.7% |
| No Computing Device | 24 | 20.9% |
| Total | 115 | 100.0% |
Internet Access in Lattimore
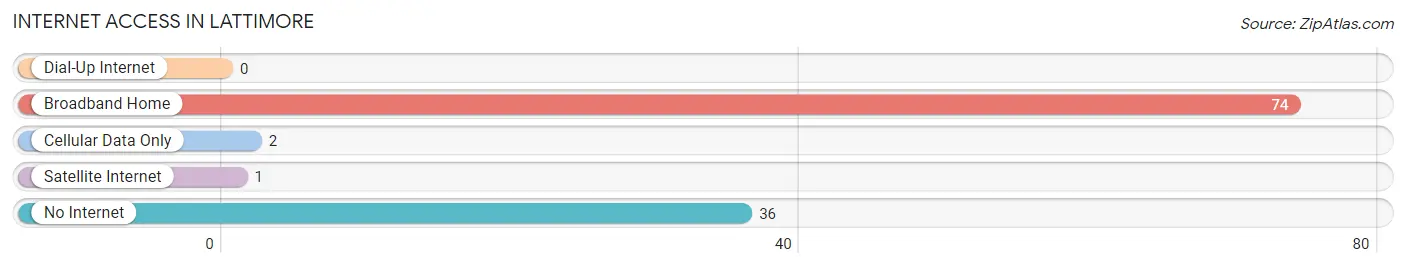
| Internet Type | # Households | % Households |
| Dial-Up Internet | 0 | 0.0% |
| Broadband Home | 74 | 64.3% |
| Cellular Data Only | 2 | 1.7% |
| Satellite Internet | 1 | 0.9% |
| No Internet | 36 | 31.3% |
| Total | 115 | 100.0% |
Lattimore Summary
Lattimore is a small town located in Cleveland County, North Carolina. It is situated in the foothills of the Blue Ridge Mountains, approximately 25 miles east of Shelby and 40 miles west of Charlotte. The town was founded in 1887 and named after the Lattimore family, who were early settlers in the area.
Geography
Lattimore is located in the foothills of the Blue Ridge Mountains, at an elevation of 890 feet. The town is situated on the banks of the First Broad River, which flows through the center of town. The town is surrounded by rolling hills and forests, and is home to a variety of wildlife, including deer, wild turkeys, and black bears.
The climate in Lattimore is mild and humid, with average temperatures ranging from the mid-50s in the winter to the mid-80s in the summer. The town receives an average of 48 inches of precipitation per year, with most of it falling in the form of rain.
Economy
The economy of Lattimore is largely based on agriculture and manufacturing. The town is home to several small farms, which produce a variety of crops, including corn, soybeans, and tobacco. The town is also home to several small manufacturing companies, which produce a variety of products, including furniture, textiles, and automotive parts.
In addition to agriculture and manufacturing, the town is also home to several small businesses, including restaurants, retail stores, and service providers. The town is also home to a small airport, which serves as a hub for private and corporate aircraft.
Demographics
As of the 2010 census, the population of Lattimore was 1,845. The town is predominantly white, with a small African American population. The median household income in the town is $37,000, and the median home value is $125,000.
The town is served by the Cleveland County School District, which includes two elementary schools, one middle school, and one high school. The town is also home to a branch of the Cleveland Community College, which offers a variety of courses and programs.
Conclusion
Lattimore is a small town located in Cleveland County, North Carolina. It is situated in the foothills of the Blue Ridge Mountains, and is home to a variety of wildlife. The town's economy is largely based on agriculture and manufacturing, and it is served by the Cleveland County School District. The population of Lattimore is predominantly white, with a small African American population.
Common Questions
What is Per Capita Income in Lattimore?
Per Capita income in Lattimore is $18,634.
What is the Median Family Income in Lattimore?
Median Family Income in Lattimore is $73,500.
What is the Median Household income in Lattimore?
Median Household Income in Lattimore is $68,125.
What is Inequality or Gini Index in Lattimore?
Inequality or Gini Index in Lattimore is 0.32.
What is the Total Population of Lattimore?
Total Population of Lattimore is 557.
What is the Total Male Population of Lattimore?
Total Male Population of Lattimore is 321.
What is the Total Female Population of Lattimore?
Total Female Population of Lattimore is 236.
What is the Ratio of Males per 100 Females in Lattimore?
There are 136.02 Males per 100 Females in Lattimore.
What is the Ratio of Females per 100 Males in Lattimore?
There are 73.52 Females per 100 Males in Lattimore.
What is the Median Population Age in Lattimore?
Median Population Age in Lattimore is 31.7 Years.
What is the Average Family Size in Lattimore
Average Family Size in Lattimore is 4.8 People.
What is the Average Household Size in Lattimore
Average Household Size in Lattimore is 4.2 People.
How Large is the Labor Force in Lattimore?
There are 299 People in the Labor Forcein in Lattimore.
What is the Percentage of People in the Labor Force in Lattimore?
61.9% of People are in the Labor Force in Lattimore.
What is the Unemployment Rate in Lattimore?
Unemployment Rate in Lattimore is 1.7%.