Lake Junaluska, NC Map & Demographics
Lake Junaluska Map
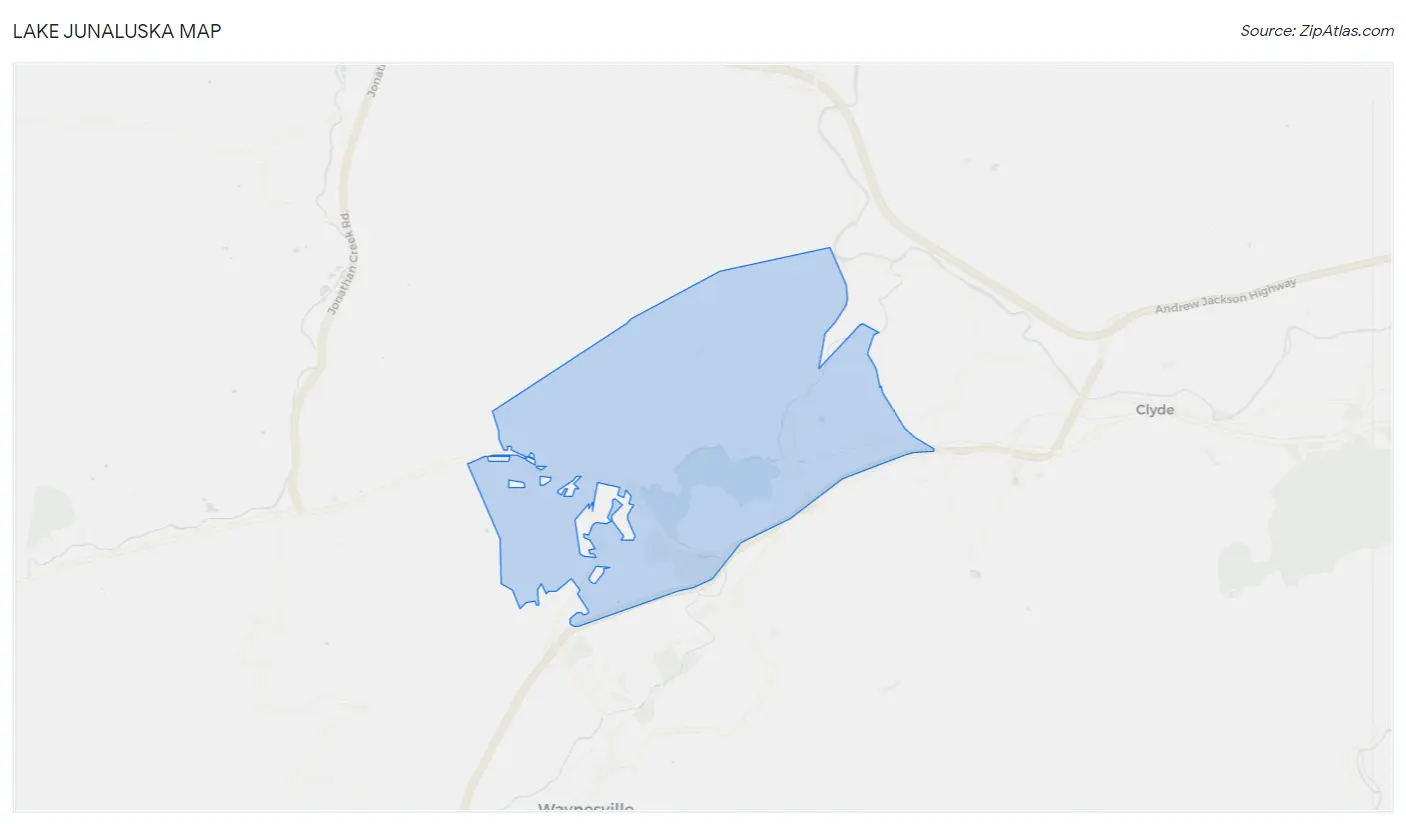
Lake Junaluska Overview
$36,050
PER CAPITA INCOME
$96,985
AVG FAMILY INCOME
$71,875
AVG HOUSEHOLD INCOME
0.6%
WAGE / INCOME GAP [ % ]
99.4¢/ $1
WAGE / INCOME GAP [ $ ]
0.40
INEQUALITY / GINI INDEX
2,977
TOTAL POPULATION
1,318
MALE POPULATION
1,659
FEMALE POPULATION
79.45
MALES / 100 FEMALES
125.87
FEMALES / 100 MALES
47.6
MEDIAN AGE
3.1
AVG FAMILY SIZE
2.4
AVG HOUSEHOLD SIZE
1,293
LABOR FORCE [ PEOPLE ]
52.2%
PERCENT IN LABOR FORCE
6.9%
UNEMPLOYMENT RATE
Lake Junaluska Zip Codes
Lake Junaluska Area Codes
Income in Lake Junaluska
Income Overview in Lake Junaluska
Per Capita Income in Lake Junaluska is $36,050, while median incomes of families and households are $96,985 and $71,875 respectively.
| Characteristic | Number | Measure |
| Per Capita Income | 2,977 | $36,050 |
| Median Family Income | 751 | $96,985 |
| Mean Family Income | 751 | $104,361 |
| Median Household Income | 1,255 | $71,875 |
| Mean Household Income | 1,255 | $78,662 |
| Income Deficit | 751 | $0 |
| Wage / Income Gap (%) | 2,977 | 0.63% |
| Wage / Income Gap ($) | 2,977 | 99.37¢ per $1 |
| Gini / Inequality Index | 2,977 | 0.40 |
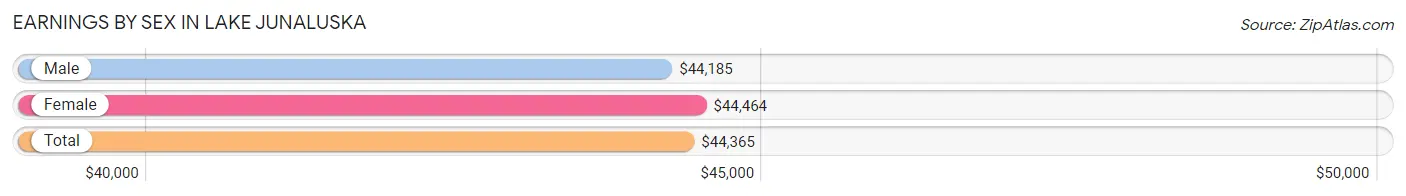
Earnings by Sex in Lake Junaluska
Average Earnings in Lake Junaluska are $44,365, $44,185 for men and $44,464 for women, a difference of 0.6%.
| Sex | Number | Average Earnings |
| Male | 603 (46.9%) | $44,185 |
| Female | 684 (53.1%) | $44,464 |
| Total | 1,287 (100.0%) | $44,365 |
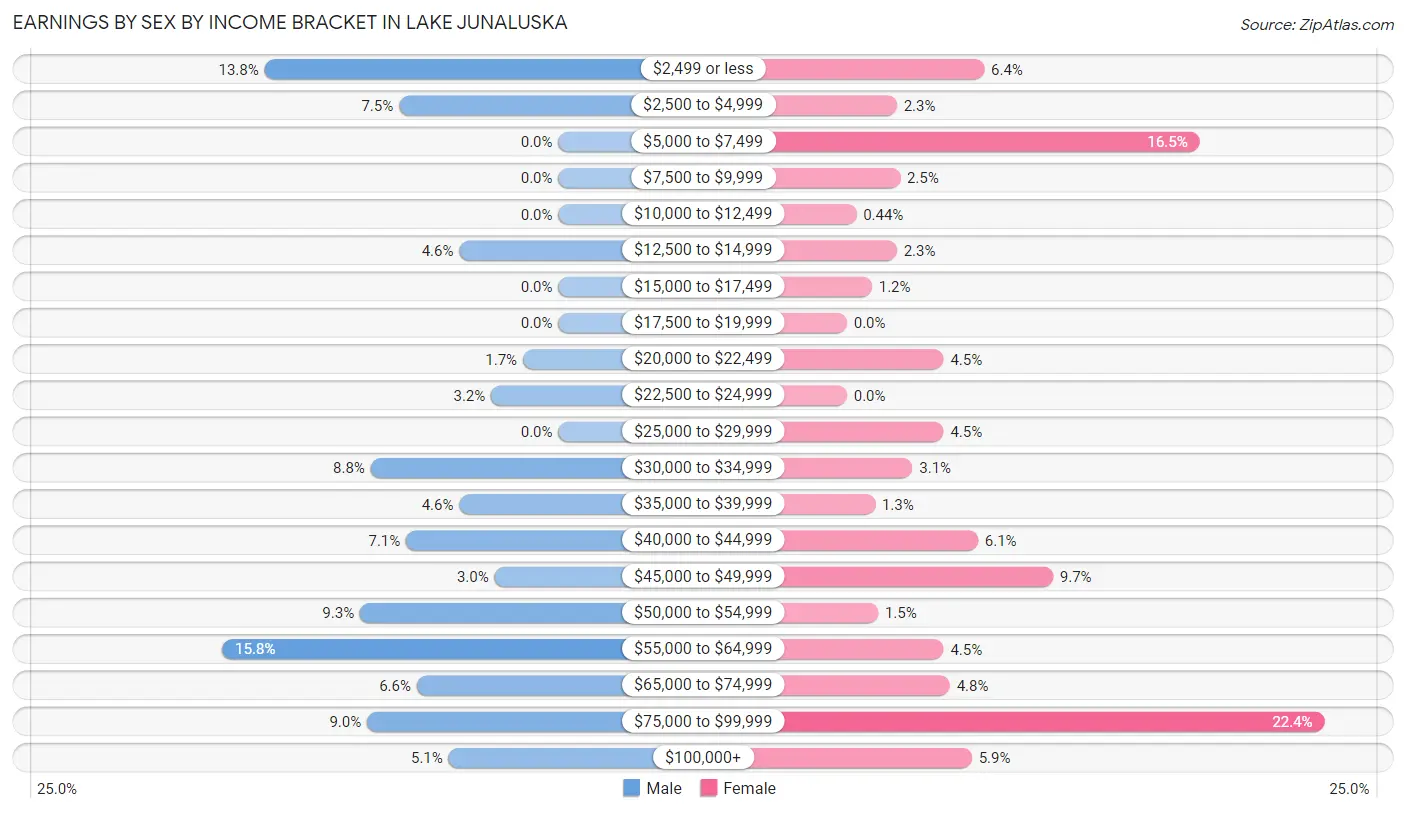
Earnings by Sex by Income Bracket in Lake Junaluska
The most common earnings brackets in Lake Junaluska are $55,000 to $64,999 for men (95 | 15.8%) and $75,000 to $99,999 for women (153 | 22.4%).
| Income | Male | Female |
| $2,499 or less | 83 (13.8%) | 44 (6.4%) |
| $2,500 to $4,999 | 45 (7.5%) | 16 (2.3%) |
| $5,000 to $7,499 | 0 (0.0%) | 113 (16.5%) |
| $7,500 to $9,999 | 0 (0.0%) | 17 (2.5%) |
| $10,000 to $12,499 | 0 (0.0%) | 3 (0.4%) |
| $12,500 to $14,999 | 28 (4.6%) | 16 (2.3%) |
| $15,000 to $17,499 | 0 (0.0%) | 8 (1.2%) |
| $17,500 to $19,999 | 0 (0.0%) | 0 (0.0%) |
| $20,000 to $22,499 | 10 (1.7%) | 31 (4.5%) |
| $22,500 to $24,999 | 19 (3.2%) | 0 (0.0%) |
| $25,000 to $29,999 | 0 (0.0%) | 31 (4.5%) |
| $30,000 to $34,999 | 53 (8.8%) | 21 (3.1%) |
| $35,000 to $39,999 | 28 (4.6%) | 9 (1.3%) |
| $40,000 to $44,999 | 43 (7.1%) | 42 (6.1%) |
| $45,000 to $49,999 | 18 (3.0%) | 66 (9.7%) |
| $50,000 to $54,999 | 56 (9.3%) | 10 (1.5%) |
| $55,000 to $64,999 | 95 (15.8%) | 31 (4.5%) |
| $65,000 to $74,999 | 40 (6.6%) | 33 (4.8%) |
| $75,000 to $99,999 | 54 (9.0%) | 153 (22.4%) |
| $100,000+ | 31 (5.1%) | 40 (5.9%) |
| Total | 603 (100.0%) | 684 (100.0%) |
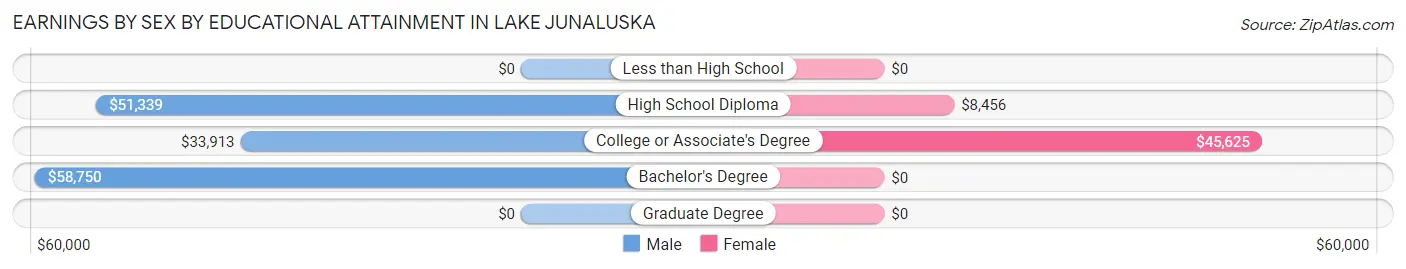
Earnings by Sex by Educational Attainment in Lake Junaluska
Average earnings in Lake Junaluska are $50,469 for men and $45,341 for women, a difference of 10.2%. Men with an educational attainment of bachelor's degree enjoy the highest average annual earnings of $58,750, while those with college or associate's degree education earn the least with $33,913. Women with an educational attainment of college or associate's degree earn the most with the average annual earnings of $45,625, while those with high school diploma education have the smallest earnings of $8,456.
| Educational Attainment | Male Income | Female Income |
| Less than High School | - | - |
| High School Diploma | $51,339 | $8,456 |
| College or Associate's Degree | $33,913 | $45,625 |
| Bachelor's Degree | $58,750 | $0 |
| Graduate Degree | - | - |
| Total | $50,469 | $45,341 |
Family Income in Lake Junaluska
Family Income Brackets in Lake Junaluska
According to the Lake Junaluska family income data, there are 317 families falling into the $100,000 to $149,999 income range, which is the most common income bracket and makes up 42.2% of all families.
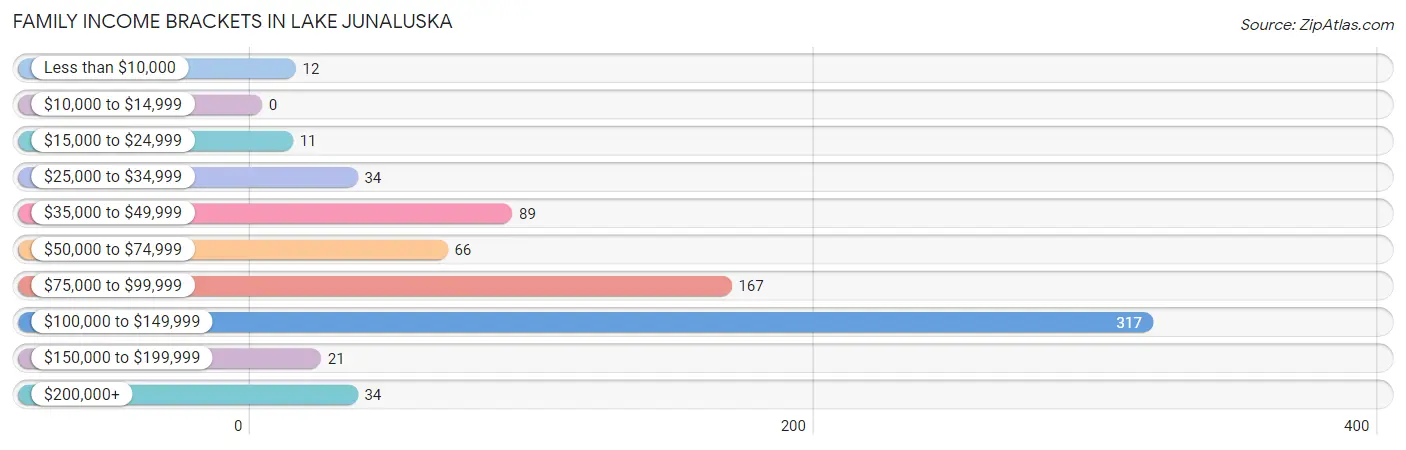
| Income Bracket | # Families | % Families |
| Less than $10,000 | 12 | 1.6% |
| $10,000 to $14,999 | 0 | 0.0% |
| $15,000 to $24,999 | 11 | 1.5% |
| $25,000 to $34,999 | 34 | 4.5% |
| $35,000 to $49,999 | 89 | 11.9% |
| $50,000 to $74,999 | 66 | 8.8% |
| $75,000 to $99,999 | 167 | 22.2% |
| $100,000 to $149,999 | 317 | 42.2% |
| $150,000 to $199,999 | 21 | 2.8% |
| $200,000+ | 34 | 4.5% |
Family Income by Famaliy Size in Lake Junaluska
4-person families (178 | 23.7%) account for the highest median family income in Lake Junaluska with $127,738 per family, while 2-person families (428 | 57.0%) have the highest median income of $49,375 per family member.
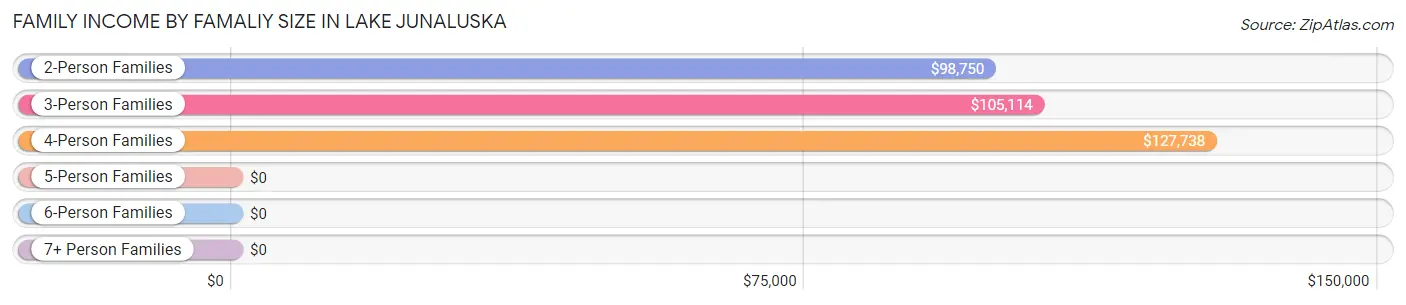
| Income Bracket | # Families | Median Income |
| 2-Person Families | 428 (57.0%) | $98,750 |
| 3-Person Families | 107 (14.2%) | $105,114 |
| 4-Person Families | 178 (23.7%) | $127,738 |
| 5-Person Families | 0 (0.0%) | $0 |
| 6-Person Families | 38 (5.1%) | $0 |
| 7+ Person Families | 0 (0.0%) | $0 |
| Total | 751 (100.0%) | $96,985 |
Family Income by Number of Earners in Lake Junaluska
The median family income in Lake Junaluska is $96,985, with families comprising 3+ earners (84) having the highest median family income of $133,884, while families with 1 earner (221) have the lowest median family income of $82,721, accounting for 11.2% and 29.4% of families, respectively.
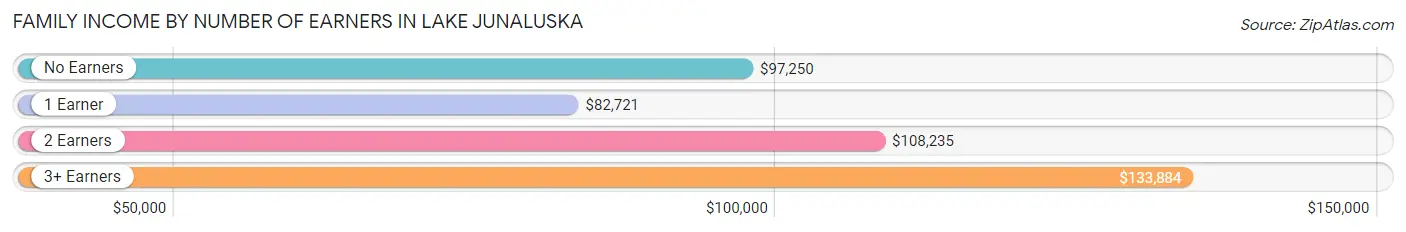
| Number of Earners | # Families | Median Income |
| No Earners | 178 (23.7%) | $97,250 |
| 1 Earner | 221 (29.4%) | $82,721 |
| 2 Earners | 268 (35.7%) | $108,235 |
| 3+ Earners | 84 (11.2%) | $133,884 |
| Total | 751 (100.0%) | $96,985 |
Household Income in Lake Junaluska
Household Income Brackets in Lake Junaluska
With 356 households falling in the category, the $100,000 to $149,999 income range is the most frequent in Lake Junaluska, accounting for 28.4% of all households. In contrast, only 15 households (1.2%) fall into the $10,000 to $14,999 income bracket, making it the least populous group.
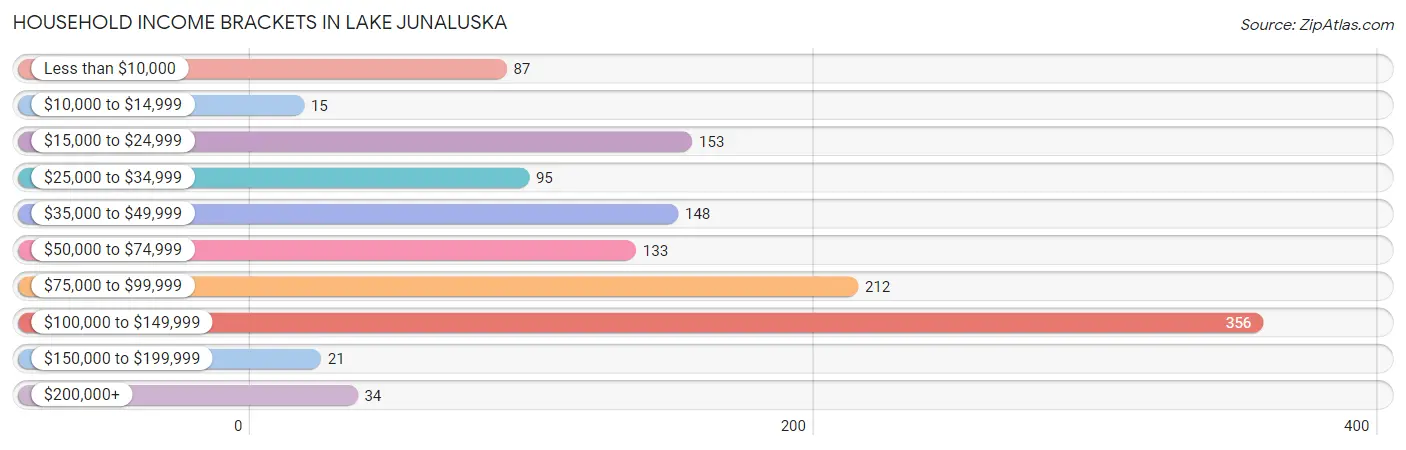
| Income Bracket | # Households | % Households |
| Less than $10,000 | 87 | 6.9% |
| $10,000 to $14,999 | 15 | 1.2% |
| $15,000 to $24,999 | 153 | 12.2% |
| $25,000 to $34,999 | 95 | 7.6% |
| $35,000 to $49,999 | 148 | 11.8% |
| $50,000 to $74,999 | 133 | 10.6% |
| $75,000 to $99,999 | 212 | 16.9% |
| $100,000 to $149,999 | 356 | 28.4% |
| $150,000 to $199,999 | 21 | 1.7% |
| $200,000+ | 34 | 2.7% |
Household Income by Householder Age in Lake Junaluska
The median household income in Lake Junaluska is $71,875, with the highest median household income of $87,679 found in the 45 to 64 years age bracket for the primary householder. A total of 426 households (33.9%) fall into this category. Meanwhile, the 15 to 24 years age bracket for the primary householder has the lowest median household income of $0, with 25 households (2.0%) in this group.
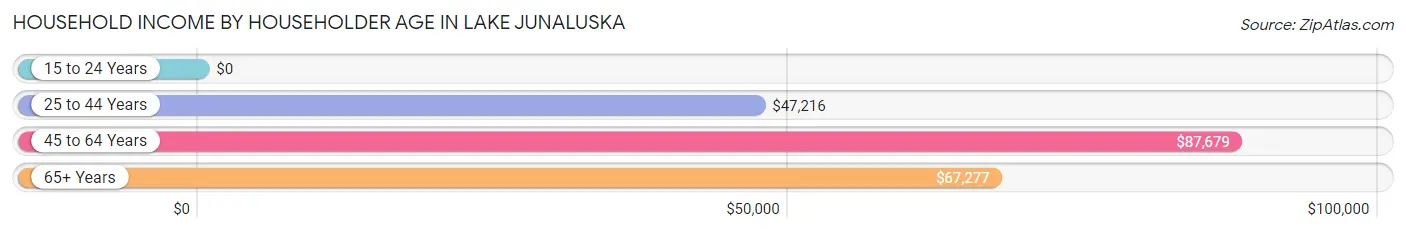
| Income Bracket | # Households | Median Income |
| 15 to 24 Years | 25 (2.0%) | $0 |
| 25 to 44 Years | 227 (18.1%) | $47,216 |
| 45 to 64 Years | 426 (33.9%) | $87,679 |
| 65+ Years | 577 (46.0%) | $67,277 |
| Total | 1,255 (100.0%) | $71,875 |
Poverty in Lake Junaluska
Income Below Poverty by Sex and Age in Lake Junaluska
With 8.8% poverty level for males and 8.3% for females among the residents of Lake Junaluska, under 5 year old males and 6 to 11 year old females are the most vulnerable to poverty, with 29 males (59.2%) and 40 females (26.5%) in their respective age groups living below the poverty level.
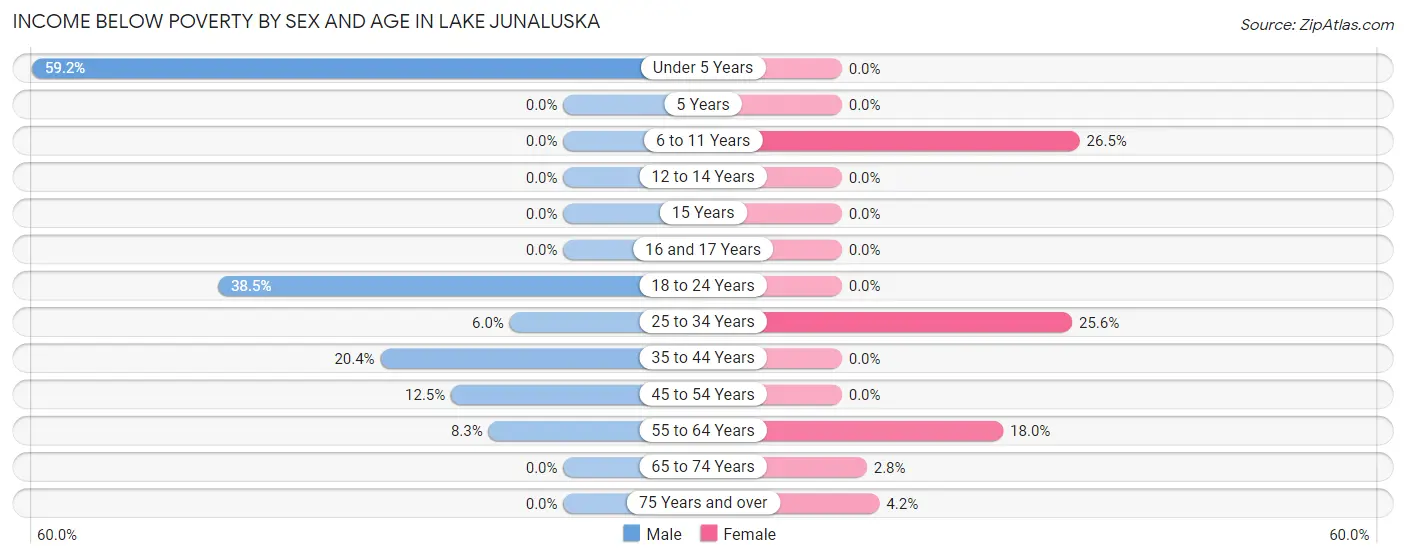
| Age Bracket | Male | Female |
| Under 5 Years | 29 (59.2%) | 0 (0.0%) |
| 5 Years | 0 (0.0%) | 0 (0.0%) |
| 6 to 11 Years | 0 (0.0%) | 40 (26.5%) |
| 12 to 14 Years | 0 (0.0%) | 0 (0.0%) |
| 15 Years | 0 (0.0%) | 0 (0.0%) |
| 16 and 17 Years | 0 (0.0%) | 0 (0.0%) |
| 18 to 24 Years | 25 (38.5%) | 0 (0.0%) |
| 25 to 34 Years | 11 (6.0%) | 20 (25.6%) |
| 35 to 44 Years | 22 (20.4%) | 0 (0.0%) |
| 45 to 54 Years | 11 (12.5%) | 0 (0.0%) |
| 55 to 64 Years | 18 (8.3%) | 62 (18.0%) |
| 65 to 74 Years | 0 (0.0%) | 7 (2.8%) |
| 75 Years and over | 0 (0.0%) | 8 (4.2%) |
| Total | 116 (8.8%) | 137 (8.3%) |
Income Above Poverty by Sex and Age in Lake Junaluska
According to the poverty statistics in Lake Junaluska, males aged 6 to 11 years and females aged under 5 years are the age groups that are most secure financially, with 100.0% of males and 100.0% of females in these age groups living above the poverty line.
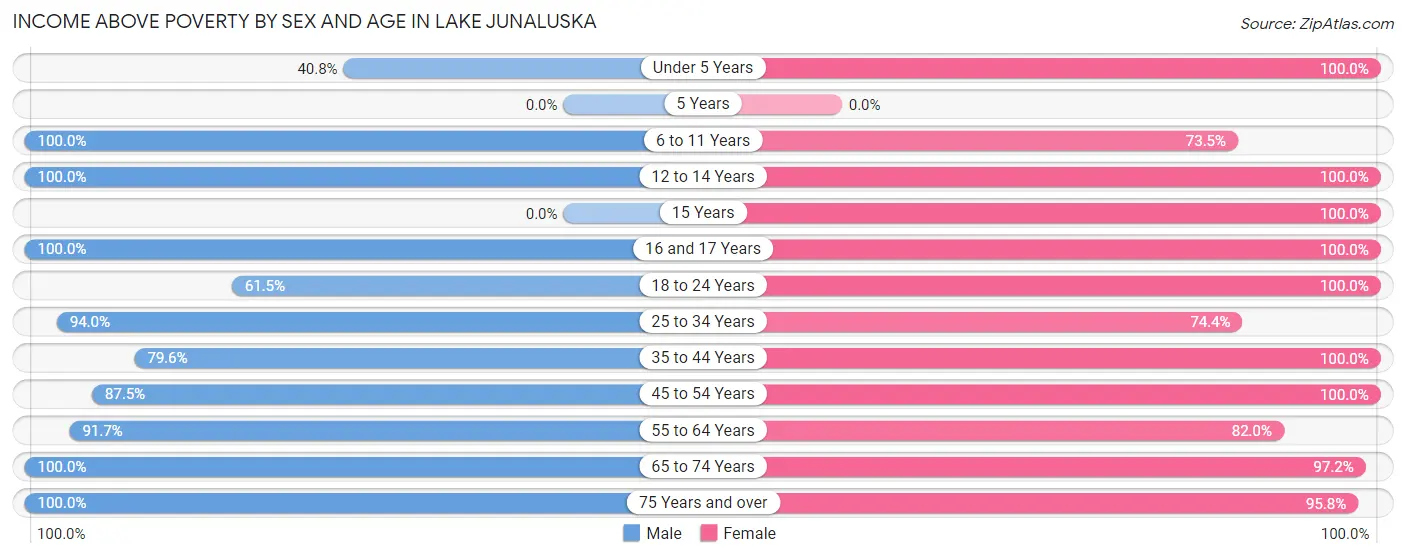
| Age Bracket | Male | Female |
| Under 5 Years | 20 (40.8%) | 37 (100.0%) |
| 5 Years | 0 (0.0%) | 0 (0.0%) |
| 6 to 11 Years | 72 (100.0%) | 111 (73.5%) |
| 12 to 14 Years | 94 (100.0%) | 80 (100.0%) |
| 15 Years | 0 (0.0%) | 17 (100.0%) |
| 16 and 17 Years | 65 (100.0%) | 54 (100.0%) |
| 18 to 24 Years | 40 (61.5%) | 78 (100.0%) |
| 25 to 34 Years | 173 (94.0%) | 58 (74.4%) |
| 35 to 44 Years | 86 (79.6%) | 161 (100.0%) |
| 45 to 54 Years | 77 (87.5%) | 215 (100.0%) |
| 55 to 64 Years | 198 (91.7%) | 283 (82.0%) |
| 65 to 74 Years | 187 (100.0%) | 245 (97.2%) |
| 75 Years and over | 190 (100.0%) | 183 (95.8%) |
| Total | 1,202 (91.2%) | 1,522 (91.7%) |
Income Below Poverty Among Married-Couple Families in Lake Junaluska
The poverty statistics for married-couple families in Lake Junaluska show that 1.9% or 11 of the total 590 families live below the poverty line. Families with no children have the highest poverty rate of 2.8%, comprising of 11 families. On the other hand, families with 1 or 2 children have the lowest poverty rate of 0.0%, which includes 0 families.
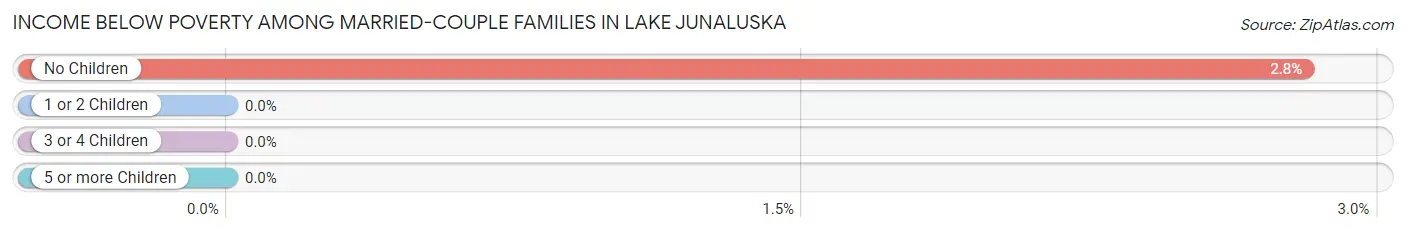
| Children | Above Poverty | Below Poverty |
| No Children | 381 (97.2%) | 11 (2.8%) |
| 1 or 2 Children | 160 (100.0%) | 0 (0.0%) |
| 3 or 4 Children | 38 (100.0%) | 0 (0.0%) |
| 5 or more Children | 0 (0.0%) | 0 (0.0%) |
| Total | 579 (98.1%) | 11 (1.9%) |
Income Below Poverty Among Single-Parent Households in Lake Junaluska
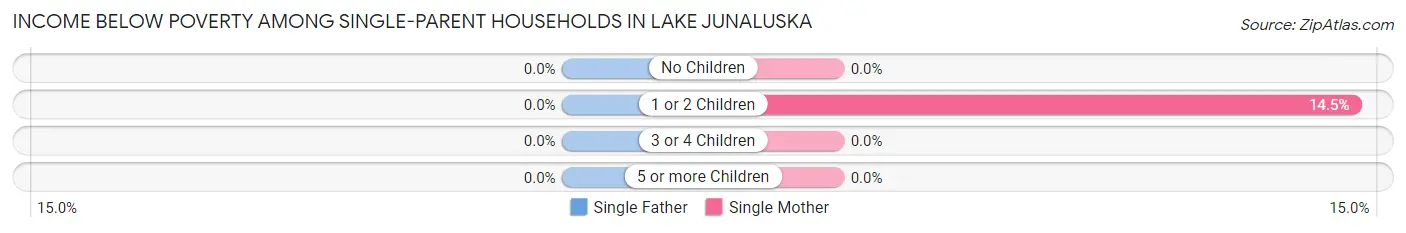
| Children | Single Father | Single Mother |
| No Children | 0 (0.0%) | 0 (0.0%) |
| 1 or 2 Children | 0 (0.0%) | 12 (14.5%) |
| 3 or 4 Children | 0 (0.0%) | 0 (0.0%) |
| 5 or more Children | 0 (0.0%) | 0 (0.0%) |
| Total | 0 (0.0%) | 12 (10.7%) |
Income Below Poverty Among Married-Couple vs Single-Parent Households in Lake Junaluska
The poverty data for Lake Junaluska shows that 11 of the married-couple family households (1.9%) and 12 of the single-parent households (7.4%) are living below the poverty level. Within the married-couple family households, those with no children have the highest poverty rate, with 11 households (2.8%) falling below the poverty line. Among the single-parent households, those with 1 or 2 children have the highest poverty rate, with 12 household (10.6%) living below poverty.
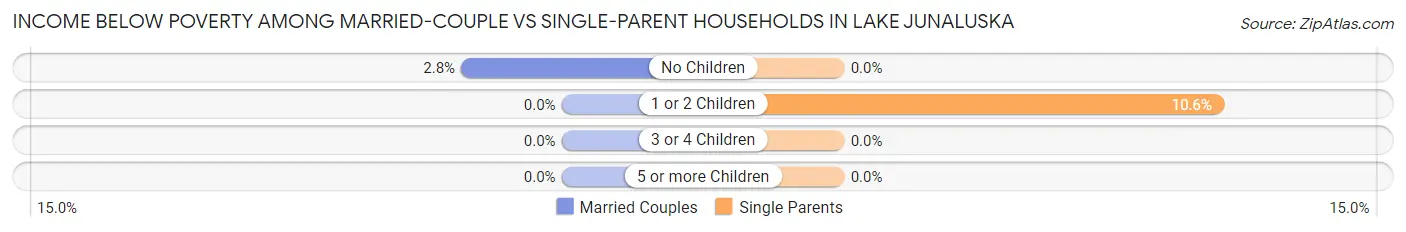
| Children | Married-Couple Families | Single-Parent Households |
| No Children | 11 (2.8%) | 0 (0.0%) |
| 1 or 2 Children | 0 (0.0%) | 12 (10.6%) |
| 3 or 4 Children | 0 (0.0%) | 0 (0.0%) |
| 5 or more Children | 0 (0.0%) | 0 (0.0%) |
| Total | 11 (1.9%) | 12 (7.4%) |
Race in Lake Junaluska
The most populous races in Lake Junaluska are White / Caucasian (2,814 | 94.5%), Hispanic or Latino (90 | 3.0%), and Two or more Races (88 | 3.0%).
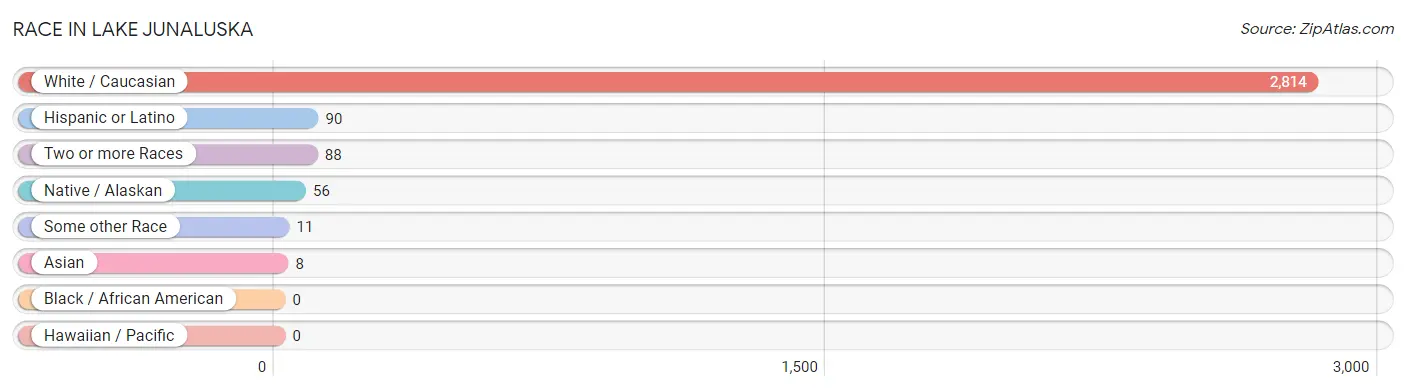
| Race | # Population | % Population |
| Asian | 8 | 0.3% |
| Black / African American | 0 | 0.0% |
| Hawaiian / Pacific | 0 | 0.0% |
| Hispanic or Latino | 90 | 3.0% |
| Native / Alaskan | 56 | 1.9% |
| White / Caucasian | 2,814 | 94.5% |
| Two or more Races | 88 | 3.0% |
| Some other Race | 11 | 0.4% |
| Total | 2,977 | 100.0% |
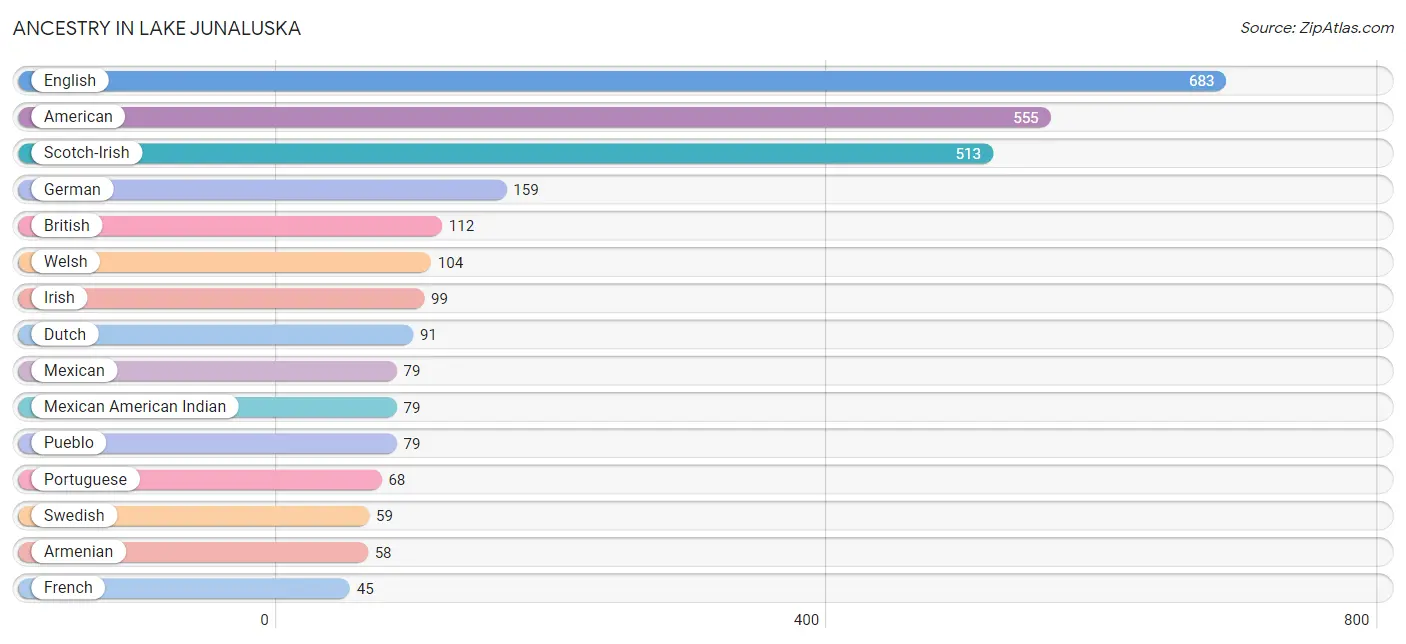
Ancestry in Lake Junaluska
The most populous ancestries reported in Lake Junaluska are English (683 | 22.9%), American (555 | 18.6%), Scotch-Irish (513 | 17.2%), German (159 | 5.3%), and British (112 | 3.8%), together accounting for 67.9% of all Lake Junaluska residents.
| Ancestry | # Population | % Population |
| American | 555 | 18.6% |
| Arab | 17 | 0.6% |
| Armenian | 58 | 1.9% |
| British | 112 | 3.8% |
| Colombian | 11 | 0.4% |
| Dutch | 91 | 3.1% |
| English | 683 | 22.9% |
| European | 33 | 1.1% |
| Finnish | 9 | 0.3% |
| French | 45 | 1.5% |
| German | 159 | 5.3% |
| Irish | 99 | 3.3% |
| Italian | 17 | 0.6% |
| Lebanese | 17 | 0.6% |
| Lithuanian | 11 | 0.4% |
| Mexican | 79 | 2.6% |
| Mexican American Indian | 79 | 2.6% |
| Northern European | 20 | 0.7% |
| Polish | 31 | 1.0% |
| Portuguese | 68 | 2.3% |
| Pueblo | 79 | 2.6% |
| Romanian | 17 | 0.6% |
| Russian | 26 | 0.9% |
| Scotch-Irish | 513 | 17.2% |
| Scottish | 38 | 1.3% |
| South American | 11 | 0.4% |
| Sri Lankan | 8 | 0.3% |
| Swedish | 59 | 2.0% |
| Welsh | 104 | 3.5% | View All 29 Rows |
Immigrants in Lake Junaluska
The most numerous immigrant groups reported in Lake Junaluska came from Europe (14 | 0.5%), France (14 | 0.5%), Western Europe (14 | 0.5%), Colombia (11 | 0.4%), and Latin America (11 | 0.4%), together accounting for 2.2% of all Lake Junaluska residents.
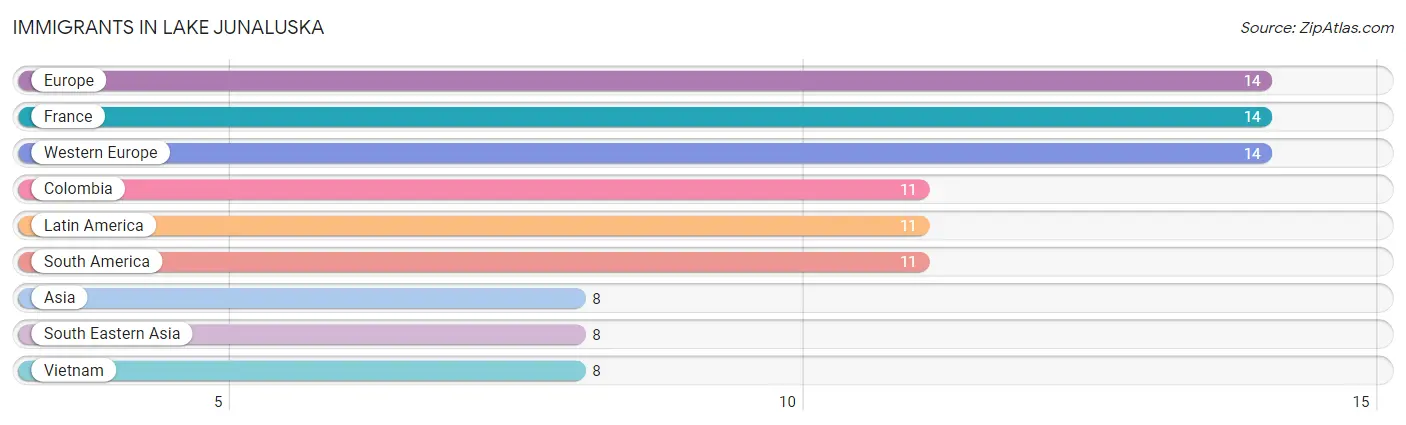
| Immigration Origin | # Population | % Population |
| Asia | 8 | 0.3% |
| Colombia | 11 | 0.4% |
| Europe | 14 | 0.5% |
| France | 14 | 0.5% |
| Latin America | 11 | 0.4% |
| South America | 11 | 0.4% |
| South Eastern Asia | 8 | 0.3% |
| Vietnam | 8 | 0.3% |
| Western Europe | 14 | 0.5% | View All 9 Rows |
Sex and Age in Lake Junaluska
Sex and Age in Lake Junaluska
The most populous age groups in Lake Junaluska are 55 to 59 Years (139 | 10.5%) for men and 60 to 64 Years (228 | 13.7%) for women.
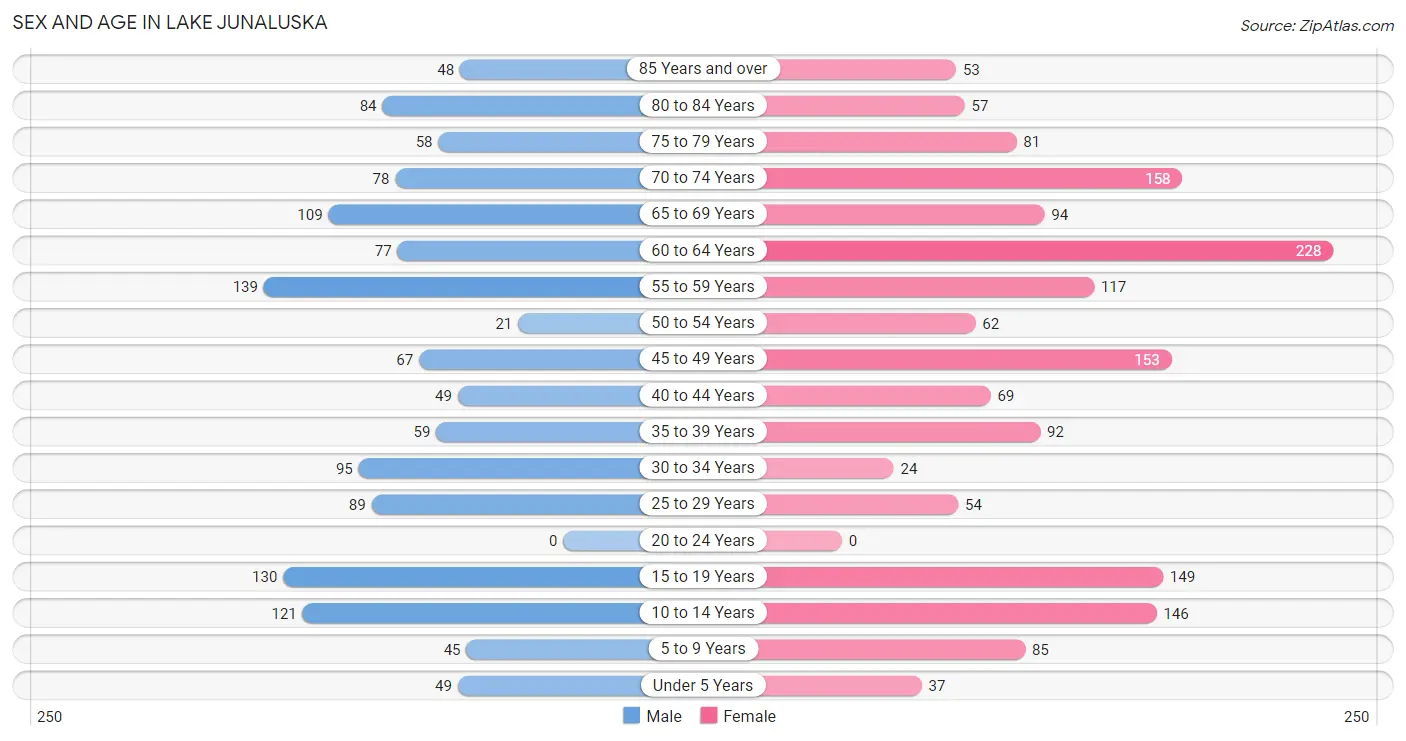
| Age Bracket | Male | Female |
| Under 5 Years | 49 (3.7%) | 37 (2.2%) |
| 5 to 9 Years | 45 (3.4%) | 85 (5.1%) |
| 10 to 14 Years | 121 (9.2%) | 146 (8.8%) |
| 15 to 19 Years | 130 (9.9%) | 149 (9.0%) |
| 20 to 24 Years | 0 (0.0%) | 0 (0.0%) |
| 25 to 29 Years | 89 (6.8%) | 54 (3.3%) |
| 30 to 34 Years | 95 (7.2%) | 24 (1.5%) |
| 35 to 39 Years | 59 (4.5%) | 92 (5.6%) |
| 40 to 44 Years | 49 (3.7%) | 69 (4.2%) |
| 45 to 49 Years | 67 (5.1%) | 153 (9.2%) |
| 50 to 54 Years | 21 (1.6%) | 62 (3.7%) |
| 55 to 59 Years | 139 (10.5%) | 117 (7.0%) |
| 60 to 64 Years | 77 (5.8%) | 228 (13.7%) |
| 65 to 69 Years | 109 (8.3%) | 94 (5.7%) |
| 70 to 74 Years | 78 (5.9%) | 158 (9.5%) |
| 75 to 79 Years | 58 (4.4%) | 81 (4.9%) |
| 80 to 84 Years | 84 (6.4%) | 57 (3.4%) |
| 85 Years and over | 48 (3.6%) | 53 (3.2%) |
| Total | 1,318 (100.0%) | 1,659 (100.0%) |
Families and Households in Lake Junaluska
Median Family Size in Lake Junaluska
The median family size in Lake Junaluska is 3.14 persons per family, with single female/mother families (112 | 14.9%) accounting for the largest median family size of 4.14 persons per family. On the other hand, single male/father families (49 | 6.5%) represent the smallest median family size with 2.73 persons per family.
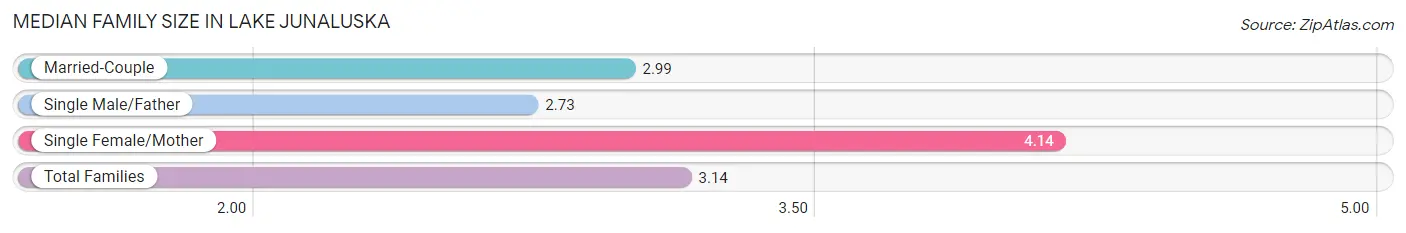
| Family Type | # Families | Family Size |
| Married-Couple | 590 (78.6%) | 2.99 |
| Single Male/Father | 49 (6.5%) | 2.73 |
| Single Female/Mother | 112 (14.9%) | 4.14 |
| Total Families | 751 (100.0%) | 3.14 |
Median Household Size in Lake Junaluska
The median household size in Lake Junaluska is 2.37 persons per household, with single female/mother households (112 | 8.9%) accounting for the largest median household size of 4.54 persons per household. non-family households (504 | 40.2%) represent the smallest median household size with 1.14 persons per household.
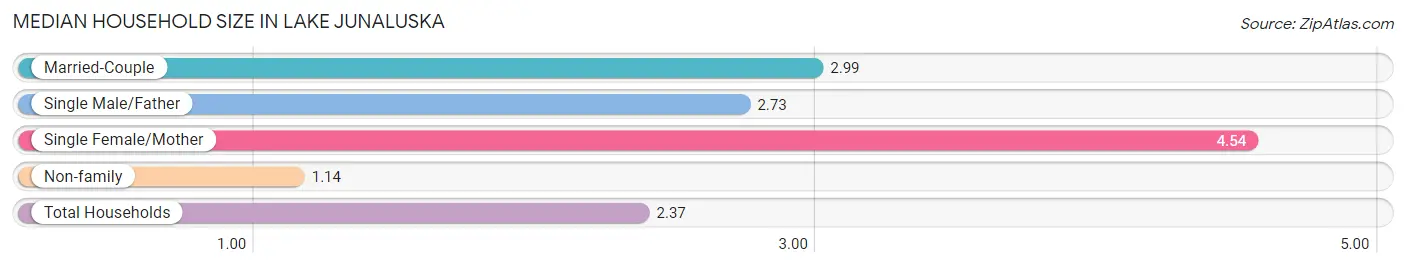
| Household Type | # Households | Household Size |
| Married-Couple | 590 (47.0%) | 2.99 |
| Single Male/Father | 49 (3.9%) | 2.73 |
| Single Female/Mother | 112 (8.9%) | 4.54 |
| Non-family | 504 (40.2%) | 1.14 |
| Total Households | 1,255 (100.0%) | 2.37 |
Household Size by Marriage Status in Lake Junaluska
Out of a total of 1,255 households in Lake Junaluska, 751 (59.8%) are family households, while 504 (40.2%) are nonfamily households. The most numerous type of family households are 2-person households, comprising 419, and the most common type of nonfamily households are 1-person households, comprising 459.
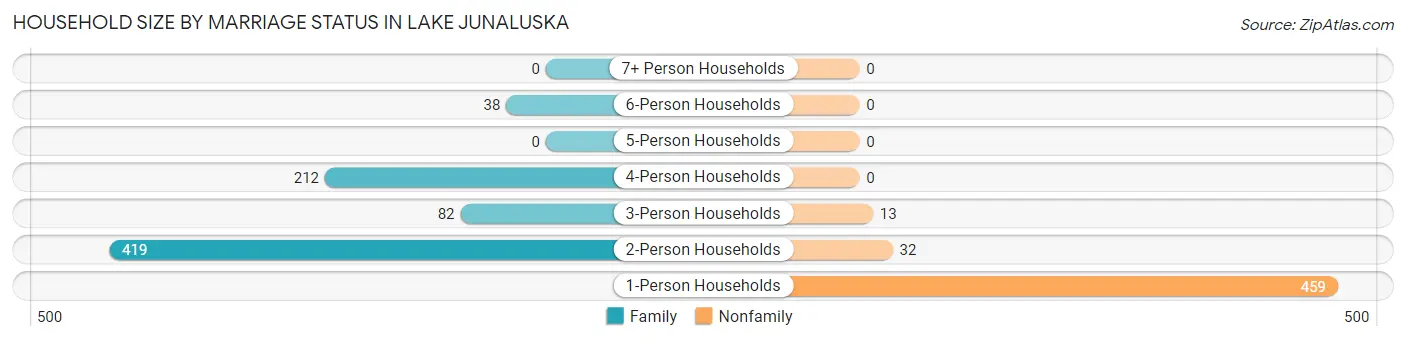
| Household Size | Family Households | Nonfamily Households |
| 1-Person Households | - | 459 (36.6%) |
| 2-Person Households | 419 (33.4%) | 32 (2.5%) |
| 3-Person Households | 82 (6.5%) | 13 (1.0%) |
| 4-Person Households | 212 (16.9%) | 0 (0.0%) |
| 5-Person Households | 0 (0.0%) | 0 (0.0%) |
| 6-Person Households | 38 (3.0%) | 0 (0.0%) |
| 7+ Person Households | 0 (0.0%) | 0 (0.0%) |
| Total | 751 (59.8%) | 504 (40.2%) |
Female Fertility in Lake Junaluska
Fertility by Age in Lake Junaluska
| Age Bracket | Women with Births | Births / 1,000 Women |
| 15 to 19 years | 0 (0.0%) | 0.0 |
| 20 to 34 years | 0 (0.0%) | 0.0 |
| 35 to 50 years | 0 (0.0%) | 0.0 |
| Total | 0 (0.0%) | 0.0 |
Fertility by Age by Marriage Status in Lake Junaluska
| Age Bracket | Married | Unmarried |
| 15 to 19 years | 0 (0.0%) | 0 (0.0%) |
| 20 to 34 years | 0 (0.0%) | 0 (0.0%) |
| 35 to 50 years | 0 (0.0%) | 0 (0.0%) |
| Total | 0 (0.0%) | 0 (0.0%) |
Fertility by Education in Lake Junaluska
| Educational Attainment | Women with Births | Births / 1,000 Women |
| Less than High School | 0 (0.0%) | 0.0 |
| High School Diploma | 0 (0.0%) | 0.0 |
| College or Associate's Degree | 0 (0.0%) | 0.0 |
| Bachelor's Degree | 0 (0.0%) | 0.0 |
| Graduate Degree | 0 (0.0%) | 0.0 |
| Total | 0 (0.0%) | 0.0 |
Fertility by Education by Marriage Status in Lake Junaluska
| Educational Attainment | Married | Unmarried |
| Less than High School | 0 (0.0%) | 0 (0.0%) |
| High School Diploma | 0 (0.0%) | 0 (0.0%) |
| College or Associate's Degree | 0 (0.0%) | 0 (0.0%) |
| Bachelor's Degree | 0 (0.0%) | 0 (0.0%) |
| Graduate Degree | 0 (0.0%) | 0 (0.0%) |
| Total | 0 (0.0%) | 0 (0.0%) |
Employment Characteristics in Lake Junaluska
Employment by Class of Employer in Lake Junaluska
Among the 1,206 employed individuals in Lake Junaluska, private company employees (424 | 35.2%), local government employees (382 | 31.7%), and self-employed (incorporated) (95 | 7.9%) make up the most common classes of employment.
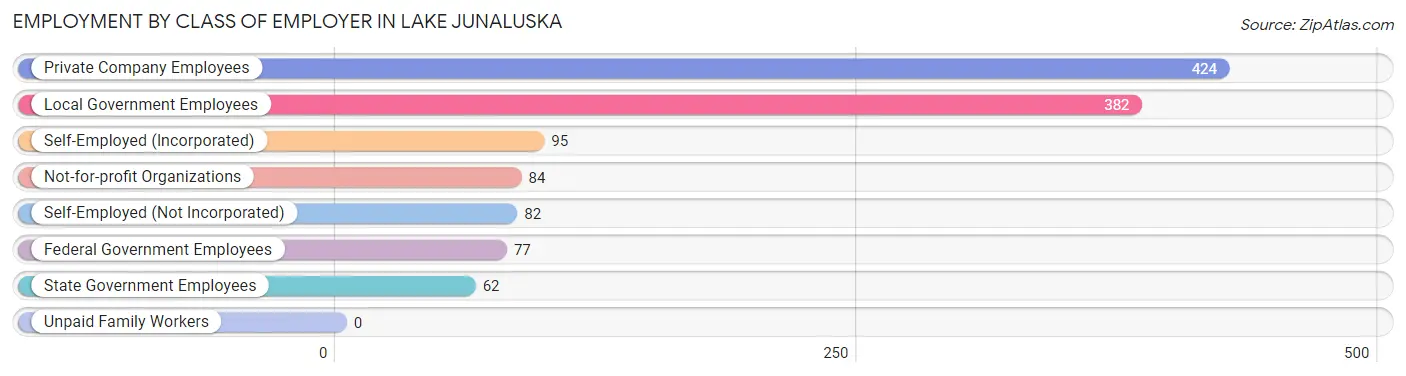
| Employer Class | # Employees | % Employees |
| Private Company Employees | 424 | 35.2% |
| Self-Employed (Incorporated) | 95 | 7.9% |
| Self-Employed (Not Incorporated) | 82 | 6.8% |
| Not-for-profit Organizations | 84 | 7.0% |
| Local Government Employees | 382 | 31.7% |
| State Government Employees | 62 | 5.1% |
| Federal Government Employees | 77 | 6.4% |
| Unpaid Family Workers | 0 | 0.0% |
| Total | 1,206 | 100.0% |
Employment Status by Age in Lake Junaluska
According to the labor force statistics for Lake Junaluska, out of the total population over 16 years of age (2,477), 52.2% or 1,293 individuals are in the labor force, with 6.9% or 89 of them unemployed. The age group with the highest labor force participation rate is 45 to 54 years, with 93.7% or 284 individuals in the labor force. Within the labor force, the 16 to 19 years age range has the highest percentage of unemployed individuals, with 31.8% or 21 of them being unemployed.
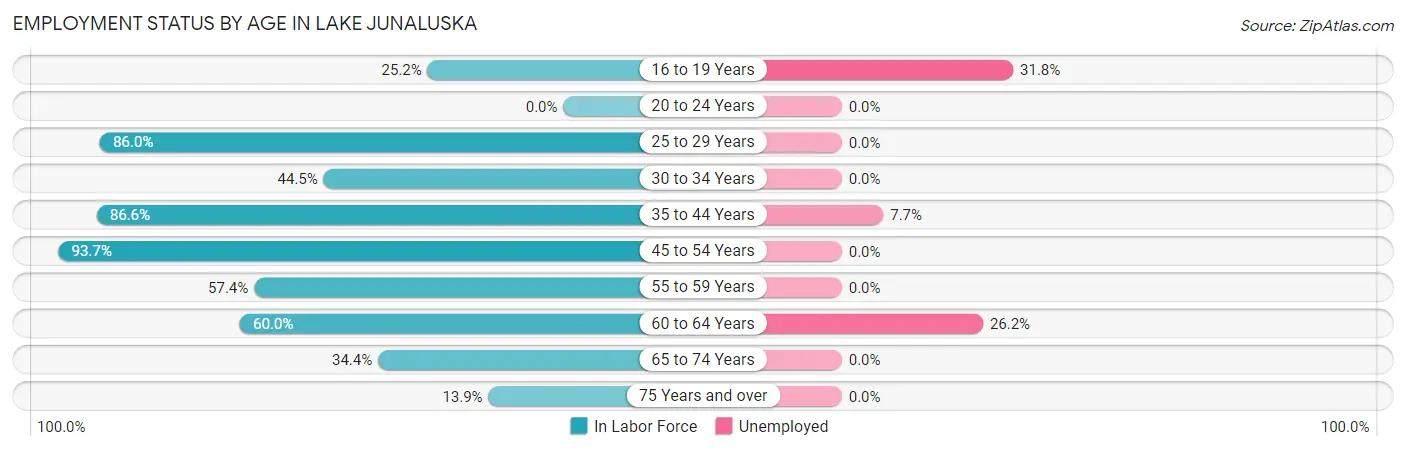
| Age Bracket | In Labor Force | Unemployed |
| 16 to 19 Years | 66 (25.2%) | 21 (31.8%) |
| 20 to 24 Years | 0 (0.0%) | 0 (0.0%) |
| 25 to 29 Years | 123 (86.0%) | 0 (0.0%) |
| 30 to 34 Years | 53 (44.5%) | 0 (0.0%) |
| 35 to 44 Years | 233 (86.6%) | 18 (7.7%) |
| 45 to 54 Years | 284 (93.7%) | 0 (0.0%) |
| 55 to 59 Years | 147 (57.4%) | 0 (0.0%) |
| 60 to 64 Years | 183 (60.0%) | 48 (26.2%) |
| 65 to 74 Years | 151 (34.4%) | 0 (0.0%) |
| 75 Years and over | 53 (13.9%) | 0 (0.0%) |
| Total | 1,293 (52.2%) | 89 (6.9%) |
Employment Status by Educational Attainment in Lake Junaluska
According to labor force statistics for Lake Junaluska, 73.3% of individuals (1,023) out of the total population between 25 and 64 years of age (1,395) are in the labor force, with 6.6% or 68 of them being unemployed. The group with the highest labor force participation rate are those with the educational attainment of bachelor's degree or higher, with 89.3% or 668 individuals in the labor force. Within the labor force, individuals with college / associate degree education have the highest percentage of unemployment, with 20.3% or 53 of them being unemployed.
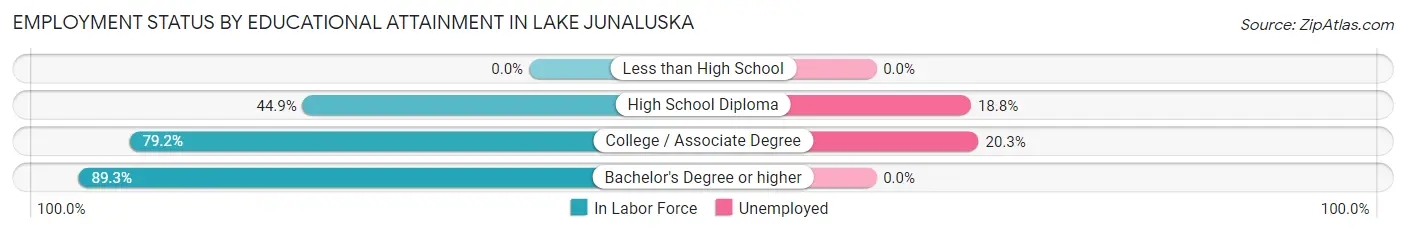
| Educational Attainment | In Labor Force | Unemployed |
| Less than High School | 0 (0.0%) | 0 (0.0%) |
| High School Diploma | 96 (44.9%) | 40 (18.8%) |
| College / Associate Degree | 259 (79.2%) | 66 (20.3%) |
| Bachelor's Degree or higher | 668 (89.3%) | 0 (0.0%) |
| Total | 1,023 (73.3%) | 92 (6.6%) |
Employment Occupations by Sex in Lake Junaluska
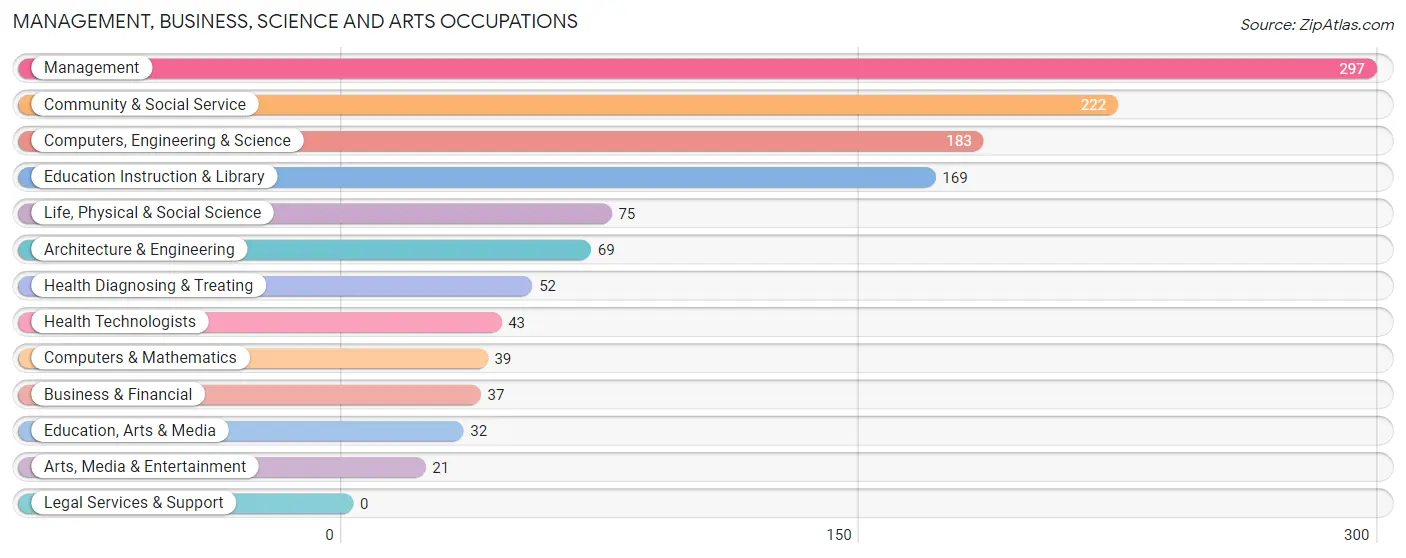
Management, Business, Science and Arts Occupations
The most common Management, Business, Science and Arts occupations in Lake Junaluska are Management (297 | 25.1%), Community & Social Service (222 | 18.8%), Computers, Engineering & Science (183 | 15.5%), Education Instruction & Library (169 | 14.3%), and Life, Physical & Social Science (75 | 6.3%).
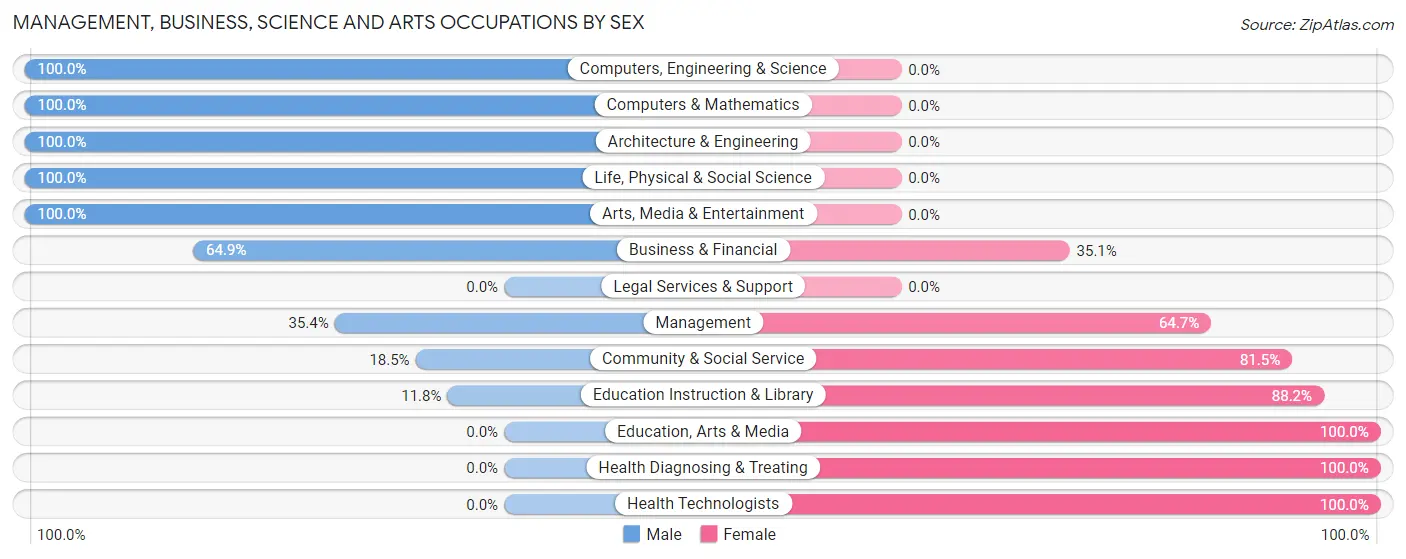
Management, Business, Science and Arts Occupations by Sex
Within the Management, Business, Science and Arts occupations in Lake Junaluska, the most male-oriented occupations are Computers, Engineering & Science (100.0%), Computers & Mathematics (100.0%), and Architecture & Engineering (100.0%), while the most female-oriented occupations are Education, Arts & Media (100.0%), Health Diagnosing & Treating (100.0%), and Health Technologists (100.0%).
| Occupation | Male | Female |
| Management | 105 (35.3%) | 192 (64.6%) |
| Business & Financial | 24 (64.9%) | 13 (35.1%) |
| Computers, Engineering & Science | 183 (100.0%) | 0 (0.0%) |
| Computers & Mathematics | 39 (100.0%) | 0 (0.0%) |
| Architecture & Engineering | 69 (100.0%) | 0 (0.0%) |
| Life, Physical & Social Science | 75 (100.0%) | 0 (0.0%) |
| Community & Social Service | 41 (18.5%) | 181 (81.5%) |
| Education, Arts & Media | 0 (0.0%) | 32 (100.0%) |
| Legal Services & Support | 0 (0.0%) | 0 (0.0%) |
| Education Instruction & Library | 20 (11.8%) | 149 (88.2%) |
| Arts, Media & Entertainment | 21 (100.0%) | 0 (0.0%) |
| Health Diagnosing & Treating | 0 (0.0%) | 52 (100.0%) |
| Health Technologists | 0 (0.0%) | 43 (100.0%) |
| Total (Category) | 353 (44.6%) | 438 (55.4%) |
| Total (Overall) | 543 (45.9%) | 640 (54.1%) |
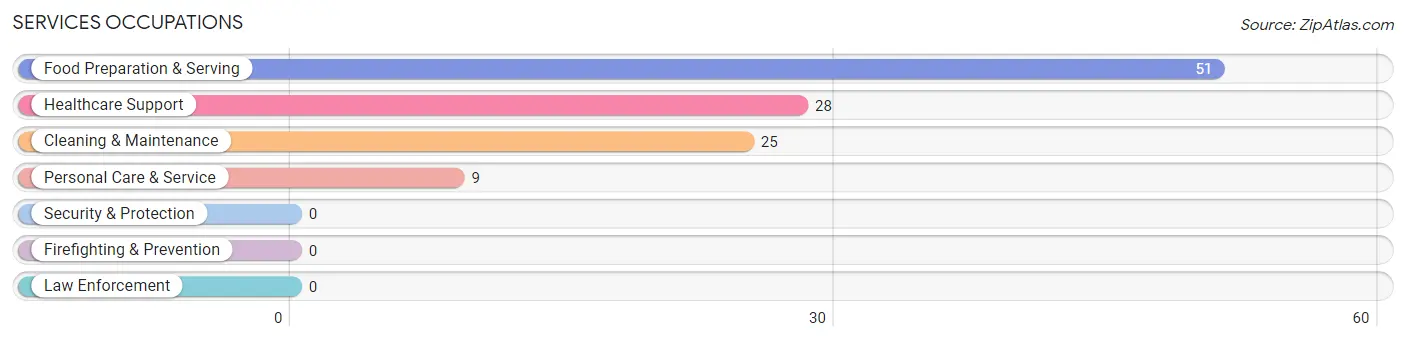
Services Occupations
The most common Services occupations in Lake Junaluska are Food Preparation & Serving (51 | 4.3%), Healthcare Support (28 | 2.4%), Cleaning & Maintenance (25 | 2.1%), and Personal Care & Service (9 | 0.8%).
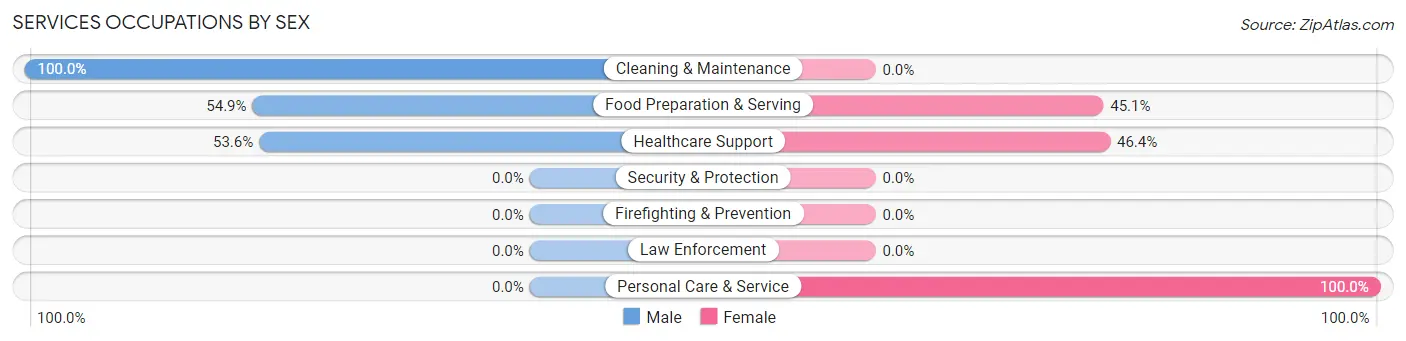
Services Occupations by Sex
Within the Services occupations in Lake Junaluska, the most male-oriented occupations are Cleaning & Maintenance (100.0%), Food Preparation & Serving (54.9%), and Healthcare Support (53.6%), while the most female-oriented occupations are Personal Care & Service (100.0%), Healthcare Support (46.4%), and Food Preparation & Serving (45.1%).
| Occupation | Male | Female |
| Healthcare Support | 15 (53.6%) | 13 (46.4%) |
| Security & Protection | 0 (0.0%) | 0 (0.0%) |
| Firefighting & Prevention | 0 (0.0%) | 0 (0.0%) |
| Law Enforcement | 0 (0.0%) | 0 (0.0%) |
| Food Preparation & Serving | 28 (54.9%) | 23 (45.1%) |
| Cleaning & Maintenance | 25 (100.0%) | 0 (0.0%) |
| Personal Care & Service | 0 (0.0%) | 9 (100.0%) |
| Total (Category) | 68 (60.2%) | 45 (39.8%) |
| Total (Overall) | 543 (45.9%) | 640 (54.1%) |
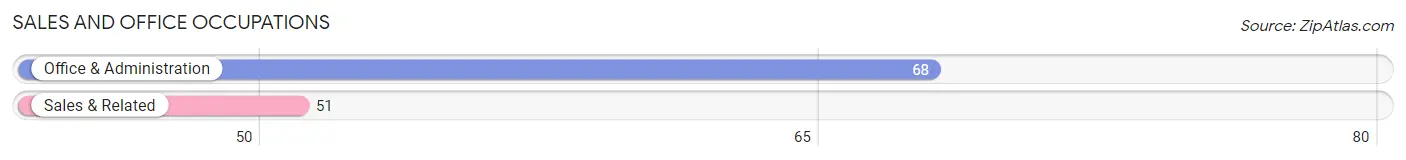
Sales and Office Occupations
The most common Sales and Office occupations in Lake Junaluska are Office & Administration (68 | 5.8%), and Sales & Related (51 | 4.3%).
Sales and Office Occupations by Sex
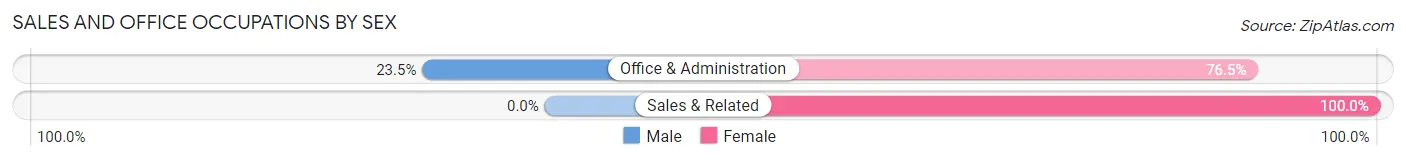
| Occupation | Male | Female |
| Sales & Related | 0 (0.0%) | 51 (100.0%) |
| Office & Administration | 16 (23.5%) | 52 (76.5%) |
| Total (Category) | 16 (13.5%) | 103 (86.6%) |
| Total (Overall) | 543 (45.9%) | 640 (54.1%) |
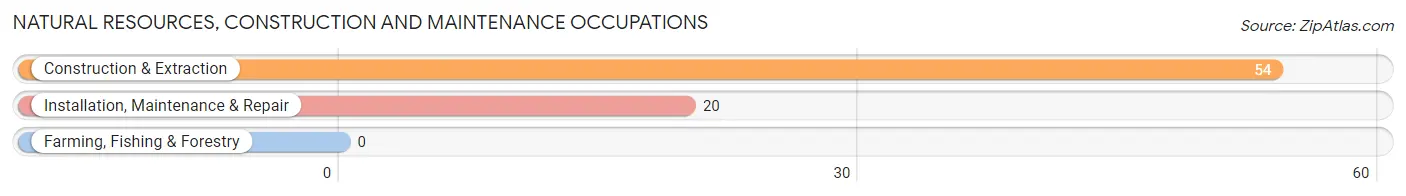
Natural Resources, Construction and Maintenance Occupations
The most common Natural Resources, Construction and Maintenance occupations in Lake Junaluska are Construction & Extraction (54 | 4.6%), and Installation, Maintenance & Repair (20 | 1.7%).
Natural Resources, Construction and Maintenance Occupations by Sex
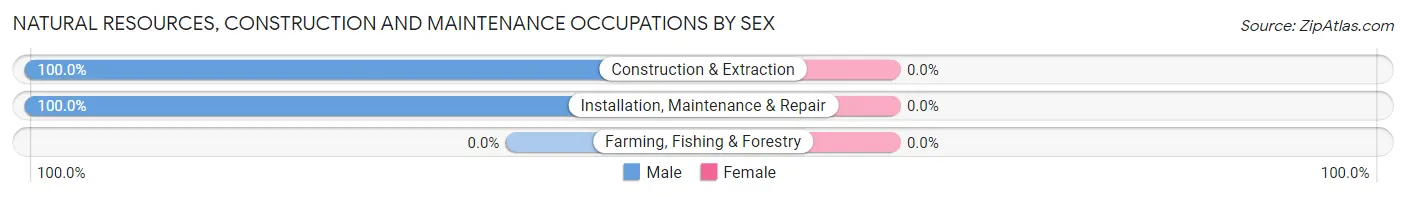
| Occupation | Male | Female |
| Farming, Fishing & Forestry | 0 (0.0%) | 0 (0.0%) |
| Construction & Extraction | 54 (100.0%) | 0 (0.0%) |
| Installation, Maintenance & Repair | 20 (100.0%) | 0 (0.0%) |
| Total (Category) | 74 (100.0%) | 0 (0.0%) |
| Total (Overall) | 543 (45.9%) | 640 (54.1%) |
Production, Transportation and Moving Occupations
The most common Production, Transportation and Moving occupations in Lake Junaluska are Production (57 | 4.8%), and Material Moving (29 | 2.5%).
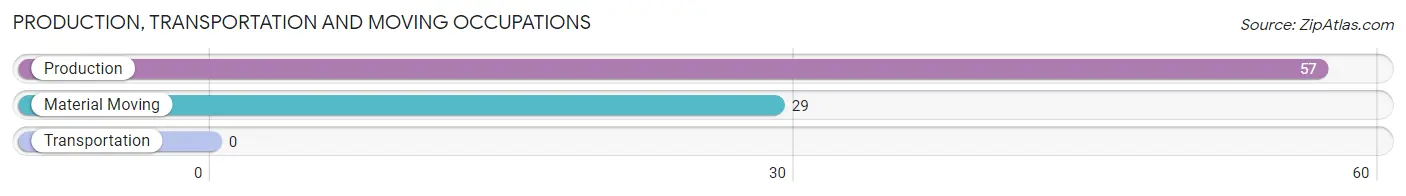
Production, Transportation and Moving Occupations by Sex
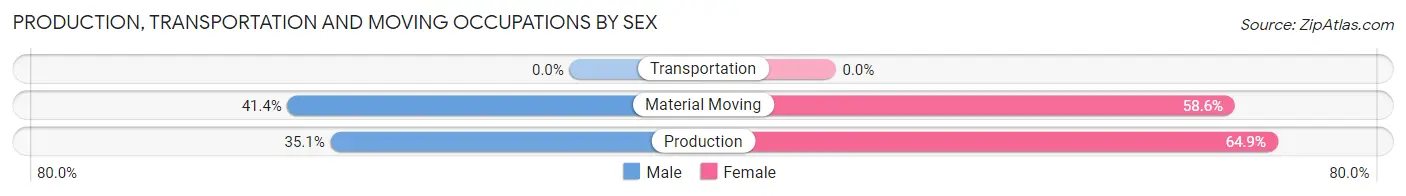
| Occupation | Male | Female |
| Production | 20 (35.1%) | 37 (64.9%) |
| Transportation | 0 (0.0%) | 0 (0.0%) |
| Material Moving | 12 (41.4%) | 17 (58.6%) |
| Total (Category) | 32 (37.2%) | 54 (62.8%) |
| Total (Overall) | 543 (45.9%) | 640 (54.1%) |
Employment Industries by Sex in Lake Junaluska
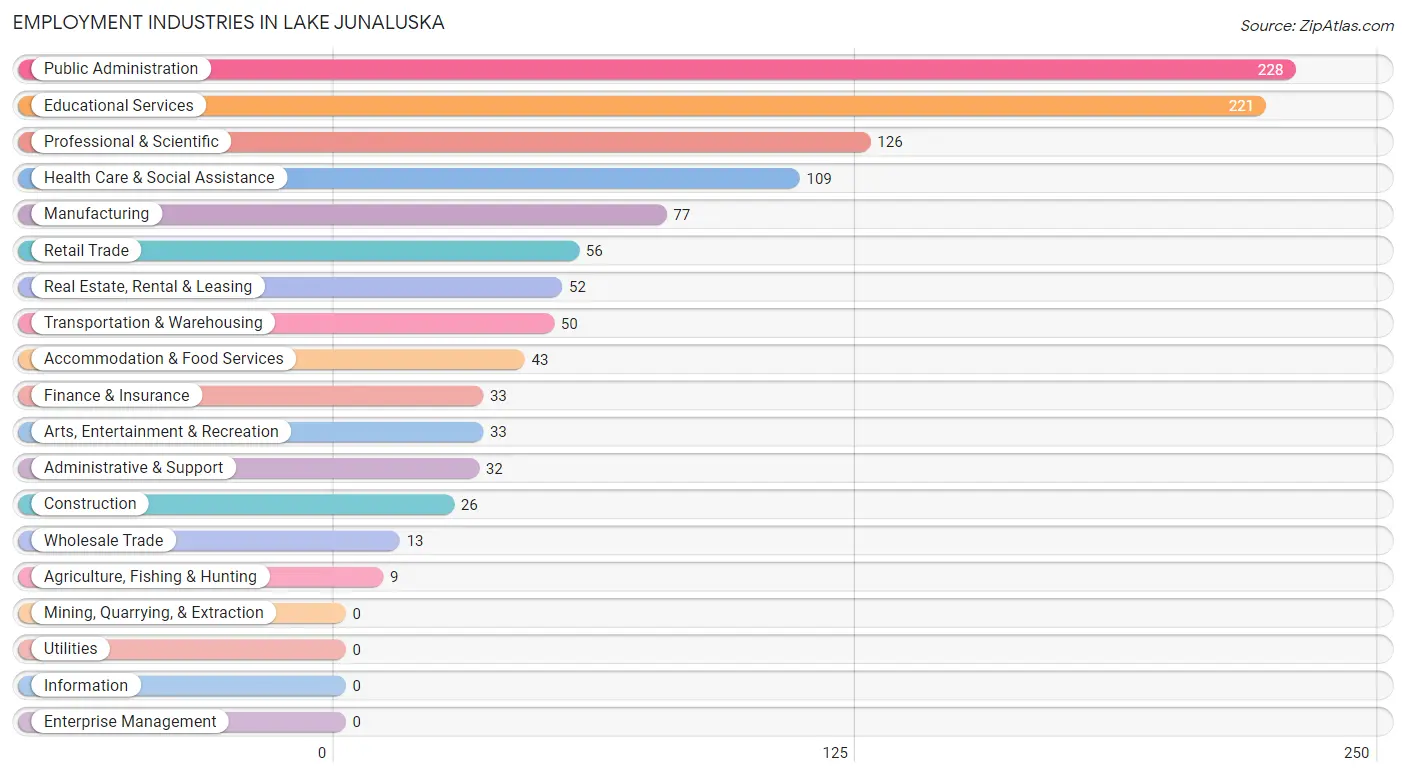
Employment Industries in Lake Junaluska
The major employment industries in Lake Junaluska include Public Administration (228 | 19.3%), Educational Services (221 | 18.7%), Professional & Scientific (126 | 10.6%), Health Care & Social Assistance (109 | 9.2%), and Manufacturing (77 | 6.5%).
Employment Industries by Sex in Lake Junaluska
The Lake Junaluska industries that see more men than women are Construction (100.0%), Wholesale Trade (100.0%), and Professional & Scientific (100.0%), whereas the industries that tend to have a higher number of women are Agriculture, Fishing & Hunting (100.0%), Retail Trade (100.0%), and Educational Services (81.5%).
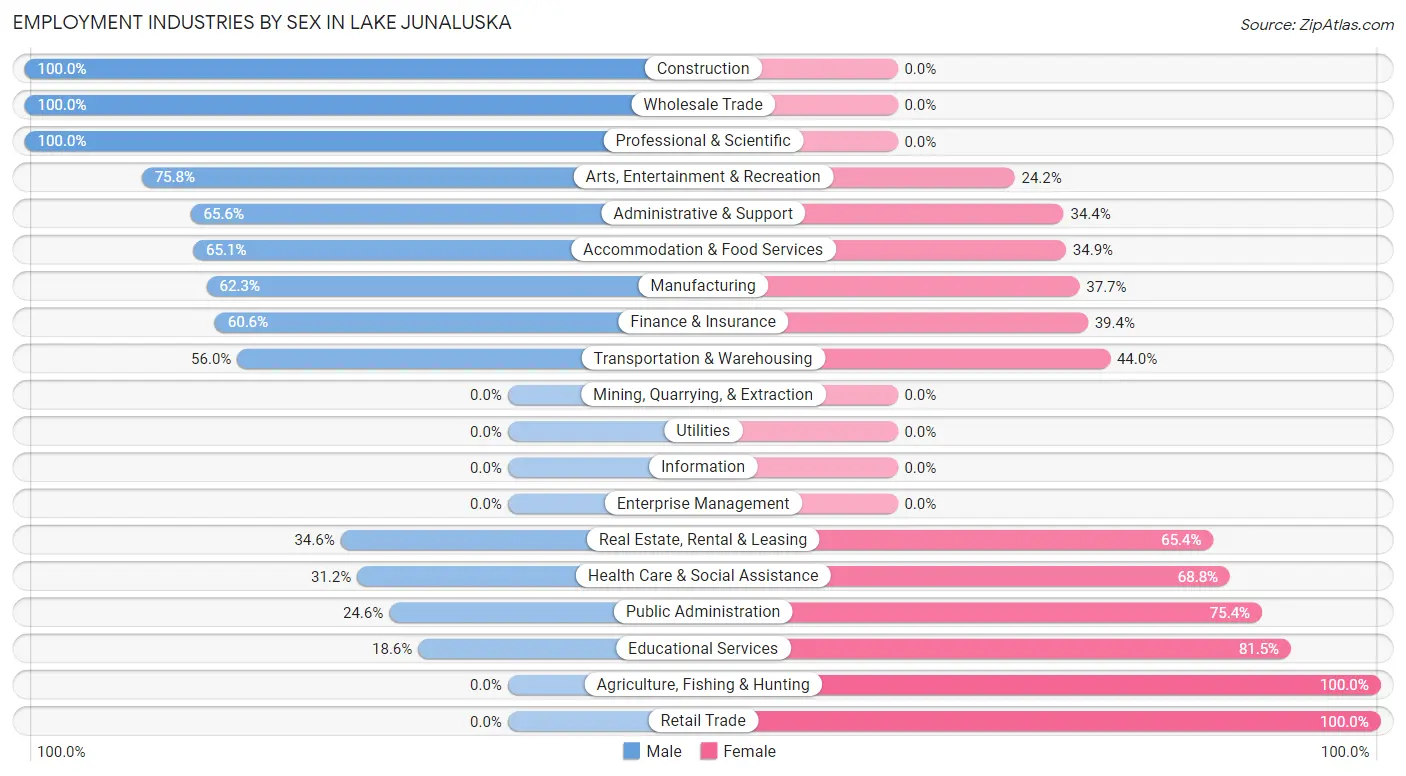
| Industry | Male | Female |
| Agriculture, Fishing & Hunting | 0 (0.0%) | 9 (100.0%) |
| Mining, Quarrying, & Extraction | 0 (0.0%) | 0 (0.0%) |
| Construction | 26 (100.0%) | 0 (0.0%) |
| Manufacturing | 48 (62.3%) | 29 (37.7%) |
| Wholesale Trade | 13 (100.0%) | 0 (0.0%) |
| Retail Trade | 0 (0.0%) | 56 (100.0%) |
| Transportation & Warehousing | 28 (56.0%) | 22 (44.0%) |
| Utilities | 0 (0.0%) | 0 (0.0%) |
| Information | 0 (0.0%) | 0 (0.0%) |
| Finance & Insurance | 20 (60.6%) | 13 (39.4%) |
| Real Estate, Rental & Leasing | 18 (34.6%) | 34 (65.4%) |
| Professional & Scientific | 126 (100.0%) | 0 (0.0%) |
| Enterprise Management | 0 (0.0%) | 0 (0.0%) |
| Administrative & Support | 21 (65.6%) | 11 (34.4%) |
| Educational Services | 41 (18.5%) | 180 (81.5%) |
| Health Care & Social Assistance | 34 (31.2%) | 75 (68.8%) |
| Arts, Entertainment & Recreation | 25 (75.8%) | 8 (24.2%) |
| Accommodation & Food Services | 28 (65.1%) | 15 (34.9%) |
| Public Administration | 56 (24.6%) | 172 (75.4%) |
| Total | 543 (45.9%) | 640 (54.1%) |
Education in Lake Junaluska
School Enrollment in Lake Junaluska
The most common levels of schooling among the 690 students in Lake Junaluska are middle school (255 | 37.0%), college / undergraduate (175 | 25.4%), and elementary school (142 | 20.6%).
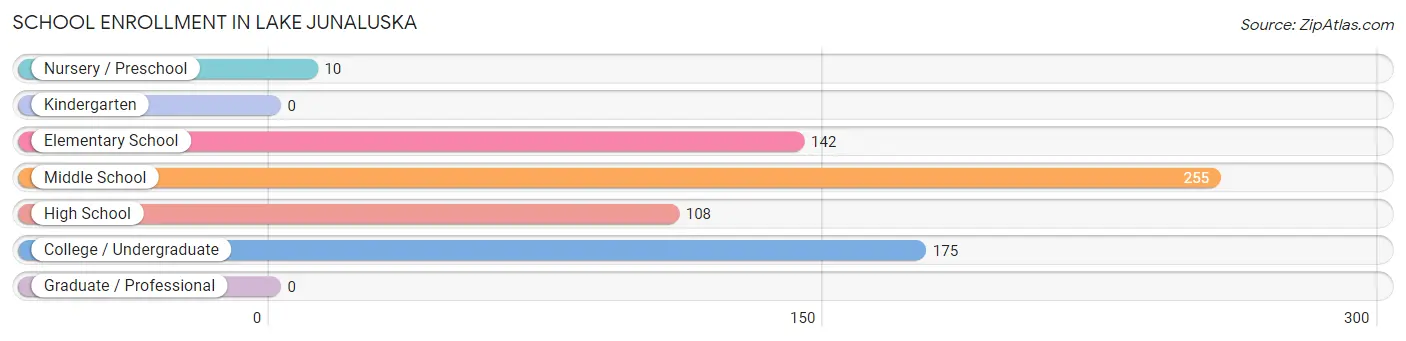
| School Level | # Students | % Students |
| Nursery / Preschool | 10 | 1.5% |
| Kindergarten | 0 | 0.0% |
| Elementary School | 142 | 20.6% |
| Middle School | 255 | 37.0% |
| High School | 108 | 15.7% |
| College / Undergraduate | 175 | 25.4% |
| Graduate / Professional | 0 | 0.0% |
| Total | 690 | 100.0% |
School Enrollment by Age by Funding Source in Lake Junaluska
Out of a total of 690 students who are enrolled in schools in Lake Junaluska, 111 (16.1%) attend a private institution, while the remaining 579 (83.9%) are enrolled in public schools. The age group of 5 to 9 year old has the highest likelihood of being enrolled in private schools, with 48 (36.9% in the age bracket) enrolled. Conversely, the age group of 3 to 4 year olds has the lowest likelihood of being enrolled in a private school, with 10 (100.0% in the age bracket) attending a public institution.
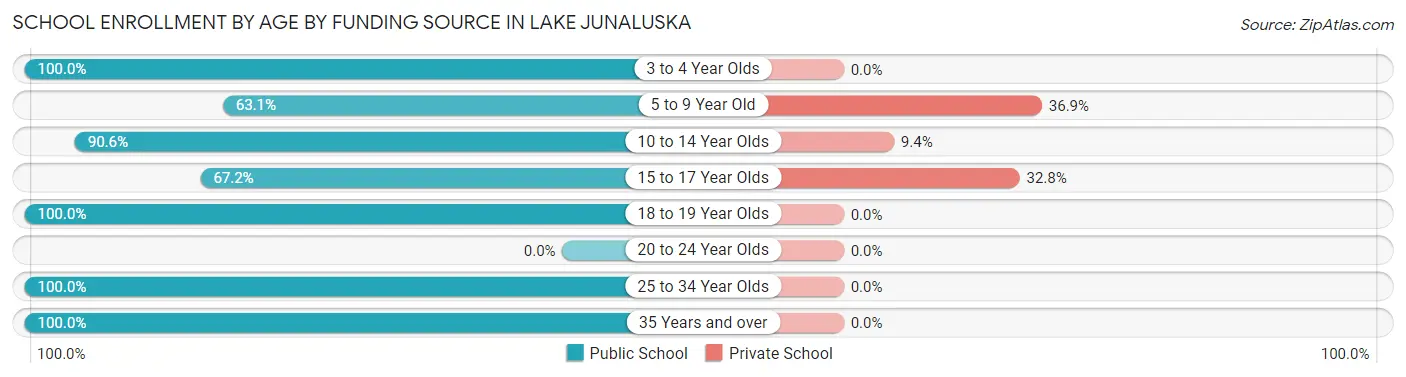
| Age Bracket | Public School | Private School |
| 3 to 4 Year Olds | 10 (100.0%) | 0 (0.0%) |
| 5 to 9 Year Old | 82 (63.1%) | 48 (36.9%) |
| 10 to 14 Year Olds | 242 (90.6%) | 25 (9.4%) |
| 15 to 17 Year Olds | 78 (67.2%) | 38 (32.8%) |
| 18 to 19 Year Olds | 103 (100.0%) | 0 (0.0%) |
| 20 to 24 Year Olds | 0 (0.0%) | 0 (0.0%) |
| 25 to 34 Year Olds | 51 (100.0%) | 0 (0.0%) |
| 35 Years and over | 13 (100.0%) | 0 (0.0%) |
| Total | 579 (83.9%) | 111 (16.1%) |
Educational Attainment by Field of Study in Lake Junaluska
Education (263 | 21.8%), science & technology (196 | 16.2%), bio, nature & agricultural (166 | 13.8%), psychology (122 | 10.1%), and business (111 | 9.2%) are the most common fields of study among 1,207 individuals in Lake Junaluska who have obtained a bachelor's degree or higher.
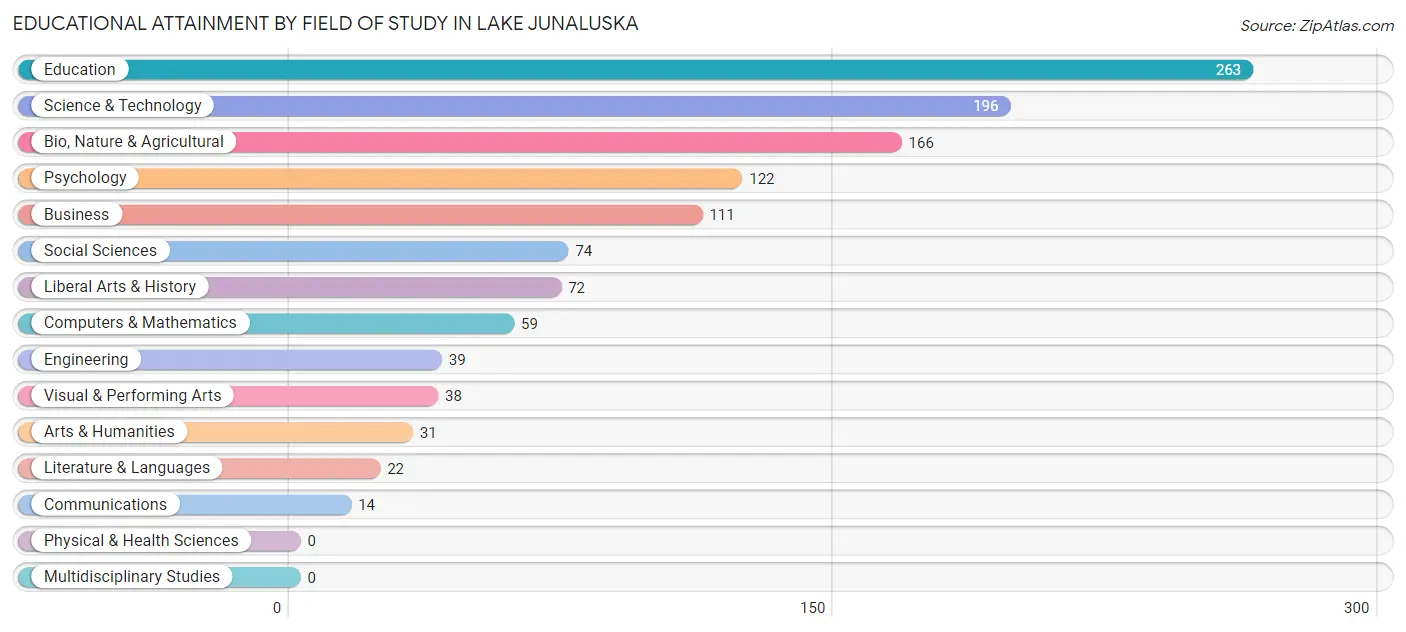
| Field of Study | # Graduates | % Graduates |
| Computers & Mathematics | 59 | 4.9% |
| Bio, Nature & Agricultural | 166 | 13.8% |
| Physical & Health Sciences | 0 | 0.0% |
| Psychology | 122 | 10.1% |
| Social Sciences | 74 | 6.1% |
| Engineering | 39 | 3.2% |
| Multidisciplinary Studies | 0 | 0.0% |
| Science & Technology | 196 | 16.2% |
| Business | 111 | 9.2% |
| Education | 263 | 21.8% |
| Literature & Languages | 22 | 1.8% |
| Liberal Arts & History | 72 | 6.0% |
| Visual & Performing Arts | 38 | 3.2% |
| Communications | 14 | 1.2% |
| Arts & Humanities | 31 | 2.6% |
| Total | 1,207 | 100.0% |
Transportation & Commute in Lake Junaluska
Vehicle Availability by Sex in Lake Junaluska
The most prevalent vehicle ownership categories in Lake Junaluska are males with 2 vehicles (349, accounting for 61.7%) and females with 2 vehicles (294, making up 54.5%).
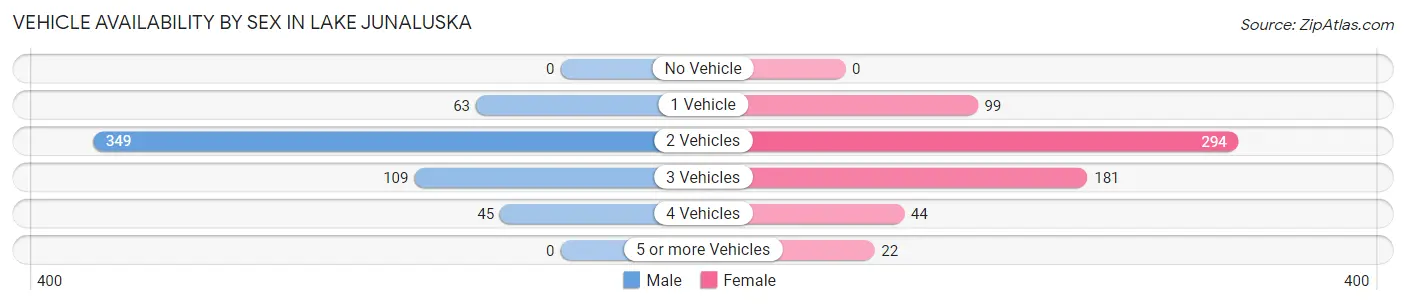
| Vehicles Available | Male | Female |
| No Vehicle | 0 (0.0%) | 0 (0.0%) |
| 1 Vehicle | 63 (11.1%) | 99 (15.5%) |
| 2 Vehicles | 349 (61.7%) | 294 (45.9%) |
| 3 Vehicles | 109 (19.3%) | 181 (28.3%) |
| 4 Vehicles | 45 (8.0%) | 44 (6.9%) |
| 5 or more Vehicles | 0 (0.0%) | 22 (3.4%) |
| Total | 566 (100.0%) | 640 (100.0%) |
Commute Time in Lake Junaluska
The most frequently occuring commute durations in Lake Junaluska are 15 to 19 minutes (256 commuters, 23.6%), less than 5 minutes (227 commuters, 20.9%), and 5 to 9 minutes (221 commuters, 20.3%).
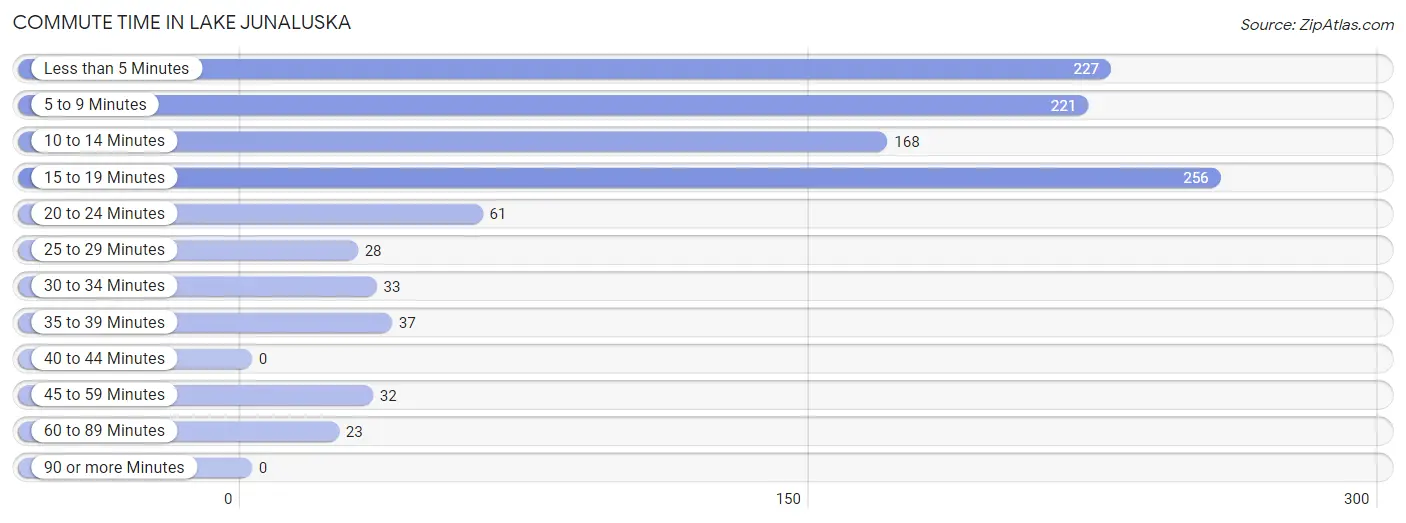
| Commute Time | # Commuters | % Commuters |
| Less than 5 Minutes | 227 | 20.9% |
| 5 to 9 Minutes | 221 | 20.3% |
| 10 to 14 Minutes | 168 | 15.5% |
| 15 to 19 Minutes | 256 | 23.6% |
| 20 to 24 Minutes | 61 | 5.6% |
| 25 to 29 Minutes | 28 | 2.6% |
| 30 to 34 Minutes | 33 | 3.0% |
| 35 to 39 Minutes | 37 | 3.4% |
| 40 to 44 Minutes | 0 | 0.0% |
| 45 to 59 Minutes | 32 | 2.9% |
| 60 to 89 Minutes | 23 | 2.1% |
| 90 or more Minutes | 0 | 0.0% |
Commute Time by Sex in Lake Junaluska
The most common commute times in Lake Junaluska are 15 to 19 minutes (142 commuters, 28.7%) for males and 5 to 9 minutes (183 commuters, 31.0%) for females.
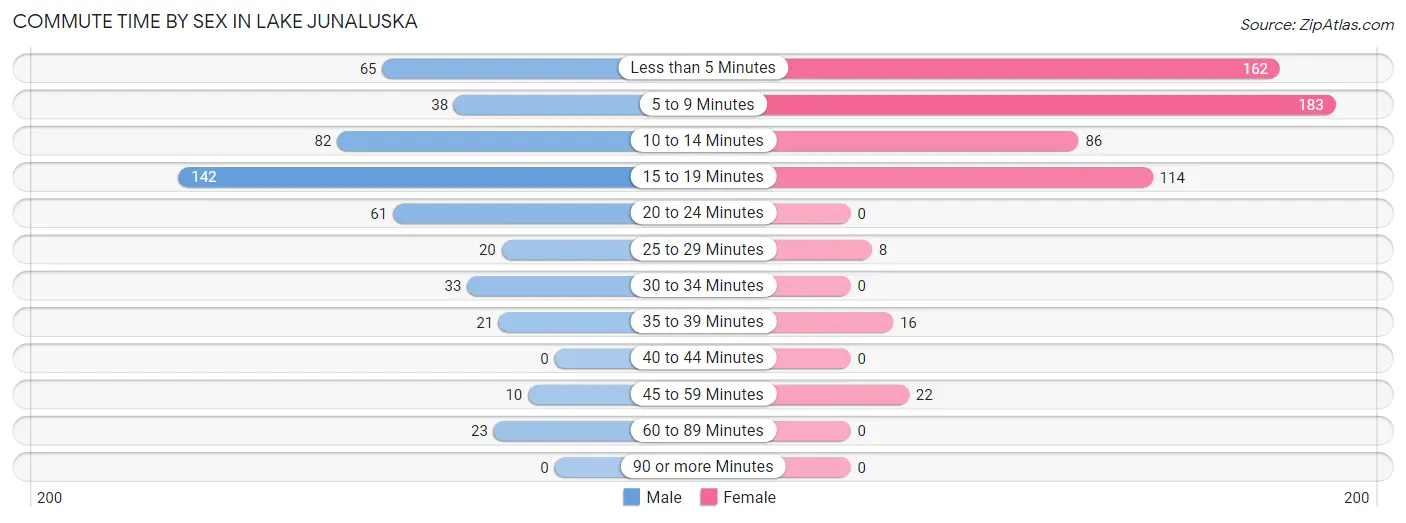
| Commute Time | Male | Female |
| Less than 5 Minutes | 65 (13.1%) | 162 (27.4%) |
| 5 to 9 Minutes | 38 (7.7%) | 183 (31.0%) |
| 10 to 14 Minutes | 82 (16.6%) | 86 (14.5%) |
| 15 to 19 Minutes | 142 (28.7%) | 114 (19.3%) |
| 20 to 24 Minutes | 61 (12.3%) | 0 (0.0%) |
| 25 to 29 Minutes | 20 (4.0%) | 8 (1.3%) |
| 30 to 34 Minutes | 33 (6.7%) | 0 (0.0%) |
| 35 to 39 Minutes | 21 (4.2%) | 16 (2.7%) |
| 40 to 44 Minutes | 0 (0.0%) | 0 (0.0%) |
| 45 to 59 Minutes | 10 (2.0%) | 22 (3.7%) |
| 60 to 89 Minutes | 23 (4.6%) | 0 (0.0%) |
| 90 or more Minutes | 0 (0.0%) | 0 (0.0%) |
Time of Departure to Work by Sex in Lake Junaluska
The most frequent times of departure to work in Lake Junaluska are 7:00 AM to 7:29 AM (98, 19.8%) for males and 7:30 AM to 7:59 AM (335, 56.7%) for females.
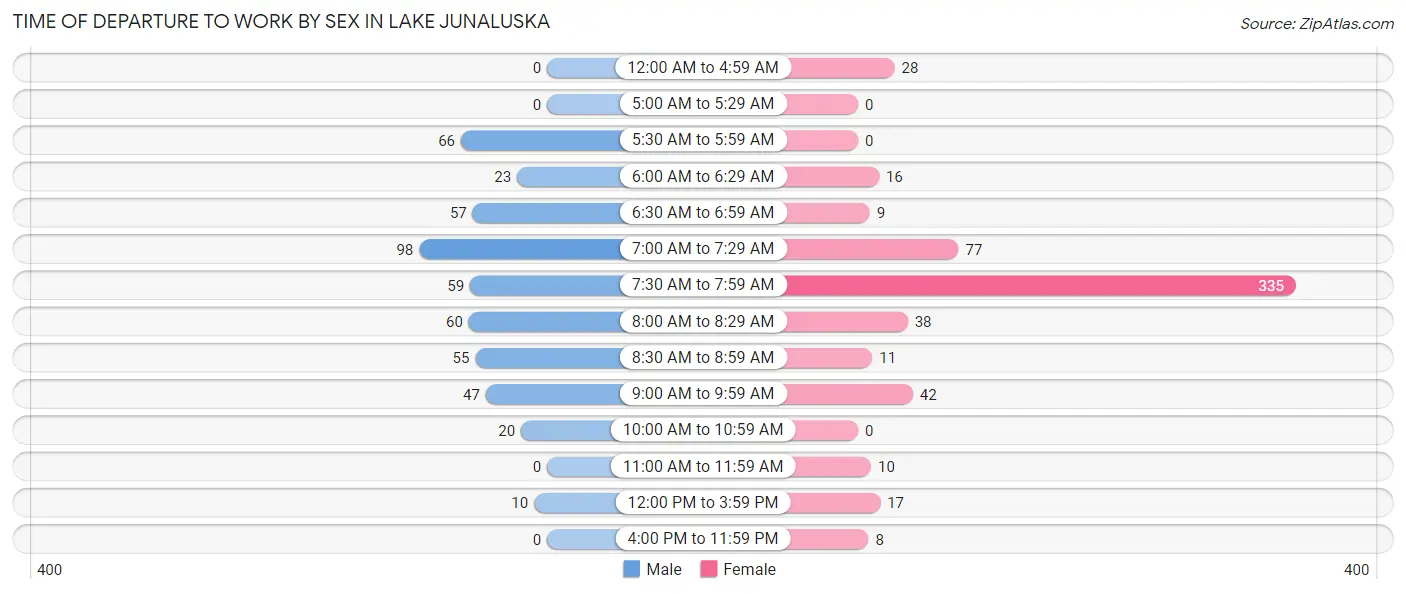
| Time of Departure | Male | Female |
| 12:00 AM to 4:59 AM | 0 (0.0%) | 28 (4.7%) |
| 5:00 AM to 5:29 AM | 0 (0.0%) | 0 (0.0%) |
| 5:30 AM to 5:59 AM | 66 (13.3%) | 0 (0.0%) |
| 6:00 AM to 6:29 AM | 23 (4.6%) | 16 (2.7%) |
| 6:30 AM to 6:59 AM | 57 (11.5%) | 9 (1.5%) |
| 7:00 AM to 7:29 AM | 98 (19.8%) | 77 (13.0%) |
| 7:30 AM to 7:59 AM | 59 (11.9%) | 335 (56.7%) |
| 8:00 AM to 8:29 AM | 60 (12.1%) | 38 (6.4%) |
| 8:30 AM to 8:59 AM | 55 (11.1%) | 11 (1.9%) |
| 9:00 AM to 9:59 AM | 47 (9.5%) | 42 (7.1%) |
| 10:00 AM to 10:59 AM | 20 (4.0%) | 0 (0.0%) |
| 11:00 AM to 11:59 AM | 0 (0.0%) | 10 (1.7%) |
| 12:00 PM to 3:59 PM | 10 (2.0%) | 17 (2.9%) |
| 4:00 PM to 11:59 PM | 0 (0.0%) | 8 (1.3%) |
| Total | 495 (100.0%) | 591 (100.0%) |
Housing Occupancy in Lake Junaluska
Occupancy by Ownership in Lake Junaluska
Of the total 1,255 dwellings in Lake Junaluska, owner-occupied units account for 990 (78.9%), while renter-occupied units make up 265 (21.1%).
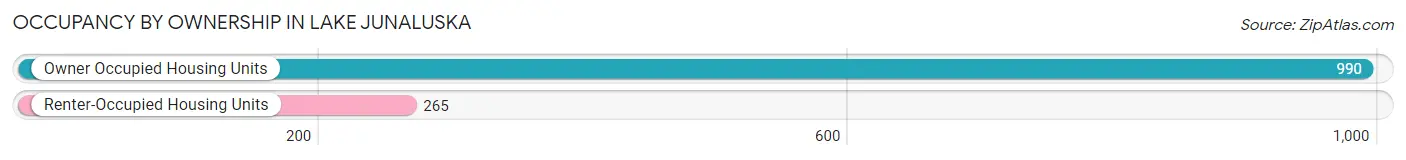
| Occupancy | # Housing Units | % Housing Units |
| Owner Occupied Housing Units | 990 | 78.9% |
| Renter-Occupied Housing Units | 265 | 21.1% |
| Total Occupied Housing Units | 1,255 | 100.0% |
Occupancy by Household Size in Lake Junaluska
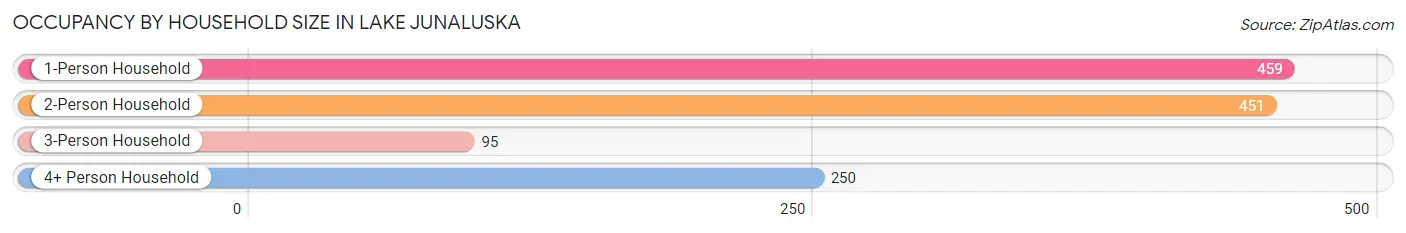
| Household Size | # Housing Units | % Housing Units |
| 1-Person Household | 459 | 36.6% |
| 2-Person Household | 451 | 35.9% |
| 3-Person Household | 95 | 7.6% |
| 4+ Person Household | 250 | 19.9% |
| Total Housing Units | 1,255 | 100.0% |
Occupancy by Ownership by Household Size in Lake Junaluska
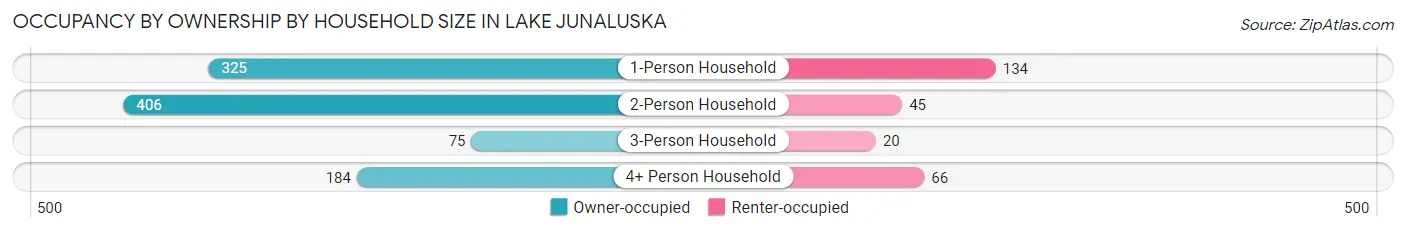
| Household Size | Owner-occupied | Renter-occupied |
| 1-Person Household | 325 (70.8%) | 134 (29.2%) |
| 2-Person Household | 406 (90.0%) | 45 (10.0%) |
| 3-Person Household | 75 (78.9%) | 20 (21.0%) |
| 4+ Person Household | 184 (73.6%) | 66 (26.4%) |
| Total Housing Units | 990 (78.9%) | 265 (21.1%) |
Occupancy by Educational Attainment in Lake Junaluska
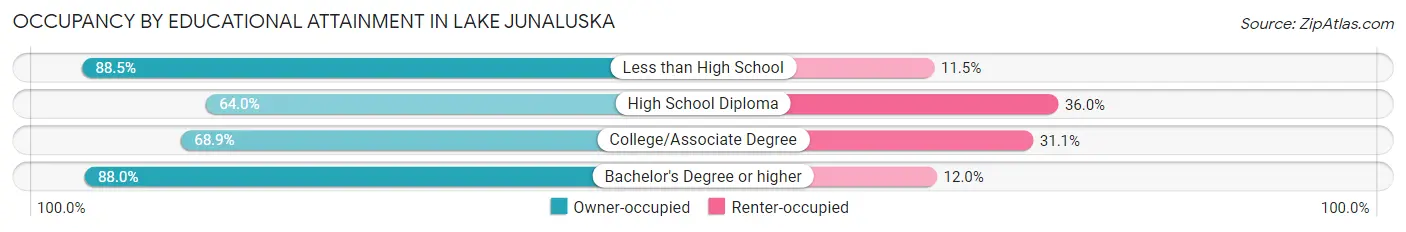
| Household Size | Owner-occupied | Renter-occupied |
| Less than High School | 54 (88.5%) | 7 (11.5%) |
| High School Diploma | 126 (64.0%) | 71 (36.0%) |
| College/Associate Degree | 244 (68.9%) | 110 (31.1%) |
| Bachelor's Degree or higher | 566 (88.0%) | 77 (12.0%) |
Occupancy by Age of Householder in Lake Junaluska
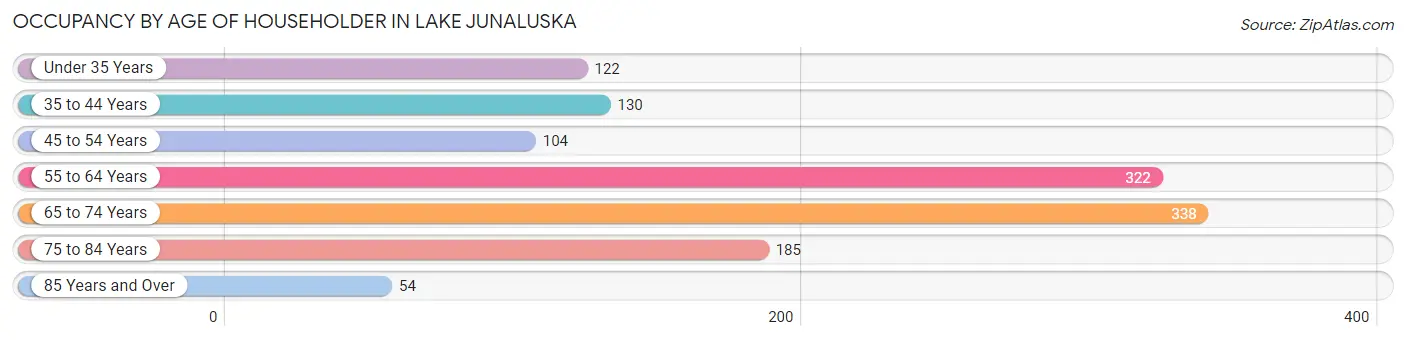
| Age Bracket | # Households | % Households |
| Under 35 Years | 122 | 9.7% |
| 35 to 44 Years | 130 | 10.4% |
| 45 to 54 Years | 104 | 8.3% |
| 55 to 64 Years | 322 | 25.7% |
| 65 to 74 Years | 338 | 26.9% |
| 75 to 84 Years | 185 | 14.7% |
| 85 Years and Over | 54 | 4.3% |
| Total | 1,255 | 100.0% |
Housing Finances in Lake Junaluska
Median Income by Occupancy in Lake Junaluska
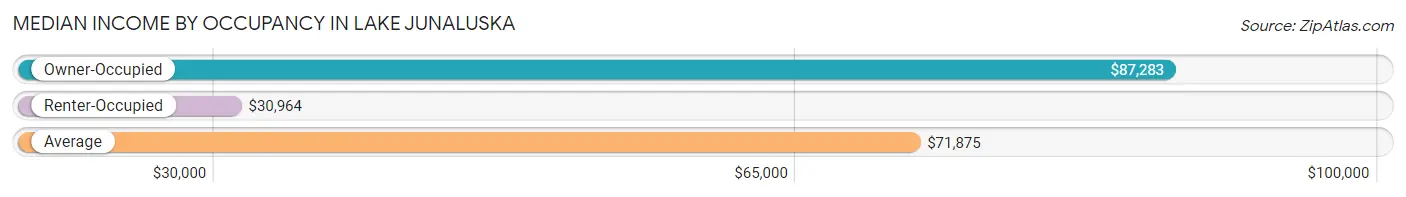
| Occupancy Type | # Households | Median Income |
| Owner-Occupied | 990 (78.9%) | $87,283 |
| Renter-Occupied | 265 (21.1%) | $30,964 |
| Average | 1,255 (100.0%) | $71,875 |
Occupancy by Householder Income Bracket in Lake Junaluska
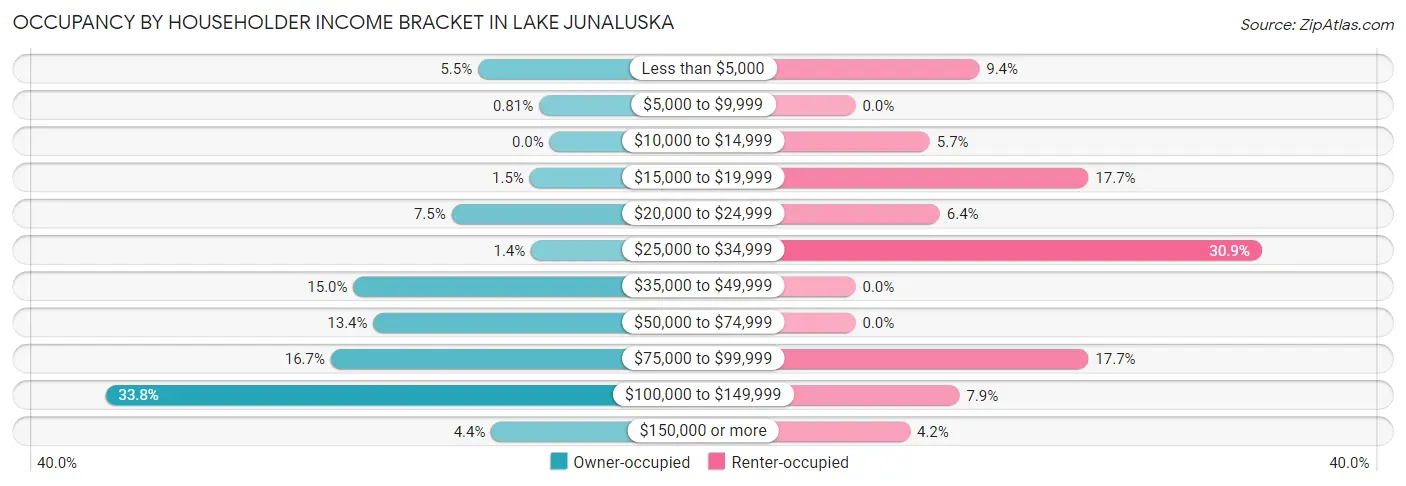
| Income Bracket | Owner-occupied | Renter-occupied |
| Less than $5,000 | 54 (5.4%) | 25 (9.4%) |
| $5,000 to $9,999 | 8 (0.8%) | 0 (0.0%) |
| $10,000 to $14,999 | 0 (0.0%) | 15 (5.7%) |
| $15,000 to $19,999 | 15 (1.5%) | 47 (17.7%) |
| $20,000 to $24,999 | 74 (7.5%) | 17 (6.4%) |
| $25,000 to $34,999 | 14 (1.4%) | 82 (30.9%) |
| $35,000 to $49,999 | 148 (14.9%) | 0 (0.0%) |
| $50,000 to $74,999 | 133 (13.4%) | 0 (0.0%) |
| $75,000 to $99,999 | 165 (16.7%) | 47 (17.7%) |
| $100,000 to $149,999 | 335 (33.8%) | 21 (7.9%) |
| $150,000 or more | 44 (4.4%) | 11 (4.2%) |
| Total | 990 (100.0%) | 265 (100.0%) |
Monthly Housing Cost Tiers in Lake Junaluska
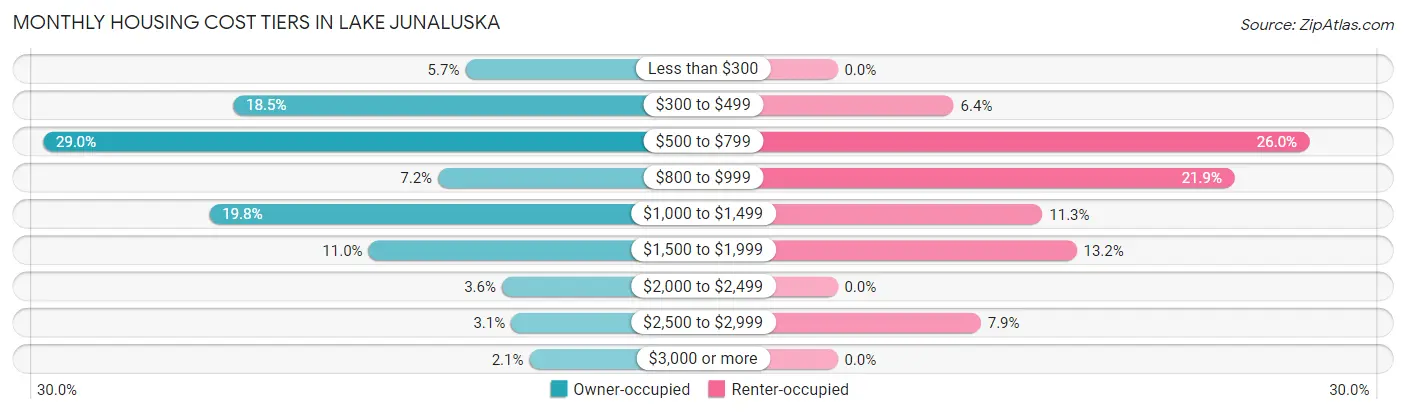
| Monthly Cost | Owner-occupied | Renter-occupied |
| Less than $300 | 56 (5.7%) | 0 (0.0%) |
| $300 to $499 | 183 (18.5%) | 17 (6.4%) |
| $500 to $799 | 287 (29.0%) | 69 (26.0%) |
| $800 to $999 | 71 (7.2%) | 58 (21.9%) |
| $1,000 to $1,499 | 196 (19.8%) | 30 (11.3%) |
| $1,500 to $1,999 | 109 (11.0%) | 35 (13.2%) |
| $2,000 to $2,499 | 36 (3.6%) | 0 (0.0%) |
| $2,500 to $2,999 | 31 (3.1%) | 21 (7.9%) |
| $3,000 or more | 21 (2.1%) | 0 (0.0%) |
| Total | 990 (100.0%) | 265 (100.0%) |
Physical Housing Characteristics in Lake Junaluska
Housing Structures in Lake Junaluska
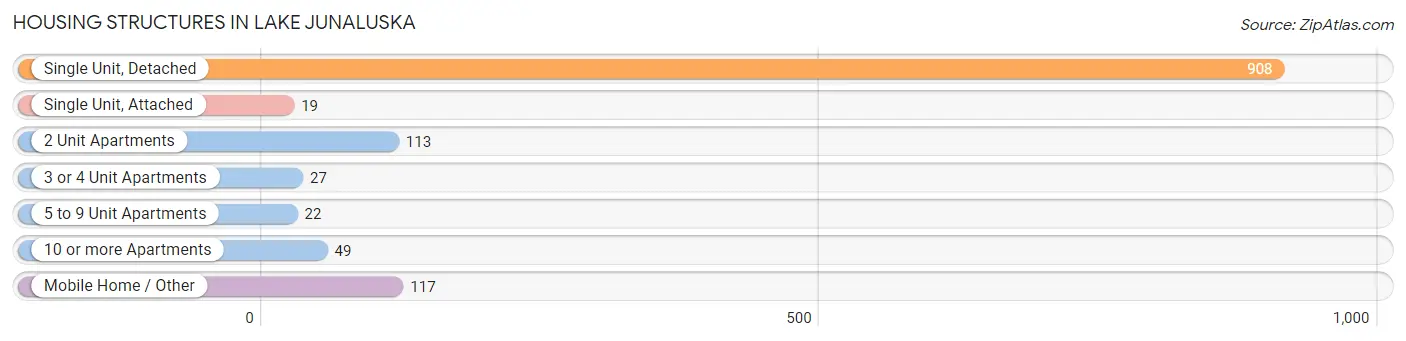
| Structure Type | # Housing Units | % Housing Units |
| Single Unit, Detached | 908 | 72.4% |
| Single Unit, Attached | 19 | 1.5% |
| 2 Unit Apartments | 113 | 9.0% |
| 3 or 4 Unit Apartments | 27 | 2.1% |
| 5 to 9 Unit Apartments | 22 | 1.8% |
| 10 or more Apartments | 49 | 3.9% |
| Mobile Home / Other | 117 | 9.3% |
| Total | 1,255 | 100.0% |
Housing Structures by Occupancy in Lake Junaluska
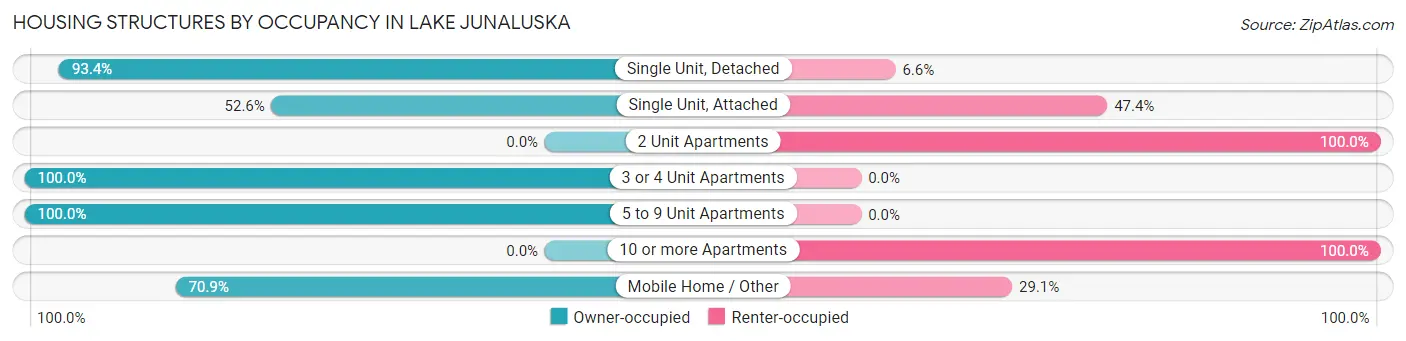
| Structure Type | Owner-occupied | Renter-occupied |
| Single Unit, Detached | 848 (93.4%) | 60 (6.6%) |
| Single Unit, Attached | 10 (52.6%) | 9 (47.4%) |
| 2 Unit Apartments | 0 (0.0%) | 113 (100.0%) |
| 3 or 4 Unit Apartments | 27 (100.0%) | 0 (0.0%) |
| 5 to 9 Unit Apartments | 22 (100.0%) | 0 (0.0%) |
| 10 or more Apartments | 0 (0.0%) | 49 (100.0%) |
| Mobile Home / Other | 83 (70.9%) | 34 (29.1%) |
| Total | 990 (78.9%) | 265 (21.1%) |
Housing Structures by Number of Rooms in Lake Junaluska
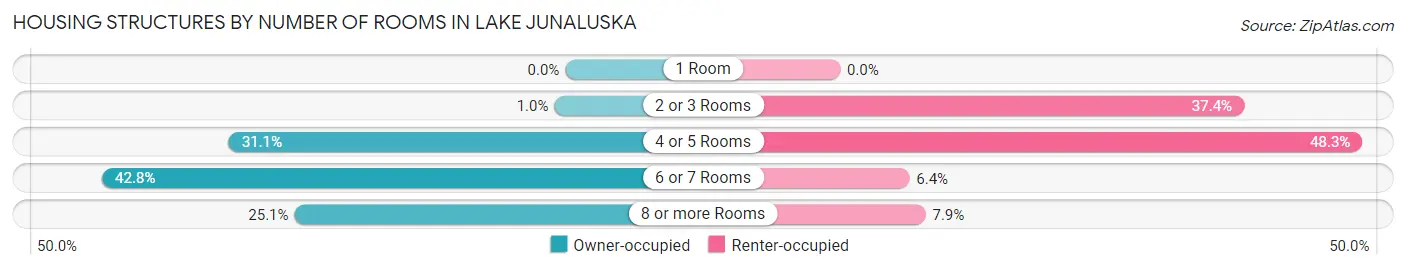
| Number of Rooms | Owner-occupied | Renter-occupied |
| 1 Room | 0 (0.0%) | 0 (0.0%) |
| 2 or 3 Rooms | 10 (1.0%) | 99 (37.4%) |
| 4 or 5 Rooms | 308 (31.1%) | 128 (48.3%) |
| 6 or 7 Rooms | 424 (42.8%) | 17 (6.4%) |
| 8 or more Rooms | 248 (25.1%) | 21 (7.9%) |
| Total | 990 (100.0%) | 265 (100.0%) |
Housing Structure by Heating Type in Lake Junaluska
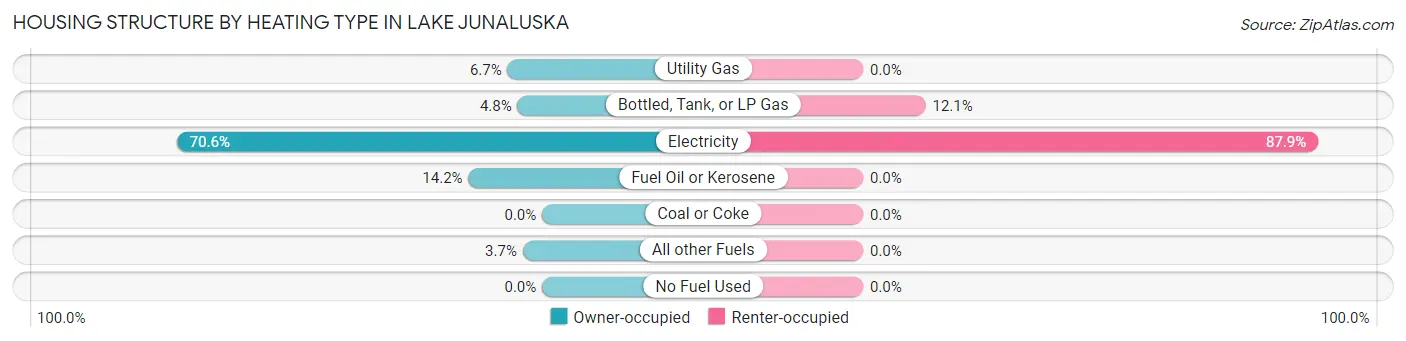
| Heating Type | Owner-occupied | Renter-occupied |
| Utility Gas | 66 (6.7%) | 0 (0.0%) |
| Bottled, Tank, or LP Gas | 47 (4.8%) | 32 (12.1%) |
| Electricity | 699 (70.6%) | 233 (87.9%) |
| Fuel Oil or Kerosene | 141 (14.2%) | 0 (0.0%) |
| Coal or Coke | 0 (0.0%) | 0 (0.0%) |
| All other Fuels | 37 (3.7%) | 0 (0.0%) |
| No Fuel Used | 0 (0.0%) | 0 (0.0%) |
| Total | 990 (100.0%) | 265 (100.0%) |
Household Vehicle Usage in Lake Junaluska
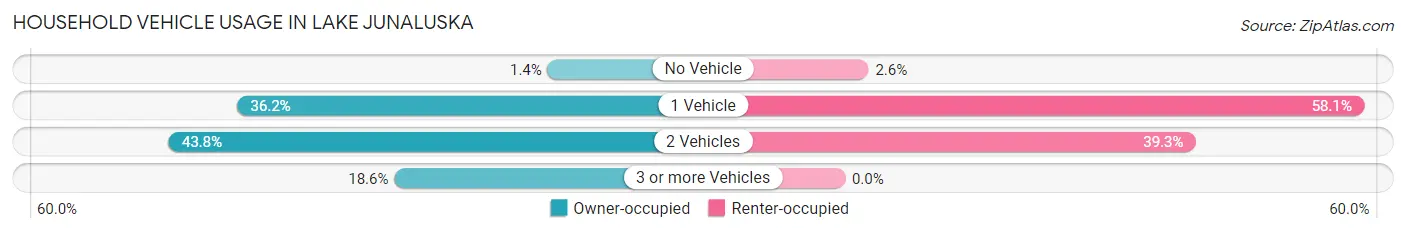
| Vehicles per Household | Owner-occupied | Renter-occupied |
| No Vehicle | 14 (1.4%) | 7 (2.6%) |
| 1 Vehicle | 358 (36.2%) | 154 (58.1%) |
| 2 Vehicles | 434 (43.8%) | 104 (39.3%) |
| 3 or more Vehicles | 184 (18.6%) | 0 (0.0%) |
| Total | 990 (100.0%) | 265 (100.0%) |
Real Estate & Mortgages in Lake Junaluska
Real Estate and Mortgage Overview in Lake Junaluska
| Characteristic | Without Mortgage | With Mortgage |
| Housing Units | 488 | 502 |
| Median Property Value | $374,800 | $241,300 |
| Median Household Income | $89,286 | $34 |
| Monthly Housing Costs | $503 | $21 |
| Real Estate Taxes | $1,754 | $0 |
Property Value by Mortgage Status in Lake Junaluska
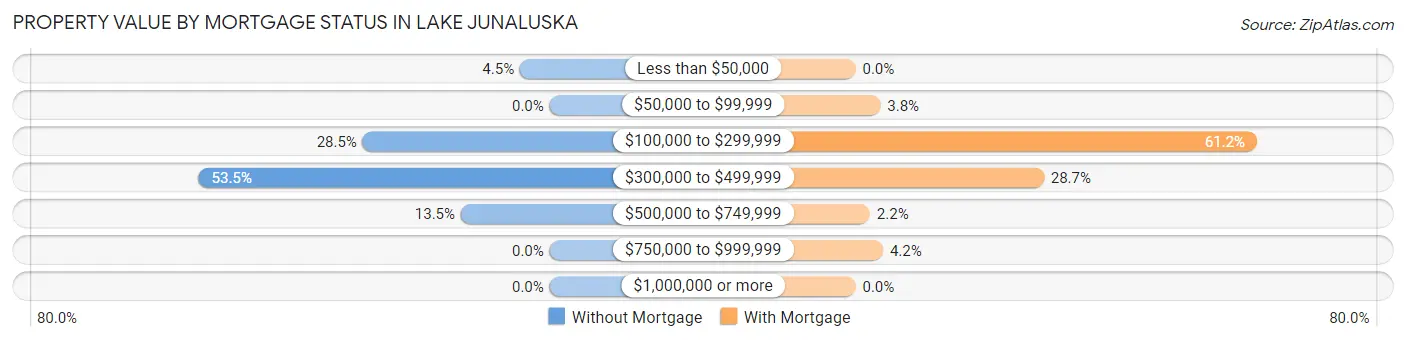
| Property Value | Without Mortgage | With Mortgage |
| Less than $50,000 | 22 (4.5%) | 0 (0.0%) |
| $50,000 to $99,999 | 0 (0.0%) | 19 (3.8%) |
| $100,000 to $299,999 | 139 (28.5%) | 307 (61.2%) |
| $300,000 to $499,999 | 261 (53.5%) | 144 (28.7%) |
| $500,000 to $749,999 | 66 (13.5%) | 11 (2.2%) |
| $750,000 to $999,999 | 0 (0.0%) | 21 (4.2%) |
| $1,000,000 or more | 0 (0.0%) | 0 (0.0%) |
| Total | 488 (100.0%) | 502 (100.0%) |
Household Income by Mortgage Status in Lake Junaluska
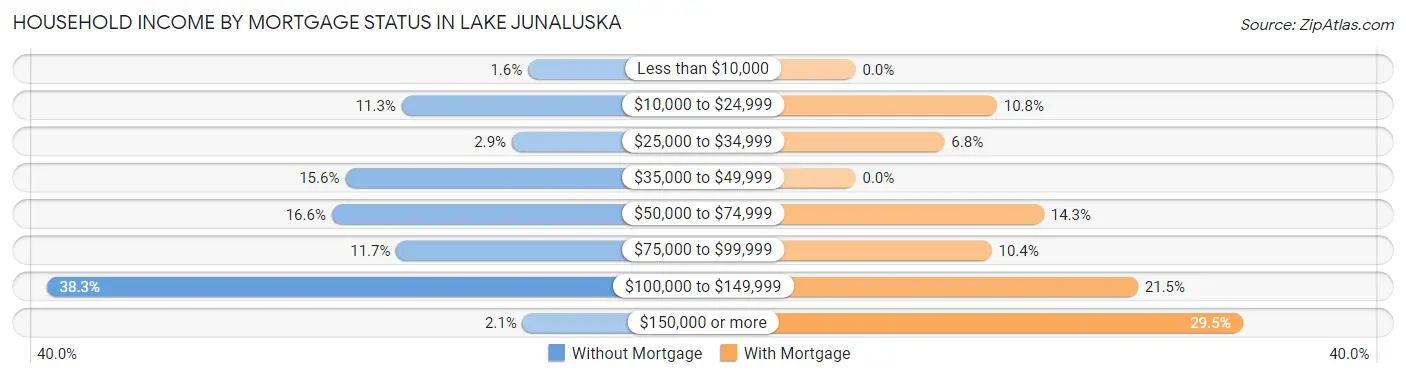
| Household Income | Without Mortgage | With Mortgage |
| Less than $10,000 | 8 (1.6%) | 0 (0.0%) |
| $10,000 to $24,999 | 55 (11.3%) | 54 (10.8%) |
| $25,000 to $34,999 | 14 (2.9%) | 34 (6.8%) |
| $35,000 to $49,999 | 76 (15.6%) | 0 (0.0%) |
| $50,000 to $74,999 | 81 (16.6%) | 72 (14.3%) |
| $75,000 to $99,999 | 57 (11.7%) | 52 (10.4%) |
| $100,000 to $149,999 | 187 (38.3%) | 108 (21.5%) |
| $150,000 or more | 10 (2.1%) | 148 (29.5%) |
| Total | 488 (100.0%) | 502 (100.0%) |
Property Value to Household Income Ratio in Lake Junaluska
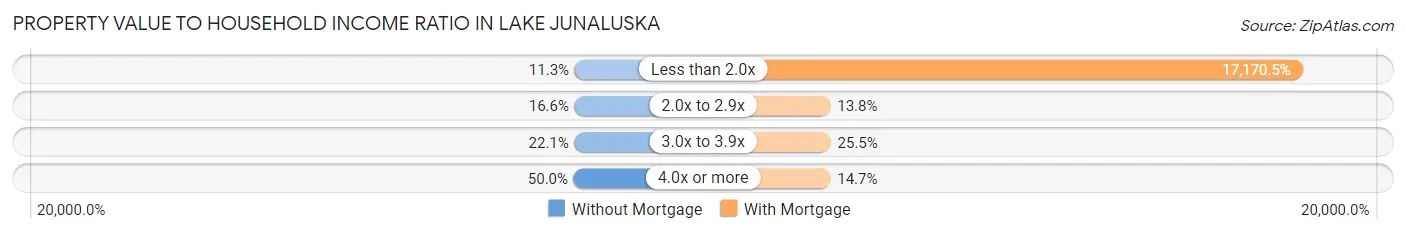
| Value-to-Income Ratio | Without Mortgage | With Mortgage |
| Less than 2.0x | 55 (11.3%) | 86,196 (17,170.5%) |
| 2.0x to 2.9x | 81 (16.6%) | 69 (13.8%) |
| 3.0x to 3.9x | 108 (22.1%) | 128 (25.5%) |
| 4.0x or more | 244 (50.0%) | 74 (14.7%) |
| Total | 488 (100.0%) | 502 (100.0%) |
Real Estate Taxes by Mortgage Status in Lake Junaluska
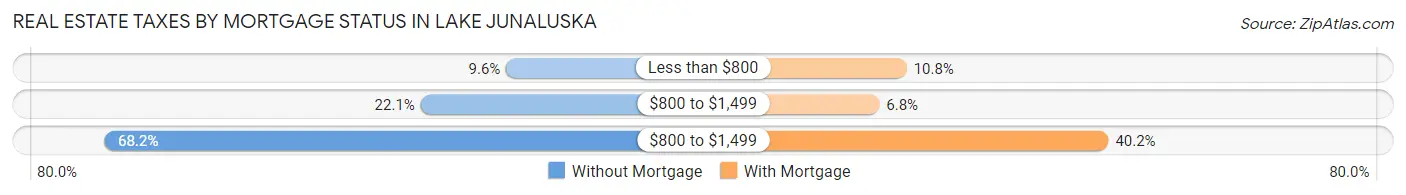
| Property Taxes | Without Mortgage | With Mortgage |
| Less than $800 | 47 (9.6%) | 54 (10.8%) |
| $800 to $1,499 | 108 (22.1%) | 34 (6.8%) |
| $800 to $1,499 | 333 (68.2%) | 202 (40.2%) |
| Total | 488 (100.0%) | 502 (100.0%) |
Health & Disability in Lake Junaluska
Health Insurance Coverage by Age in Lake Junaluska
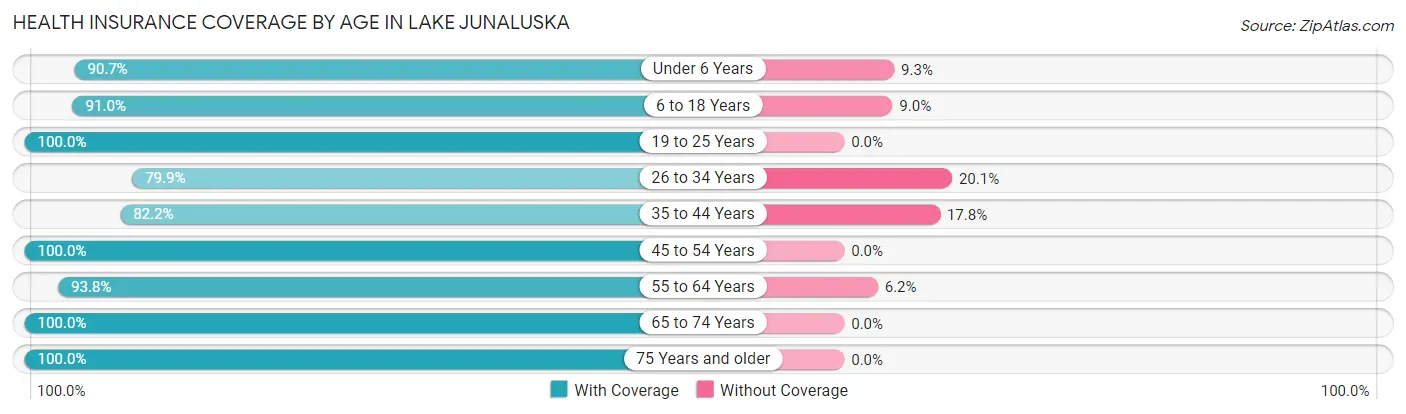
| Age Bracket | With Coverage | Without Coverage |
| Under 6 Years | 78 (90.7%) | 8 (9.3%) |
| 6 to 18 Years | 548 (91.0%) | 54 (9.0%) |
| 19 to 25 Years | 74 (100.0%) | 0 (0.0%) |
| 26 to 34 Years | 191 (79.9%) | 48 (20.1%) |
| 35 to 44 Years | 221 (82.2%) | 48 (17.8%) |
| 45 to 54 Years | 303 (100.0%) | 0 (0.0%) |
| 55 to 64 Years | 526 (93.8%) | 35 (6.2%) |
| 65 to 74 Years | 439 (100.0%) | 0 (0.0%) |
| 75 Years and older | 381 (100.0%) | 0 (0.0%) |
| Total | 2,761 (93.5%) | 193 (6.5%) |
Health Insurance Coverage by Citizenship Status in Lake Junaluska
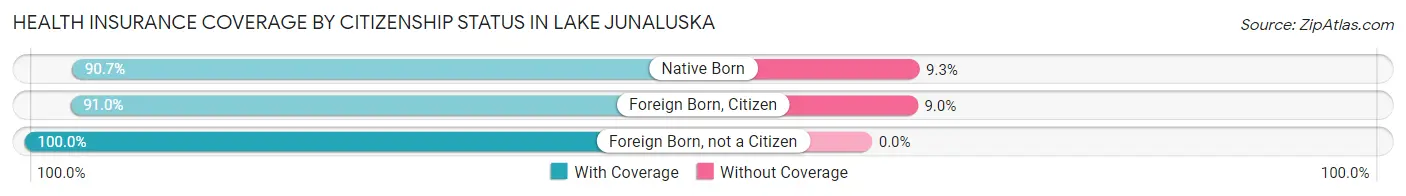
| Citizenship Status | With Coverage | Without Coverage |
| Native Born | 78 (90.7%) | 8 (9.3%) |
| Foreign Born, Citizen | 548 (91.0%) | 54 (9.0%) |
| Foreign Born, not a Citizen | 74 (100.0%) | 0 (0.0%) |
Health Insurance Coverage by Household Income in Lake Junaluska
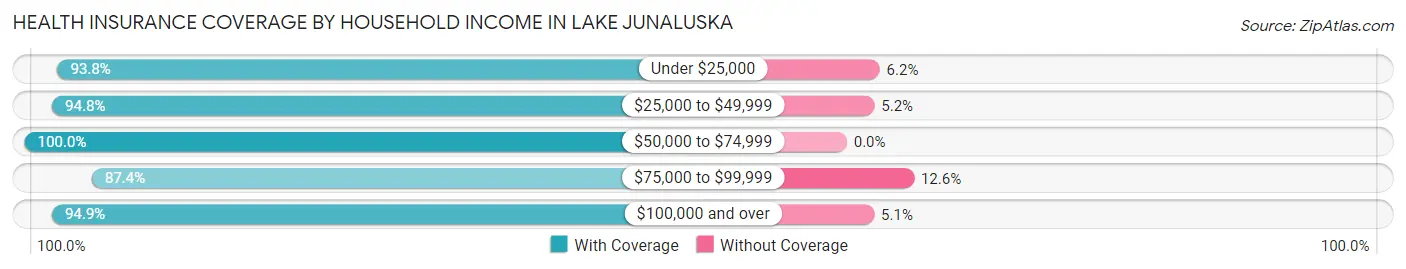
| Household Income | With Coverage | Without Coverage |
| Under $25,000 | 274 (93.8%) | 18 (6.2%) |
| $25,000 to $49,999 | 495 (94.8%) | 27 (5.2%) |
| $50,000 to $74,999 | 236 (100.0%) | 0 (0.0%) |
| $75,000 to $99,999 | 590 (87.4%) | 85 (12.6%) |
| $100,000 and over | 1,166 (94.9%) | 63 (5.1%) |
Public vs Private Health Insurance Coverage by Age in Lake Junaluska
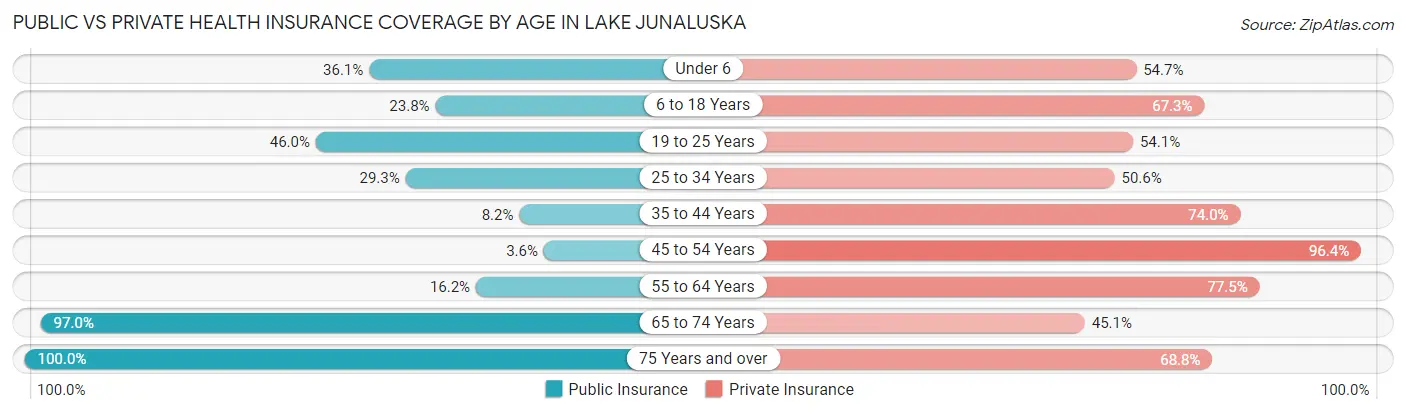
| Age Bracket | Public Insurance | Private Insurance |
| Under 6 | 31 (36.0%) | 47 (54.6%) |
| 6 to 18 Years | 143 (23.7%) | 405 (67.3%) |
| 19 to 25 Years | 34 (46.0%) | 40 (54.0%) |
| 25 to 34 Years | 70 (29.3%) | 121 (50.6%) |
| 35 to 44 Years | 22 (8.2%) | 199 (74.0%) |
| 45 to 54 Years | 11 (3.6%) | 292 (96.4%) |
| 55 to 64 Years | 91 (16.2%) | 435 (77.5%) |
| 65 to 74 Years | 426 (97.0%) | 198 (45.1%) |
| 75 Years and over | 381 (100.0%) | 262 (68.8%) |
| Total | 1,209 (40.9%) | 1,999 (67.7%) |
Disability Status by Sex by Age in Lake Junaluska
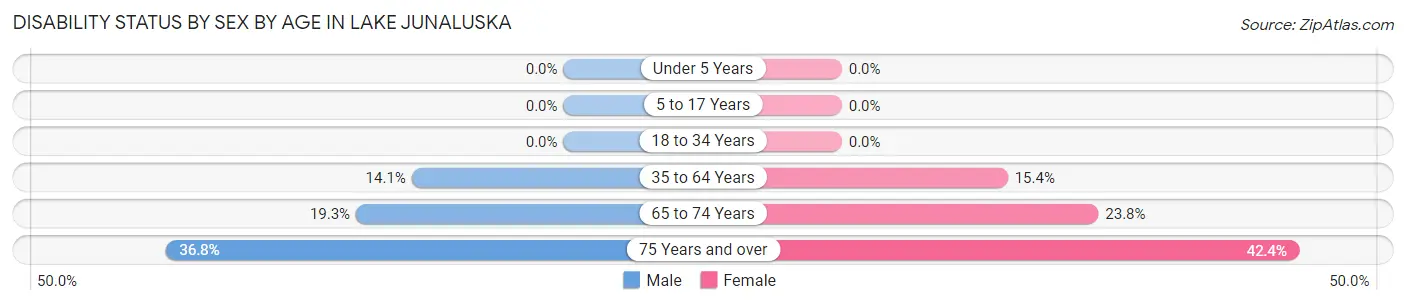
| Age Bracket | Male | Female |
| Under 5 Years | 0 (0.0%) | 0 (0.0%) |
| 5 to 17 Years | 0 (0.0%) | 0 (0.0%) |
| 18 to 34 Years | 0 (0.0%) | 0 (0.0%) |
| 35 to 64 Years | 58 (14.1%) | 111 (15.4%) |
| 65 to 74 Years | 36 (19.3%) | 60 (23.8%) |
| 75 Years and over | 70 (36.8%) | 81 (42.4%) |
Disability Class by Sex by Age in Lake Junaluska
Disability Class: Hearing Difficulty
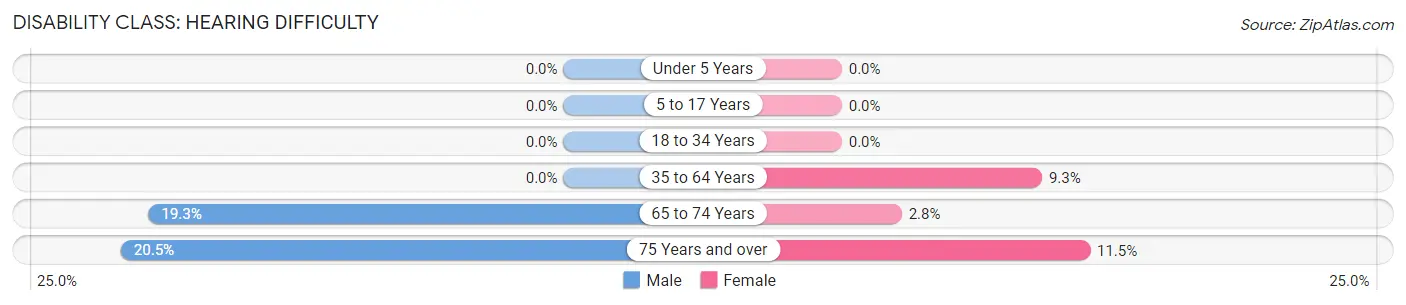
| Age Bracket | Male | Female |
| Under 5 Years | 0 (0.0%) | 0 (0.0%) |
| 5 to 17 Years | 0 (0.0%) | 0 (0.0%) |
| 18 to 34 Years | 0 (0.0%) | 0 (0.0%) |
| 35 to 64 Years | 0 (0.0%) | 67 (9.3%) |
| 65 to 74 Years | 36 (19.3%) | 7 (2.8%) |
| 75 Years and over | 39 (20.5%) | 22 (11.5%) |
Disability Class: Vision Difficulty
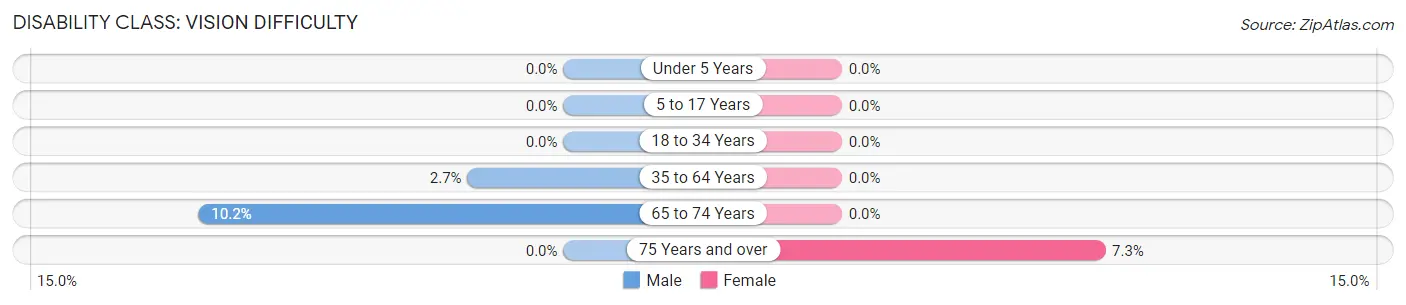
| Age Bracket | Male | Female |
| Under 5 Years | 0 (0.0%) | 0 (0.0%) |
| 5 to 17 Years | 0 (0.0%) | 0 (0.0%) |
| 18 to 34 Years | 0 (0.0%) | 0 (0.0%) |
| 35 to 64 Years | 11 (2.7%) | 0 (0.0%) |
| 65 to 74 Years | 19 (10.2%) | 0 (0.0%) |
| 75 Years and over | 0 (0.0%) | 14 (7.3%) |
Disability Class: Cognitive Difficulty
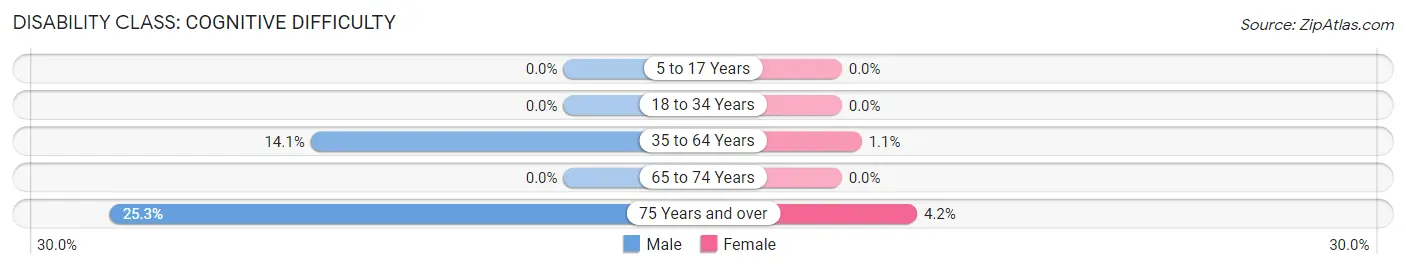
| Age Bracket | Male | Female |
| 5 to 17 Years | 0 (0.0%) | 0 (0.0%) |
| 18 to 34 Years | 0 (0.0%) | 0 (0.0%) |
| 35 to 64 Years | 58 (14.1%) | 8 (1.1%) |
| 65 to 74 Years | 0 (0.0%) | 0 (0.0%) |
| 75 Years and over | 48 (25.3%) | 8 (4.2%) |
Disability Class: Ambulatory Difficulty
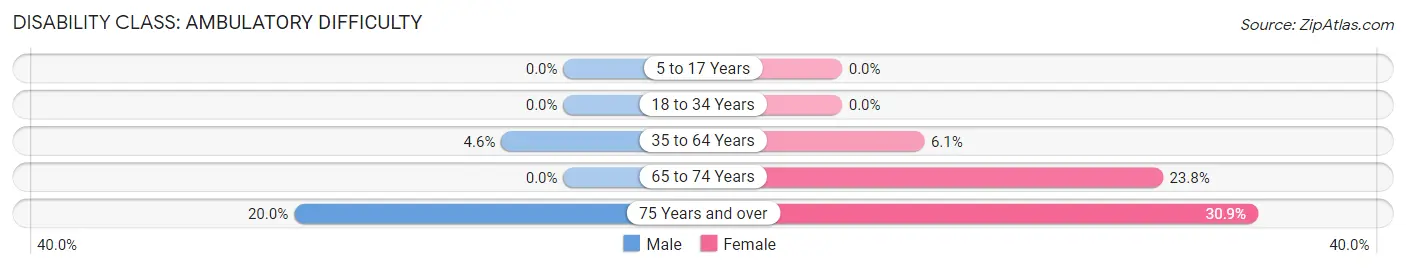
| Age Bracket | Male | Female |
| 5 to 17 Years | 0 (0.0%) | 0 (0.0%) |
| 18 to 34 Years | 0 (0.0%) | 0 (0.0%) |
| 35 to 64 Years | 19 (4.6%) | 44 (6.1%) |
| 65 to 74 Years | 0 (0.0%) | 60 (23.8%) |
| 75 Years and over | 38 (20.0%) | 59 (30.9%) |
Disability Class: Self-Care Difficulty
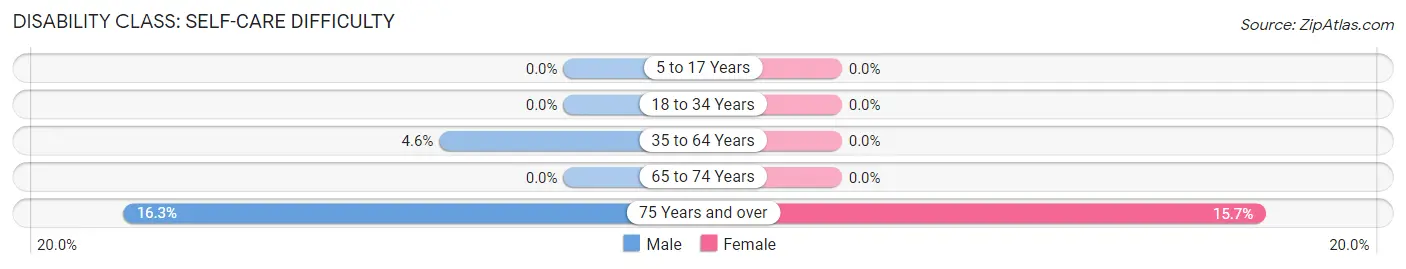
| Age Bracket | Male | Female |
| 5 to 17 Years | 0 (0.0%) | 0 (0.0%) |
| 18 to 34 Years | 0 (0.0%) | 0 (0.0%) |
| 35 to 64 Years | 19 (4.6%) | 0 (0.0%) |
| 65 to 74 Years | 0 (0.0%) | 0 (0.0%) |
| 75 Years and over | 31 (16.3%) | 30 (15.7%) |
Technology Access in Lake Junaluska
Computing Device Access in Lake Junaluska
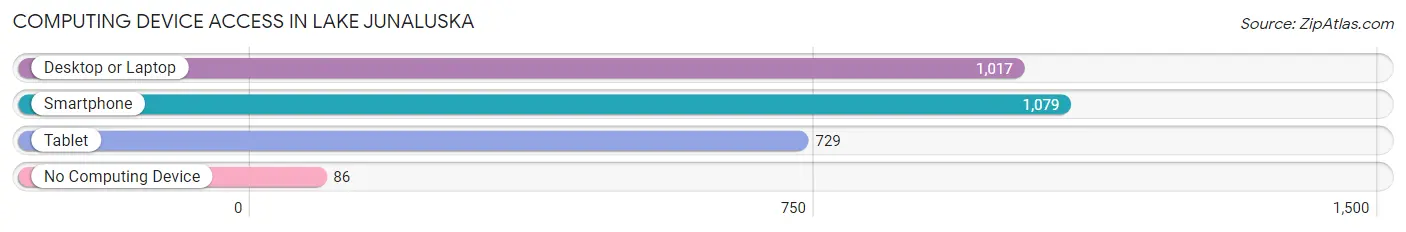
| Device Type | # Households | % Households |
| Desktop or Laptop | 1,017 | 81.0% |
| Smartphone | 1,079 | 86.0% |
| Tablet | 729 | 58.1% |
| No Computing Device | 86 | 6.9% |
| Total | 1,255 | 100.0% |
Internet Access in Lake Junaluska
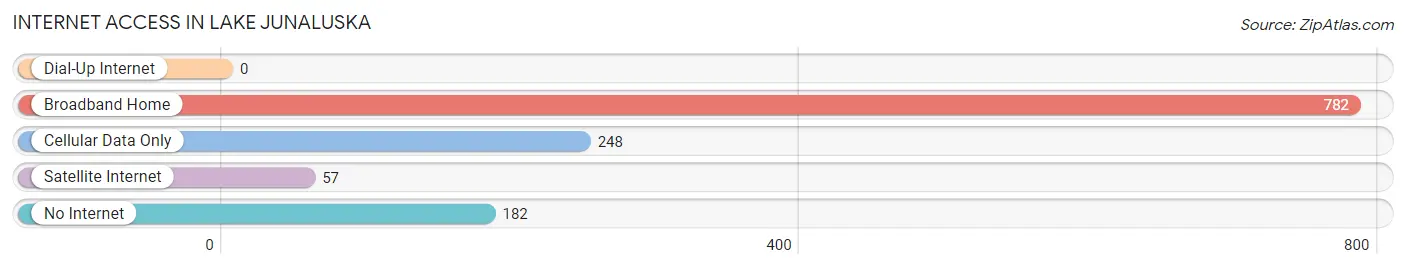
| Internet Type | # Households | % Households |
| Dial-Up Internet | 0 | 0.0% |
| Broadband Home | 782 | 62.3% |
| Cellular Data Only | 248 | 19.8% |
| Satellite Internet | 57 | 4.5% |
| No Internet | 182 | 14.5% |
| Total | 1,255 | 100.0% |
Lake Junaluska Summary
History
Lake Junaluska is a small town located in the mountains of western North Carolina. It is situated in Haywood County, and is part of the larger Asheville metropolitan area. The town was founded in 1913 by the Methodist Episcopal Church, South, as a summer retreat for its members. The name “Junaluska” is derived from the Cherokee chief Junaluska, who fought alongside Andrew Jackson in the Battle of Horseshoe Bend in 1814.
The town was originally developed as a resort destination, and it quickly became a popular destination for Methodist families. The town was designed to be a place of rest and relaxation, and it was also intended to be a place of spiritual renewal. The town was designed to be a place of beauty, and it was surrounded by lush forests and rolling hills.
The town was also designed to be a place of education. The Lake Junaluska Assembly was founded in 1913, and it was intended to be a place of learning and spiritual growth. The Assembly was a place where Methodist ministers and laypeople could come together to discuss theology and other topics. The Assembly also hosted a variety of educational programs, including lectures, concerts, and other events.
The town was also designed to be a place of recreation. The Lake Junaluska Golf Course was built in 1914, and it quickly became a popular destination for golfers. The town also had a variety of other recreational activities, including tennis, swimming, and boating.
The town was also designed to be a place of worship. The Lake Junaluska Assembly Hall was built in 1915, and it quickly became a popular destination for Methodist worship services. The Assembly Hall was also used for a variety of other events, including concerts, lectures, and other events.
The town was also designed to be a place of business. The Lake Junaluska Hotel was built in 1916, and it quickly became a popular destination for business travelers. The hotel was also used for a variety of other events, including conferences, conventions, and other events.
The town was also designed to be a place of entertainment. The Lake Junaluska Amusement Park was built in 1917, and it quickly became a popular destination for families. The amusement park was also used for a variety of other events, including concerts, lectures, and other events.
The town was also designed to be a place of culture. The Lake Junaluska Art Gallery was built in 1918, and it quickly became a popular destination for art lovers. The art gallery was also used for a variety of other events, including concerts, lectures, and other events.
Geography
Lake Junaluska is located in the mountains of western North Carolina. It is situated in Haywood County, and is part of the larger Asheville metropolitan area. The town is located at an elevation of 2,000 feet, and it is surrounded by lush forests and rolling hills. The town is located near the Great Smoky Mountains National Park, and it is also close to the Blue Ridge Parkway.
The town is located on the shores of Lake Junaluska, which is a man-made lake that was created in 1913. The lake is approximately 1,000 acres in size, and it is a popular destination for fishing, boating, and other recreational activities.
Economy
The economy of Lake Junaluska is largely based on tourism. The town is a popular destination for visitors from all over the world, and it is home to a variety of attractions, including the Lake Junaluska Assembly Hall, the Lake Junaluska Golf Course, and the Lake Junaluska Amusement Park. The town is also home to a variety of restaurants, shops, and other businesses.
The town is also home to a variety of manufacturing and industrial businesses. The town is home to a variety of companies that produce furniture, textiles, and other products. The town is also home to a variety of service-based businesses, including hotels, restaurants, and other businesses.
Demographics
As of the 2010 census, the population of Lake Junaluska was 1,837. The population is largely white (94.2%), and the median age is 44. The median household income is $41,944, and the median home value is $179,400. The town is largely Christian (90.2%), and the majority of residents are affiliated with the Methodist Episcopal Church, South.
Common Questions
What is Per Capita Income in Lake Junaluska?
Per Capita income in Lake Junaluska is $36,050.
What is the Median Family Income in Lake Junaluska?
Median Family Income in Lake Junaluska is $96,985.
What is the Median Household income in Lake Junaluska?
Median Household Income in Lake Junaluska is $71,875.
What is Income or Wage Gap in Lake Junaluska?
Income or Wage Gap in Lake Junaluska is 0.6%.
Women in Lake Junaluska earn 99.4 cents for every dollar earned by a man.
What is Inequality or Gini Index in Lake Junaluska?
Inequality or Gini Index in Lake Junaluska is 0.40.
What is the Total Population of Lake Junaluska?
Total Population of Lake Junaluska is 2,977.
What is the Total Male Population of Lake Junaluska?
Total Male Population of Lake Junaluska is 1,318.
What is the Total Female Population of Lake Junaluska?
Total Female Population of Lake Junaluska is 1,659.
What is the Ratio of Males per 100 Females in Lake Junaluska?
There are 79.45 Males per 100 Females in Lake Junaluska.
What is the Ratio of Females per 100 Males in Lake Junaluska?
There are 125.87 Females per 100 Males in Lake Junaluska.
What is the Median Population Age in Lake Junaluska?
Median Population Age in Lake Junaluska is 47.6 Years.
What is the Average Family Size in Lake Junaluska
Average Family Size in Lake Junaluska is 3.1 People.
What is the Average Household Size in Lake Junaluska
Average Household Size in Lake Junaluska is 2.4 People.
How Large is the Labor Force in Lake Junaluska?
There are 1,293 People in the Labor Forcein in Lake Junaluska.
What is the Percentage of People in the Labor Force in Lake Junaluska?
52.2% of People are in the Labor Force in Lake Junaluska.
What is the Unemployment Rate in Lake Junaluska?
Unemployment Rate in Lake Junaluska is 6.9%.