Hudson, NC Map & Demographics
Hudson Map
Hudson Overview
$25,492
PER CAPITA INCOME
$72,014
AVG FAMILY INCOME
$49,761
AVG HOUSEHOLD INCOME
26.9%
WAGE / INCOME GAP [ % ]
73.1¢/ $1
WAGE / INCOME GAP [ $ ]
0.43
INEQUALITY / GINI INDEX
3,780
TOTAL POPULATION
1,783
MALE POPULATION
1,997
FEMALE POPULATION
89.28
MALES / 100 FEMALES
112.00
FEMALES / 100 MALES
40.1
MEDIAN AGE
3.1
AVG FAMILY SIZE
2.5
AVG HOUSEHOLD SIZE
1,943
LABOR FORCE [ PEOPLE ]
61.0%
PERCENT IN LABOR FORCE
6.2%
UNEMPLOYMENT RATE
Hudson Zip Codes
Hudson Area Codes
Income in Hudson
Income Overview in Hudson
Per Capita Income in Hudson is $25,492, while median incomes of families and households are $72,014 and $49,761 respectively.
| Characteristic | Number | Measure |
| Per Capita Income | 3,780 | $25,492 |
| Median Family Income | 1,072 | $72,014 |
| Mean Family Income | 1,072 | $74,279 |
| Median Household Income | 1,483 | $49,761 |
| Mean Household Income | 1,483 | $62,676 |
| Income Deficit | 1,072 | $0 |
| Wage / Income Gap (%) | 3,780 | 26.94% |
| Wage / Income Gap ($) | 3,780 | 73.06¢ per $1 |
| Gini / Inequality Index | 3,780 | 0.43 |
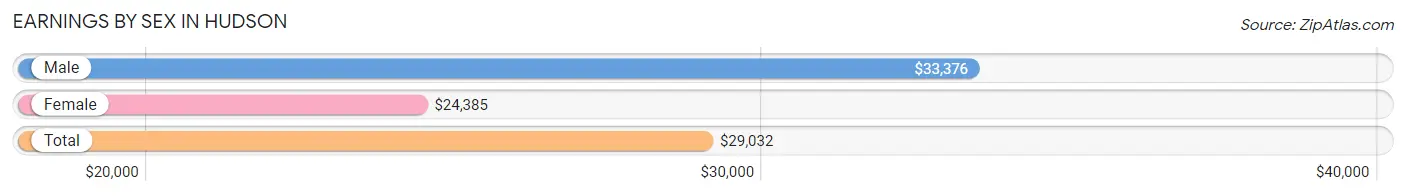
Earnings by Sex in Hudson
Average Earnings in Hudson are $29,032, $33,376 for men and $24,385 for women, a difference of 26.9%.
| Sex | Number | Average Earnings |
| Male | 995 (48.3%) | $33,376 |
| Female | 1,065 (51.7%) | $24,385 |
| Total | 2,060 (100.0%) | $29,032 |
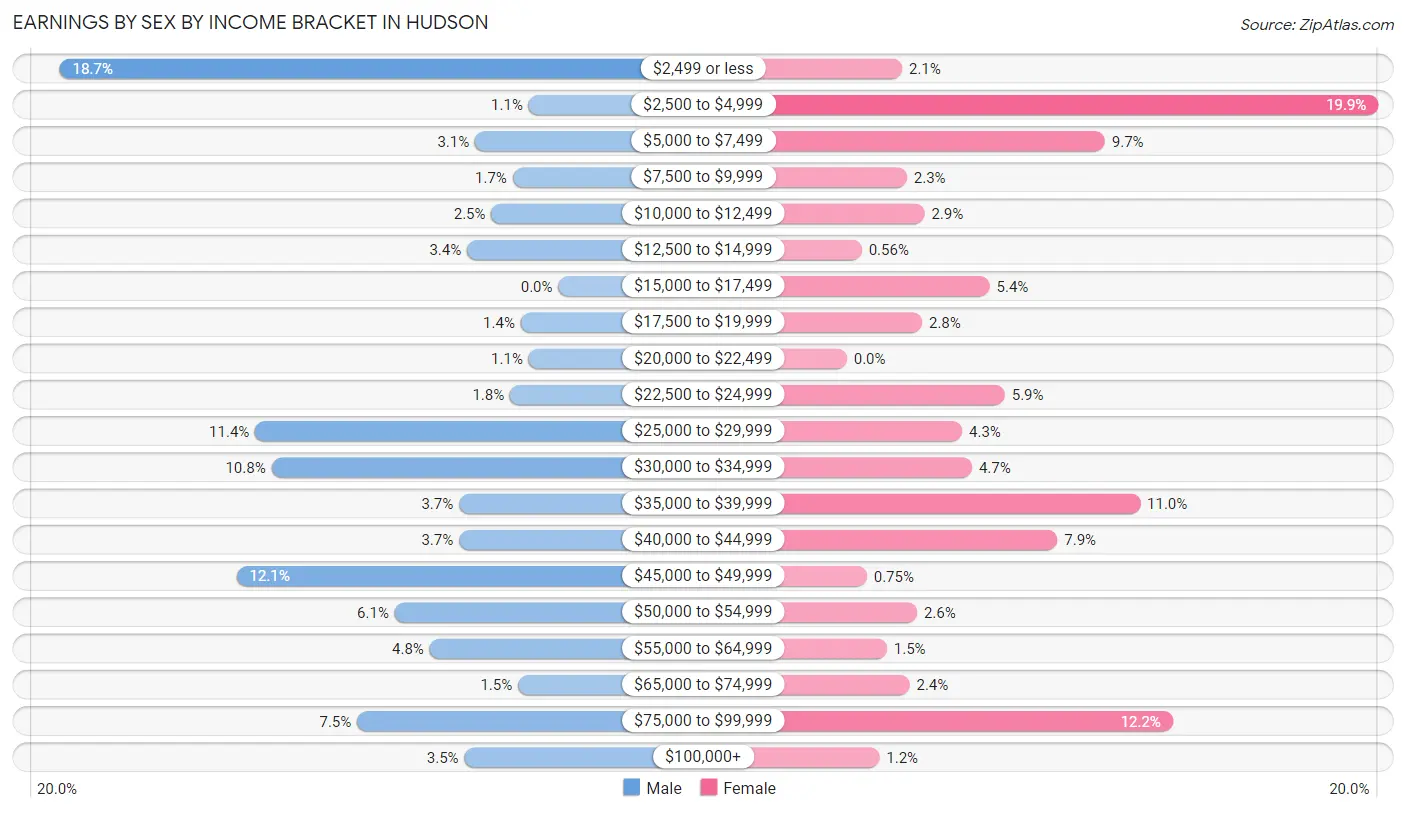
Earnings by Sex by Income Bracket in Hudson
The most common earnings brackets in Hudson are $2,499 or less for men (186 | 18.7%) and $2,500 to $4,999 for women (212 | 19.9%).
| Income | Male | Female |
| $2,499 or less | 186 (18.7%) | 22 (2.1%) |
| $2,500 to $4,999 | 11 (1.1%) | 212 (19.9%) |
| $5,000 to $7,499 | 31 (3.1%) | 103 (9.7%) |
| $7,500 to $9,999 | 17 (1.7%) | 24 (2.2%) |
| $10,000 to $12,499 | 25 (2.5%) | 31 (2.9%) |
| $12,500 to $14,999 | 34 (3.4%) | 6 (0.6%) |
| $15,000 to $17,499 | 0 (0.0%) | 57 (5.3%) |
| $17,500 to $19,999 | 14 (1.4%) | 30 (2.8%) |
| $20,000 to $22,499 | 11 (1.1%) | 0 (0.0%) |
| $22,500 to $24,999 | 18 (1.8%) | 63 (5.9%) |
| $25,000 to $29,999 | 113 (11.4%) | 46 (4.3%) |
| $30,000 to $34,999 | 107 (10.7%) | 50 (4.7%) |
| $35,000 to $39,999 | 37 (3.7%) | 117 (11.0%) |
| $40,000 to $44,999 | 37 (3.7%) | 84 (7.9%) |
| $45,000 to $49,999 | 120 (12.1%) | 8 (0.7%) |
| $50,000 to $54,999 | 61 (6.1%) | 28 (2.6%) |
| $55,000 to $64,999 | 48 (4.8%) | 16 (1.5%) |
| $65,000 to $74,999 | 15 (1.5%) | 25 (2.4%) |
| $75,000 to $99,999 | 75 (7.5%) | 130 (12.2%) |
| $100,000+ | 35 (3.5%) | 13 (1.2%) |
| Total | 995 (100.0%) | 1,065 (100.0%) |
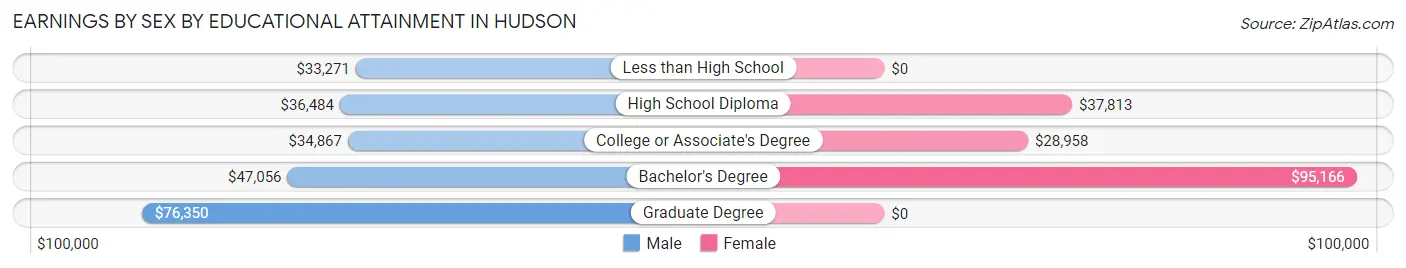
Earnings by Sex by Educational Attainment in Hudson
Average earnings in Hudson are $36,520 for men and $35,603 for women, a difference of 2.5%. Men with an educational attainment of graduate degree enjoy the highest average annual earnings of $76,350, while those with less than high school education earn the least with $33,271. Women with an educational attainment of bachelor's degree earn the most with the average annual earnings of $95,166, while those with college or associate's degree education have the smallest earnings of $28,958.
| Educational Attainment | Male Income | Female Income |
| Less than High School | $33,271 | $0 |
| High School Diploma | $36,484 | $37,813 |
| College or Associate's Degree | $34,867 | $28,958 |
| Bachelor's Degree | $47,056 | $95,166 |
| Graduate Degree | $76,350 | $0 |
| Total | $36,520 | $35,603 |
Family Income in Hudson
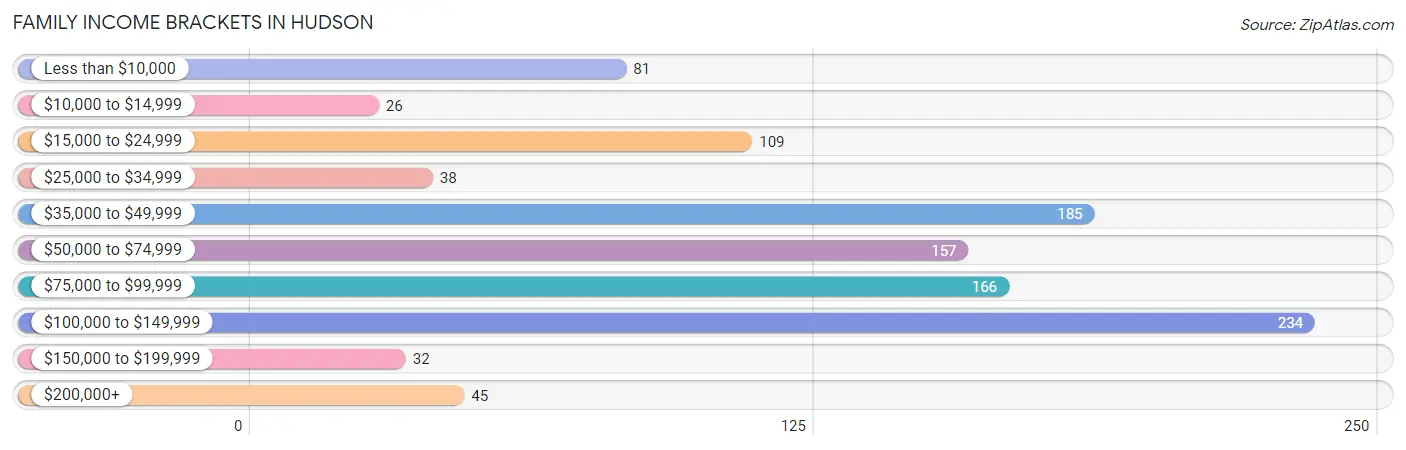
Family Income Brackets in Hudson
According to the Hudson family income data, there are 234 families falling into the $100,000 to $149,999 income range, which is the most common income bracket and makes up 21.8% of all families. Conversely, the $10,000 to $14,999 income bracket is the least frequent group with only 26 families (2.4%) belonging to this category.
| Income Bracket | # Families | % Families |
| Less than $10,000 | 81 | 7.6% |
| $10,000 to $14,999 | 26 | 2.4% |
| $15,000 to $24,999 | 109 | 10.2% |
| $25,000 to $34,999 | 38 | 3.5% |
| $35,000 to $49,999 | 185 | 17.3% |
| $50,000 to $74,999 | 157 | 14.6% |
| $75,000 to $99,999 | 166 | 15.5% |
| $100,000 to $149,999 | 234 | 21.8% |
| $150,000 to $199,999 | 32 | 3.0% |
| $200,000+ | 45 | 4.2% |
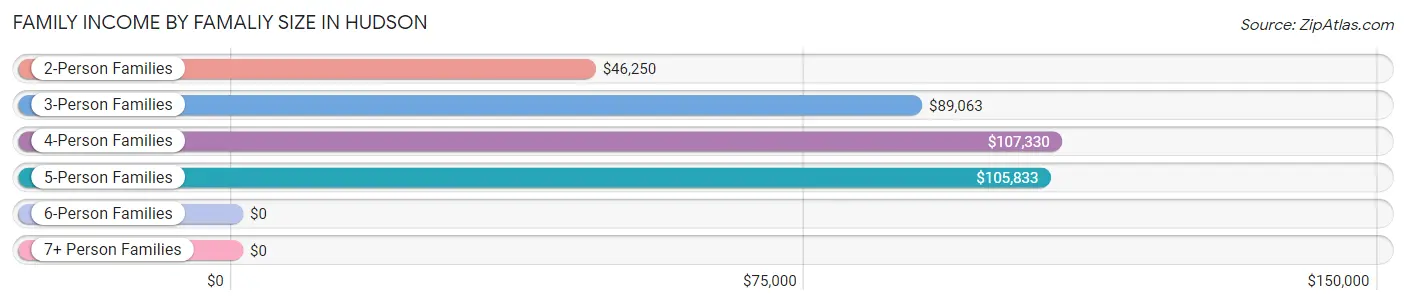
Family Income by Famaliy Size in Hudson
4-person families (127 | 11.8%) account for the highest median family income in Hudson with $107,330 per family, while 3-person families (354 | 33.0%) have the highest median income of $29,688 per family member.
| Income Bracket | # Families | Median Income |
| 2-Person Families | 510 (47.6%) | $46,250 |
| 3-Person Families | 354 (33.0%) | $89,063 |
| 4-Person Families | 127 (11.8%) | $107,330 |
| 5-Person Families | 46 (4.3%) | $105,833 |
| 6-Person Families | 17 (1.6%) | $0 |
| 7+ Person Families | 18 (1.7%) | $0 |
| Total | 1,072 (100.0%) | $72,014 |
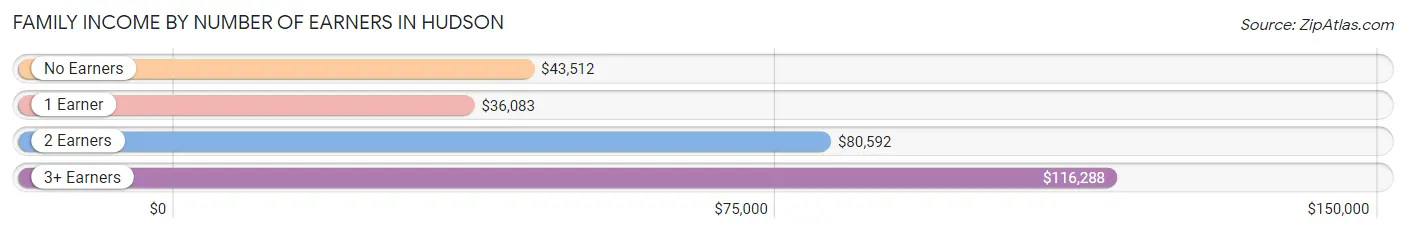
Family Income by Number of Earners in Hudson
The median family income in Hudson is $72,014, with families comprising 3+ earners (245) having the highest median family income of $116,288, while families with 1 earner (415) have the lowest median family income of $36,083, accounting for 22.9% and 38.7% of families, respectively.
| Number of Earners | # Families | Median Income |
| No Earners | 125 (11.7%) | $43,512 |
| 1 Earner | 415 (38.7%) | $36,083 |
| 2 Earners | 287 (26.8%) | $80,592 |
| 3+ Earners | 245 (22.9%) | $116,288 |
| Total | 1,072 (100.0%) | $72,014 |
Household Income in Hudson
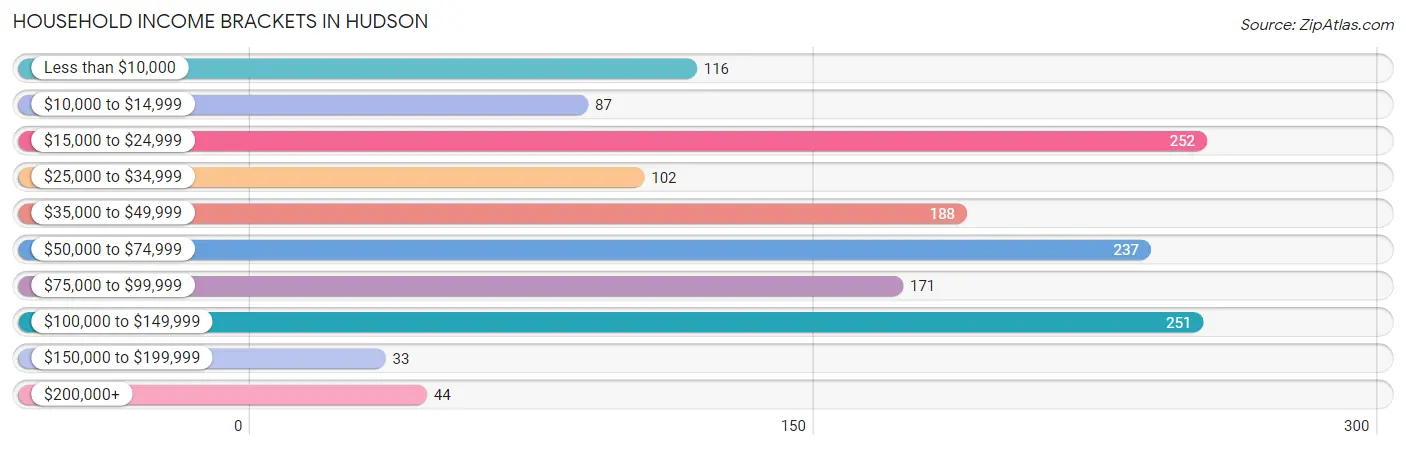
Household Income Brackets in Hudson
With 252 households falling in the category, the $15,000 to $24,999 income range is the most frequent in Hudson, accounting for 17.0% of all households. In contrast, only 33 households (2.2%) fall into the $150,000 to $199,999 income bracket, making it the least populous group.
| Income Bracket | # Households | % Households |
| Less than $10,000 | 116 | 7.8% |
| $10,000 to $14,999 | 87 | 5.9% |
| $15,000 to $24,999 | 252 | 17.0% |
| $25,000 to $34,999 | 102 | 6.9% |
| $35,000 to $49,999 | 188 | 12.7% |
| $50,000 to $74,999 | 237 | 16.0% |
| $75,000 to $99,999 | 171 | 11.5% |
| $100,000 to $149,999 | 251 | 16.9% |
| $150,000 to $199,999 | 33 | 2.2% |
| $200,000+ | 44 | 3.0% |
Household Income by Householder Age in Hudson
The median household income in Hudson is $49,761, with the highest median household income of $77,750 found in the 25 to 44 years age bracket for the primary householder. A total of 337 households (22.7%) fall into this category. Meanwhile, the 15 to 24 years age bracket for the primary householder has the lowest median household income of $0, with 21 households (1.4%) in this group.
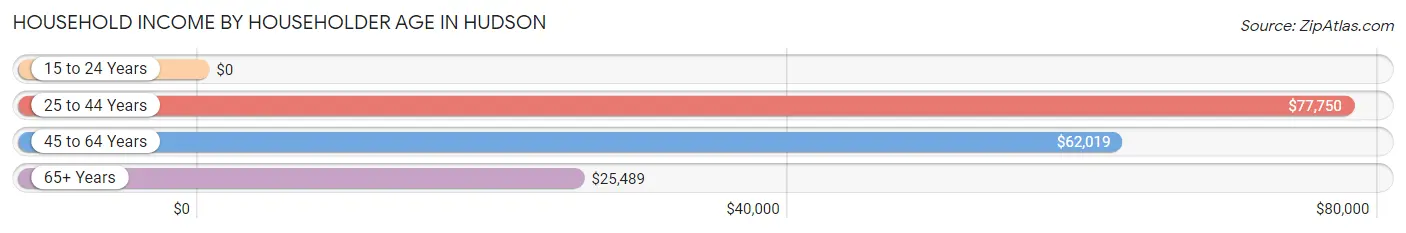
| Income Bracket | # Households | Median Income |
| 15 to 24 Years | 21 (1.4%) | $0 |
| 25 to 44 Years | 337 (22.7%) | $77,750 |
| 45 to 64 Years | 643 (43.4%) | $62,019 |
| 65+ Years | 482 (32.5%) | $25,489 |
| Total | 1,483 (100.0%) | $49,761 |
Poverty in Hudson
Income Below Poverty by Sex and Age in Hudson
With 17.7% poverty level for males and 19.2% for females among the residents of Hudson, 15 year old males and 5 year old females are the most vulnerable to poverty, with 33 males (100.0%) and 13 females (100.0%) in their respective age groups living below the poverty level.
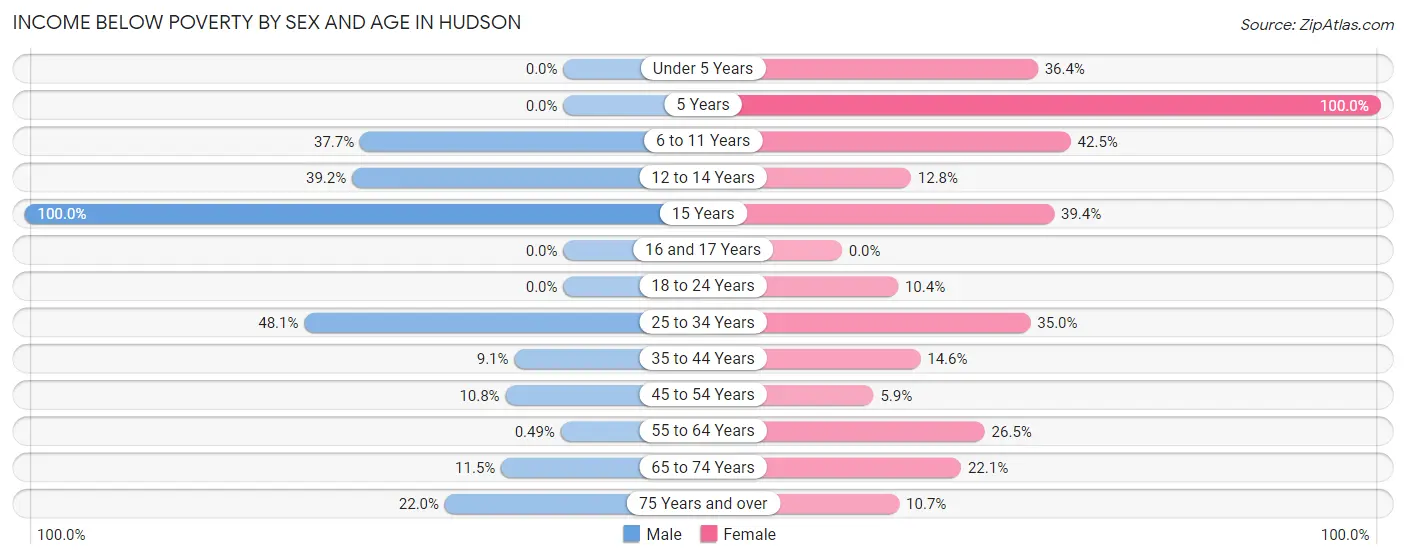
| Age Bracket | Male | Female |
| Under 5 Years | 0 (0.0%) | 12 (36.4%) |
| 5 Years | 0 (0.0%) | 13 (100.0%) |
| 6 to 11 Years | 40 (37.7%) | 48 (42.5%) |
| 12 to 14 Years | 20 (39.2%) | 15 (12.8%) |
| 15 Years | 33 (100.0%) | 13 (39.4%) |
| 16 and 17 Years | 0 (0.0%) | 0 (0.0%) |
| 18 to 24 Years | 0 (0.0%) | 29 (10.4%) |
| 25 to 34 Years | 126 (48.1%) | 56 (35.0%) |
| 35 to 44 Years | 27 (9.1%) | 29 (14.6%) |
| 45 to 54 Years | 20 (10.7%) | 17 (5.9%) |
| 55 to 64 Years | 1 (0.5%) | 83 (26.5%) |
| 65 to 74 Years | 18 (11.5%) | 46 (22.1%) |
| 75 Years and over | 31 (22.0%) | 23 (10.6%) |
| Total | 316 (17.7%) | 384 (19.2%) |
Income Above Poverty by Sex and Age in Hudson
According to the poverty statistics in Hudson, males aged under 5 years and females aged 16 and 17 years are the age groups that are most secure financially, with 100.0% of males and 100.0% of females in these age groups living above the poverty line.
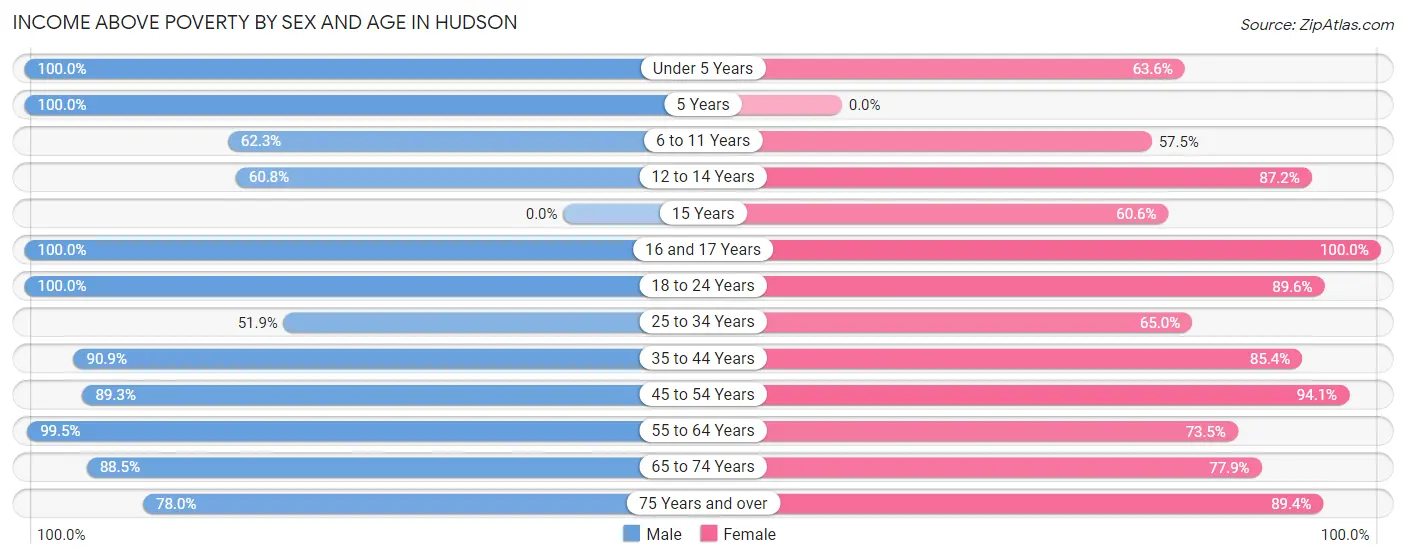
| Age Bracket | Male | Female |
| Under 5 Years | 62 (100.0%) | 21 (63.6%) |
| 5 Years | 33 (100.0%) | 0 (0.0%) |
| 6 to 11 Years | 66 (62.3%) | 65 (57.5%) |
| 12 to 14 Years | 31 (60.8%) | 102 (87.2%) |
| 15 Years | 0 (0.0%) | 20 (60.6%) |
| 16 and 17 Years | 97 (100.0%) | 24 (100.0%) |
| 18 to 24 Years | 154 (100.0%) | 249 (89.6%) |
| 25 to 34 Years | 136 (51.9%) | 104 (65.0%) |
| 35 to 44 Years | 270 (90.9%) | 170 (85.4%) |
| 45 to 54 Years | 166 (89.2%) | 272 (94.1%) |
| 55 to 64 Years | 204 (99.5%) | 230 (73.5%) |
| 65 to 74 Years | 138 (88.5%) | 162 (77.9%) |
| 75 Years and over | 110 (78.0%) | 193 (89.3%) |
| Total | 1,467 (82.3%) | 1,612 (80.8%) |
Income Below Poverty Among Married-Couple Families in Hudson
The poverty statistics for married-couple families in Hudson show that 6.6% or 40 of the total 611 families live below the poverty line. Families with 3 or 4 children have the highest poverty rate of 22.7%, comprising of 17 families. On the other hand, families with 1 or 2 children have the lowest poverty rate of 3.6%, which includes 5 families.
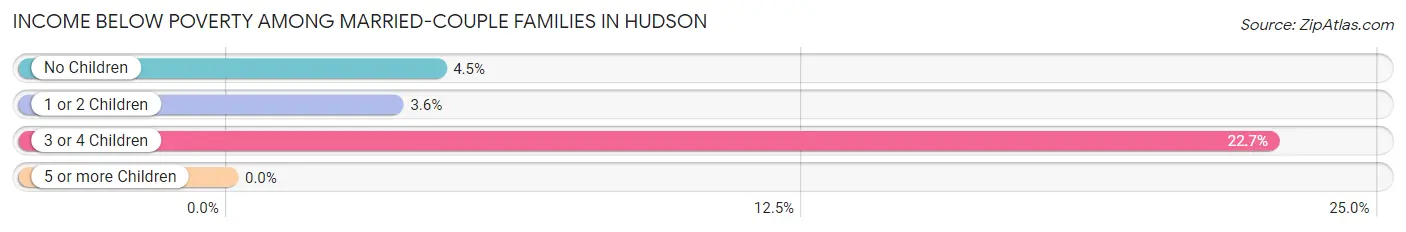
| Children | Above Poverty | Below Poverty |
| No Children | 379 (95.5%) | 18 (4.5%) |
| 1 or 2 Children | 134 (96.4%) | 5 (3.6%) |
| 3 or 4 Children | 58 (77.3%) | 17 (22.7%) |
| 5 or more Children | 0 (0.0%) | 0 (0.0%) |
| Total | 571 (93.4%) | 40 (6.6%) |
Income Below Poverty Among Single-Parent Households in Hudson
According to the poverty data in Hudson, 13.8% or 8 single-father households and 39.0% or 157 single-mother households are living below the poverty line. Among single-father households, those with no children have the highest poverty rate, with 8 households (16.7%) experiencing poverty. Likewise, among single-mother households, those with no children have the highest poverty rate, with 82 households (59.0%) falling below the poverty line.
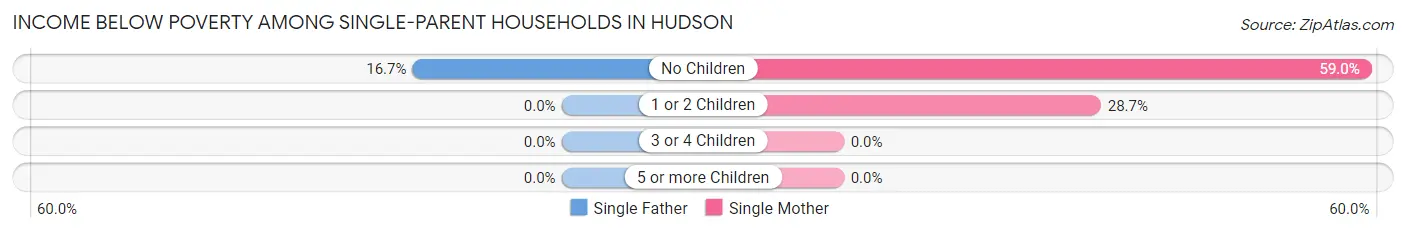
| Children | Single Father | Single Mother |
| No Children | 8 (16.7%) | 82 (59.0%) |
| 1 or 2 Children | 0 (0.0%) | 75 (28.7%) |
| 3 or 4 Children | 0 (0.0%) | 0 (0.0%) |
| 5 or more Children | 0 (0.0%) | 0 (0.0%) |
| Total | 8 (13.8%) | 157 (39.0%) |
Income Below Poverty Among Married-Couple vs Single-Parent Households in Hudson
The poverty data for Hudson shows that 40 of the married-couple family households (6.6%) and 165 of the single-parent households (35.8%) are living below the poverty level. Within the married-couple family households, those with 3 or 4 children have the highest poverty rate, with 17 households (22.7%) falling below the poverty line. Among the single-parent households, those with no children have the highest poverty rate, with 90 household (48.1%) living below poverty.
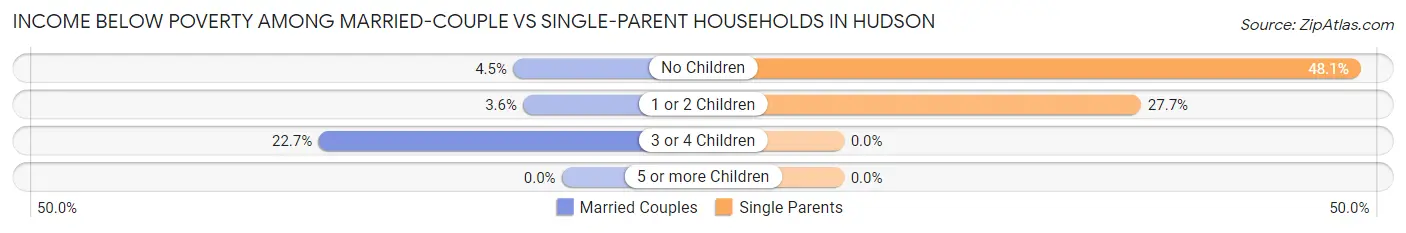
| Children | Married-Couple Families | Single-Parent Households |
| No Children | 18 (4.5%) | 90 (48.1%) |
| 1 or 2 Children | 5 (3.6%) | 75 (27.7%) |
| 3 or 4 Children | 17 (22.7%) | 0 (0.0%) |
| 5 or more Children | 0 (0.0%) | 0 (0.0%) |
| Total | 40 (6.6%) | 165 (35.8%) |
Race in Hudson
The most populous races in Hudson are White / Caucasian (3,653 | 96.6%), Hispanic or Latino (325 | 8.6%), and Two or more Races (95 | 2.5%).
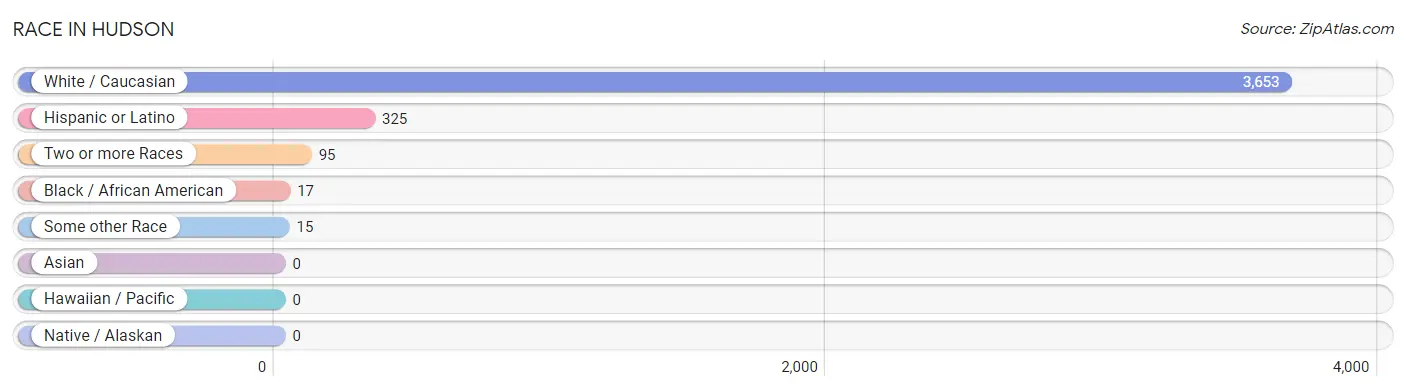
| Race | # Population | % Population |
| Asian | 0 | 0.0% |
| Black / African American | 17 | 0.4% |
| Hawaiian / Pacific | 0 | 0.0% |
| Hispanic or Latino | 325 | 8.6% |
| Native / Alaskan | 0 | 0.0% |
| White / Caucasian | 3,653 | 96.6% |
| Two or more Races | 95 | 2.5% |
| Some other Race | 15 | 0.4% |
| Total | 3,780 | 100.0% |
Ancestry in Hudson
The most populous ancestries reported in Hudson are English (767 | 20.3%), American (613 | 16.2%), German (508 | 13.4%), Norwegian (345 | 9.1%), and Mexican (319 | 8.4%), together accounting for 67.5% of all Hudson residents.
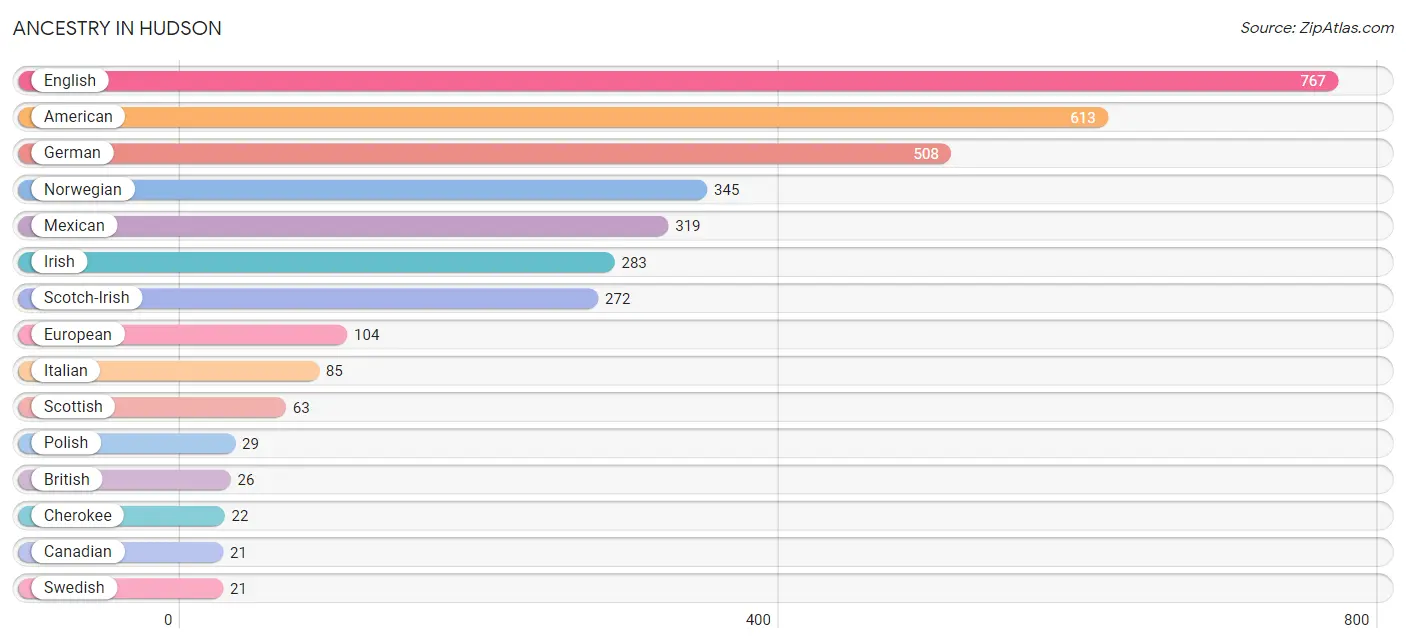
| Ancestry | # Population | % Population |
| American | 613 | 16.2% |
| Armenian | 14 | 0.4% |
| Blackfeet | 6 | 0.2% |
| British | 26 | 0.7% |
| Canadian | 21 | 0.6% |
| Central American | 6 | 0.2% |
| Cherokee | 22 | 0.6% |
| Costa Rican | 6 | 0.2% |
| Dutch | 6 | 0.2% |
| English | 767 | 20.3% |
| European | 104 | 2.8% |
| French | 9 | 0.2% |
| German | 508 | 13.4% |
| Irish | 283 | 7.5% |
| Italian | 85 | 2.2% |
| Mexican | 319 | 8.4% |
| Norwegian | 345 | 9.1% |
| Polish | 29 | 0.8% |
| Russian | 1 | 0.0% |
| Scotch-Irish | 272 | 7.2% |
| Scottish | 63 | 1.7% |
| Swedish | 21 | 0.6% |
| Swiss | 6 | 0.2% |
| Welsh | 11 | 0.3% | View All 24 Rows |
Immigrants in Hudson
The most numerous immigrant groups reported in Hudson came from Latin America (185 | 4.9%), Central America (155 | 4.1%), Mexico (149 | 3.9%), South America (30 | 0.8%), and Canada (21 | 0.6%), together accounting for 14.3% of all Hudson residents.
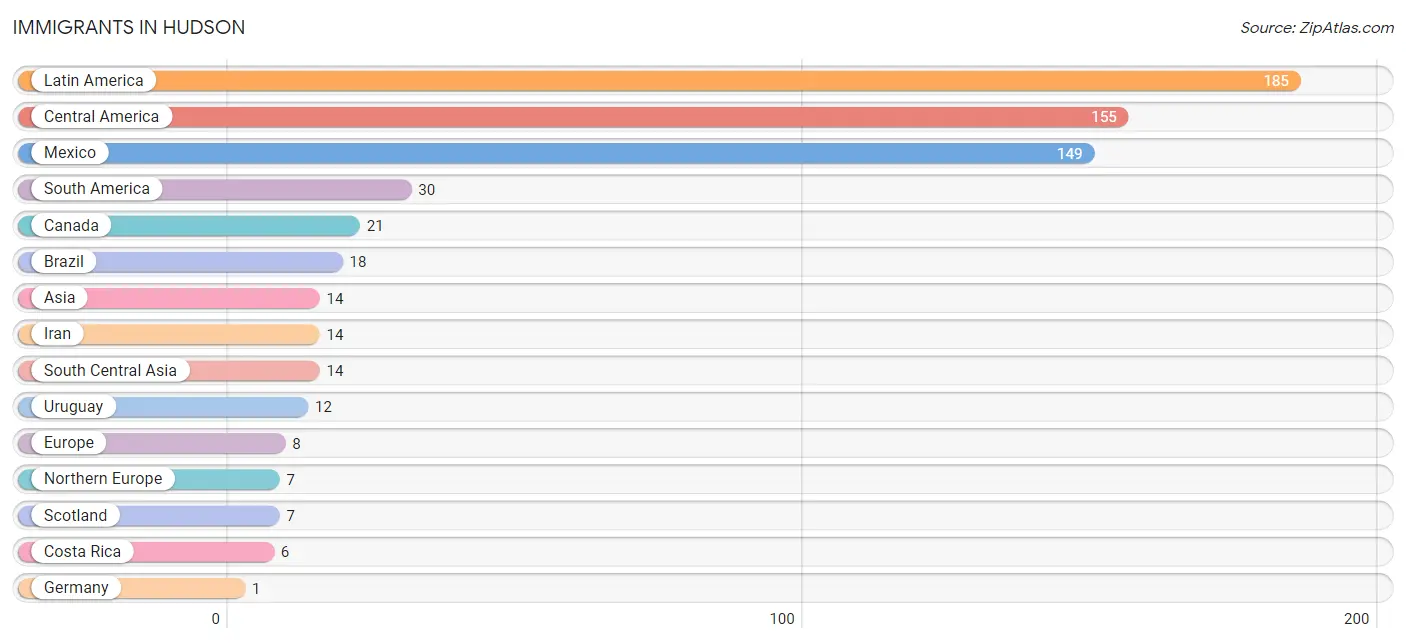
| Immigration Origin | # Population | % Population |
| Asia | 14 | 0.4% |
| Brazil | 18 | 0.5% |
| Canada | 21 | 0.6% |
| Central America | 155 | 4.1% |
| Costa Rica | 6 | 0.2% |
| Europe | 8 | 0.2% |
| Germany | 1 | 0.0% |
| Iran | 14 | 0.4% |
| Latin America | 185 | 4.9% |
| Mexico | 149 | 3.9% |
| Northern Europe | 7 | 0.2% |
| Scotland | 7 | 0.2% |
| South America | 30 | 0.8% |
| South Central Asia | 14 | 0.4% |
| Uruguay | 12 | 0.3% |
| Western Europe | 1 | 0.0% | View All 16 Rows |
Sex and Age in Hudson
Sex and Age in Hudson
The most populous age groups in Hudson are 15 to 19 Years (188 | 10.5%) for men and 45 to 49 Years (235 | 11.8%) for women.
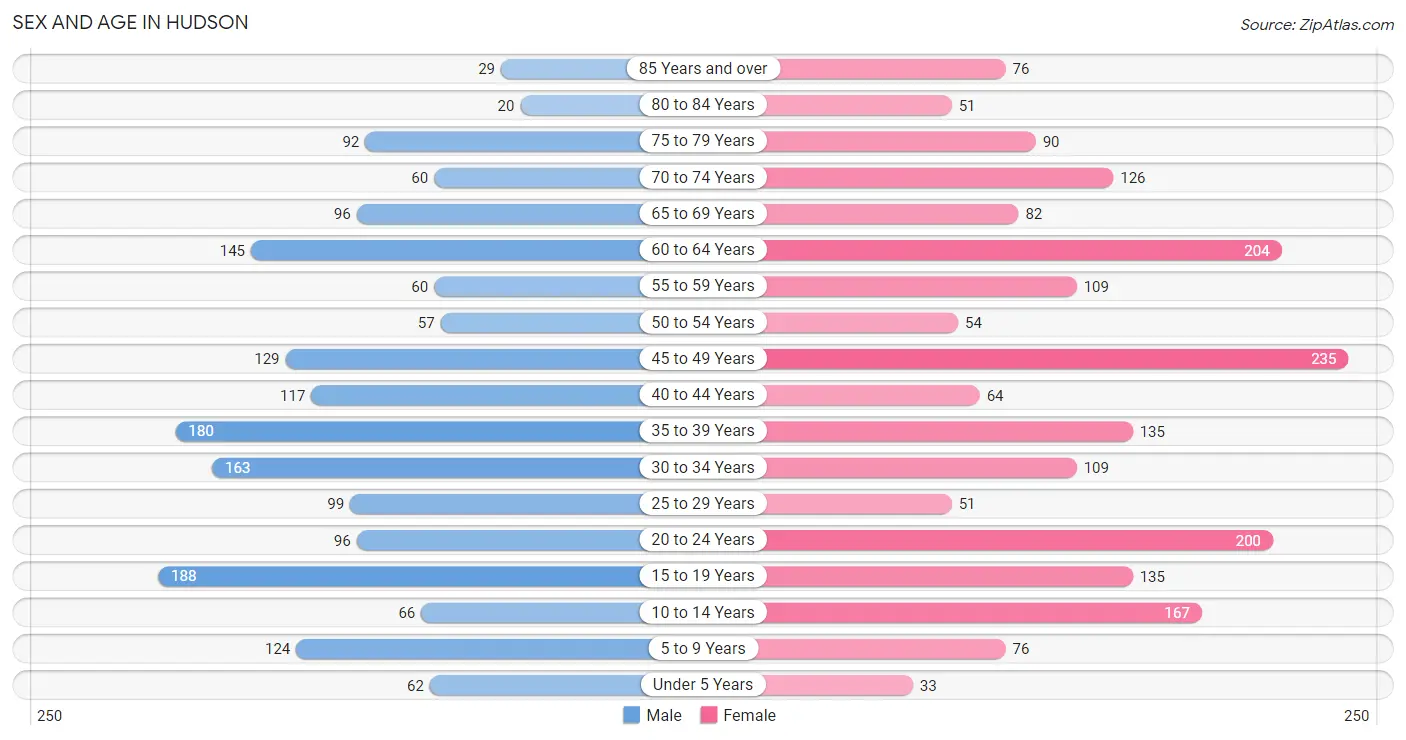
| Age Bracket | Male | Female |
| Under 5 Years | 62 (3.5%) | 33 (1.7%) |
| 5 to 9 Years | 124 (7.0%) | 76 (3.8%) |
| 10 to 14 Years | 66 (3.7%) | 167 (8.4%) |
| 15 to 19 Years | 188 (10.5%) | 135 (6.8%) |
| 20 to 24 Years | 96 (5.4%) | 200 (10.0%) |
| 25 to 29 Years | 99 (5.6%) | 51 (2.5%) |
| 30 to 34 Years | 163 (9.1%) | 109 (5.5%) |
| 35 to 39 Years | 180 (10.1%) | 135 (6.8%) |
| 40 to 44 Years | 117 (6.6%) | 64 (3.2%) |
| 45 to 49 Years | 129 (7.2%) | 235 (11.8%) |
| 50 to 54 Years | 57 (3.2%) | 54 (2.7%) |
| 55 to 59 Years | 60 (3.4%) | 109 (5.5%) |
| 60 to 64 Years | 145 (8.1%) | 204 (10.2%) |
| 65 to 69 Years | 96 (5.4%) | 82 (4.1%) |
| 70 to 74 Years | 60 (3.4%) | 126 (6.3%) |
| 75 to 79 Years | 92 (5.2%) | 90 (4.5%) |
| 80 to 84 Years | 20 (1.1%) | 51 (2.5%) |
| 85 Years and over | 29 (1.6%) | 76 (3.8%) |
| Total | 1,783 (100.0%) | 1,997 (100.0%) |
Families and Households in Hudson
Median Family Size in Hudson
The median family size in Hudson is 3.06 persons per family, with married-couple families (611 | 57.0%) accounting for the largest median family size of 3.17 persons per family. On the other hand, single female/mother families (403 | 37.6%) represent the smallest median family size with 2.88 persons per family.
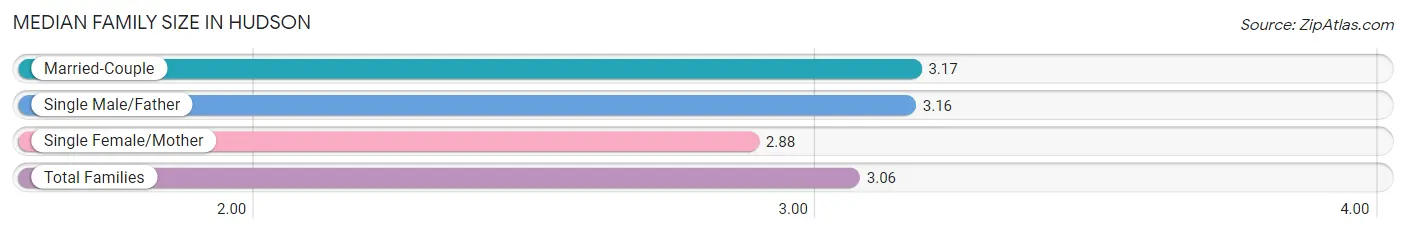
| Family Type | # Families | Family Size |
| Married-Couple | 611 (57.0%) | 3.17 |
| Single Male/Father | 58 (5.4%) | 3.16 |
| Single Female/Mother | 403 (37.6%) | 2.88 |
| Total Families | 1,072 (100.0%) | 3.06 |
Median Household Size in Hudson
The median household size in Hudson is 2.54 persons per household, with married-couple households (611 | 41.2%) accounting for the largest median household size of 3.2 persons per household. non-family households (411 | 27.7%) represent the smallest median household size with 1.04 persons per household.
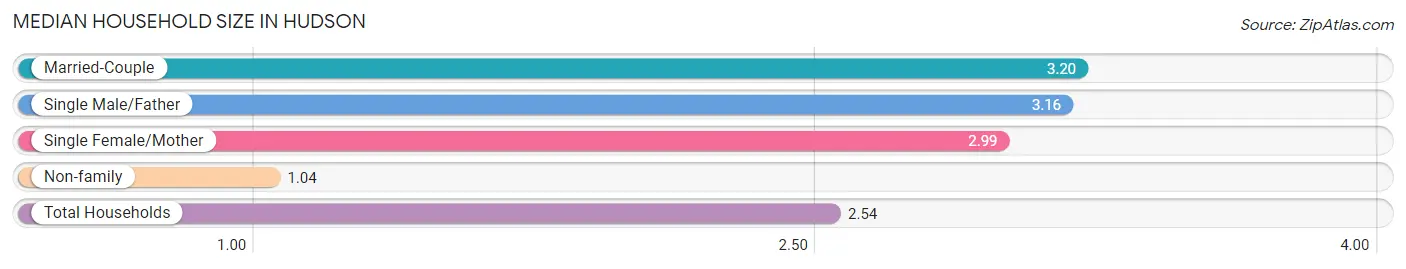
| Household Type | # Households | Household Size |
| Married-Couple | 611 (41.2%) | 3.20 |
| Single Male/Father | 58 (3.9%) | 3.16 |
| Single Female/Mother | 403 (27.2%) | 2.99 |
| Non-family | 411 (27.7%) | 1.04 |
| Total Households | 1,483 (100.0%) | 2.54 |
Household Size by Marriage Status in Hudson
Out of a total of 1,483 households in Hudson, 1,072 (72.3%) are family households, while 411 (27.7%) are nonfamily households. The most numerous type of family households are 2-person households, comprising 473, and the most common type of nonfamily households are 1-person households, comprising 398.
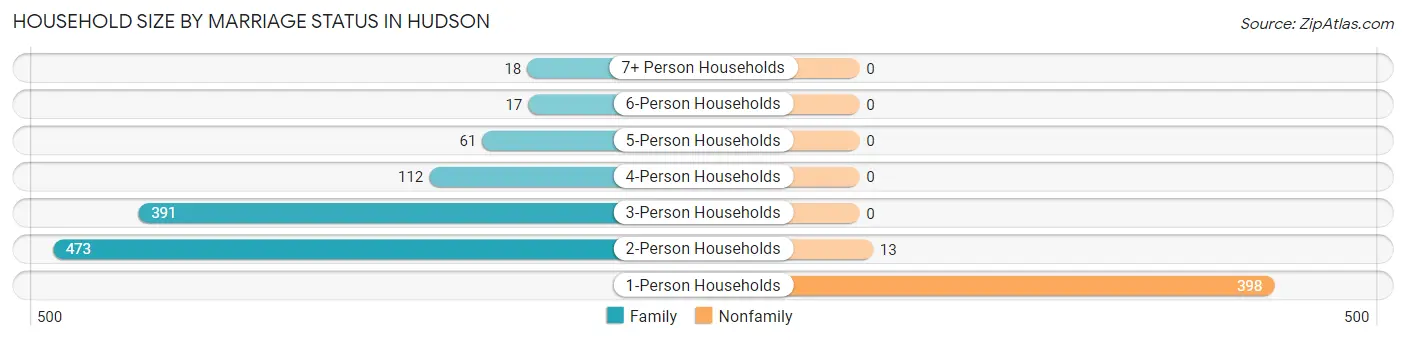
| Household Size | Family Households | Nonfamily Households |
| 1-Person Households | - | 398 (26.8%) |
| 2-Person Households | 473 (31.9%) | 13 (0.9%) |
| 3-Person Households | 391 (26.4%) | 0 (0.0%) |
| 4-Person Households | 112 (7.5%) | 0 (0.0%) |
| 5-Person Households | 61 (4.1%) | 0 (0.0%) |
| 6-Person Households | 17 (1.1%) | 0 (0.0%) |
| 7+ Person Households | 18 (1.2%) | 0 (0.0%) |
| Total | 1,072 (72.3%) | 411 (27.7%) |
Female Fertility in Hudson
Fertility by Age in Hudson
| Age Bracket | Women with Births | Births / 1,000 Women |
| 15 to 19 years | 0 (0.0%) | 0.0 |
| 20 to 34 years | 0 (0.0%) | 0.0 |
| 35 to 50 years | 0 (0.0%) | 0.0 |
| Total | 0 (0.0%) | 0.0 |
Fertility by Age by Marriage Status in Hudson
| Age Bracket | Married | Unmarried |
| 15 to 19 years | 0 (0.0%) | 0 (0.0%) |
| 20 to 34 years | 0 (0.0%) | 0 (0.0%) |
| 35 to 50 years | 0 (0.0%) | 0 (0.0%) |
| Total | 0 (0.0%) | 0 (0.0%) |
Fertility by Education in Hudson
| Educational Attainment | Women with Births | Births / 1,000 Women |
| Less than High School | 0 (0.0%) | 0.0 |
| High School Diploma | 0 (0.0%) | 0.0 |
| College or Associate's Degree | 0 (0.0%) | 0.0 |
| Bachelor's Degree | 0 (0.0%) | 0.0 |
| Graduate Degree | 0 (0.0%) | 0.0 |
| Total | 0 (0.0%) | 0.0 |
Fertility by Education by Marriage Status in Hudson
| Educational Attainment | Married | Unmarried |
| Less than High School | 0 (0.0%) | 0 (0.0%) |
| High School Diploma | 0 (0.0%) | 0 (0.0%) |
| College or Associate's Degree | 0 (0.0%) | 0 (0.0%) |
| Bachelor's Degree | 0 (0.0%) | 0 (0.0%) |
| Graduate Degree | 0 (0.0%) | 0 (0.0%) |
| Total | 0 (0.0%) | 0 (0.0%) |
Employment Characteristics in Hudson
Employment by Class of Employer in Hudson
Among the 1,813 employed individuals in Hudson, private company employees (1,381 | 76.2%), not-for-profit organizations (145 | 8.0%), and local government employees (83 | 4.6%) make up the most common classes of employment.
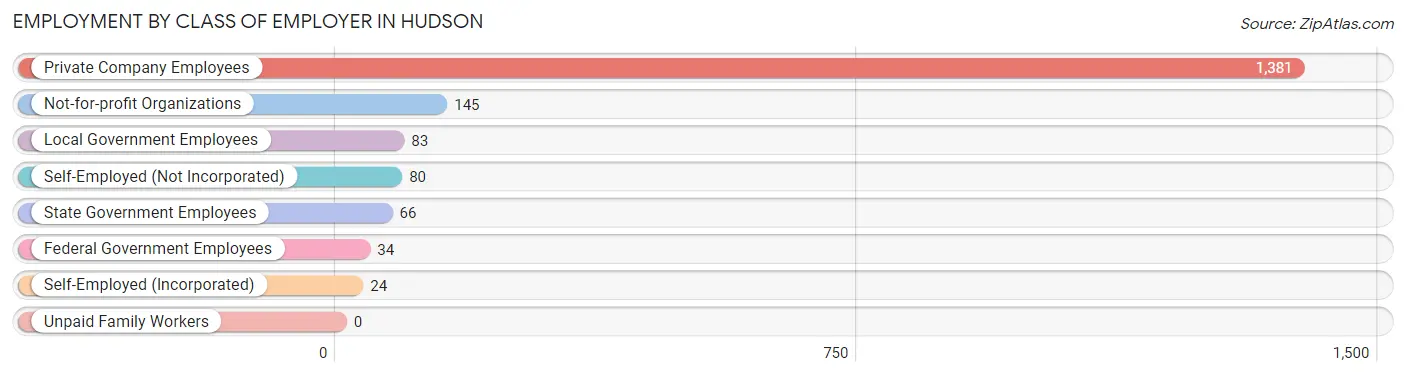
| Employer Class | # Employees | % Employees |
| Private Company Employees | 1,381 | 76.2% |
| Self-Employed (Incorporated) | 24 | 1.3% |
| Self-Employed (Not Incorporated) | 80 | 4.4% |
| Not-for-profit Organizations | 145 | 8.0% |
| Local Government Employees | 83 | 4.6% |
| State Government Employees | 66 | 3.6% |
| Federal Government Employees | 34 | 1.9% |
| Unpaid Family Workers | 0 | 0.0% |
| Total | 1,813 | 100.0% |
Employment Status by Age in Hudson
According to the labor force statistics for Hudson, out of the total population over 16 years of age (3,186), 61.0% or 1,943 individuals are in the labor force, with 6.2% or 120 of them unemployed. The age group with the highest labor force participation rate is 25 to 29 years, with 96.7% or 145 individuals in the labor force. Within the labor force, the 25 to 29 years age range has the highest percentage of unemployed individuals, with 23.4% or 34 of them being unemployed.
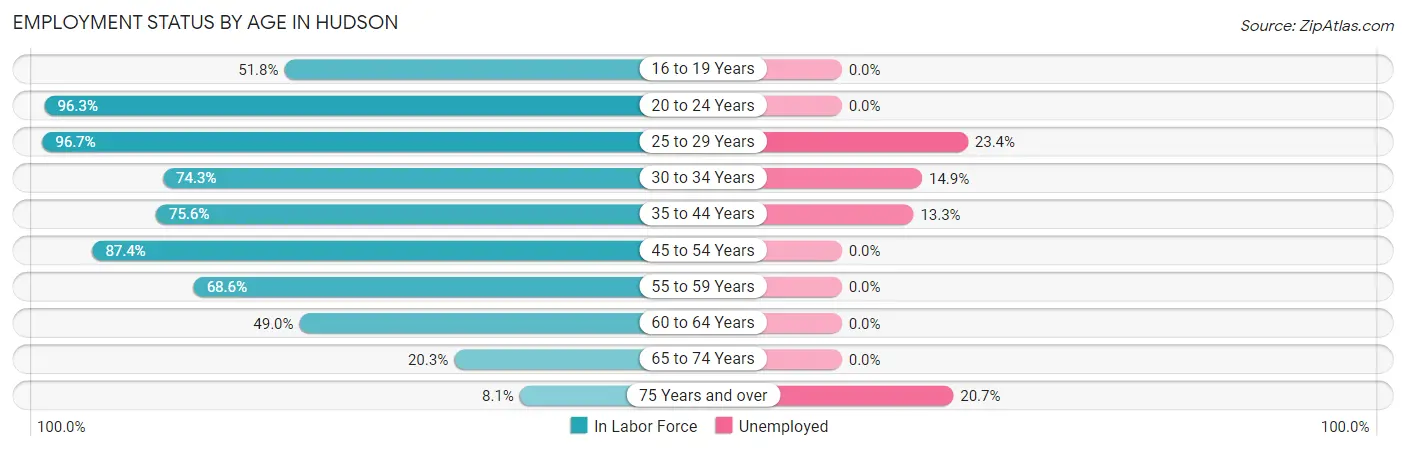
| Age Bracket | In Labor Force | Unemployed |
| 16 to 19 Years | 133 (51.8%) | 0 (0.0%) |
| 20 to 24 Years | 285 (96.3%) | 0 (0.0%) |
| 25 to 29 Years | 145 (96.7%) | 34 (23.4%) |
| 30 to 34 Years | 202 (74.3%) | 30 (14.9%) |
| 35 to 44 Years | 375 (75.6%) | 50 (13.3%) |
| 45 to 54 Years | 415 (87.4%) | 0 (0.0%) |
| 55 to 59 Years | 116 (68.6%) | 0 (0.0%) |
| 60 to 64 Years | 171 (49.0%) | 0 (0.0%) |
| 65 to 74 Years | 74 (20.3%) | 0 (0.0%) |
| 75 Years and over | 29 (8.1%) | 6 (20.7%) |
| Total | 1,943 (61.0%) | 120 (6.2%) |
Employment Status by Educational Attainment in Hudson
According to labor force statistics for Hudson, 74.5% of individuals (1,424) out of the total population between 25 and 64 years of age (1,911) are in the labor force, with 8.0% or 114 of them being unemployed. The group with the highest labor force participation rate are those with the educational attainment of bachelor's degree or higher, with 88.0% or 380 individuals in the labor force. Within the labor force, individuals with high school diploma education have the highest percentage of unemployment, with 24.7% or 84 of them being unemployed.
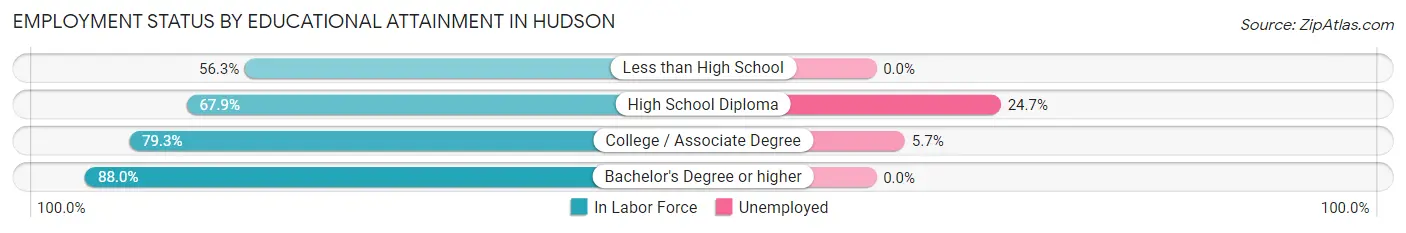
| Educational Attainment | In Labor Force | Unemployed |
| Less than High School | 175 (56.3%) | 0 (0.0%) |
| High School Diploma | 340 (67.9%) | 124 (24.7%) |
| College / Associate Degree | 529 (79.3%) | 38 (5.7%) |
| Bachelor's Degree or higher | 380 (88.0%) | 0 (0.0%) |
| Total | 1,424 (74.5%) | 153 (8.0%) |
Employment Occupations by Sex in Hudson
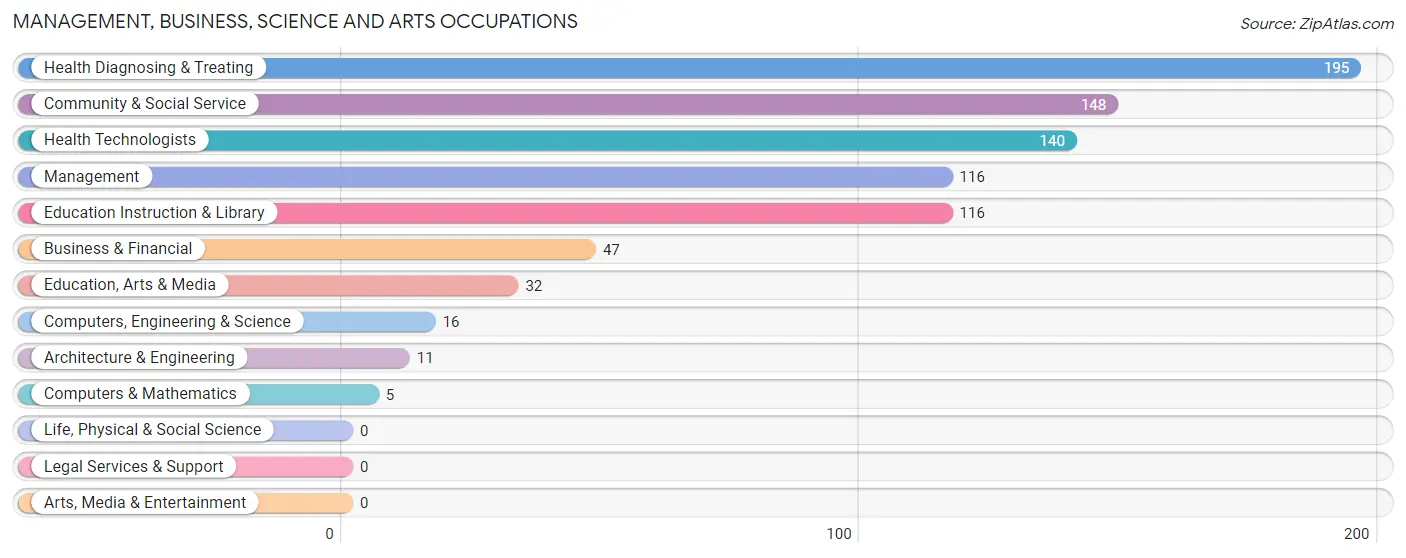
Management, Business, Science and Arts Occupations
The most common Management, Business, Science and Arts occupations in Hudson are Health Diagnosing & Treating (195 | 10.7%), Community & Social Service (148 | 8.1%), Health Technologists (140 | 7.7%), Management (116 | 6.4%), and Education Instruction & Library (116 | 6.4%).
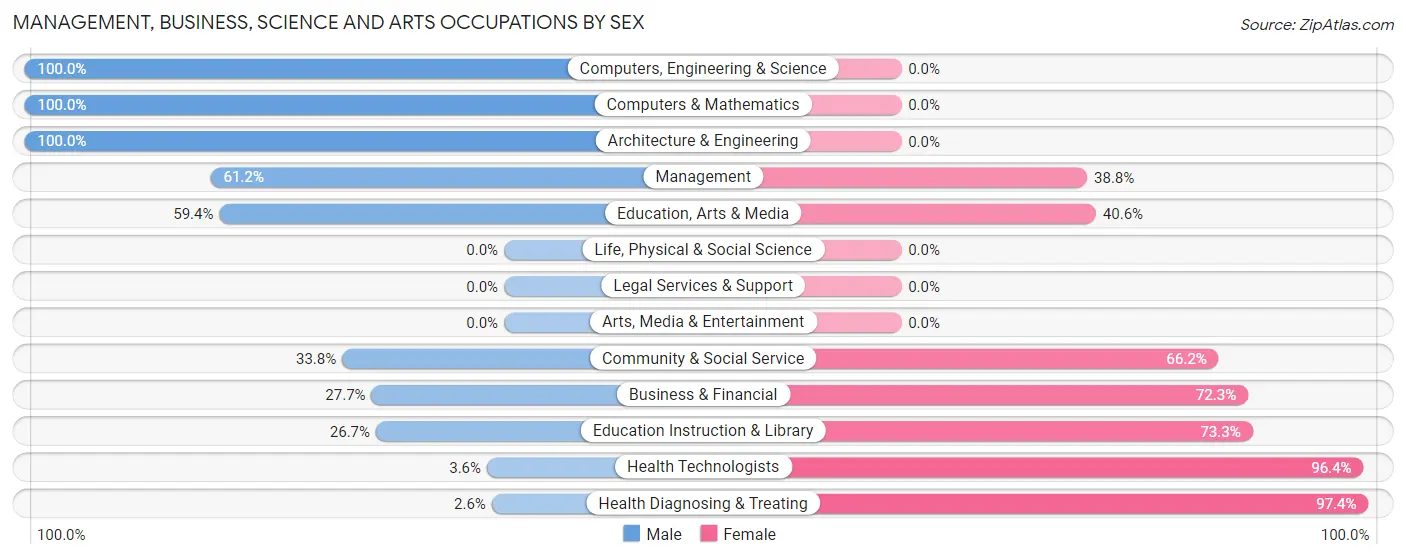
Management, Business, Science and Arts Occupations by Sex
Within the Management, Business, Science and Arts occupations in Hudson, the most male-oriented occupations are Computers, Engineering & Science (100.0%), Computers & Mathematics (100.0%), and Architecture & Engineering (100.0%), while the most female-oriented occupations are Health Diagnosing & Treating (97.4%), Health Technologists (96.4%), and Education Instruction & Library (73.3%).
| Occupation | Male | Female |
| Management | 71 (61.2%) | 45 (38.8%) |
| Business & Financial | 13 (27.7%) | 34 (72.3%) |
| Computers, Engineering & Science | 16 (100.0%) | 0 (0.0%) |
| Computers & Mathematics | 5 (100.0%) | 0 (0.0%) |
| Architecture & Engineering | 11 (100.0%) | 0 (0.0%) |
| Life, Physical & Social Science | 0 (0.0%) | 0 (0.0%) |
| Community & Social Service | 50 (33.8%) | 98 (66.2%) |
| Education, Arts & Media | 19 (59.4%) | 13 (40.6%) |
| Legal Services & Support | 0 (0.0%) | 0 (0.0%) |
| Education Instruction & Library | 31 (26.7%) | 85 (73.3%) |
| Arts, Media & Entertainment | 0 (0.0%) | 0 (0.0%) |
| Health Diagnosing & Treating | 5 (2.6%) | 190 (97.4%) |
| Health Technologists | 5 (3.6%) | 135 (96.4%) |
| Total (Category) | 155 (29.7%) | 367 (70.3%) |
| Total (Overall) | 847 (46.4%) | 978 (53.6%) |
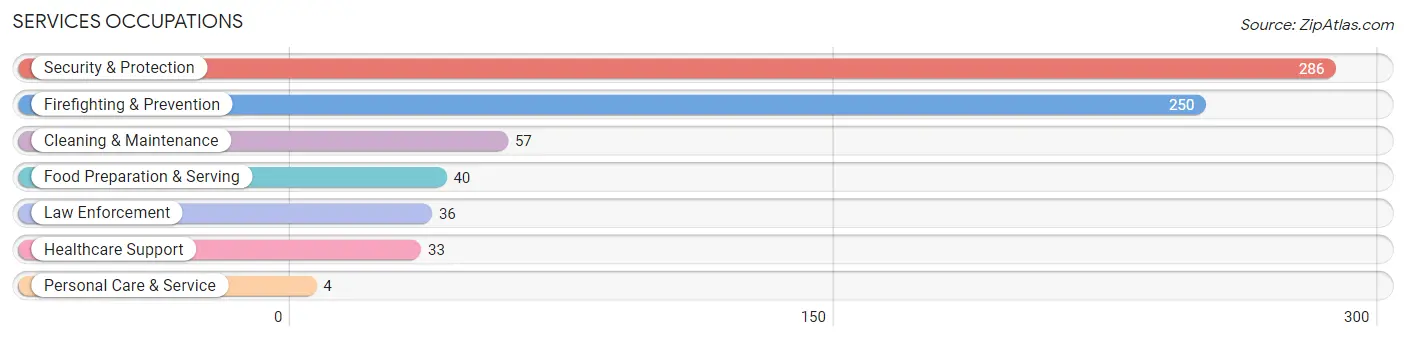
Services Occupations
The most common Services occupations in Hudson are Security & Protection (286 | 15.7%), Firefighting & Prevention (250 | 13.7%), Cleaning & Maintenance (57 | 3.1%), Food Preparation & Serving (40 | 2.2%), and Law Enforcement (36 | 2.0%).
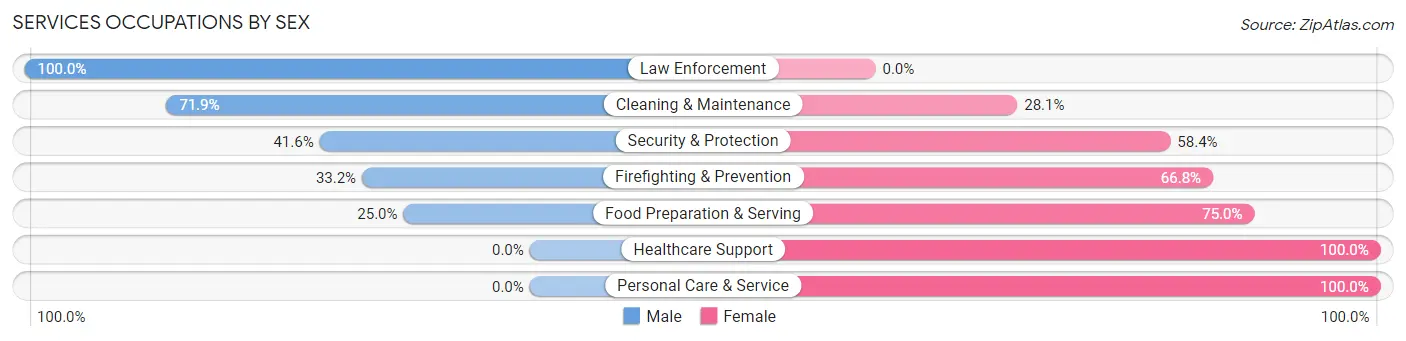
Services Occupations by Sex
Within the Services occupations in Hudson, the most male-oriented occupations are Law Enforcement (100.0%), Cleaning & Maintenance (71.9%), and Security & Protection (41.6%), while the most female-oriented occupations are Healthcare Support (100.0%), Personal Care & Service (100.0%), and Food Preparation & Serving (75.0%).
| Occupation | Male | Female |
| Healthcare Support | 0 (0.0%) | 33 (100.0%) |
| Security & Protection | 119 (41.6%) | 167 (58.4%) |
| Firefighting & Prevention | 83 (33.2%) | 167 (66.8%) |
| Law Enforcement | 36 (100.0%) | 0 (0.0%) |
| Food Preparation & Serving | 10 (25.0%) | 30 (75.0%) |
| Cleaning & Maintenance | 41 (71.9%) | 16 (28.1%) |
| Personal Care & Service | 0 (0.0%) | 4 (100.0%) |
| Total (Category) | 170 (40.5%) | 250 (59.5%) |
| Total (Overall) | 847 (46.4%) | 978 (53.6%) |
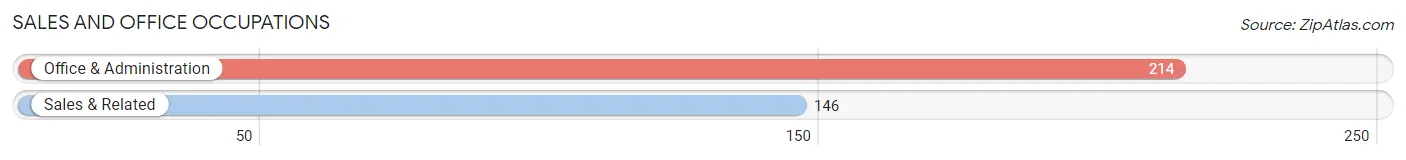
Sales and Office Occupations
The most common Sales and Office occupations in Hudson are Office & Administration (214 | 11.7%), and Sales & Related (146 | 8.0%).
Sales and Office Occupations by Sex
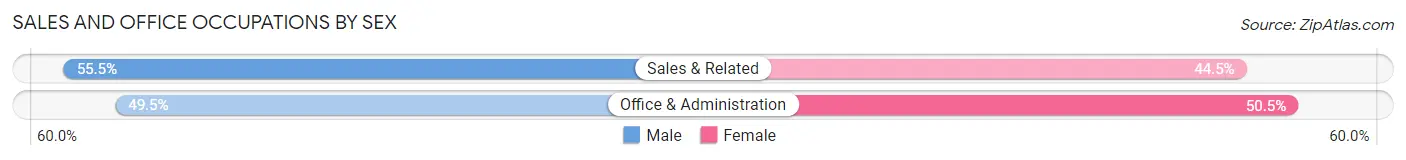
| Occupation | Male | Female |
| Sales & Related | 81 (55.5%) | 65 (44.5%) |
| Office & Administration | 106 (49.5%) | 108 (50.5%) |
| Total (Category) | 187 (51.9%) | 173 (48.1%) |
| Total (Overall) | 847 (46.4%) | 978 (53.6%) |
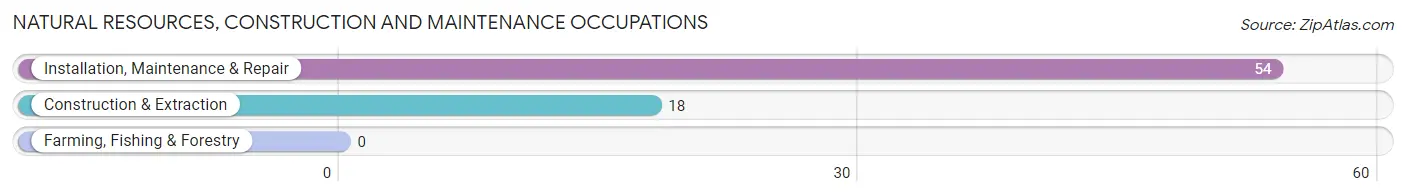
Natural Resources, Construction and Maintenance Occupations
The most common Natural Resources, Construction and Maintenance occupations in Hudson are Installation, Maintenance & Repair (54 | 3.0%), and Construction & Extraction (18 | 1.0%).
Natural Resources, Construction and Maintenance Occupations by Sex
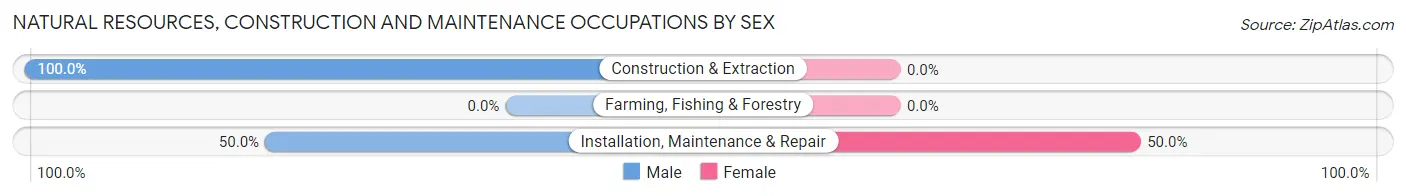
| Occupation | Male | Female |
| Farming, Fishing & Forestry | 0 (0.0%) | 0 (0.0%) |
| Construction & Extraction | 18 (100.0%) | 0 (0.0%) |
| Installation, Maintenance & Repair | 27 (50.0%) | 27 (50.0%) |
| Total (Category) | 45 (62.5%) | 27 (37.5%) |
| Total (Overall) | 847 (46.4%) | 978 (53.6%) |
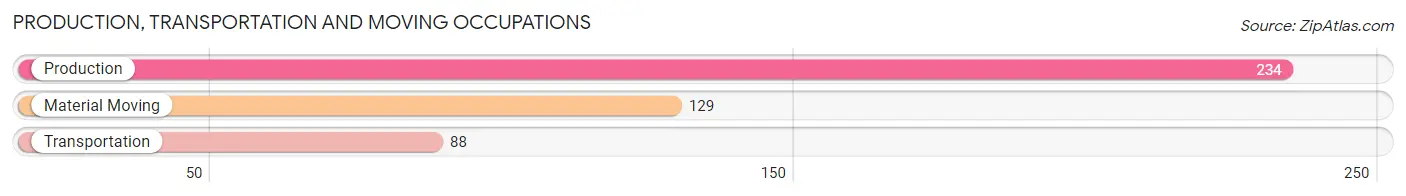
Production, Transportation and Moving Occupations
The most common Production, Transportation and Moving occupations in Hudson are Production (234 | 12.8%), Material Moving (129 | 7.1%), and Transportation (88 | 4.8%).
Production, Transportation and Moving Occupations by Sex
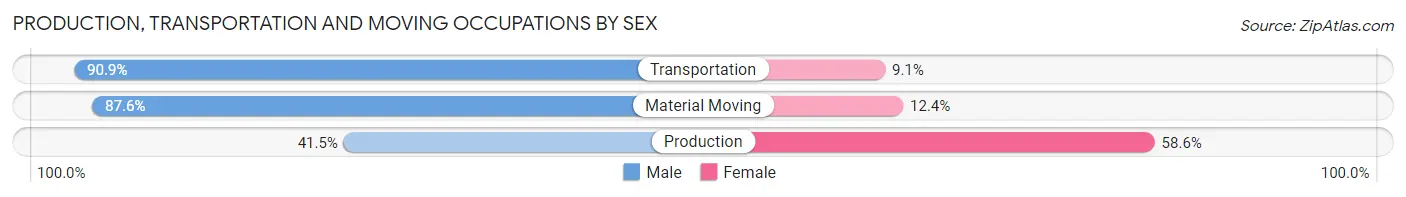
| Occupation | Male | Female |
| Production | 97 (41.4%) | 137 (58.6%) |
| Transportation | 80 (90.9%) | 8 (9.1%) |
| Material Moving | 113 (87.6%) | 16 (12.4%) |
| Total (Category) | 290 (64.3%) | 161 (35.7%) |
| Total (Overall) | 847 (46.4%) | 978 (53.6%) |
Employment Industries by Sex in Hudson
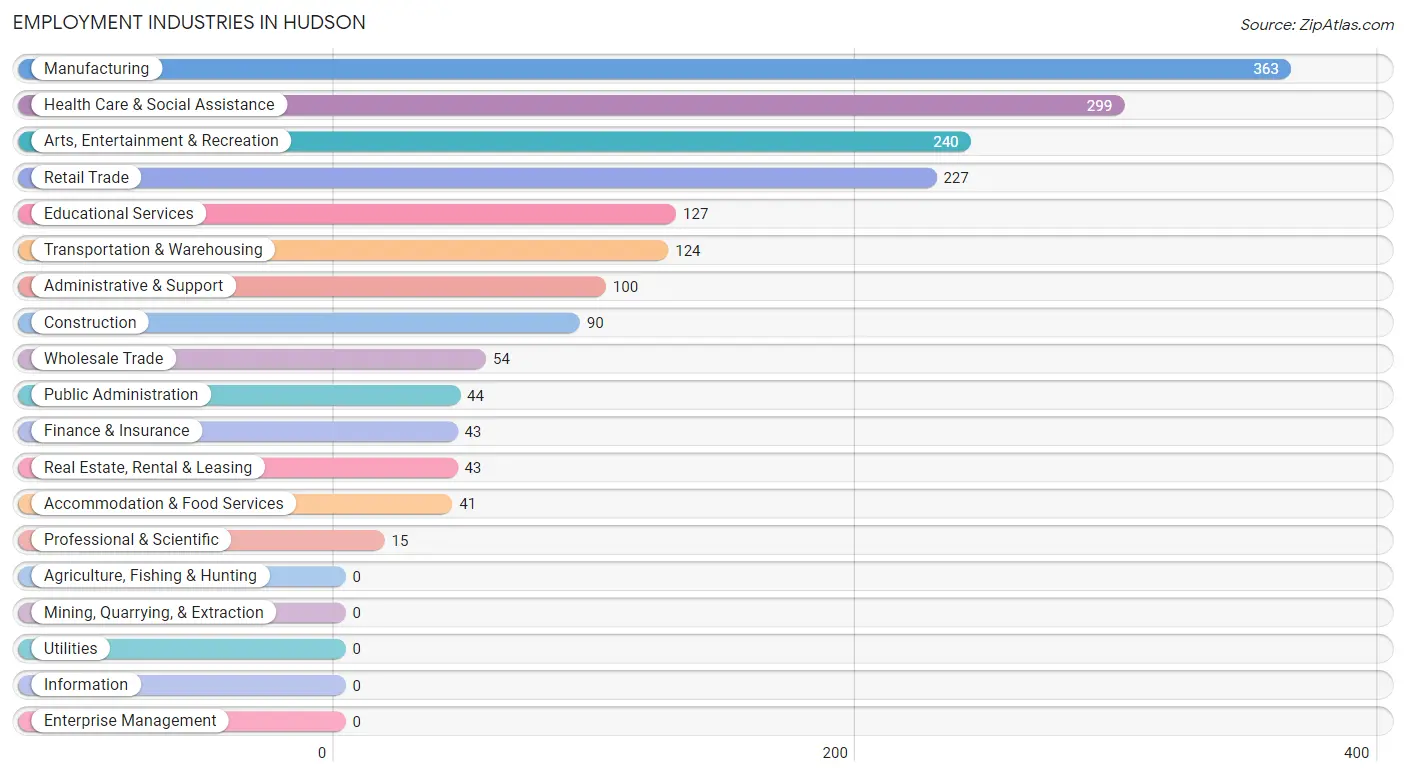
Employment Industries in Hudson
The major employment industries in Hudson include Manufacturing (363 | 19.9%), Health Care & Social Assistance (299 | 16.4%), Arts, Entertainment & Recreation (240 | 13.2%), Retail Trade (227 | 12.4%), and Educational Services (127 | 7.0%).
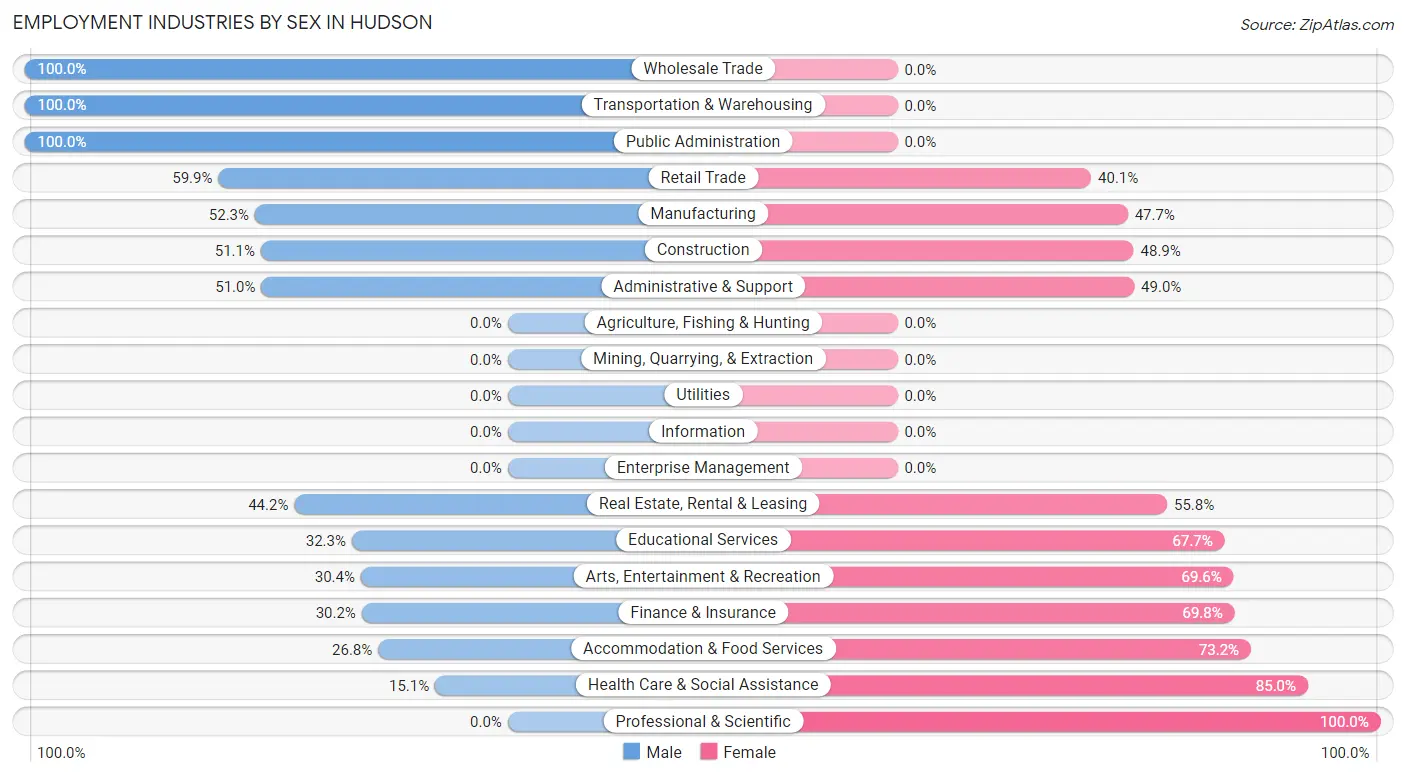
Employment Industries by Sex in Hudson
The Hudson industries that see more men than women are Wholesale Trade (100.0%), Transportation & Warehousing (100.0%), and Public Administration (100.0%), whereas the industries that tend to have a higher number of women are Professional & Scientific (100.0%), Health Care & Social Assistance (85.0%), and Accommodation & Food Services (73.2%).
| Industry | Male | Female |
| Agriculture, Fishing & Hunting | 0 (0.0%) | 0 (0.0%) |
| Mining, Quarrying, & Extraction | 0 (0.0%) | 0 (0.0%) |
| Construction | 46 (51.1%) | 44 (48.9%) |
| Manufacturing | 190 (52.3%) | 173 (47.7%) |
| Wholesale Trade | 54 (100.0%) | 0 (0.0%) |
| Retail Trade | 136 (59.9%) | 91 (40.1%) |
| Transportation & Warehousing | 124 (100.0%) | 0 (0.0%) |
| Utilities | 0 (0.0%) | 0 (0.0%) |
| Information | 0 (0.0%) | 0 (0.0%) |
| Finance & Insurance | 13 (30.2%) | 30 (69.8%) |
| Real Estate, Rental & Leasing | 19 (44.2%) | 24 (55.8%) |
| Professional & Scientific | 0 (0.0%) | 15 (100.0%) |
| Enterprise Management | 0 (0.0%) | 0 (0.0%) |
| Administrative & Support | 51 (51.0%) | 49 (49.0%) |
| Educational Services | 41 (32.3%) | 86 (67.7%) |
| Health Care & Social Assistance | 45 (15.0%) | 254 (85.0%) |
| Arts, Entertainment & Recreation | 73 (30.4%) | 167 (69.6%) |
| Accommodation & Food Services | 11 (26.8%) | 30 (73.2%) |
| Public Administration | 44 (100.0%) | 0 (0.0%) |
| Total | 847 (46.4%) | 978 (53.6%) |
Education in Hudson
School Enrollment in Hudson
The most common levels of schooling among the 1,014 students in Hudson are college / undergraduate (371 | 36.6%), high school (261 | 25.7%), and middle school (174 | 17.2%).
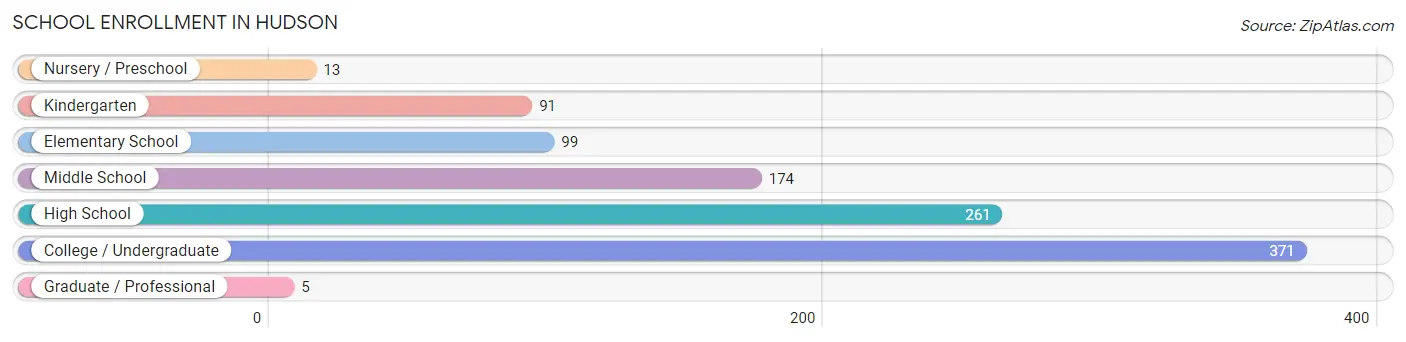
| School Level | # Students | % Students |
| Nursery / Preschool | 13 | 1.3% |
| Kindergarten | 91 | 9.0% |
| Elementary School | 99 | 9.8% |
| Middle School | 174 | 17.2% |
| High School | 261 | 25.7% |
| College / Undergraduate | 371 | 36.6% |
| Graduate / Professional | 5 | 0.5% |
| Total | 1,014 | 100.0% |
School Enrollment by Age by Funding Source in Hudson
Out of a total of 1,014 students who are enrolled in schools in Hudson, 242 (23.9%) attend a private institution, while the remaining 772 (76.1%) are enrolled in public schools. The age group of 20 to 24 year olds has the highest likelihood of being enrolled in private schools, with 182 (90.1% in the age bracket) enrolled. Conversely, the age group of 10 to 14 year olds has the lowest likelihood of being enrolled in a private school, with 233 (100.0% in the age bracket) attending a public institution.
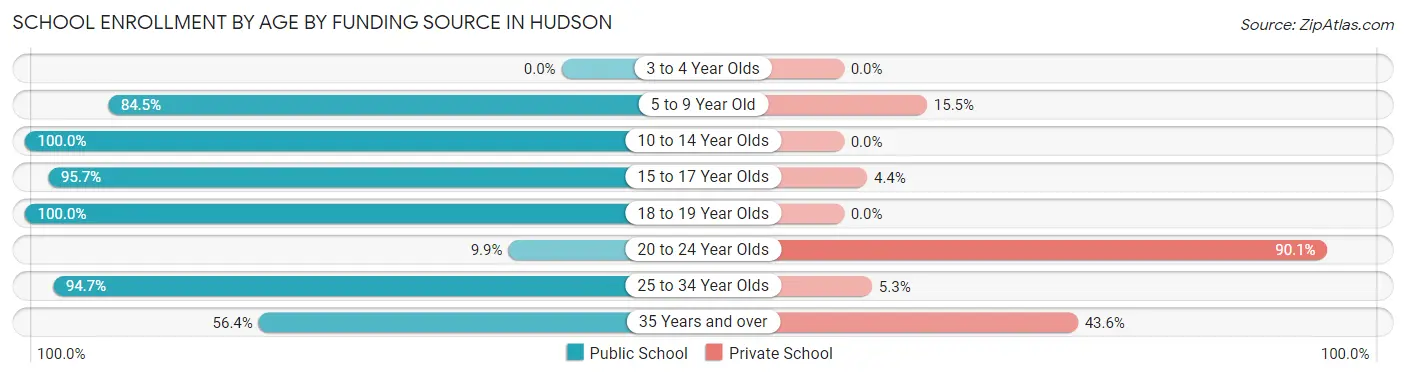
| Age Bracket | Public School | Private School |
| 3 to 4 Year Olds | 0 (0.0%) | 0 (0.0%) |
| 5 to 9 Year Old | 169 (84.5%) | 31 (15.5%) |
| 10 to 14 Year Olds | 233 (100.0%) | 0 (0.0%) |
| 15 to 17 Year Olds | 176 (95.7%) | 8 (4.3%) |
| 18 to 19 Year Olds | 80 (100.0%) | 0 (0.0%) |
| 20 to 24 Year Olds | 20 (9.9%) | 182 (90.1%) |
| 25 to 34 Year Olds | 72 (94.7%) | 4 (5.3%) |
| 35 Years and over | 22 (56.4%) | 17 (43.6%) |
| Total | 772 (76.1%) | 242 (23.9%) |
Educational Attainment by Field of Study in Hudson
Science & technology (149 | 25.7%), education (111 | 19.1%), business (86 | 14.8%), psychology (52 | 9.0%), and arts & humanities (47 | 8.1%) are the most common fields of study among 580 individuals in Hudson who have obtained a bachelor's degree or higher.
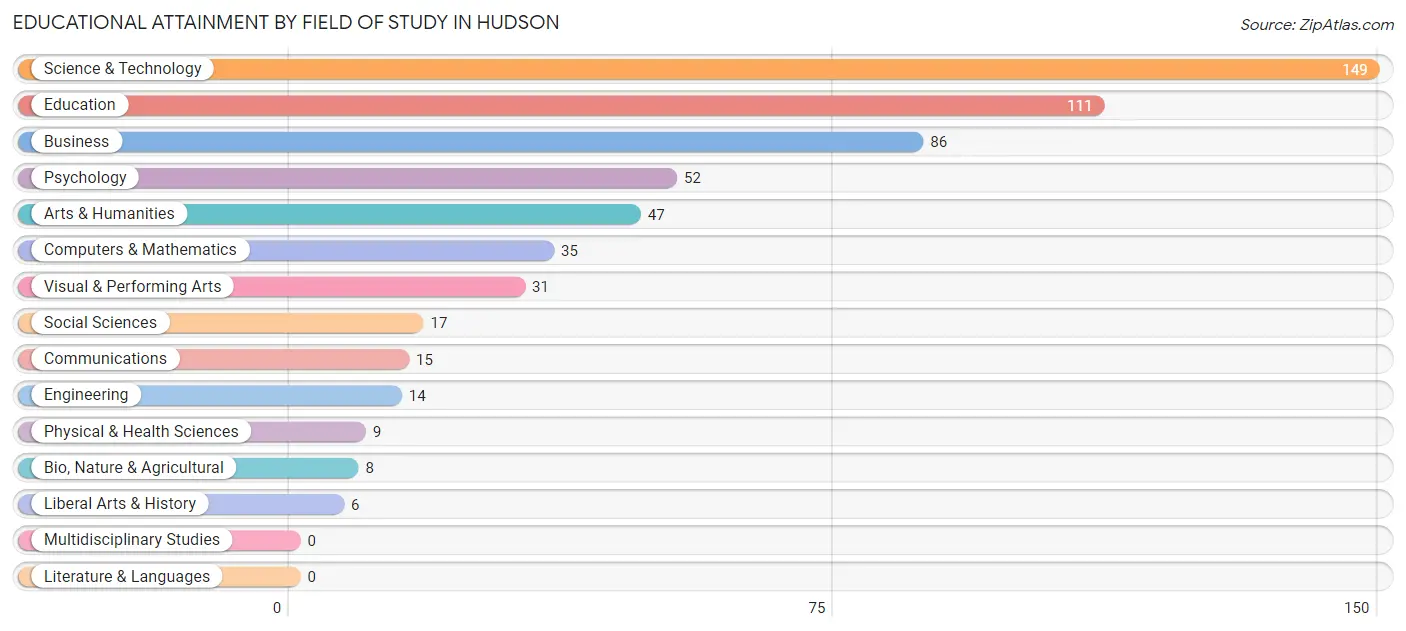
| Field of Study | # Graduates | % Graduates |
| Computers & Mathematics | 35 | 6.0% |
| Bio, Nature & Agricultural | 8 | 1.4% |
| Physical & Health Sciences | 9 | 1.5% |
| Psychology | 52 | 9.0% |
| Social Sciences | 17 | 2.9% |
| Engineering | 14 | 2.4% |
| Multidisciplinary Studies | 0 | 0.0% |
| Science & Technology | 149 | 25.7% |
| Business | 86 | 14.8% |
| Education | 111 | 19.1% |
| Literature & Languages | 0 | 0.0% |
| Liberal Arts & History | 6 | 1.0% |
| Visual & Performing Arts | 31 | 5.3% |
| Communications | 15 | 2.6% |
| Arts & Humanities | 47 | 8.1% |
| Total | 580 | 100.0% |
Transportation & Commute in Hudson
Vehicle Availability by Sex in Hudson
The most prevalent vehicle ownership categories in Hudson are males with 2 vehicles (308, accounting for 36.4%) and females with 2 vehicles (306, making up 31.9%).
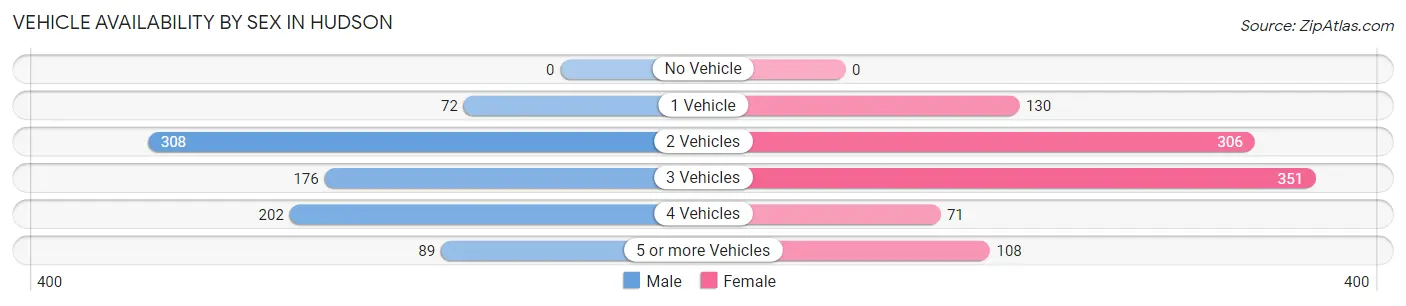
| Vehicles Available | Male | Female |
| No Vehicle | 0 (0.0%) | 0 (0.0%) |
| 1 Vehicle | 72 (8.5%) | 130 (13.5%) |
| 2 Vehicles | 308 (36.4%) | 306 (31.7%) |
| 3 Vehicles | 176 (20.8%) | 351 (36.3%) |
| 4 Vehicles | 202 (23.8%) | 71 (7.3%) |
| 5 or more Vehicles | 89 (10.5%) | 108 (11.2%) |
| Total | 847 (100.0%) | 966 (100.0%) |
Commute Time in Hudson
The most frequently occuring commute durations in Hudson are 10 to 14 minutes (431 commuters, 24.6%), 30 to 34 minutes (366 commuters, 20.9%), and 15 to 19 minutes (289 commuters, 16.5%).
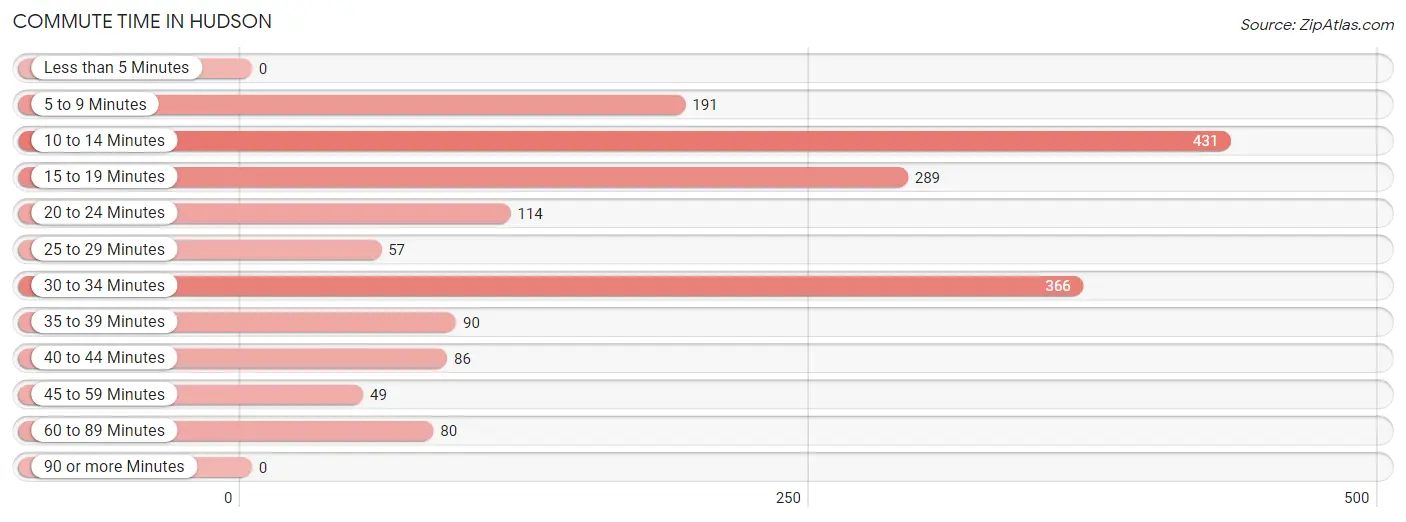
| Commute Time | # Commuters | % Commuters |
| Less than 5 Minutes | 0 | 0.0% |
| 5 to 9 Minutes | 191 | 10.9% |
| 10 to 14 Minutes | 431 | 24.6% |
| 15 to 19 Minutes | 289 | 16.5% |
| 20 to 24 Minutes | 114 | 6.5% |
| 25 to 29 Minutes | 57 | 3.3% |
| 30 to 34 Minutes | 366 | 20.9% |
| 35 to 39 Minutes | 90 | 5.1% |
| 40 to 44 Minutes | 86 | 4.9% |
| 45 to 59 Minutes | 49 | 2.8% |
| 60 to 89 Minutes | 80 | 4.6% |
| 90 or more Minutes | 0 | 0.0% |
Commute Time by Sex in Hudson
The most common commute times in Hudson are 10 to 14 minutes (190 commuters, 22.8%) for males and 10 to 14 minutes (241 commuters, 26.2%) for females.
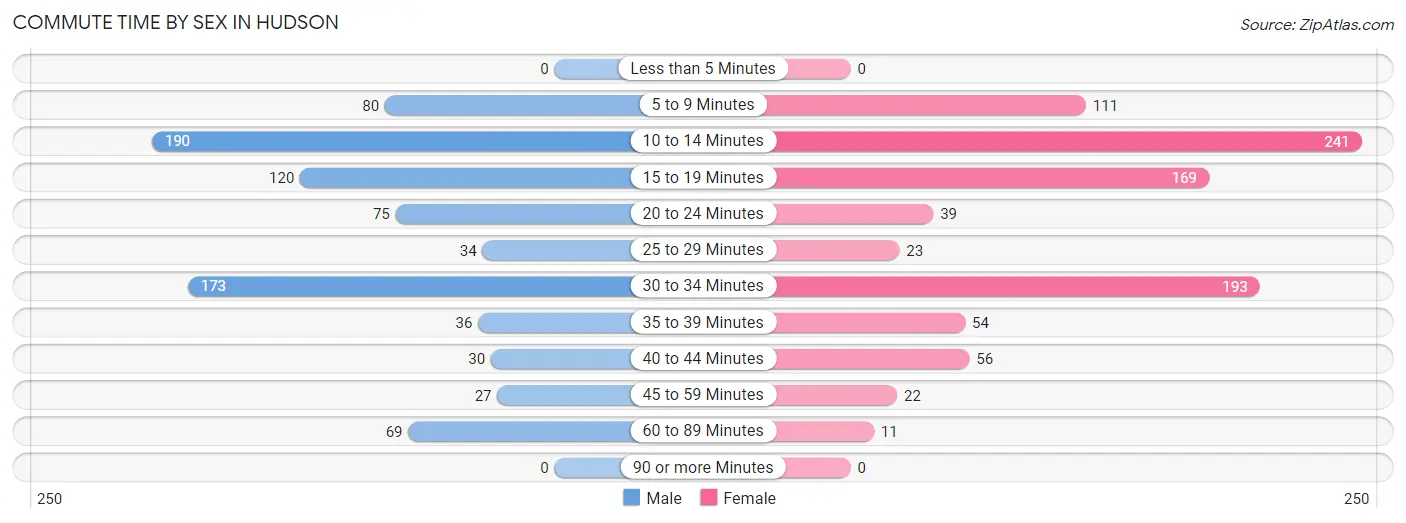
| Commute Time | Male | Female |
| Less than 5 Minutes | 0 (0.0%) | 0 (0.0%) |
| 5 to 9 Minutes | 80 (9.6%) | 111 (12.1%) |
| 10 to 14 Minutes | 190 (22.8%) | 241 (26.2%) |
| 15 to 19 Minutes | 120 (14.4%) | 169 (18.4%) |
| 20 to 24 Minutes | 75 (9.0%) | 39 (4.2%) |
| 25 to 29 Minutes | 34 (4.1%) | 23 (2.5%) |
| 30 to 34 Minutes | 173 (20.7%) | 193 (21.0%) |
| 35 to 39 Minutes | 36 (4.3%) | 54 (5.9%) |
| 40 to 44 Minutes | 30 (3.6%) | 56 (6.1%) |
| 45 to 59 Minutes | 27 (3.2%) | 22 (2.4%) |
| 60 to 89 Minutes | 69 (8.3%) | 11 (1.2%) |
| 90 or more Minutes | 0 (0.0%) | 0 (0.0%) |
Time of Departure to Work by Sex in Hudson
The most frequent times of departure to work in Hudson are 5:00 AM to 5:29 AM (156, 18.7%) for males and 12:00 PM to 3:59 PM (211, 23.0%) for females.
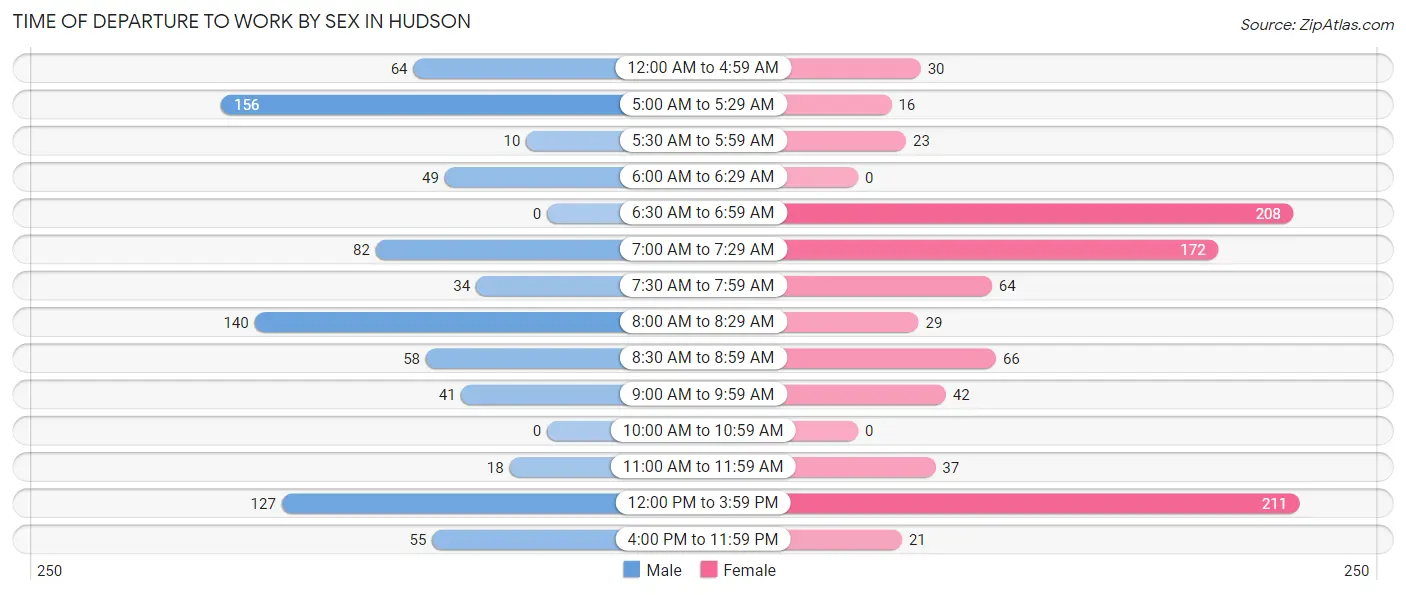
| Time of Departure | Male | Female |
| 12:00 AM to 4:59 AM | 64 (7.7%) | 30 (3.3%) |
| 5:00 AM to 5:29 AM | 156 (18.7%) | 16 (1.7%) |
| 5:30 AM to 5:59 AM | 10 (1.2%) | 23 (2.5%) |
| 6:00 AM to 6:29 AM | 49 (5.9%) | 0 (0.0%) |
| 6:30 AM to 6:59 AM | 0 (0.0%) | 208 (22.6%) |
| 7:00 AM to 7:29 AM | 82 (9.8%) | 172 (18.7%) |
| 7:30 AM to 7:59 AM | 34 (4.1%) | 64 (7.0%) |
| 8:00 AM to 8:29 AM | 140 (16.8%) | 29 (3.2%) |
| 8:30 AM to 8:59 AM | 58 (7.0%) | 66 (7.2%) |
| 9:00 AM to 9:59 AM | 41 (4.9%) | 42 (4.6%) |
| 10:00 AM to 10:59 AM | 0 (0.0%) | 0 (0.0%) |
| 11:00 AM to 11:59 AM | 18 (2.2%) | 37 (4.0%) |
| 12:00 PM to 3:59 PM | 127 (15.2%) | 211 (23.0%) |
| 4:00 PM to 11:59 PM | 55 (6.6%) | 21 (2.3%) |
| Total | 834 (100.0%) | 919 (100.0%) |
Housing Occupancy in Hudson
Occupancy by Ownership in Hudson
Of the total 1,483 dwellings in Hudson, owner-occupied units account for 1,142 (77.0%), while renter-occupied units make up 341 (23.0%).
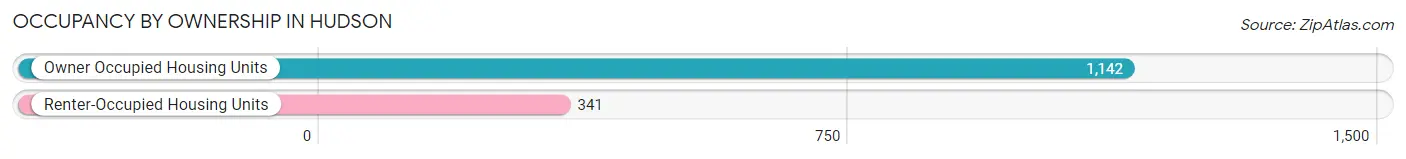
| Occupancy | # Housing Units | % Housing Units |
| Owner Occupied Housing Units | 1,142 | 77.0% |
| Renter-Occupied Housing Units | 341 | 23.0% |
| Total Occupied Housing Units | 1,483 | 100.0% |
Occupancy by Household Size in Hudson
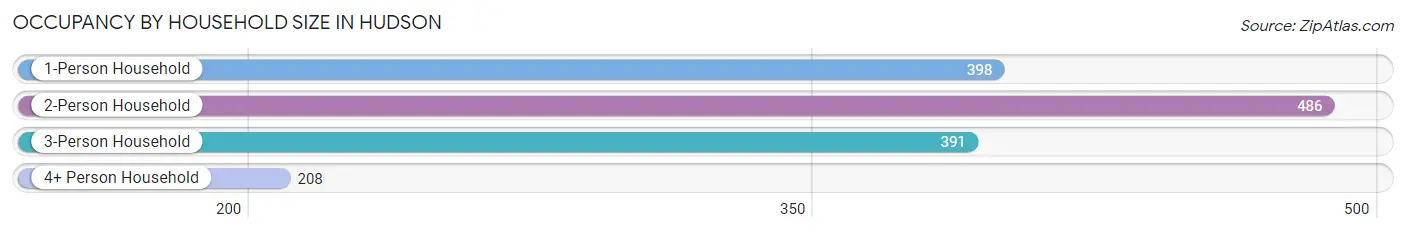
| Household Size | # Housing Units | % Housing Units |
| 1-Person Household | 398 | 26.8% |
| 2-Person Household | 486 | 32.8% |
| 3-Person Household | 391 | 26.4% |
| 4+ Person Household | 208 | 14.0% |
| Total Housing Units | 1,483 | 100.0% |
Occupancy by Ownership by Household Size in Hudson
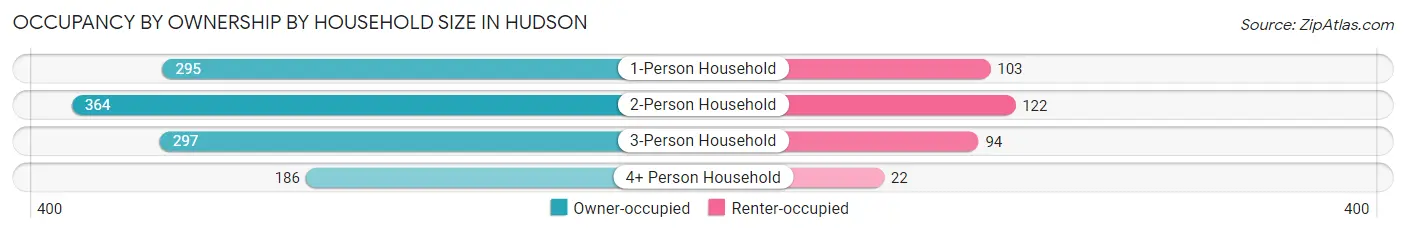
| Household Size | Owner-occupied | Renter-occupied |
| 1-Person Household | 295 (74.1%) | 103 (25.9%) |
| 2-Person Household | 364 (74.9%) | 122 (25.1%) |
| 3-Person Household | 297 (76.0%) | 94 (24.0%) |
| 4+ Person Household | 186 (89.4%) | 22 (10.6%) |
| Total Housing Units | 1,142 (77.0%) | 341 (23.0%) |
Occupancy by Educational Attainment in Hudson
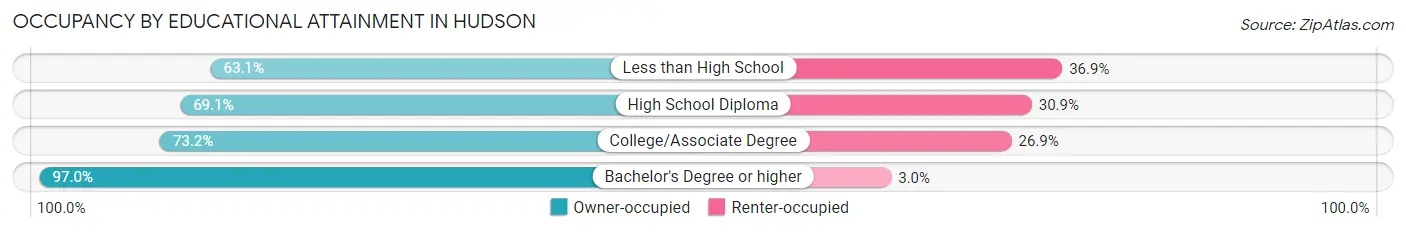
| Household Size | Owner-occupied | Renter-occupied |
| Less than High School | 130 (63.1%) | 76 (36.9%) |
| High School Diploma | 307 (69.1%) | 137 (30.9%) |
| College/Associate Degree | 316 (73.2%) | 116 (26.9%) |
| Bachelor's Degree or higher | 389 (97.0%) | 12 (3.0%) |
Occupancy by Age of Householder in Hudson
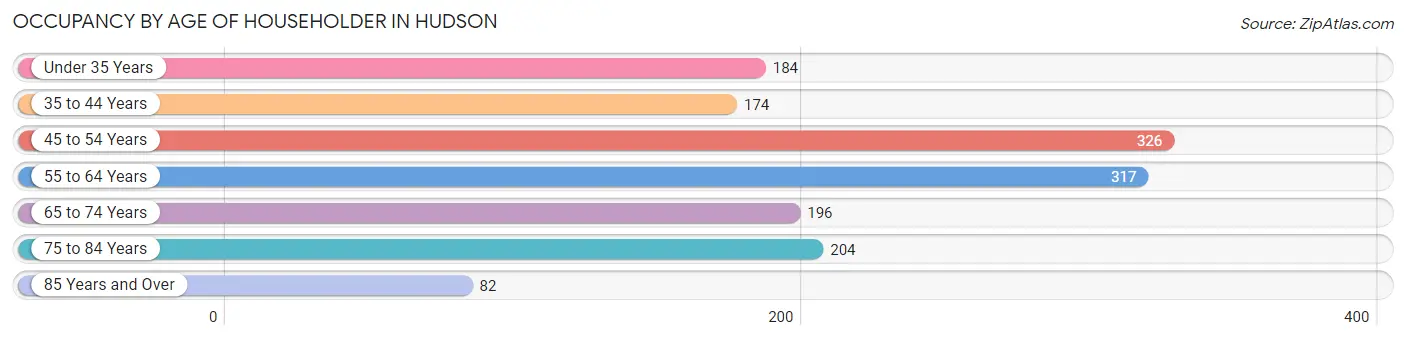
| Age Bracket | # Households | % Households |
| Under 35 Years | 184 | 12.4% |
| 35 to 44 Years | 174 | 11.7% |
| 45 to 54 Years | 326 | 22.0% |
| 55 to 64 Years | 317 | 21.4% |
| 65 to 74 Years | 196 | 13.2% |
| 75 to 84 Years | 204 | 13.8% |
| 85 Years and Over | 82 | 5.5% |
| Total | 1,483 | 100.0% |
Housing Finances in Hudson
Median Income by Occupancy in Hudson
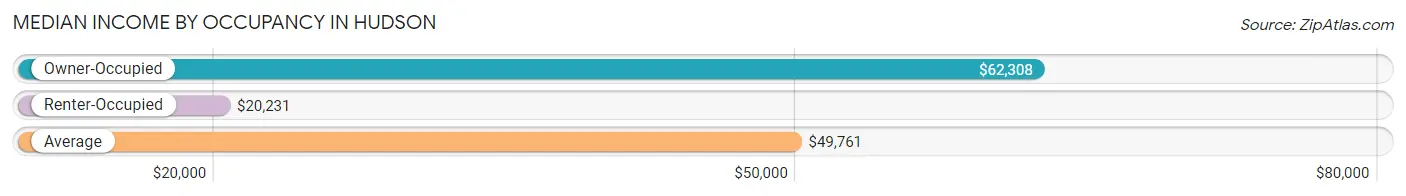
| Occupancy Type | # Households | Median Income |
| Owner-Occupied | 1,142 (77.0%) | $62,308 |
| Renter-Occupied | 341 (23.0%) | $20,231 |
| Average | 1,483 (100.0%) | $49,761 |
Occupancy by Householder Income Bracket in Hudson
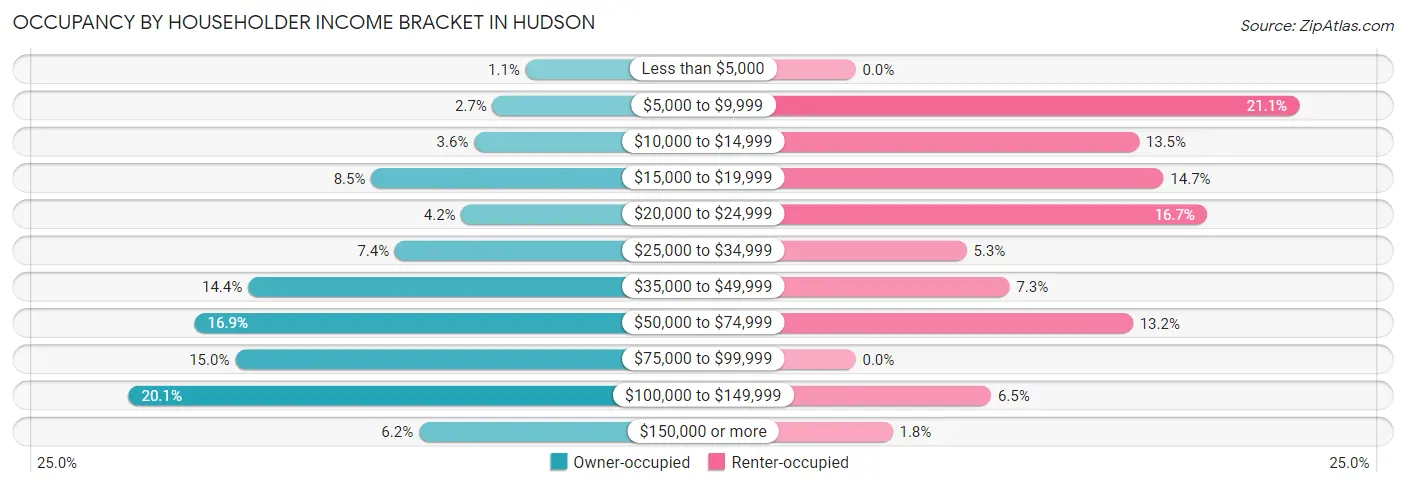
| Income Bracket | Owner-occupied | Renter-occupied |
| Less than $5,000 | 13 (1.1%) | 0 (0.0%) |
| $5,000 to $9,999 | 31 (2.7%) | 72 (21.1%) |
| $10,000 to $14,999 | 41 (3.6%) | 46 (13.5%) |
| $15,000 to $19,999 | 97 (8.5%) | 50 (14.7%) |
| $20,000 to $24,999 | 48 (4.2%) | 57 (16.7%) |
| $25,000 to $34,999 | 84 (7.4%) | 18 (5.3%) |
| $35,000 to $49,999 | 164 (14.4%) | 25 (7.3%) |
| $50,000 to $74,999 | 193 (16.9%) | 45 (13.2%) |
| $75,000 to $99,999 | 171 (15.0%) | 0 (0.0%) |
| $100,000 to $149,999 | 229 (20.1%) | 22 (6.5%) |
| $150,000 or more | 71 (6.2%) | 6 (1.8%) |
| Total | 1,142 (100.0%) | 341 (100.0%) |
Monthly Housing Cost Tiers in Hudson
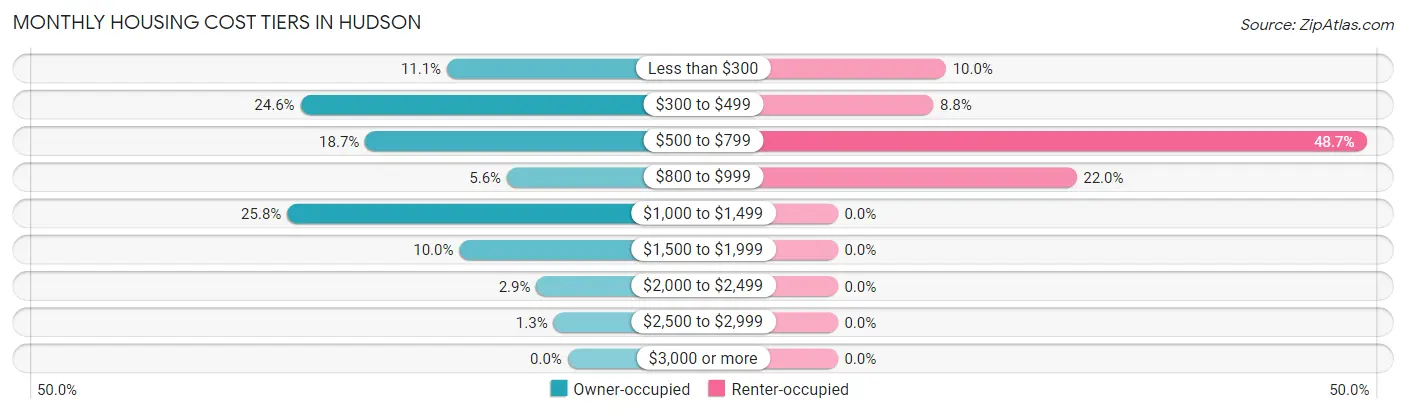
| Monthly Cost | Owner-occupied | Renter-occupied |
| Less than $300 | 127 (11.1%) | 34 (10.0%) |
| $300 to $499 | 281 (24.6%) | 30 (8.8%) |
| $500 to $799 | 213 (18.6%) | 166 (48.7%) |
| $800 to $999 | 64 (5.6%) | 75 (22.0%) |
| $1,000 to $1,499 | 295 (25.8%) | 0 (0.0%) |
| $1,500 to $1,999 | 114 (10.0%) | 0 (0.0%) |
| $2,000 to $2,499 | 33 (2.9%) | 0 (0.0%) |
| $2,500 to $2,999 | 15 (1.3%) | 0 (0.0%) |
| $3,000 or more | 0 (0.0%) | 0 (0.0%) |
| Total | 1,142 (100.0%) | 341 (100.0%) |
Physical Housing Characteristics in Hudson
Housing Structures in Hudson
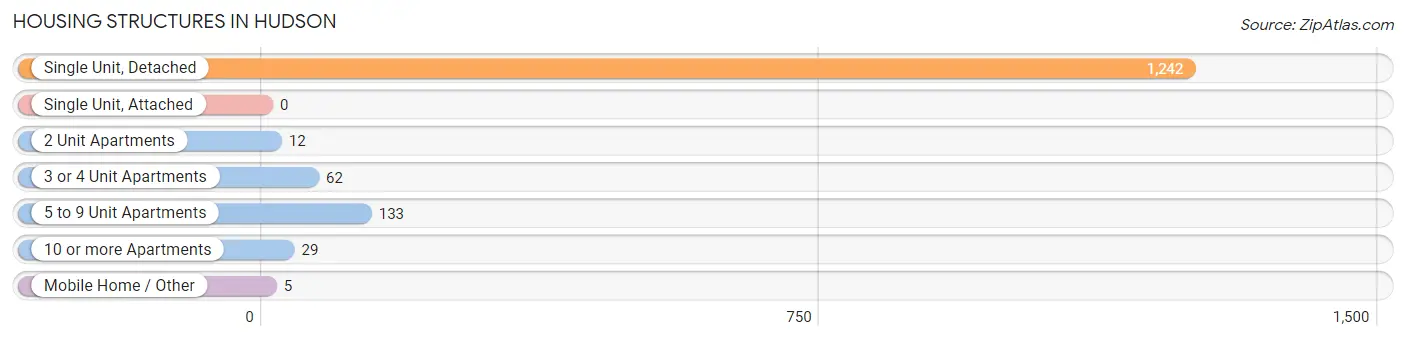
| Structure Type | # Housing Units | % Housing Units |
| Single Unit, Detached | 1,242 | 83.8% |
| Single Unit, Attached | 0 | 0.0% |
| 2 Unit Apartments | 12 | 0.8% |
| 3 or 4 Unit Apartments | 62 | 4.2% |
| 5 to 9 Unit Apartments | 133 | 9.0% |
| 10 or more Apartments | 29 | 2.0% |
| Mobile Home / Other | 5 | 0.3% |
| Total | 1,483 | 100.0% |
Housing Structures by Occupancy in Hudson
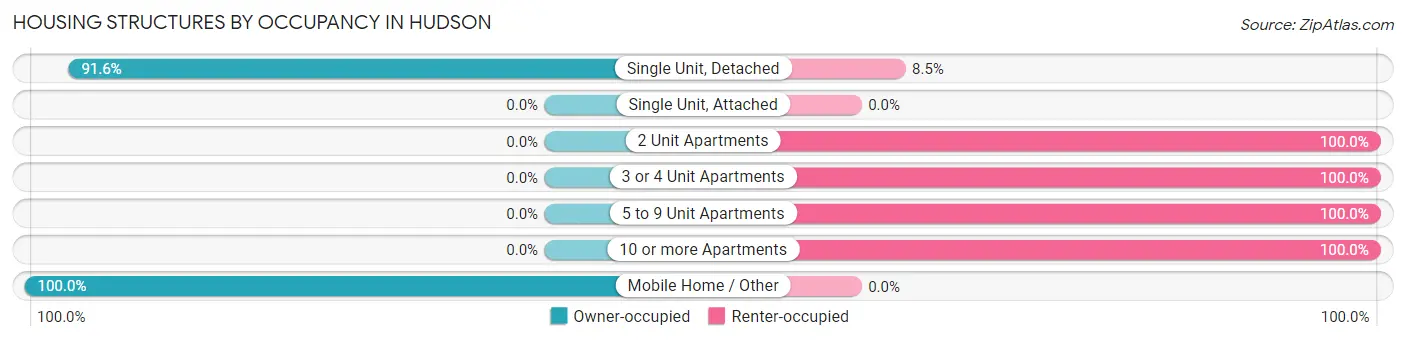
| Structure Type | Owner-occupied | Renter-occupied |
| Single Unit, Detached | 1,137 (91.5%) | 105 (8.5%) |
| Single Unit, Attached | 0 (0.0%) | 0 (0.0%) |
| 2 Unit Apartments | 0 (0.0%) | 12 (100.0%) |
| 3 or 4 Unit Apartments | 0 (0.0%) | 62 (100.0%) |
| 5 to 9 Unit Apartments | 0 (0.0%) | 133 (100.0%) |
| 10 or more Apartments | 0 (0.0%) | 29 (100.0%) |
| Mobile Home / Other | 5 (100.0%) | 0 (0.0%) |
| Total | 1,142 (77.0%) | 341 (23.0%) |
Housing Structures by Number of Rooms in Hudson
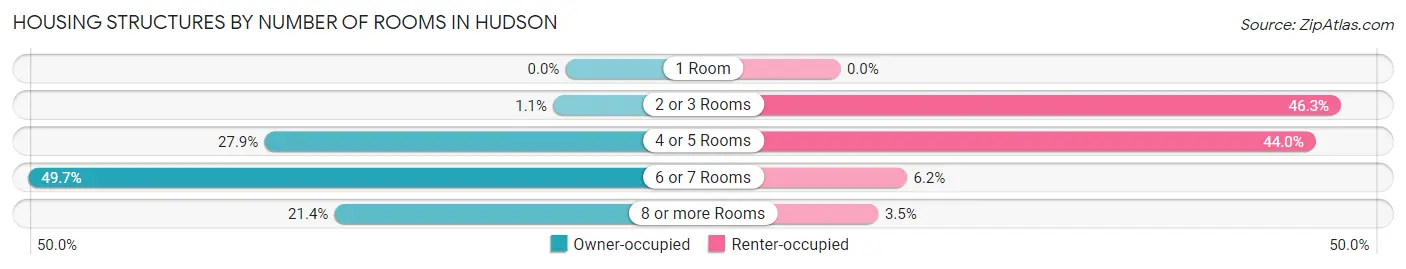
| Number of Rooms | Owner-occupied | Renter-occupied |
| 1 Room | 0 (0.0%) | 0 (0.0%) |
| 2 or 3 Rooms | 13 (1.1%) | 158 (46.3%) |
| 4 or 5 Rooms | 318 (27.9%) | 150 (44.0%) |
| 6 or 7 Rooms | 567 (49.6%) | 21 (6.2%) |
| 8 or more Rooms | 244 (21.4%) | 12 (3.5%) |
| Total | 1,142 (100.0%) | 341 (100.0%) |
Housing Structure by Heating Type in Hudson
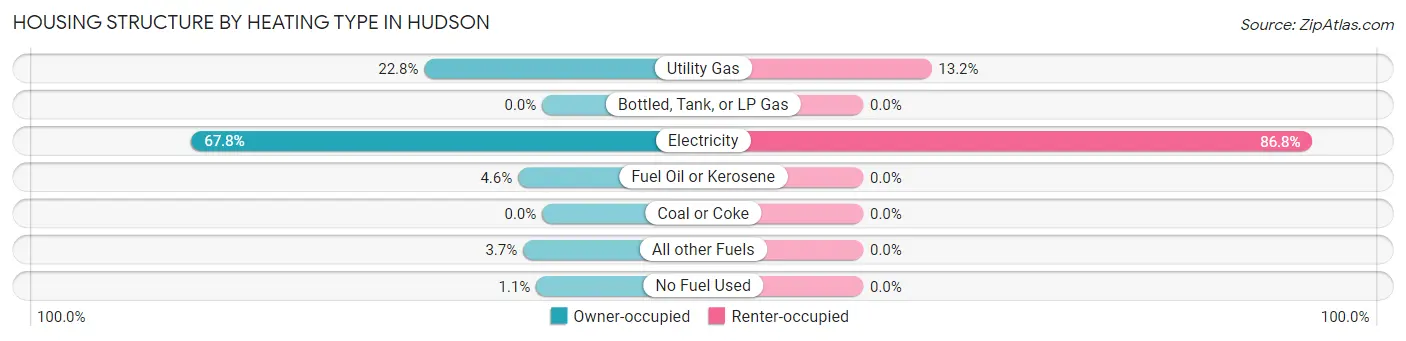
| Heating Type | Owner-occupied | Renter-occupied |
| Utility Gas | 260 (22.8%) | 45 (13.2%) |
| Bottled, Tank, or LP Gas | 0 (0.0%) | 0 (0.0%) |
| Electricity | 774 (67.8%) | 296 (86.8%) |
| Fuel Oil or Kerosene | 53 (4.6%) | 0 (0.0%) |
| Coal or Coke | 0 (0.0%) | 0 (0.0%) |
| All other Fuels | 42 (3.7%) | 0 (0.0%) |
| No Fuel Used | 13 (1.1%) | 0 (0.0%) |
| Total | 1,142 (100.0%) | 341 (100.0%) |
Household Vehicle Usage in Hudson
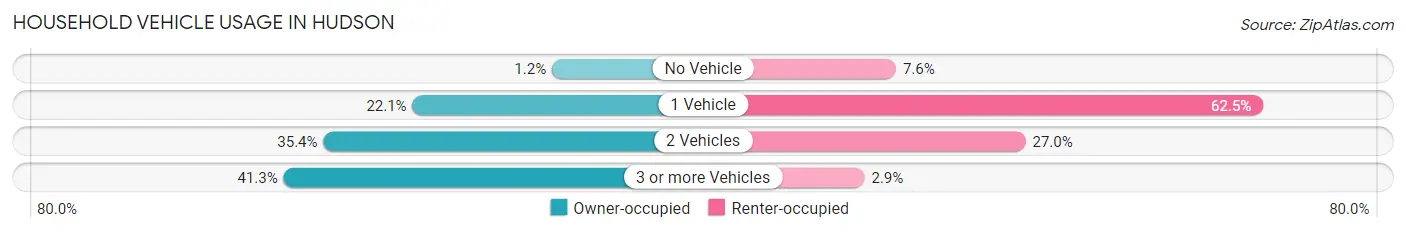
| Vehicles per Household | Owner-occupied | Renter-occupied |
| No Vehicle | 14 (1.2%) | 26 (7.6%) |
| 1 Vehicle | 252 (22.1%) | 213 (62.5%) |
| 2 Vehicles | 404 (35.4%) | 92 (27.0%) |
| 3 or more Vehicles | 472 (41.3%) | 10 (2.9%) |
| Total | 1,142 (100.0%) | 341 (100.0%) |
Real Estate & Mortgages in Hudson
Real Estate and Mortgage Overview in Hudson
| Characteristic | Without Mortgage | With Mortgage |
| Housing Units | 559 | 583 |
| Median Property Value | $145,300 | $183,500 |
| Median Household Income | $40,485 | $62 |
| Monthly Housing Costs | $431 | $0 |
| Real Estate Taxes | $1,405 | $0 |
Property Value by Mortgage Status in Hudson
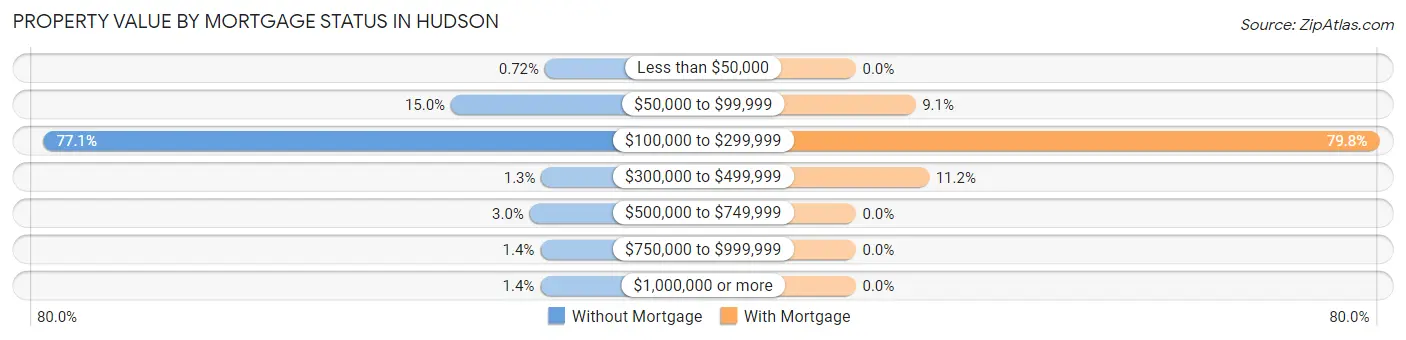
| Property Value | Without Mortgage | With Mortgage |
| Less than $50,000 | 4 (0.7%) | 0 (0.0%) |
| $50,000 to $99,999 | 84 (15.0%) | 53 (9.1%) |
| $100,000 to $299,999 | 431 (77.1%) | 465 (79.8%) |
| $300,000 to $499,999 | 7 (1.3%) | 65 (11.2%) |
| $500,000 to $749,999 | 17 (3.0%) | 0 (0.0%) |
| $750,000 to $999,999 | 8 (1.4%) | 0 (0.0%) |
| $1,000,000 or more | 8 (1.4%) | 0 (0.0%) |
| Total | 559 (100.0%) | 583 (100.0%) |
Household Income by Mortgage Status in Hudson
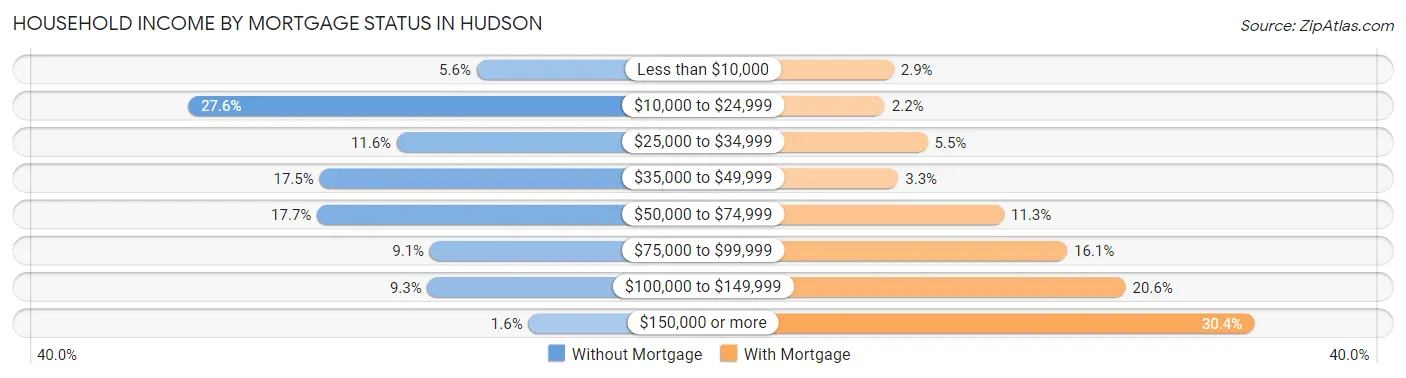
| Household Income | Without Mortgage | With Mortgage |
| Less than $10,000 | 31 (5.6%) | 17 (2.9%) |
| $10,000 to $24,999 | 154 (27.6%) | 13 (2.2%) |
| $25,000 to $34,999 | 65 (11.6%) | 32 (5.5%) |
| $35,000 to $49,999 | 98 (17.5%) | 19 (3.3%) |
| $50,000 to $74,999 | 99 (17.7%) | 66 (11.3%) |
| $75,000 to $99,999 | 51 (9.1%) | 94 (16.1%) |
| $100,000 to $149,999 | 52 (9.3%) | 120 (20.6%) |
| $150,000 or more | 9 (1.6%) | 177 (30.4%) |
| Total | 559 (100.0%) | 583 (100.0%) |
Property Value to Household Income Ratio in Hudson
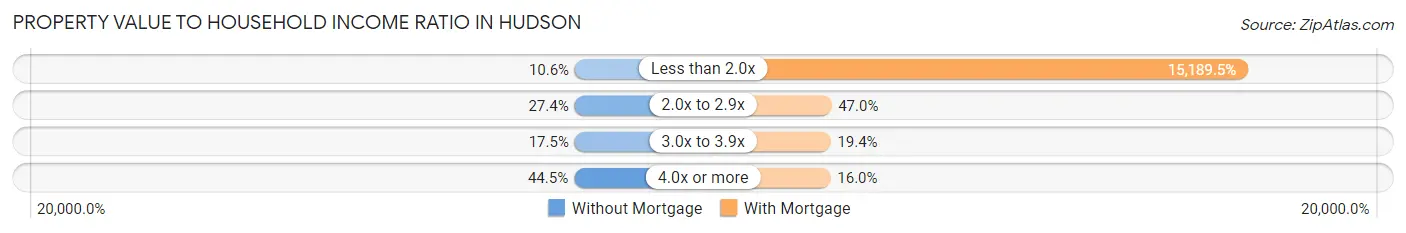
| Value-to-Income Ratio | Without Mortgage | With Mortgage |
| Less than 2.0x | 59 (10.5%) | 88,555 (15,189.5%) |
| 2.0x to 2.9x | 153 (27.4%) | 274 (47.0%) |
| 3.0x to 3.9x | 98 (17.5%) | 113 (19.4%) |
| 4.0x or more | 249 (44.5%) | 93 (16.0%) |
| Total | 559 (100.0%) | 583 (100.0%) |
Real Estate Taxes by Mortgage Status in Hudson
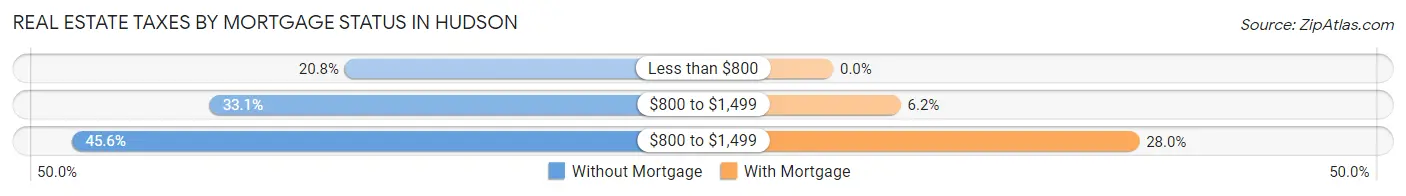
| Property Taxes | Without Mortgage | With Mortgage |
| Less than $800 | 116 (20.7%) | 0 (0.0%) |
| $800 to $1,499 | 185 (33.1%) | 36 (6.2%) |
| $800 to $1,499 | 255 (45.6%) | 163 (28.0%) |
| Total | 559 (100.0%) | 583 (100.0%) |
Health & Disability in Hudson
Health Insurance Coverage by Age in Hudson
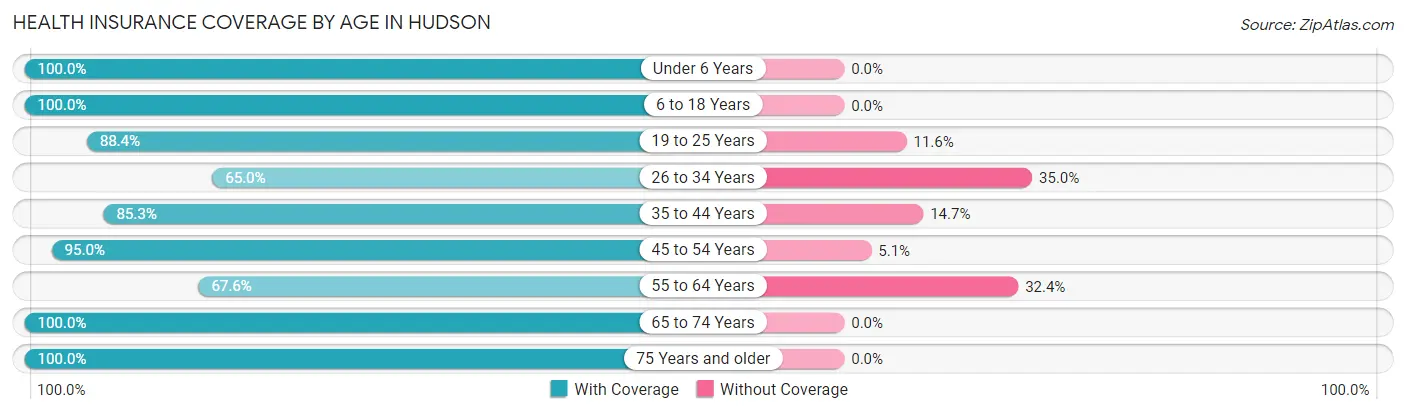
| Age Bracket | With Coverage | Without Coverage |
| Under 6 Years | 141 (100.0%) | 0 (0.0%) |
| 6 to 18 Years | 635 (100.0%) | 0 (0.0%) |
| 19 to 25 Years | 335 (88.4%) | 44 (11.6%) |
| 26 to 34 Years | 269 (65.0%) | 145 (35.0%) |
| 35 to 44 Years | 423 (85.3%) | 73 (14.7%) |
| 45 to 54 Years | 451 (95.0%) | 24 (5.1%) |
| 55 to 64 Years | 350 (67.6%) | 168 (32.4%) |
| 65 to 74 Years | 364 (100.0%) | 0 (0.0%) |
| 75 Years and older | 357 (100.0%) | 0 (0.0%) |
| Total | 3,325 (88.0%) | 454 (12.0%) |
Health Insurance Coverage by Citizenship Status in Hudson
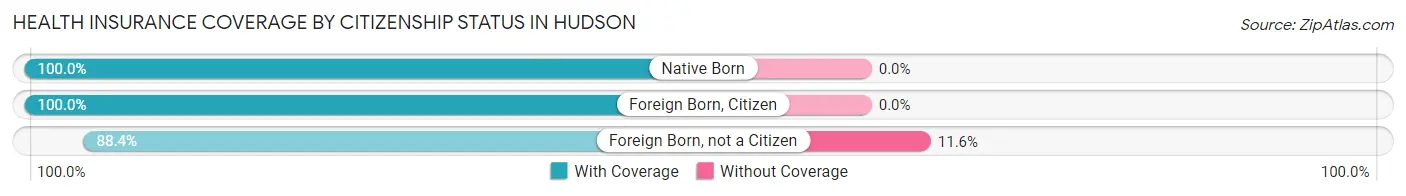
| Citizenship Status | With Coverage | Without Coverage |
| Native Born | 141 (100.0%) | 0 (0.0%) |
| Foreign Born, Citizen | 635 (100.0%) | 0 (0.0%) |
| Foreign Born, not a Citizen | 335 (88.4%) | 44 (11.6%) |
Health Insurance Coverage by Household Income in Hudson
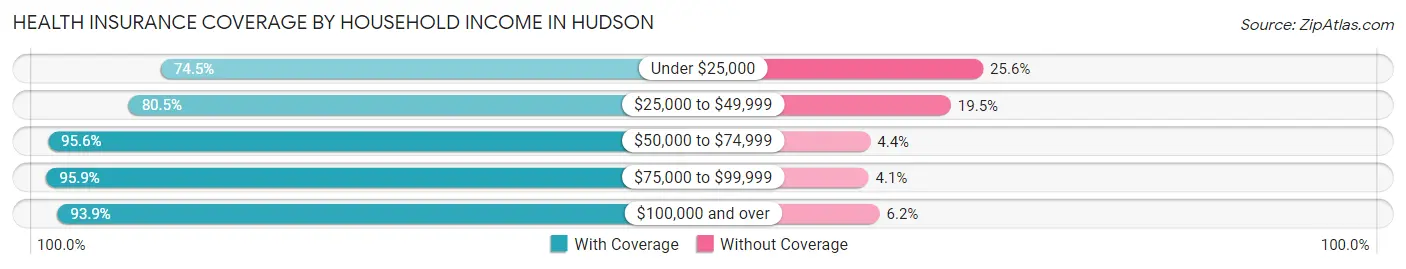
| Household Income | With Coverage | Without Coverage |
| Under $25,000 | 571 (74.5%) | 196 (25.6%) |
| $25,000 to $49,999 | 553 (80.5%) | 134 (19.5%) |
| $50,000 to $74,999 | 519 (95.6%) | 24 (4.4%) |
| $75,000 to $99,999 | 469 (95.9%) | 20 (4.1%) |
| $100,000 and over | 1,205 (93.9%) | 79 (6.1%) |
Public vs Private Health Insurance Coverage by Age in Hudson
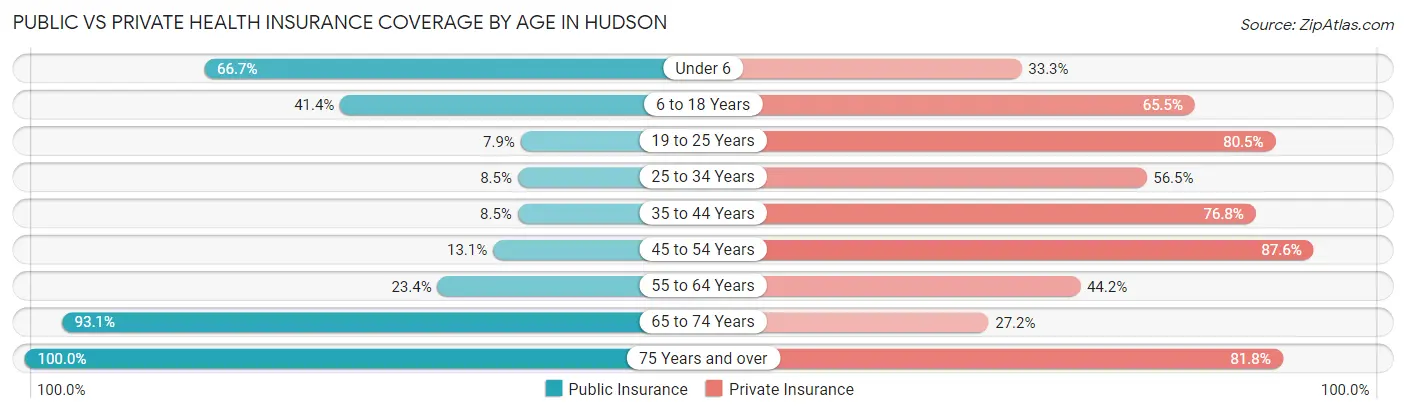
| Age Bracket | Public Insurance | Private Insurance |
| Under 6 | 94 (66.7%) | 47 (33.3%) |
| 6 to 18 Years | 263 (41.4%) | 416 (65.5%) |
| 19 to 25 Years | 30 (7.9%) | 305 (80.5%) |
| 25 to 34 Years | 35 (8.5%) | 234 (56.5%) |
| 35 to 44 Years | 42 (8.5%) | 381 (76.8%) |
| 45 to 54 Years | 62 (13.1%) | 416 (87.6%) |
| 55 to 64 Years | 121 (23.4%) | 229 (44.2%) |
| 65 to 74 Years | 339 (93.1%) | 99 (27.2%) |
| 75 Years and over | 357 (100.0%) | 292 (81.8%) |
| Total | 1,343 (35.5%) | 2,419 (64.0%) |
Disability Status by Sex by Age in Hudson
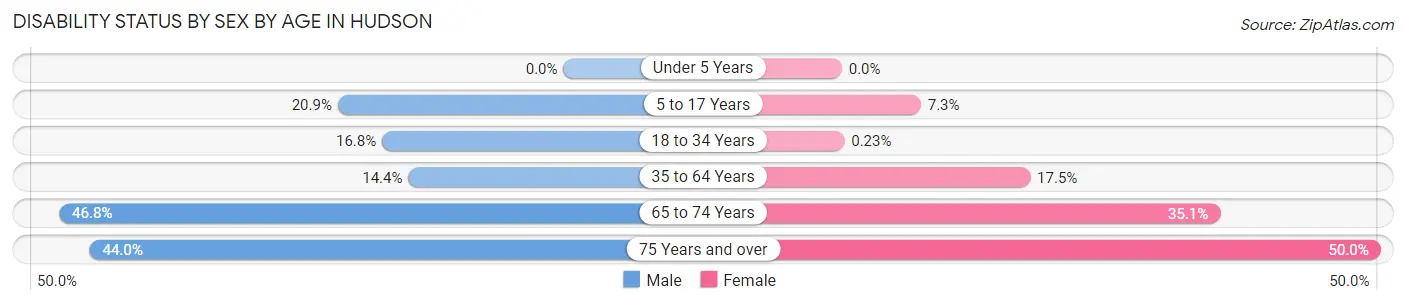
| Age Bracket | Male | Female |
| Under 5 Years | 0 (0.0%) | 0 (0.0%) |
| 5 to 17 Years | 67 (20.9%) | 22 (7.3%) |
| 18 to 34 Years | 70 (16.8%) | 1 (0.2%) |
| 35 to 64 Years | 99 (14.4%) | 140 (17.5%) |
| 65 to 74 Years | 73 (46.8%) | 73 (35.1%) |
| 75 Years and over | 62 (44.0%) | 108 (50.0%) |
Disability Class by Sex by Age in Hudson
Disability Class: Hearing Difficulty
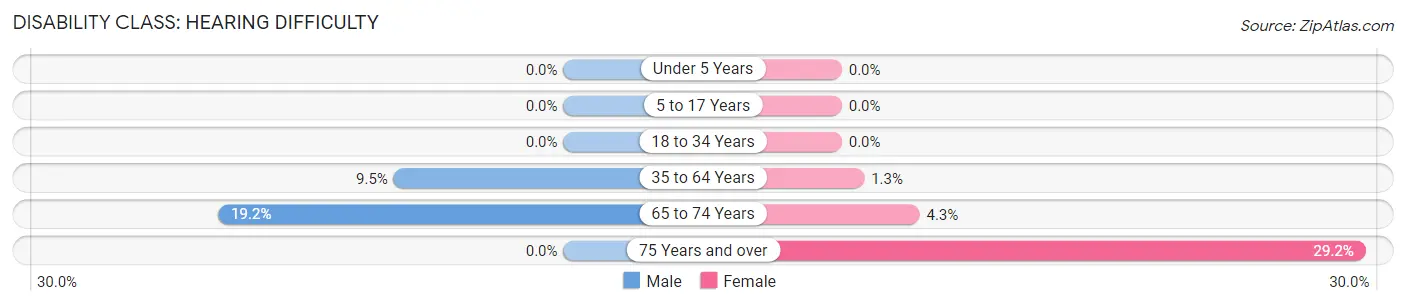
| Age Bracket | Male | Female |
| Under 5 Years | 0 (0.0%) | 0 (0.0%) |
| 5 to 17 Years | 0 (0.0%) | 0 (0.0%) |
| 18 to 34 Years | 0 (0.0%) | 0 (0.0%) |
| 35 to 64 Years | 65 (9.5%) | 10 (1.3%) |
| 65 to 74 Years | 30 (19.2%) | 9 (4.3%) |
| 75 Years and over | 0 (0.0%) | 63 (29.2%) |
Disability Class: Vision Difficulty
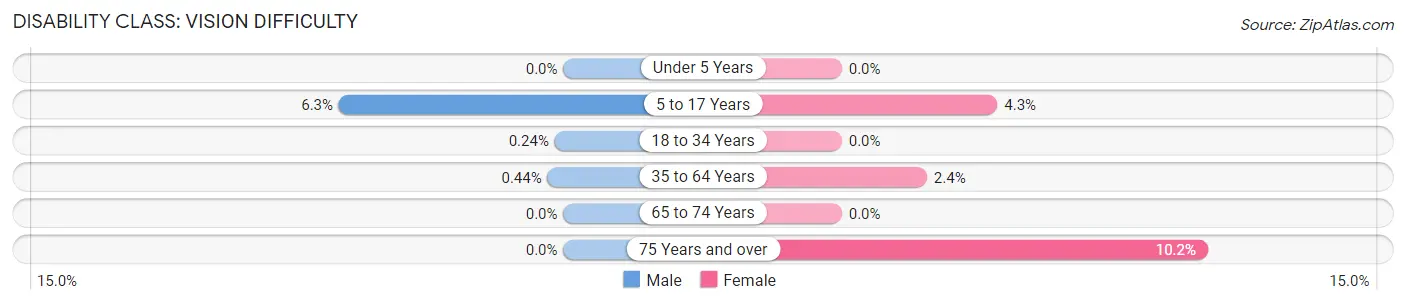
| Age Bracket | Male | Female |
| Under 5 Years | 0 (0.0%) | 0 (0.0%) |
| 5 to 17 Years | 20 (6.2%) | 13 (4.3%) |
| 18 to 34 Years | 1 (0.2%) | 0 (0.0%) |
| 35 to 64 Years | 3 (0.4%) | 19 (2.4%) |
| 65 to 74 Years | 0 (0.0%) | 0 (0.0%) |
| 75 Years and over | 0 (0.0%) | 22 (10.2%) |
Disability Class: Cognitive Difficulty
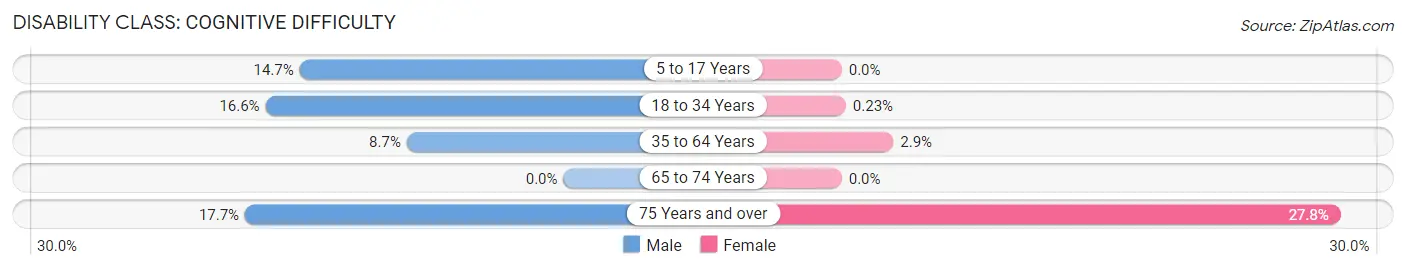
| Age Bracket | Male | Female |
| 5 to 17 Years | 47 (14.7%) | 0 (0.0%) |
| 18 to 34 Years | 69 (16.6%) | 1 (0.2%) |
| 35 to 64 Years | 60 (8.7%) | 23 (2.9%) |
| 65 to 74 Years | 0 (0.0%) | 0 (0.0%) |
| 75 Years and over | 25 (17.7%) | 60 (27.8%) |
Disability Class: Ambulatory Difficulty
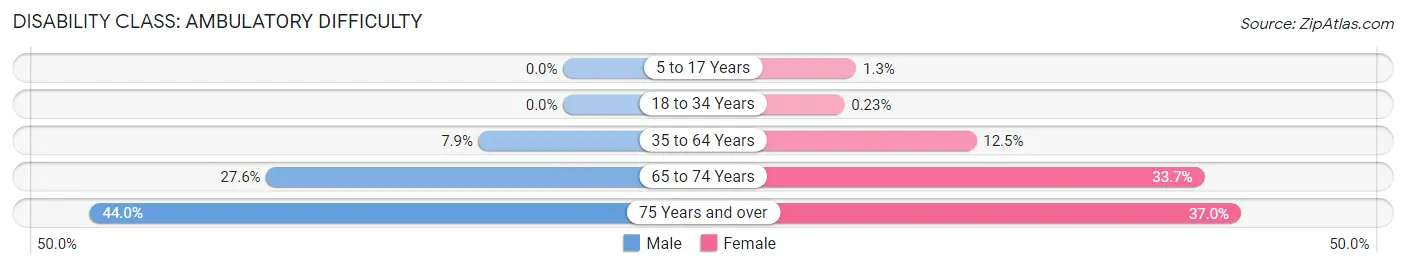
| Age Bracket | Male | Female |
| 5 to 17 Years | 0 (0.0%) | 4 (1.3%) |
| 18 to 34 Years | 0 (0.0%) | 1 (0.2%) |
| 35 to 64 Years | 54 (7.9%) | 100 (12.5%) |
| 65 to 74 Years | 43 (27.6%) | 70 (33.7%) |
| 75 Years and over | 62 (44.0%) | 80 (37.0%) |
Disability Class: Self-Care Difficulty
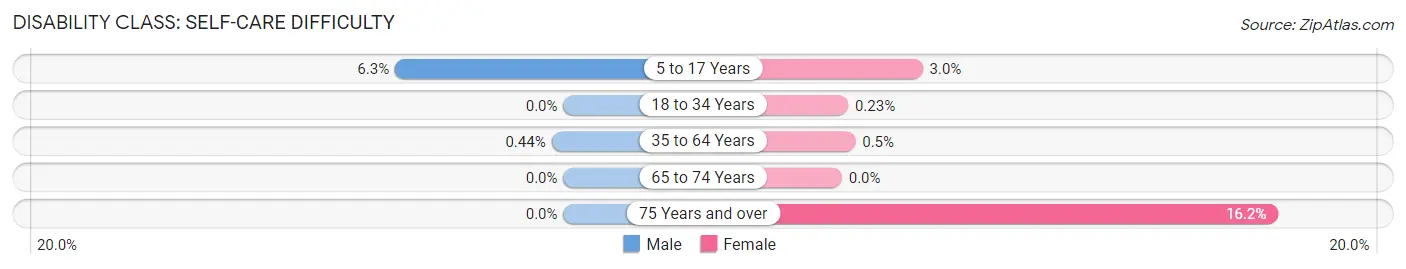
| Age Bracket | Male | Female |
| 5 to 17 Years | 20 (6.2%) | 9 (3.0%) |
| 18 to 34 Years | 0 (0.0%) | 1 (0.2%) |
| 35 to 64 Years | 3 (0.4%) | 4 (0.5%) |
| 65 to 74 Years | 0 (0.0%) | 0 (0.0%) |
| 75 Years and over | 0 (0.0%) | 35 (16.2%) |
Technology Access in Hudson
Computing Device Access in Hudson
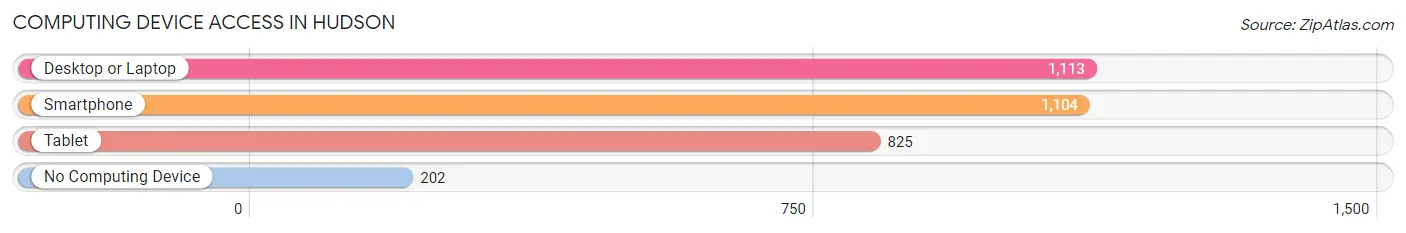
| Device Type | # Households | % Households |
| Desktop or Laptop | 1,113 | 75.0% |
| Smartphone | 1,104 | 74.4% |
| Tablet | 825 | 55.6% |
| No Computing Device | 202 | 13.6% |
| Total | 1,483 | 100.0% |
Internet Access in Hudson
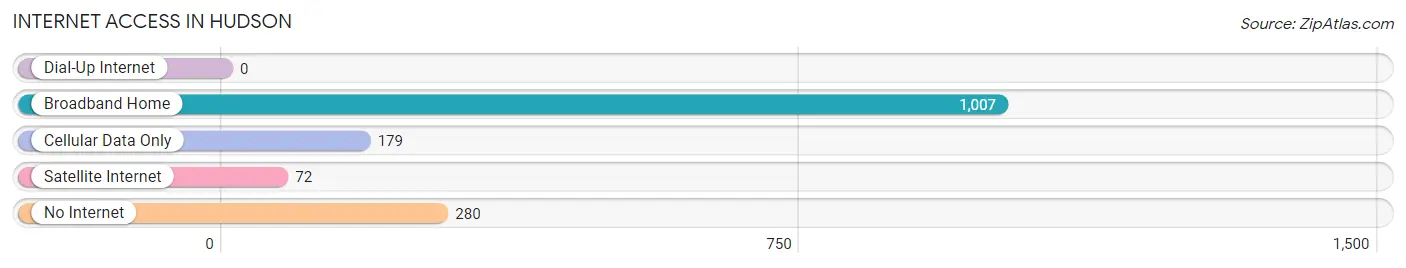
| Internet Type | # Households | % Households |
| Dial-Up Internet | 0 | 0.0% |
| Broadband Home | 1,007 | 67.9% |
| Cellular Data Only | 179 | 12.1% |
| Satellite Internet | 72 | 4.9% |
| No Internet | 280 | 18.9% |
| Total | 1,483 | 100.0% |
Hudson Summary
Hudson is a small town located in Caldwell County, North Carolina. It is situated in the foothills of the Blue Ridge Mountains, approximately 30 miles northwest of Hickory and 40 miles northeast of Asheville. The town was founded in 1891 and incorporated in 1913. As of the 2010 census, the population of Hudson was 2,941.
Geography
Hudson is located at 35°45'25"N 81°30'45"W (35.7569, -81.5125). According to the United States Census Bureau, the town has a total area of 2.2 square miles (5.7 km2), all of it land.
The town is situated in the foothills of the Blue Ridge Mountains, and is surrounded by rolling hills and valleys. The Catawba River is located to the east of the town, and the South Fork of the Catawba River is located to the west.
Economy
Hudson's economy is largely based on manufacturing and agriculture. The town is home to several manufacturing companies, including a furniture factory, a textile mill, and a plastics plant. Agriculture is also an important part of the local economy, with tobacco, corn, and soybeans being the main crops.
The town is also home to several small businesses, including restaurants, retail stores, and service providers.
Demographics
As of the 2010 census, there were 2,941 people, 1,093 households, and 745 families residing in the town. The population density was 1,323.2 people per square mile (509.7/km2). There were 1,183 housing units at an average density of 531.2 per square mile (204.9/km2). The racial makeup of the town was 87.2% White, 9.2% African American, 0.3% Native American, 0.7% Asian, 0.1% Pacific Islander, 1.2% from other races, and 1.3% from two or more races. Hispanic or Latino of any race were 2.7% of the population.
There were 1,093 households, out of which 33.2% had children under the age of 18 living with them, 48.2% were married couples living together, 15.2% had a female householder with no husband present, and 31.7% were non-families. 26.2% of all households were made up of individuals, and 11.2% had someone living alone who was 65 years of age or older. The average household size was 2.54 and the average family size was 3.05.
In the town, the population was spread out, with 25.7% under the age of 18, 8.2% from 18 to 24, 28.7% from 25 to 44, 22.7% from 45 to 64, and 14.7% who were 65 years of age or older. The median age was 36 years. For every 100 females, there were 91.2 males. For every 100 females age 18 and over, there were 87.2 males.
The median income for a household in the town was $30,938, and the median income for a family was $37,917. Males had a median income of $30,000 versus $21,250 for females. The per capita income for the town was $15,945. About 13.2% of families and 16.2% of the population were below the poverty line, including 22.2% of those under age 18 and 14.2% of those age 65 or over.
Common Questions
What is Per Capita Income in Hudson?
Per Capita income in Hudson is $25,492.
What is the Median Family Income in Hudson?
Median Family Income in Hudson is $72,014.
What is the Median Household income in Hudson?
Median Household Income in Hudson is $49,761.
What is Income or Wage Gap in Hudson?
Income or Wage Gap in Hudson is 26.9%.
Women in Hudson earn 73.1 cents for every dollar earned by a man.
What is Inequality or Gini Index in Hudson?
Inequality or Gini Index in Hudson is 0.43.
What is the Total Population of Hudson?
Total Population of Hudson is 3,780.
What is the Total Male Population of Hudson?
Total Male Population of Hudson is 1,783.
What is the Total Female Population of Hudson?
Total Female Population of Hudson is 1,997.
What is the Ratio of Males per 100 Females in Hudson?
There are 89.28 Males per 100 Females in Hudson.
What is the Ratio of Females per 100 Males in Hudson?
There are 112.00 Females per 100 Males in Hudson.
What is the Median Population Age in Hudson?
Median Population Age in Hudson is 40.1 Years.
What is the Average Family Size in Hudson
Average Family Size in Hudson is 3.1 People.
What is the Average Household Size in Hudson
Average Household Size in Hudson is 2.5 People.
How Large is the Labor Force in Hudson?
There are 1,943 People in the Labor Forcein in Hudson.
What is the Percentage of People in the Labor Force in Hudson?
61.0% of People are in the Labor Force in Hudson.
What is the Unemployment Rate in Hudson?
Unemployment Rate in Hudson is 6.2%.