Horse Shoe, NC Map & Demographics
Horse Shoe Map
Horse Shoe Overview
$44,842
PER CAPITA INCOME
$100,096
AVG FAMILY INCOME
$68,000
AVG HOUSEHOLD INCOME
27.0%
WAGE / INCOME GAP [ % ]
73.0¢/ $1
WAGE / INCOME GAP [ $ ]
0.47
INEQUALITY / GINI INDEX
1,854
TOTAL POPULATION
850
MALE POPULATION
1,004
FEMALE POPULATION
84.66
MALES / 100 FEMALES
118.12
FEMALES / 100 MALES
51.6
MEDIAN AGE
2.6
AVG FAMILY SIZE
2.4
AVG HOUSEHOLD SIZE
793
LABOR FORCE [ PEOPLE ]
49.8%
PERCENT IN LABOR FORCE
3.2%
UNEMPLOYMENT RATE
Horse Shoe Zip Codes
Horse Shoe Area Codes
Income in Horse Shoe
Income Overview in Horse Shoe
Per Capita Income in Horse Shoe is $44,842, while median incomes of families and households are $100,096 and $68,000 respectively.
| Characteristic | Number | Measure |
| Per Capita Income | 1,854 | $44,842 |
| Median Family Income | 616 | $100,096 |
| Mean Family Income | 616 | $119,059 |
| Median Household Income | 786 | $68,000 |
| Mean Household Income | 786 | $105,129 |
| Income Deficit | 616 | $0 |
| Wage / Income Gap (%) | 1,854 | 26.99% |
| Wage / Income Gap ($) | 1,854 | 73.01¢ per $1 |
| Gini / Inequality Index | 1,854 | 0.47 |
Earnings by Sex in Horse Shoe
Average Earnings in Horse Shoe are $43,553, $52,667 for men and $38,452 for women, a difference of 27.0%.
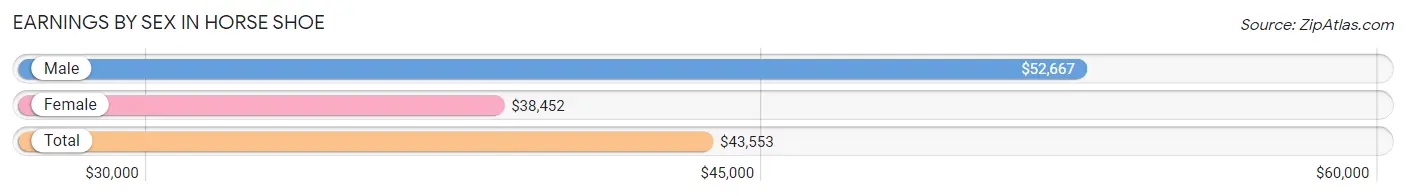
| Sex | Number | Average Earnings |
| Male | 426 (50.2%) | $52,667 |
| Female | 422 (49.8%) | $38,452 |
| Total | 848 (100.0%) | $43,553 |
Earnings by Sex by Income Bracket in Horse Shoe
The most common earnings brackets in Horse Shoe are $100,000+ for men (98 | 23.0%) and $100,000+ for women (66 | 15.6%).
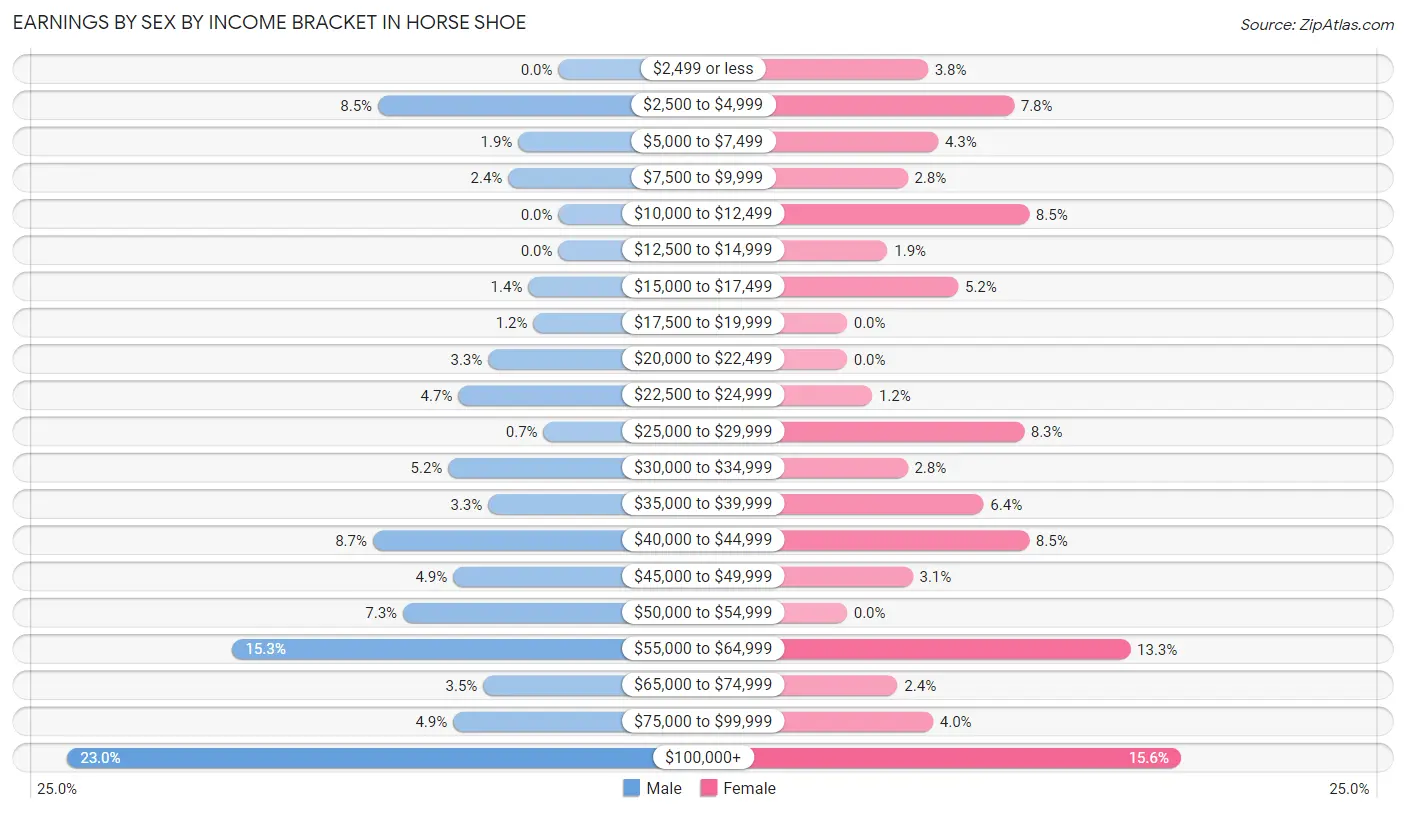
| Income | Male | Female |
| $2,499 or less | 0 (0.0%) | 16 (3.8%) |
| $2,500 to $4,999 | 36 (8.5%) | 33 (7.8%) |
| $5,000 to $7,499 | 8 (1.9%) | 18 (4.3%) |
| $7,500 to $9,999 | 10 (2.4%) | 12 (2.8%) |
| $10,000 to $12,499 | 0 (0.0%) | 36 (8.5%) |
| $12,500 to $14,999 | 0 (0.0%) | 8 (1.9%) |
| $15,000 to $17,499 | 6 (1.4%) | 22 (5.2%) |
| $17,500 to $19,999 | 5 (1.2%) | 0 (0.0%) |
| $20,000 to $22,499 | 14 (3.3%) | 0 (0.0%) |
| $22,500 to $24,999 | 20 (4.7%) | 5 (1.2%) |
| $25,000 to $29,999 | 3 (0.7%) | 35 (8.3%) |
| $30,000 to $34,999 | 22 (5.2%) | 12 (2.8%) |
| $35,000 to $39,999 | 14 (3.3%) | 27 (6.4%) |
| $40,000 to $44,999 | 37 (8.7%) | 36 (8.5%) |
| $45,000 to $49,999 | 21 (4.9%) | 13 (3.1%) |
| $50,000 to $54,999 | 31 (7.3%) | 0 (0.0%) |
| $55,000 to $64,999 | 65 (15.3%) | 56 (13.3%) |
| $65,000 to $74,999 | 15 (3.5%) | 10 (2.4%) |
| $75,000 to $99,999 | 21 (4.9%) | 17 (4.0%) |
| $100,000+ | 98 (23.0%) | 66 (15.6%) |
| Total | 426 (100.0%) | 422 (100.0%) |
Earnings by Sex by Educational Attainment in Horse Shoe
Average earnings in Horse Shoe are $52,667 for men and $40,868 for women, a difference of 22.4%. Men with an educational attainment of bachelor's degree enjoy the highest average annual earnings of $98,750, while those with college or associate's degree education earn the least with $52,750. Women with an educational attainment of graduate degree earn the most with the average annual earnings of $89,444, while those with bachelor's degree education have the smallest earnings of $40,583.
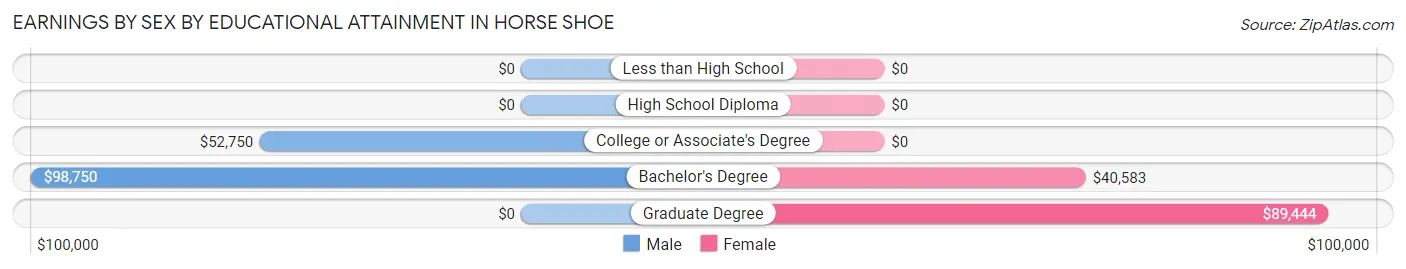
| Educational Attainment | Male Income | Female Income |
| Less than High School | - | - |
| High School Diploma | - | - |
| College or Associate's Degree | $52,750 | $0 |
| Bachelor's Degree | $98,750 | $40,583 |
| Graduate Degree | - | - |
| Total | $52,667 | $40,868 |
Family Income in Horse Shoe
Family Income Brackets in Horse Shoe
According to the Horse Shoe family income data, there are 175 families falling into the $100,000 to $149,999 income range, which is the most common income bracket and makes up 28.4% of all families.
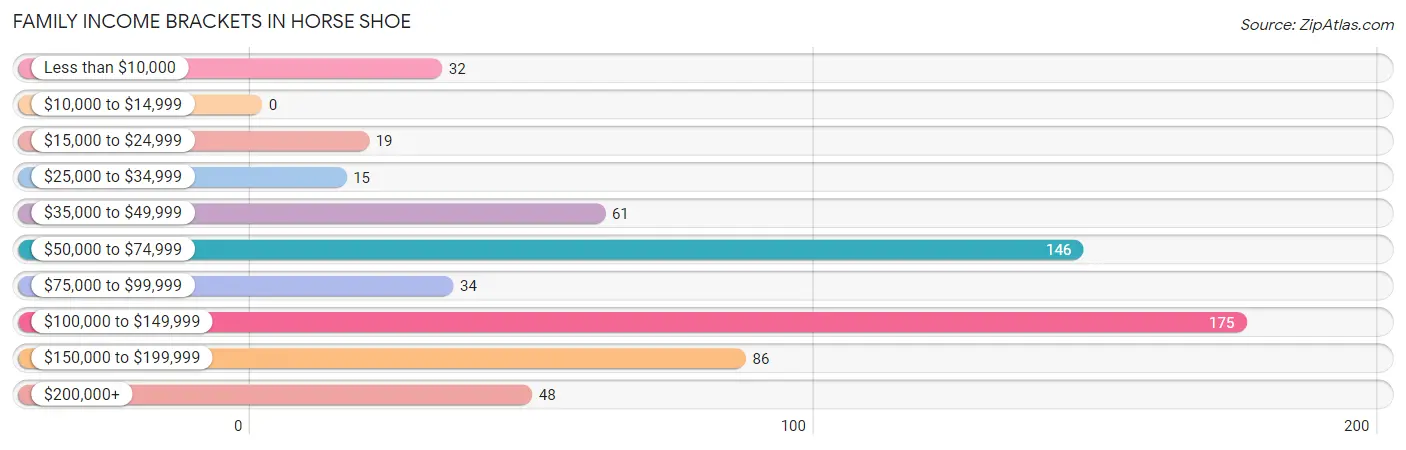
| Income Bracket | # Families | % Families |
| Less than $10,000 | 32 | 5.2% |
| $10,000 to $14,999 | 0 | 0.0% |
| $15,000 to $24,999 | 19 | 3.1% |
| $25,000 to $34,999 | 15 | 2.4% |
| $35,000 to $49,999 | 61 | 9.9% |
| $50,000 to $74,999 | 146 | 23.7% |
| $75,000 to $99,999 | 34 | 5.5% |
| $100,000 to $149,999 | 175 | 28.4% |
| $150,000 to $199,999 | 86 | 14.0% |
| $200,000+ | 48 | 7.8% |
Family Income by Famaliy Size in Horse Shoe
3-person families (83 | 13.5%) account for the highest median family income in Horse Shoe with $144,250 per family, while 3-person families (83 | 13.5%) have the highest median income of $48,083 per family member.
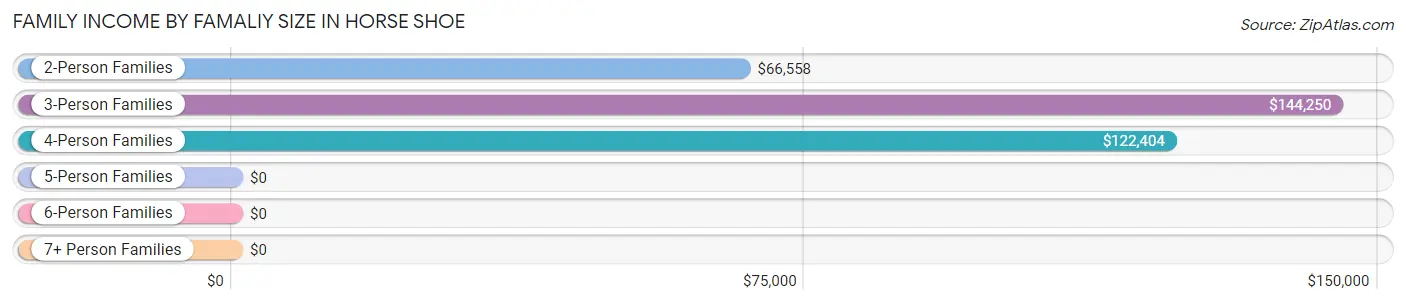
| Income Bracket | # Families | Median Income |
| 2-Person Families | 415 (67.4%) | $66,558 |
| 3-Person Families | 83 (13.5%) | $144,250 |
| 4-Person Families | 103 (16.7%) | $122,404 |
| 5-Person Families | 15 (2.4%) | $0 |
| 6-Person Families | 0 (0.0%) | $0 |
| 7+ Person Families | 0 (0.0%) | $0 |
| Total | 616 (100.0%) | $100,096 |
Family Income by Number of Earners in Horse Shoe
The median family income in Horse Shoe is $100,096, with families comprising 3+ earners (42) having the highest median family income of $156,912, while families with no earners (217) have the lowest median family income of $64,688, accounting for 6.8% and 35.2% of families, respectively.
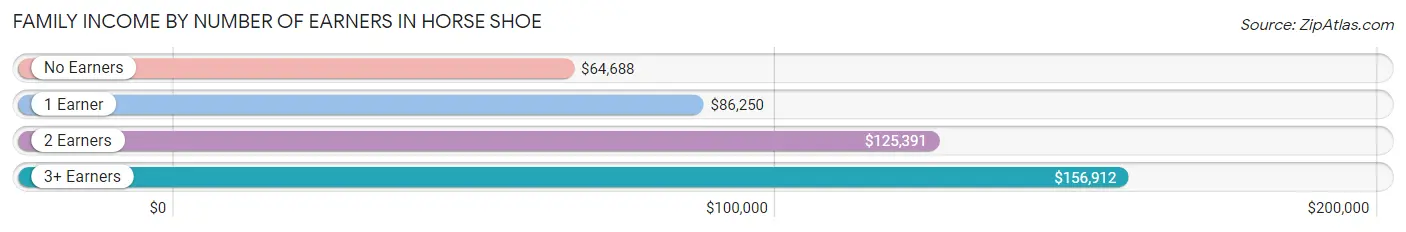
| Number of Earners | # Families | Median Income |
| No Earners | 217 (35.2%) | $64,688 |
| 1 Earner | 130 (21.1%) | $86,250 |
| 2 Earners | 227 (36.8%) | $125,391 |
| 3+ Earners | 42 (6.8%) | $156,912 |
| Total | 616 (100.0%) | $100,096 |
Household Income in Horse Shoe
Household Income Brackets in Horse Shoe
With 186 households falling in the category, the $100,000 to $149,999 income range is the most frequent in Horse Shoe, accounting for 23.7% of all households. In contrast, only 12 households (1.5%) fall into the $10,000 to $14,999 income bracket, making it the least populous group.
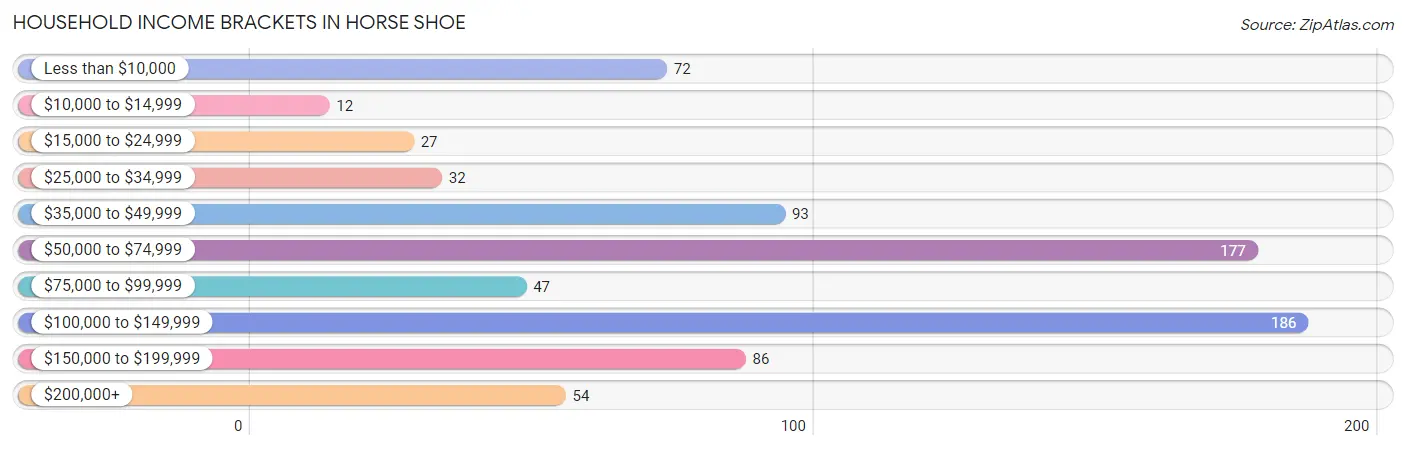
| Income Bracket | # Households | % Households |
| Less than $10,000 | 72 | 9.2% |
| $10,000 to $14,999 | 12 | 1.5% |
| $15,000 to $24,999 | 27 | 3.4% |
| $25,000 to $34,999 | 32 | 4.1% |
| $35,000 to $49,999 | 93 | 11.8% |
| $50,000 to $74,999 | 177 | 22.5% |
| $75,000 to $99,999 | 47 | 6.0% |
| $100,000 to $149,999 | 186 | 23.7% |
| $150,000 to $199,999 | 86 | 10.9% |
| $200,000+ | 54 | 6.9% |
Household Income by Householder Age in Horse Shoe
The median household income in Horse Shoe is $68,000, with the highest median household income of $140,357 found in the 45 to 64 years age bracket for the primary householder. A total of 242 households (30.8%) fall into this category.
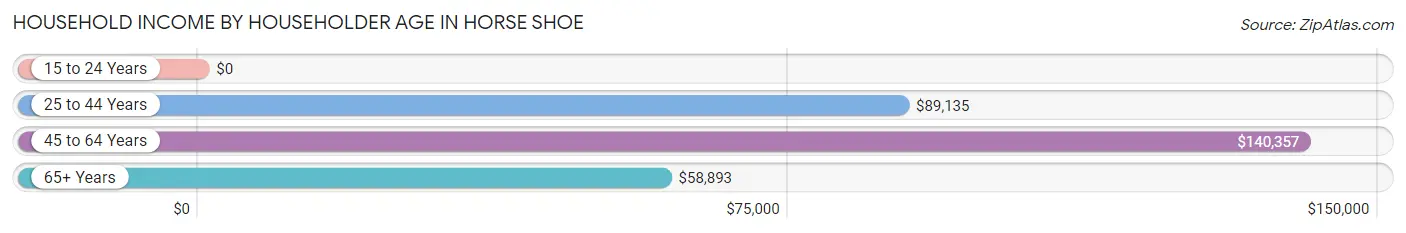
| Income Bracket | # Households | Median Income |
| 15 to 24 Years | 0 (0.0%) | $0 |
| 25 to 44 Years | 175 (22.3%) | $89,135 |
| 45 to 64 Years | 242 (30.8%) | $140,357 |
| 65+ Years | 369 (46.9%) | $58,893 |
| Total | 786 (100.0%) | $68,000 |
Poverty in Horse Shoe
Income Below Poverty by Sex and Age in Horse Shoe
With 6.8% poverty level for males and 13.8% for females among the residents of Horse Shoe, 75 year old and over males and 18 to 24 year old females are the most vulnerable to poverty, with 27 males (25.2%) and 14 females (45.2%) in their respective age groups living below the poverty level.
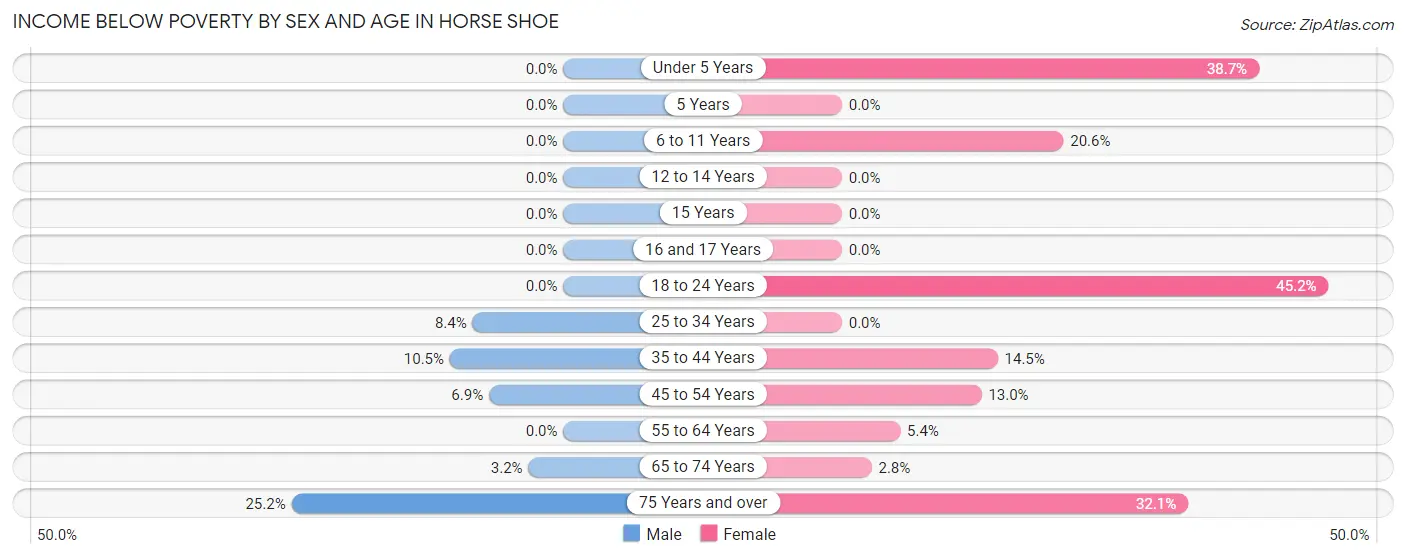
| Age Bracket | Male | Female |
| Under 5 Years | 0 (0.0%) | 12 (38.7%) |
| 5 Years | 0 (0.0%) | 0 (0.0%) |
| 6 to 11 Years | 0 (0.0%) | 22 (20.6%) |
| 12 to 14 Years | 0 (0.0%) | 0 (0.0%) |
| 15 Years | 0 (0.0%) | 0 (0.0%) |
| 16 and 17 Years | 0 (0.0%) | 0 (0.0%) |
| 18 to 24 Years | 0 (0.0%) | 14 (45.2%) |
| 25 to 34 Years | 7 (8.4%) | 0 (0.0%) |
| 35 to 44 Years | 10 (10.5%) | 12 (14.5%) |
| 45 to 54 Years | 8 (6.9%) | 21 (13.0%) |
| 55 to 64 Years | 0 (0.0%) | 6 (5.4%) |
| 65 to 74 Years | 6 (3.2%) | 6 (2.8%) |
| 75 Years and over | 27 (25.2%) | 45 (32.1%) |
| Total | 58 (6.8%) | 138 (13.8%) |
Income Above Poverty by Sex and Age in Horse Shoe
According to the poverty statistics in Horse Shoe, males aged under 5 years and females aged 12 to 14 years are the age groups that are most secure financially, with 100.0% of males and 100.0% of females in these age groups living above the poverty line.
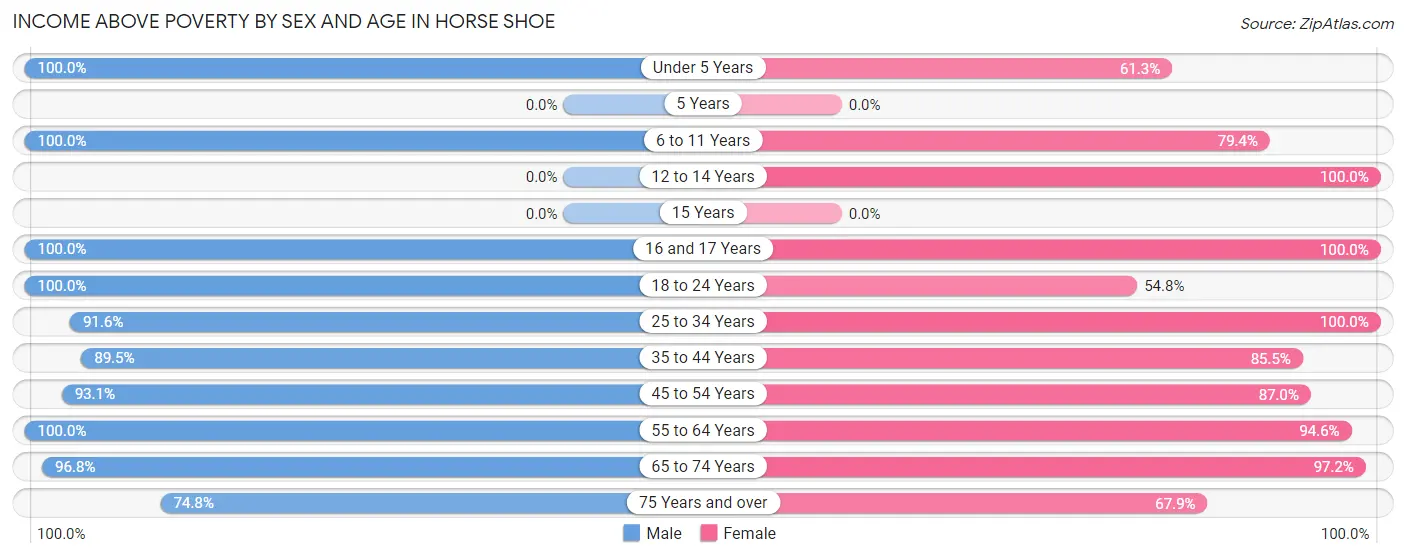
| Age Bracket | Male | Female |
| Under 5 Years | 39 (100.0%) | 19 (61.3%) |
| 5 Years | 0 (0.0%) | 0 (0.0%) |
| 6 to 11 Years | 78 (100.0%) | 85 (79.4%) |
| 12 to 14 Years | 0 (0.0%) | 6 (100.0%) |
| 15 Years | 0 (0.0%) | 0 (0.0%) |
| 16 and 17 Years | 12 (100.0%) | 20 (100.0%) |
| 18 to 24 Years | 30 (100.0%) | 17 (54.8%) |
| 25 to 34 Years | 76 (91.6%) | 96 (100.0%) |
| 35 to 44 Years | 85 (89.5%) | 71 (85.5%) |
| 45 to 54 Years | 108 (93.1%) | 141 (87.0%) |
| 55 to 64 Years | 105 (100.0%) | 105 (94.6%) |
| 65 to 74 Years | 179 (96.8%) | 211 (97.2%) |
| 75 Years and over | 80 (74.8%) | 95 (67.9%) |
| Total | 792 (93.2%) | 866 (86.3%) |
Income Below Poverty Among Married-Couple Families in Horse Shoe
The poverty statistics for married-couple families in Horse Shoe show that 3.1% or 16 of the total 520 families live below the poverty line. Families with 3 or 4 children have the highest poverty rate of 100.0%, comprising of 10 families. On the other hand, families with 1 or 2 children have the lowest poverty rate of 0.0%, which includes 0 families.
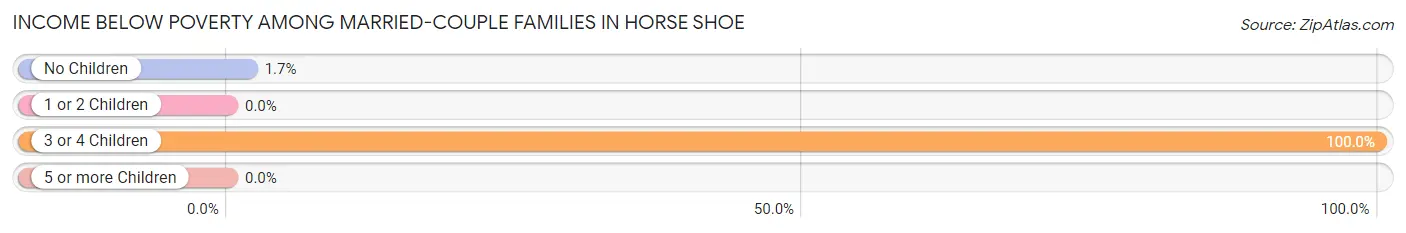
| Children | Above Poverty | Below Poverty |
| No Children | 344 (98.3%) | 6 (1.7%) |
| 1 or 2 Children | 160 (100.0%) | 0 (0.0%) |
| 3 or 4 Children | 0 (0.0%) | 10 (100.0%) |
| 5 or more Children | 0 (0.0%) | 0 (0.0%) |
| Total | 504 (96.9%) | 16 (3.1%) |
Income Below Poverty Among Single-Parent Households in Horse Shoe
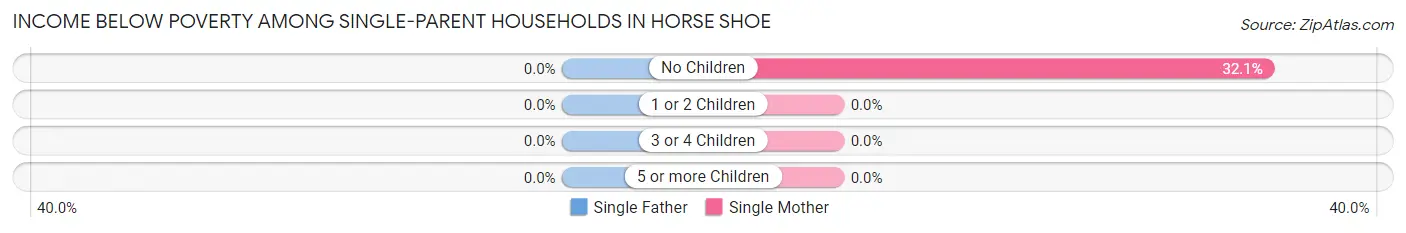
| Children | Single Father | Single Mother |
| No Children | 0 (0.0%) | 26 (32.1%) |
| 1 or 2 Children | 0 (0.0%) | 0 (0.0%) |
| 3 or 4 Children | 0 (0.0%) | 0 (0.0%) |
| 5 or more Children | 0 (0.0%) | 0 (0.0%) |
| Total | 0 (0.0%) | 26 (32.1%) |
Income Below Poverty Among Married-Couple vs Single-Parent Households in Horse Shoe
The poverty data for Horse Shoe shows that 16 of the married-couple family households (3.1%) and 26 of the single-parent households (27.1%) are living below the poverty level. Within the married-couple family households, those with 3 or 4 children have the highest poverty rate, with 10 households (100.0%) falling below the poverty line. Among the single-parent households, those with no children have the highest poverty rate, with 26 household (27.1%) living below poverty.
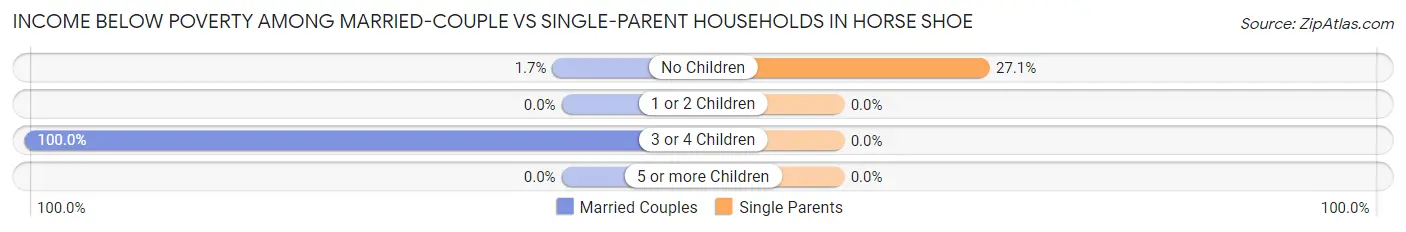
| Children | Married-Couple Families | Single-Parent Households |
| No Children | 6 (1.7%) | 26 (27.1%) |
| 1 or 2 Children | 0 (0.0%) | 0 (0.0%) |
| 3 or 4 Children | 10 (100.0%) | 0 (0.0%) |
| 5 or more Children | 0 (0.0%) | 0 (0.0%) |
| Total | 16 (3.1%) | 26 (27.1%) |
Race in Horse Shoe
The most populous races in Horse Shoe are White / Caucasian (1,758 | 94.8%), Two or more Races (83 | 4.5%), and Hispanic or Latino (65 | 3.5%).
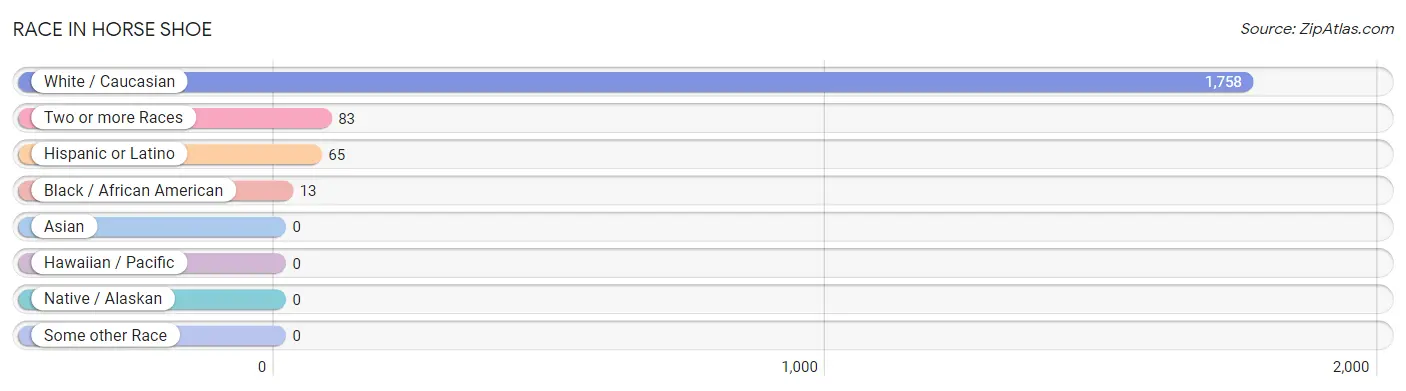
| Race | # Population | % Population |
| Asian | 0 | 0.0% |
| Black / African American | 13 | 0.7% |
| Hawaiian / Pacific | 0 | 0.0% |
| Hispanic or Latino | 65 | 3.5% |
| Native / Alaskan | 0 | 0.0% |
| White / Caucasian | 1,758 | 94.8% |
| Two or more Races | 83 | 4.5% |
| Some other Race | 0 | 0.0% |
| Total | 1,854 | 100.0% |
Ancestry in Horse Shoe
The most populous ancestries reported in Horse Shoe are Irish (366 | 19.7%), German (319 | 17.2%), American (297 | 16.0%), English (270 | 14.6%), and Italian (102 | 5.5%), together accounting for 73.0% of all Horse Shoe residents.
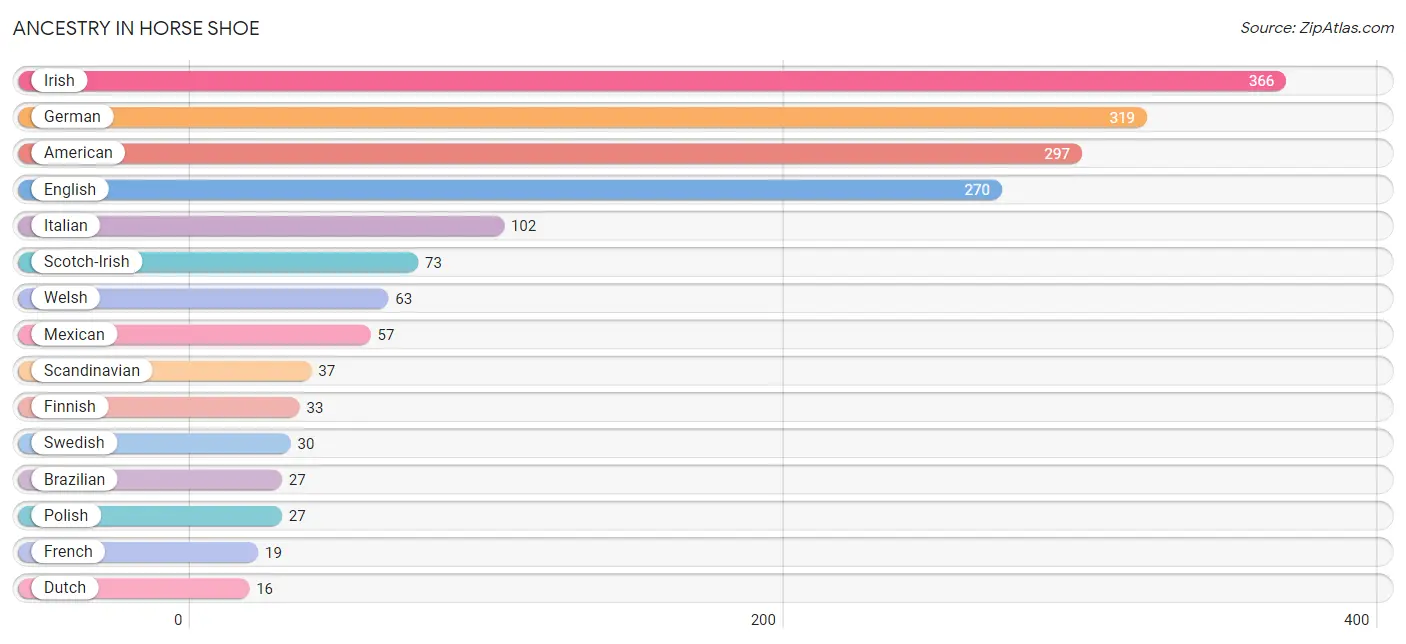
| Ancestry | # Population | % Population |
| American | 297 | 16.0% |
| Brazilian | 27 | 1.5% |
| British | 6 | 0.3% |
| Canadian | 13 | 0.7% |
| Cherokee | 10 | 0.5% |
| Colombian | 8 | 0.4% |
| Croatian | 8 | 0.4% |
| Dutch | 16 | 0.9% |
| English | 270 | 14.6% |
| European | 9 | 0.5% |
| Finnish | 33 | 1.8% |
| French | 19 | 1.0% |
| German | 319 | 17.2% |
| Irish | 366 | 19.7% |
| Italian | 102 | 5.5% |
| Lithuanian | 5 | 0.3% |
| Mexican | 57 | 3.1% |
| Polish | 27 | 1.5% |
| Russian | 6 | 0.3% |
| Scandinavian | 37 | 2.0% |
| Scotch-Irish | 73 | 3.9% |
| Scottish | 16 | 0.9% |
| South American | 8 | 0.4% |
| Swedish | 30 | 1.6% |
| Swiss | 5 | 0.3% |
| Ukrainian | 7 | 0.4% |
| Welsh | 63 | 3.4% | View All 27 Rows |
Immigrants in Horse Shoe
The most numerous immigrant groups reported in Horse Shoe came from Europe (56 | 3.0%), Northern Europe (49 | 2.6%), Latin America (46 | 2.5%), South America (46 | 2.5%), and Brazil (38 | 2.1%), together accounting for 12.7% of all Horse Shoe residents.
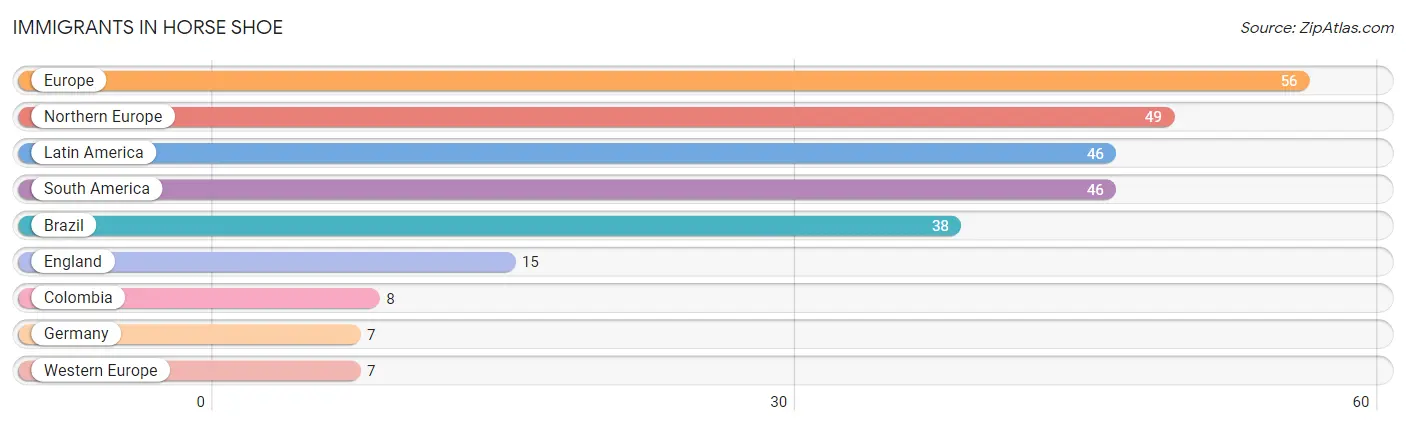
| Immigration Origin | # Population | % Population |
| Brazil | 38 | 2.1% |
| Colombia | 8 | 0.4% |
| England | 15 | 0.8% |
| Europe | 56 | 3.0% |
| Germany | 7 | 0.4% |
| Latin America | 46 | 2.5% |
| Northern Europe | 49 | 2.6% |
| South America | 46 | 2.5% |
| Western Europe | 7 | 0.4% | View All 9 Rows |
Sex and Age in Horse Shoe
Sex and Age in Horse Shoe
The most populous age groups in Horse Shoe are 70 to 74 Years (147 | 17.3%) for men and 65 to 69 Years (121 | 12.0%) for women.
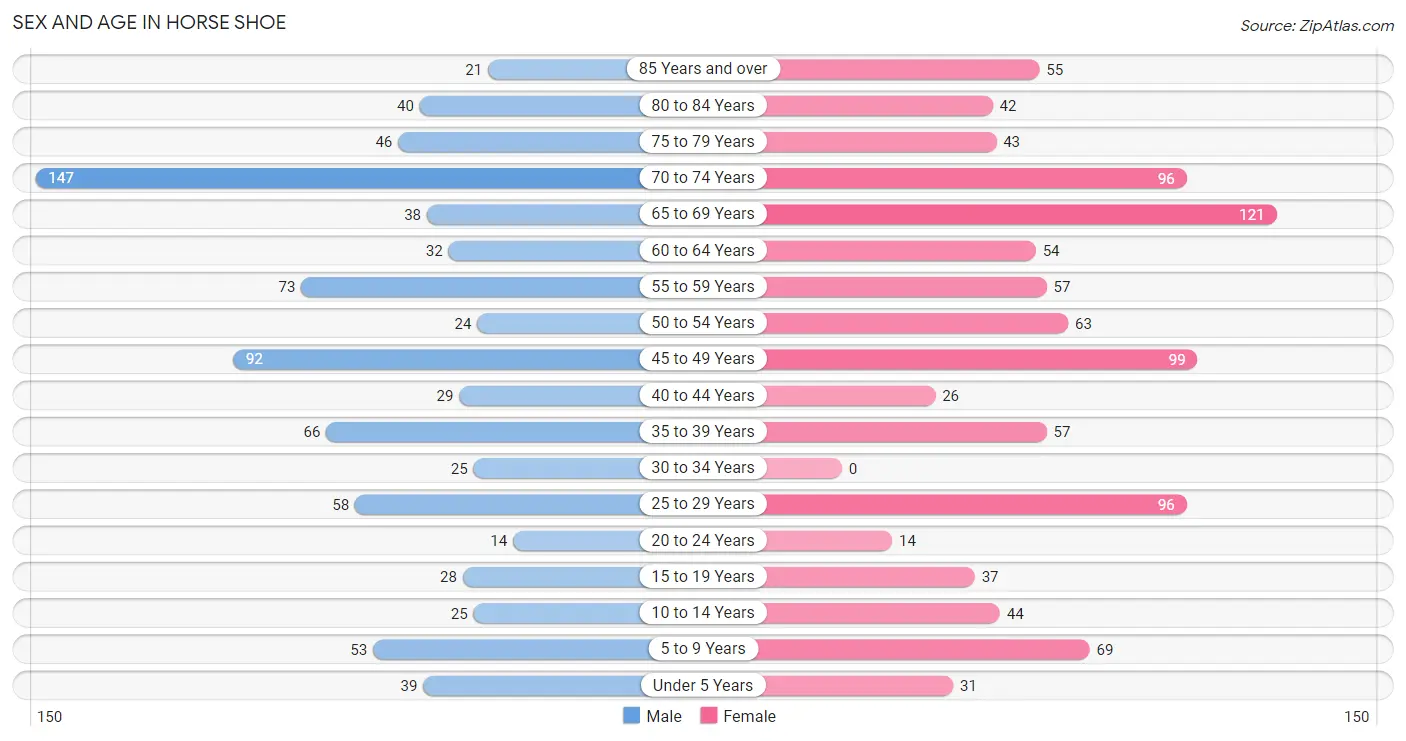
| Age Bracket | Male | Female |
| Under 5 Years | 39 (4.6%) | 31 (3.1%) |
| 5 to 9 Years | 53 (6.2%) | 69 (6.9%) |
| 10 to 14 Years | 25 (2.9%) | 44 (4.4%) |
| 15 to 19 Years | 28 (3.3%) | 37 (3.7%) |
| 20 to 24 Years | 14 (1.7%) | 14 (1.4%) |
| 25 to 29 Years | 58 (6.8%) | 96 (9.6%) |
| 30 to 34 Years | 25 (2.9%) | 0 (0.0%) |
| 35 to 39 Years | 66 (7.8%) | 57 (5.7%) |
| 40 to 44 Years | 29 (3.4%) | 26 (2.6%) |
| 45 to 49 Years | 92 (10.8%) | 99 (9.9%) |
| 50 to 54 Years | 24 (2.8%) | 63 (6.3%) |
| 55 to 59 Years | 73 (8.6%) | 57 (5.7%) |
| 60 to 64 Years | 32 (3.8%) | 54 (5.4%) |
| 65 to 69 Years | 38 (4.5%) | 121 (12.0%) |
| 70 to 74 Years | 147 (17.3%) | 96 (9.6%) |
| 75 to 79 Years | 46 (5.4%) | 43 (4.3%) |
| 80 to 84 Years | 40 (4.7%) | 42 (4.2%) |
| 85 Years and over | 21 (2.5%) | 55 (5.5%) |
| Total | 850 (100.0%) | 1,004 (100.0%) |
Families and Households in Horse Shoe
Median Family Size in Horse Shoe
The median family size in Horse Shoe is 2.65 persons per family, with married-couple families (520 | 84.4%) accounting for the largest median family size of 2.74 persons per family. On the other hand, single female/mother families (81 | 13.2%) represent the smallest median family size with 2.15 persons per family.
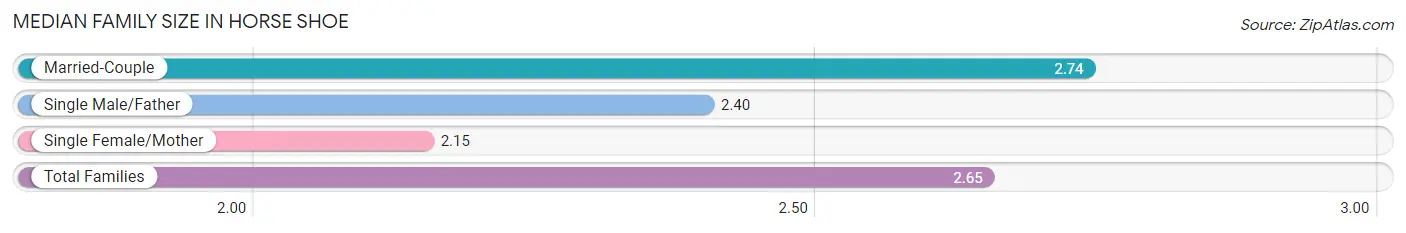
| Family Type | # Families | Family Size |
| Married-Couple | 520 (84.4%) | 2.74 |
| Single Male/Father | 15 (2.4%) | 2.40 |
| Single Female/Mother | 81 (13.2%) | 2.15 |
| Total Families | 616 (100.0%) | 2.65 |
Median Household Size in Horse Shoe
The median household size in Horse Shoe is 2.36 persons per household, with married-couple households (520 | 66.2%) accounting for the largest median household size of 2.74 persons per household. non-family households (170 | 21.6%) represent the smallest median household size with 1.29 persons per household.
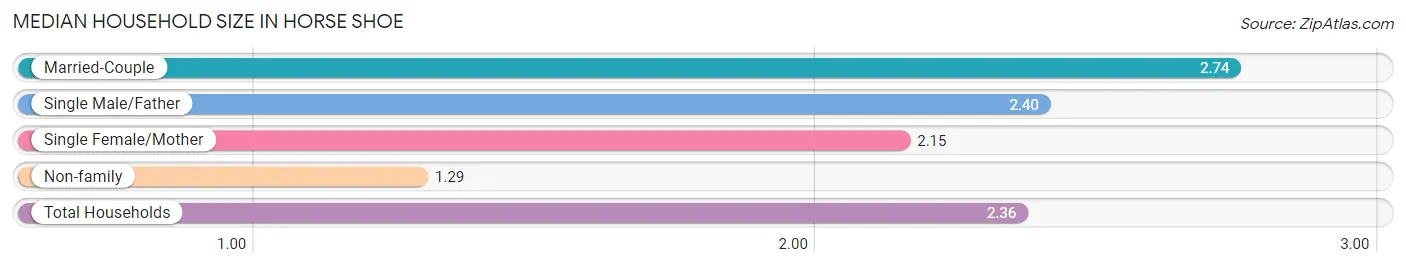
| Household Type | # Households | Household Size |
| Married-Couple | 520 (66.2%) | 2.74 |
| Single Male/Father | 15 (1.9%) | 2.40 |
| Single Female/Mother | 81 (10.3%) | 2.15 |
| Non-family | 170 (21.6%) | 1.29 |
| Total Households | 786 (100.0%) | 2.36 |
Household Size by Marriage Status in Horse Shoe
Out of a total of 786 households in Horse Shoe, 616 (78.4%) are family households, while 170 (21.6%) are nonfamily households. The most numerous type of family households are 2-person households, comprising 415, and the most common type of nonfamily households are 1-person households, comprising 125.
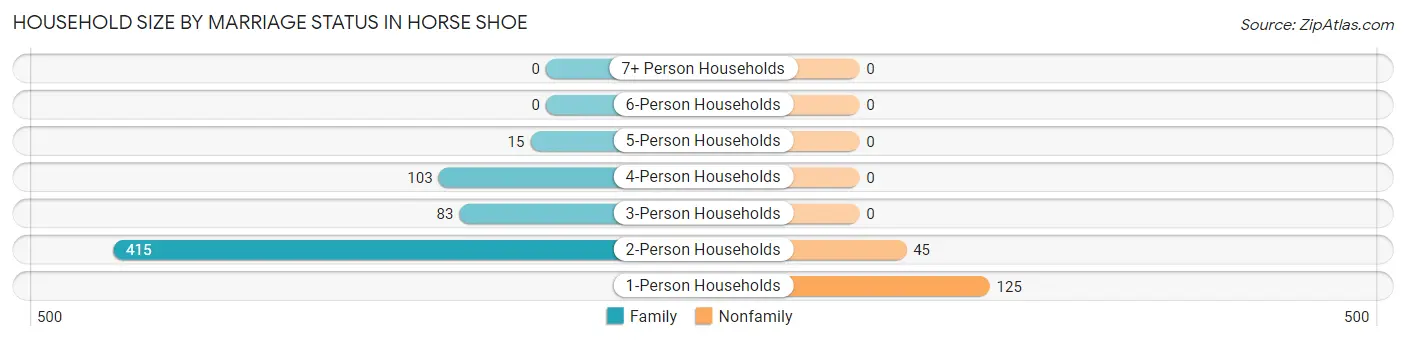
| Household Size | Family Households | Nonfamily Households |
| 1-Person Households | - | 125 (15.9%) |
| 2-Person Households | 415 (52.8%) | 45 (5.7%) |
| 3-Person Households | 83 (10.6%) | 0 (0.0%) |
| 4-Person Households | 103 (13.1%) | 0 (0.0%) |
| 5-Person Households | 15 (1.9%) | 0 (0.0%) |
| 6-Person Households | 0 (0.0%) | 0 (0.0%) |
| 7+ Person Households | 0 (0.0%) | 0 (0.0%) |
| Total | 616 (78.4%) | 170 (21.6%) |
Female Fertility in Horse Shoe
Fertility by Age in Horse Shoe
| Age Bracket | Women with Births | Births / 1,000 Women |
| 15 to 19 years | 0 (0.0%) | 0.0 |
| 20 to 34 years | 0 (0.0%) | 0.0 |
| 35 to 50 years | 0 (0.0%) | 0.0 |
| Total | 0 (0.0%) | 0.0 |
Fertility by Age by Marriage Status in Horse Shoe
| Age Bracket | Married | Unmarried |
| 15 to 19 years | 0 (0.0%) | 0 (0.0%) |
| 20 to 34 years | 0 (0.0%) | 0 (0.0%) |
| 35 to 50 years | 0 (0.0%) | 0 (0.0%) |
| Total | 0 (0.0%) | 0 (0.0%) |
Fertility by Education in Horse Shoe
| Educational Attainment | Women with Births | Births / 1,000 Women |
| Less than High School | 0 (0.0%) | 0.0 |
| High School Diploma | 0 (0.0%) | 0.0 |
| College or Associate's Degree | 0 (0.0%) | 0.0 |
| Bachelor's Degree | 0 (0.0%) | 0.0 |
| Graduate Degree | 0 (0.0%) | 0.0 |
| Total | 0 (0.0%) | 0.0 |
Fertility by Education by Marriage Status in Horse Shoe
| Educational Attainment | Married | Unmarried |
| Less than High School | 0 (0.0%) | 0 (0.0%) |
| High School Diploma | 0 (0.0%) | 0 (0.0%) |
| College or Associate's Degree | 0 (0.0%) | 0 (0.0%) |
| Bachelor's Degree | 0 (0.0%) | 0 (0.0%) |
| Graduate Degree | 0 (0.0%) | 0 (0.0%) |
| Total | 0 (0.0%) | 0 (0.0%) |
Employment Characteristics in Horse Shoe
Employment by Class of Employer in Horse Shoe
Among the 760 employed individuals in Horse Shoe, private company employees (489 | 64.3%), local government employees (79 | 10.4%), and self-employed (not incorporated) (73 | 9.6%) make up the most common classes of employment.
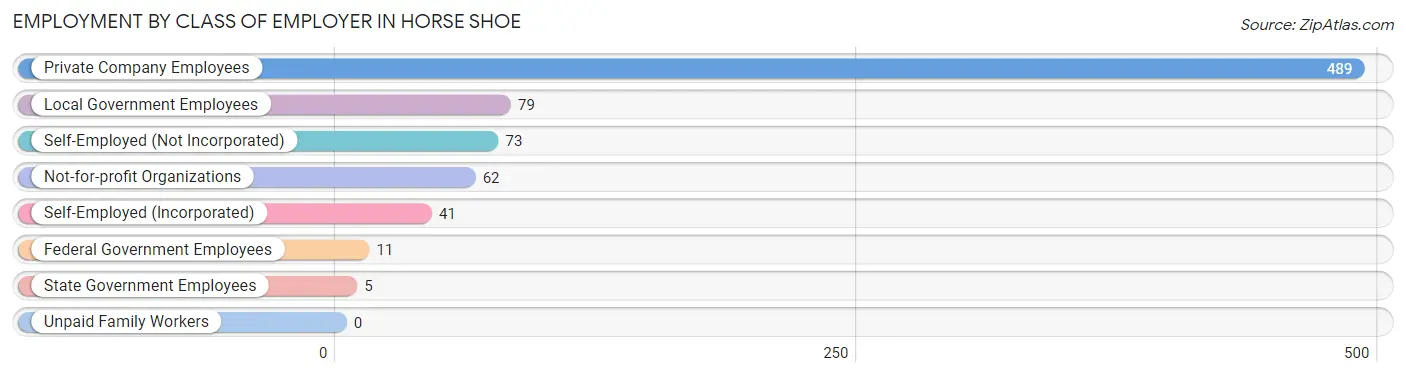
| Employer Class | # Employees | % Employees |
| Private Company Employees | 489 | 64.3% |
| Self-Employed (Incorporated) | 41 | 5.4% |
| Self-Employed (Not Incorporated) | 73 | 9.6% |
| Not-for-profit Organizations | 62 | 8.2% |
| Local Government Employees | 79 | 10.4% |
| State Government Employees | 5 | 0.7% |
| Federal Government Employees | 11 | 1.5% |
| Unpaid Family Workers | 0 | 0.0% |
| Total | 760 | 100.0% |
Employment Status by Age in Horse Shoe
According to the labor force statistics for Horse Shoe, out of the total population over 16 years of age (1,593), 49.8% or 793 individuals are in the labor force, with 3.2% or 25 of them unemployed. The age group with the highest labor force participation rate is 25 to 29 years, with 89.0% or 137 individuals in the labor force. Within the labor force, the 35 to 44 years age range has the highest percentage of unemployed individuals, with 17.7% or 27 of them being unemployed.
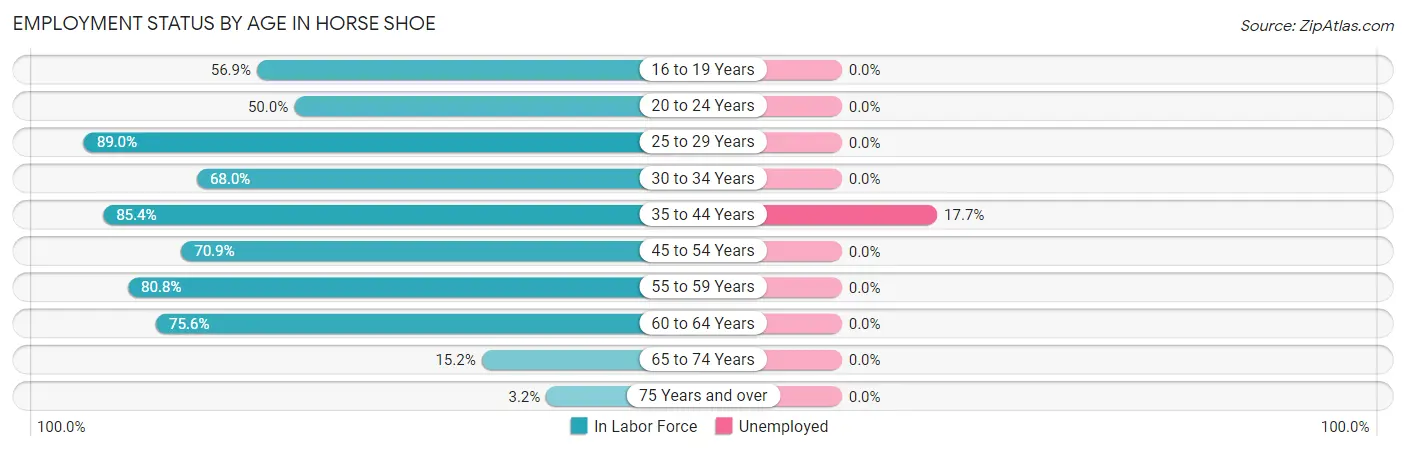
| Age Bracket | In Labor Force | Unemployed |
| 16 to 19 Years | 37 (56.9%) | 0 (0.0%) |
| 20 to 24 Years | 14 (50.0%) | 0 (0.0%) |
| 25 to 29 Years | 137 (89.0%) | 0 (0.0%) |
| 30 to 34 Years | 17 (68.0%) | 0 (0.0%) |
| 35 to 44 Years | 152 (85.4%) | 27 (17.7%) |
| 45 to 54 Years | 197 (70.9%) | 0 (0.0%) |
| 55 to 59 Years | 105 (80.8%) | 0 (0.0%) |
| 60 to 64 Years | 65 (75.6%) | 0 (0.0%) |
| 65 to 74 Years | 61 (15.2%) | 0 (0.0%) |
| 75 Years and over | 8 (3.2%) | 0 (0.0%) |
| Total | 793 (49.8%) | 25 (3.2%) |
Employment Status by Educational Attainment in Horse Shoe
According to labor force statistics for Horse Shoe, 79.1% of individuals (673) out of the total population between 25 and 64 years of age (851) are in the labor force, with 3.8% or 26 of them being unemployed. The group with the highest labor force participation rate are those with the educational attainment of bachelor's degree or higher, with 82.9% or 334 individuals in the labor force. Within the labor force, individuals with college / associate degree education have the highest percentage of unemployment, with 8.6% or 26 of them being unemployed.
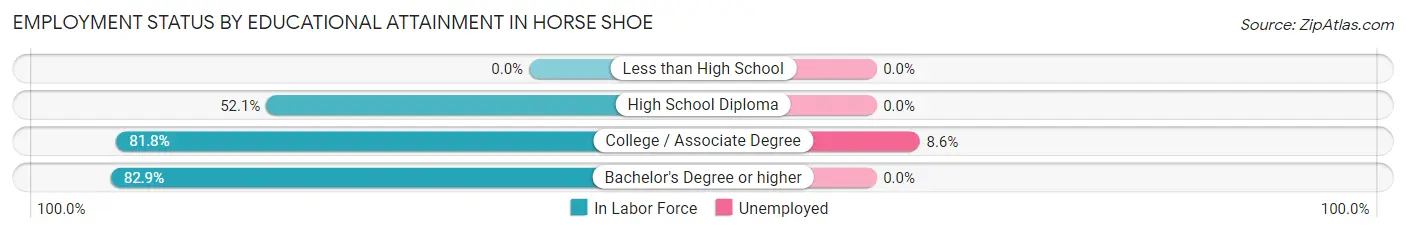
| Educational Attainment | In Labor Force | Unemployed |
| Less than High School | 0 (0.0%) | 0 (0.0%) |
| High School Diploma | 37 (52.1%) | 0 (0.0%) |
| College / Associate Degree | 302 (81.8%) | 32 (8.6%) |
| Bachelor's Degree or higher | 334 (82.9%) | 0 (0.0%) |
| Total | 673 (79.1%) | 32 (3.8%) |
Employment Occupations by Sex in Horse Shoe
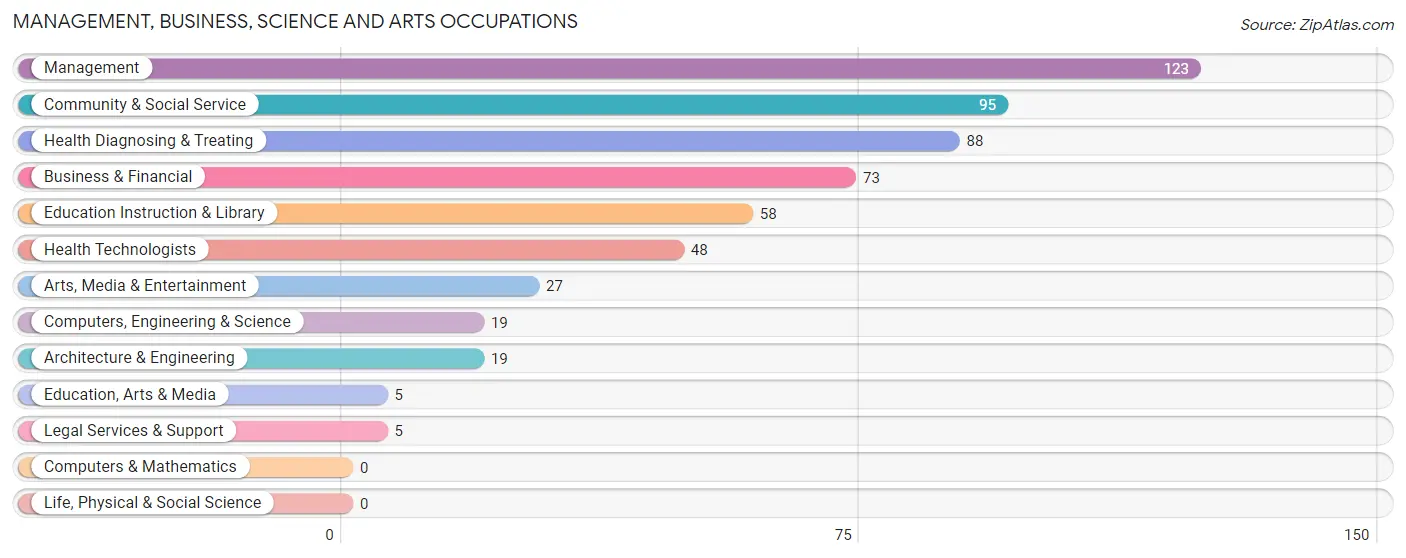
Management, Business, Science and Arts Occupations
The most common Management, Business, Science and Arts occupations in Horse Shoe are Management (123 | 16.3%), Community & Social Service (95 | 12.6%), Health Diagnosing & Treating (88 | 11.6%), Business & Financial (73 | 9.6%), and Education Instruction & Library (58 | 7.7%).
Management, Business, Science and Arts Occupations by Sex
Within the Management, Business, Science and Arts occupations in Horse Shoe, the most male-oriented occupations are Management (65.0%), Computers, Engineering & Science (57.9%), and Architecture & Engineering (57.9%), while the most female-oriented occupations are Education, Arts & Media (100.0%), Legal Services & Support (100.0%), and Education Instruction & Library (100.0%).
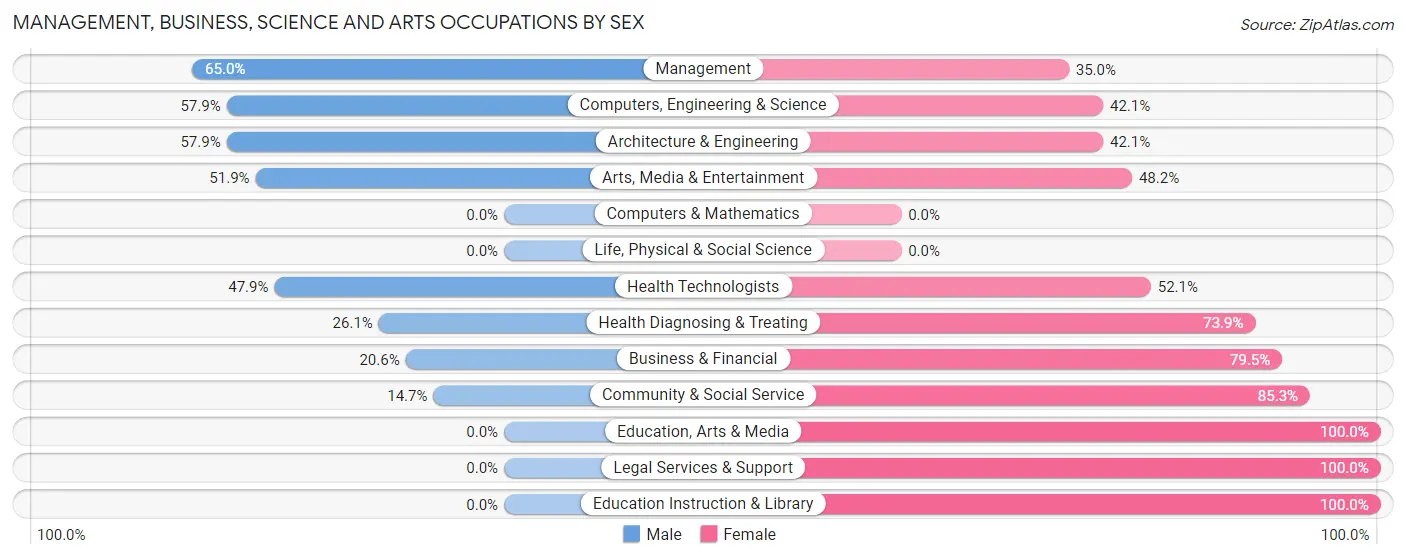
| Occupation | Male | Female |
| Management | 80 (65.0%) | 43 (35.0%) |
| Business & Financial | 15 (20.5%) | 58 (79.4%) |
| Computers, Engineering & Science | 11 (57.9%) | 8 (42.1%) |
| Computers & Mathematics | 0 (0.0%) | 0 (0.0%) |
| Architecture & Engineering | 11 (57.9%) | 8 (42.1%) |
| Life, Physical & Social Science | 0 (0.0%) | 0 (0.0%) |
| Community & Social Service | 14 (14.7%) | 81 (85.3%) |
| Education, Arts & Media | 0 (0.0%) | 5 (100.0%) |
| Legal Services & Support | 0 (0.0%) | 5 (100.0%) |
| Education Instruction & Library | 0 (0.0%) | 58 (100.0%) |
| Arts, Media & Entertainment | 14 (51.8%) | 13 (48.1%) |
| Health Diagnosing & Treating | 23 (26.1%) | 65 (73.9%) |
| Health Technologists | 23 (47.9%) | 25 (52.1%) |
| Total (Category) | 143 (35.9%) | 255 (64.1%) |
| Total (Overall) | 335 (44.3%) | 422 (55.7%) |
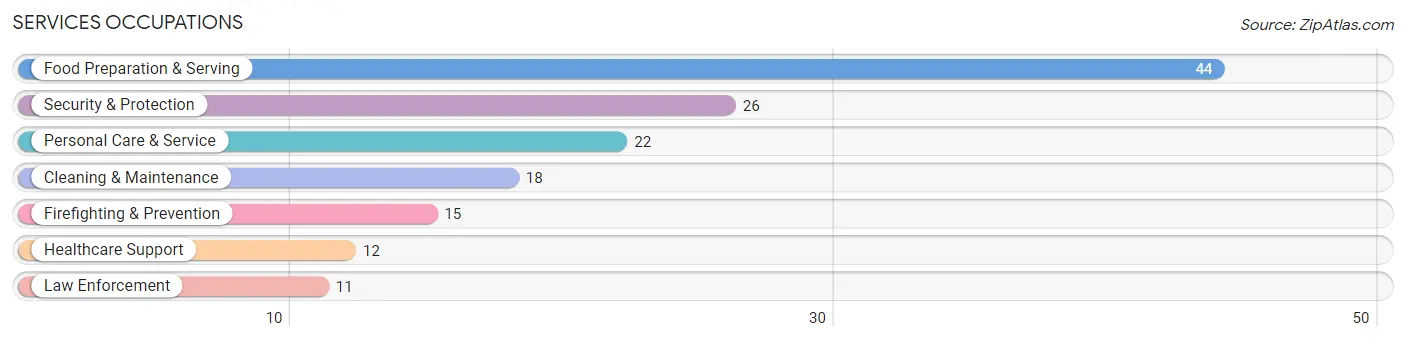
Services Occupations
The most common Services occupations in Horse Shoe are Food Preparation & Serving (44 | 5.8%), Security & Protection (26 | 3.4%), Personal Care & Service (22 | 2.9%), Cleaning & Maintenance (18 | 2.4%), and Firefighting & Prevention (15 | 2.0%).
Services Occupations by Sex
Within the Services occupations in Horse Shoe, the most male-oriented occupations are Security & Protection (100.0%), Firefighting & Prevention (100.0%), and Law Enforcement (100.0%), while the most female-oriented occupations are Healthcare Support (100.0%), Personal Care & Service (100.0%), and Food Preparation & Serving (68.2%).
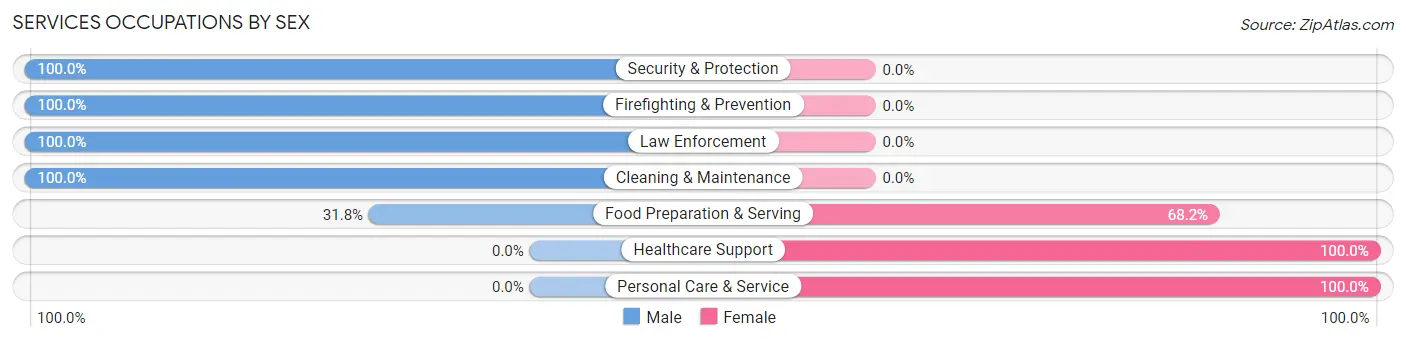
| Occupation | Male | Female |
| Healthcare Support | 0 (0.0%) | 12 (100.0%) |
| Security & Protection | 26 (100.0%) | 0 (0.0%) |
| Firefighting & Prevention | 15 (100.0%) | 0 (0.0%) |
| Law Enforcement | 11 (100.0%) | 0 (0.0%) |
| Food Preparation & Serving | 14 (31.8%) | 30 (68.2%) |
| Cleaning & Maintenance | 18 (100.0%) | 0 (0.0%) |
| Personal Care & Service | 0 (0.0%) | 22 (100.0%) |
| Total (Category) | 58 (47.5%) | 64 (52.5%) |
| Total (Overall) | 335 (44.3%) | 422 (55.7%) |
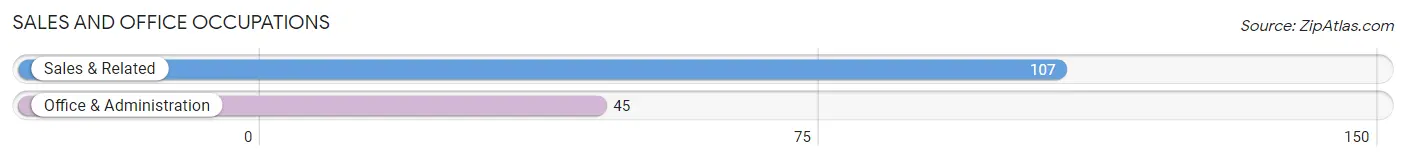
Sales and Office Occupations
The most common Sales and Office occupations in Horse Shoe are Sales & Related (107 | 14.1%), and Office & Administration (45 | 5.9%).
Sales and Office Occupations by Sex
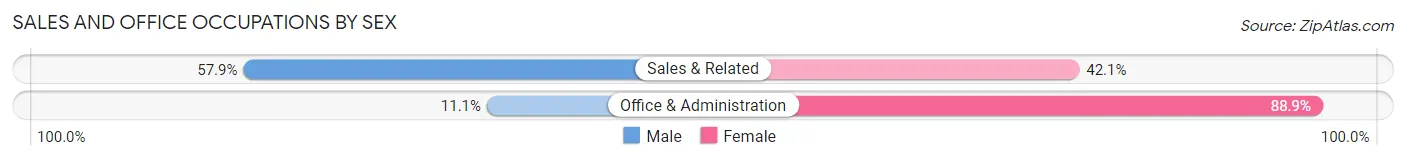
| Occupation | Male | Female |
| Sales & Related | 62 (57.9%) | 45 (42.1%) |
| Office & Administration | 5 (11.1%) | 40 (88.9%) |
| Total (Category) | 67 (44.1%) | 85 (55.9%) |
| Total (Overall) | 335 (44.3%) | 422 (55.7%) |
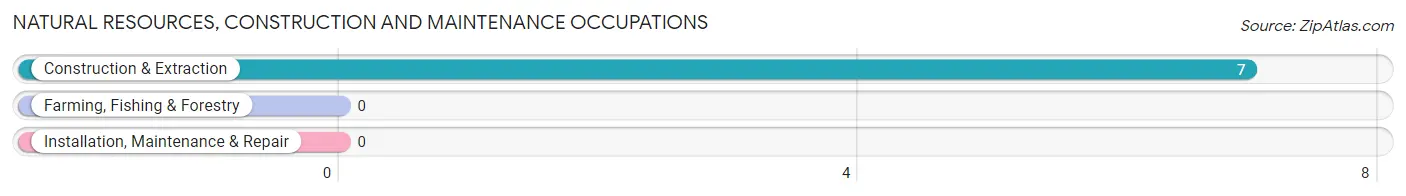
Natural Resources, Construction and Maintenance Occupations
The most common Natural Resources, Construction and Maintenance occupations in Horse Shoe are , and Construction & Extraction (7 | 0.9%).
Natural Resources, Construction and Maintenance Occupations by Sex
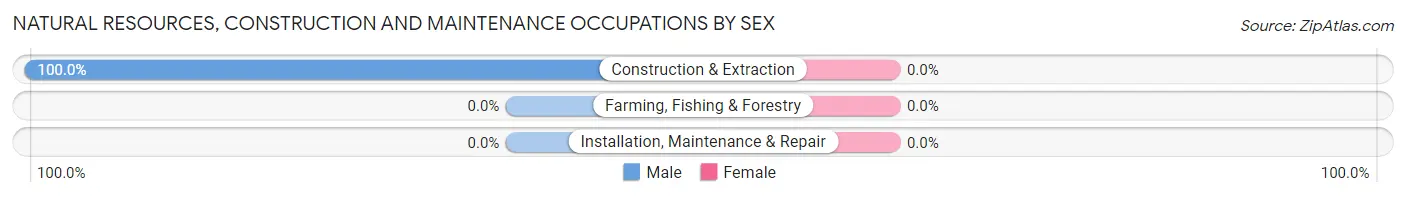
| Occupation | Male | Female |
| Farming, Fishing & Forestry | 0 (0.0%) | 0 (0.0%) |
| Construction & Extraction | 7 (100.0%) | 0 (0.0%) |
| Installation, Maintenance & Repair | 0 (0.0%) | 0 (0.0%) |
| Total (Category) | 7 (100.0%) | 0 (0.0%) |
| Total (Overall) | 335 (44.3%) | 422 (55.7%) |
Production, Transportation and Moving Occupations
The most common Production, Transportation and Moving occupations in Horse Shoe are , and Production (78 | 10.3%).
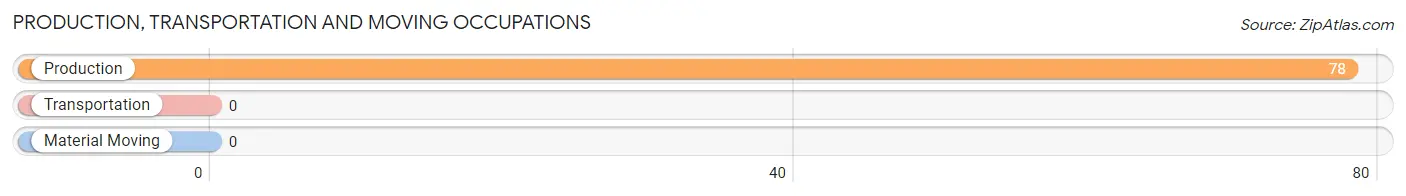
Production, Transportation and Moving Occupations by Sex
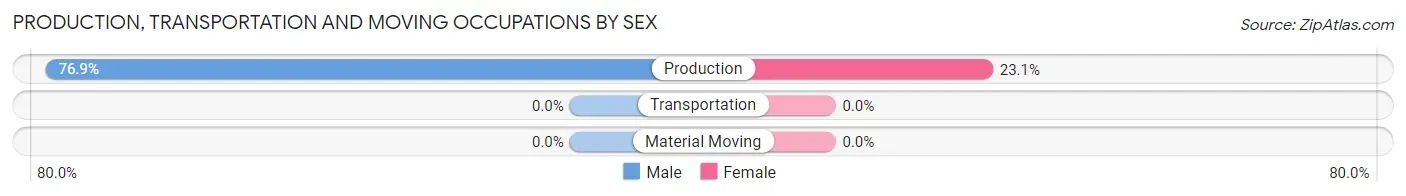
| Occupation | Male | Female |
| Production | 60 (76.9%) | 18 (23.1%) |
| Transportation | 0 (0.0%) | 0 (0.0%) |
| Material Moving | 0 (0.0%) | 0 (0.0%) |
| Total (Category) | 60 (76.9%) | 18 (23.1%) |
| Total (Overall) | 335 (44.3%) | 422 (55.7%) |
Employment Industries by Sex in Horse Shoe
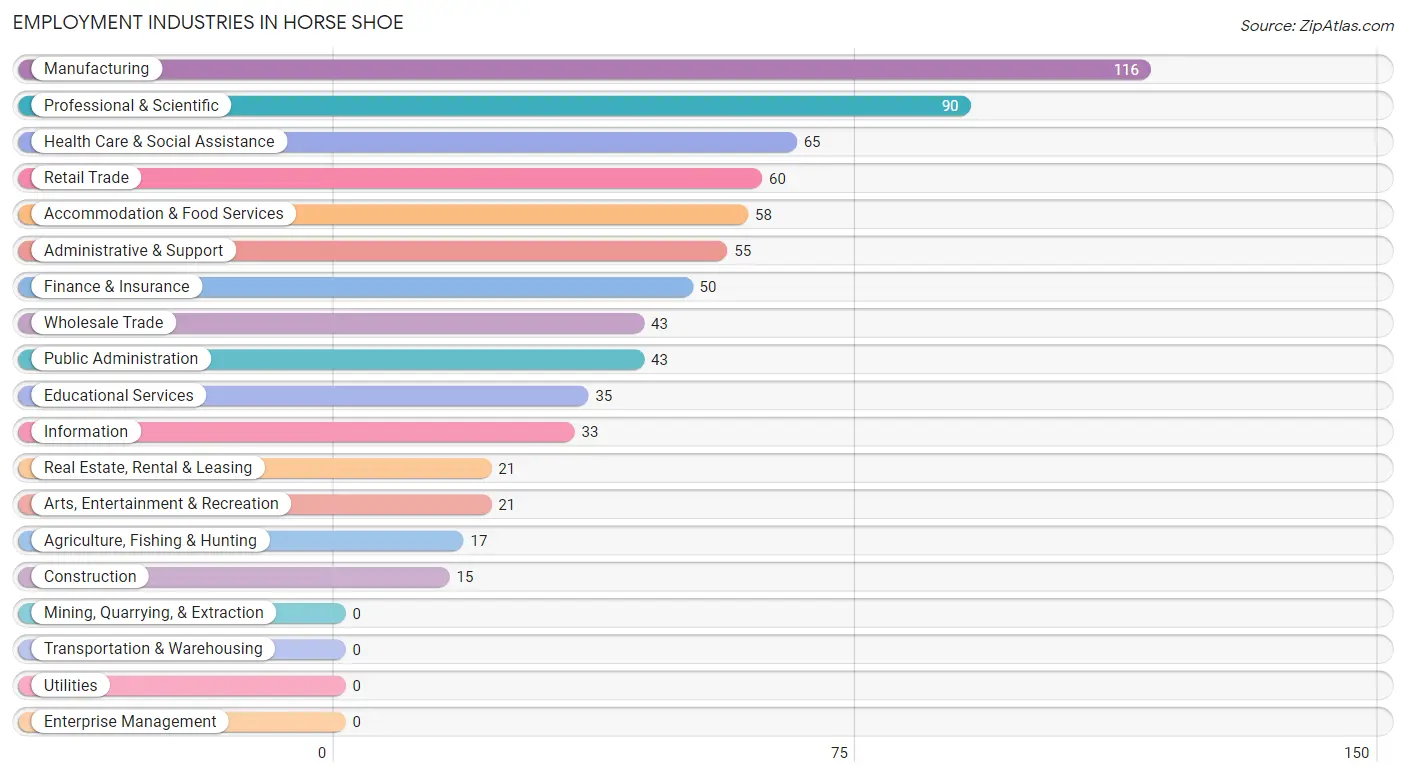
Employment Industries in Horse Shoe
The major employment industries in Horse Shoe include Manufacturing (116 | 15.3%), Professional & Scientific (90 | 11.9%), Health Care & Social Assistance (65 | 8.6%), Retail Trade (60 | 7.9%), and Accommodation & Food Services (58 | 7.7%).
Employment Industries by Sex in Horse Shoe
The Horse Shoe industries that see more men than women are Agriculture, Fishing & Hunting (100.0%), Public Administration (88.4%), and Manufacturing (77.6%), whereas the industries that tend to have a higher number of women are Construction (100.0%), Educational Services (91.4%), and Health Care & Social Assistance (90.8%).
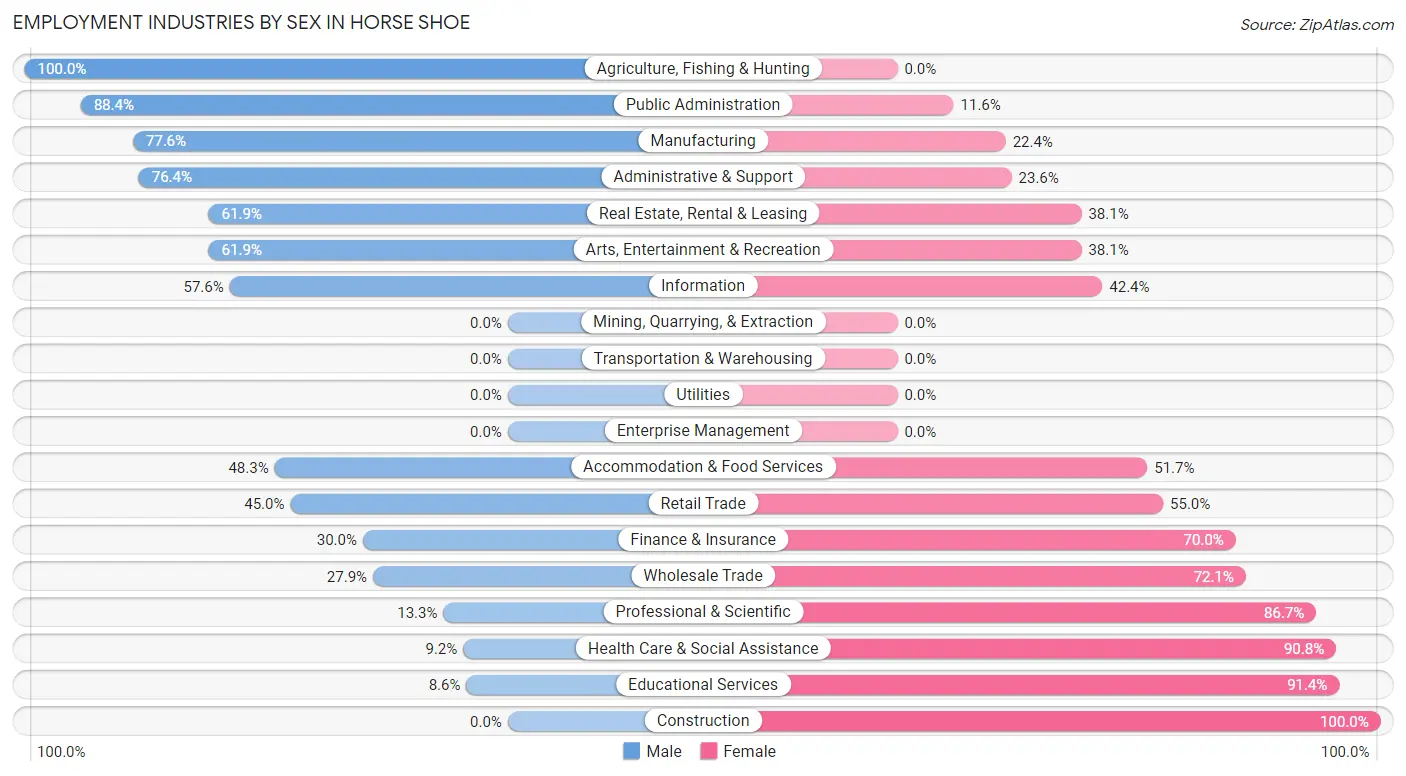
| Industry | Male | Female |
| Agriculture, Fishing & Hunting | 17 (100.0%) | 0 (0.0%) |
| Mining, Quarrying, & Extraction | 0 (0.0%) | 0 (0.0%) |
| Construction | 0 (0.0%) | 15 (100.0%) |
| Manufacturing | 90 (77.6%) | 26 (22.4%) |
| Wholesale Trade | 12 (27.9%) | 31 (72.1%) |
| Retail Trade | 27 (45.0%) | 33 (55.0%) |
| Transportation & Warehousing | 0 (0.0%) | 0 (0.0%) |
| Utilities | 0 (0.0%) | 0 (0.0%) |
| Information | 19 (57.6%) | 14 (42.4%) |
| Finance & Insurance | 15 (30.0%) | 35 (70.0%) |
| Real Estate, Rental & Leasing | 13 (61.9%) | 8 (38.1%) |
| Professional & Scientific | 12 (13.3%) | 78 (86.7%) |
| Enterprise Management | 0 (0.0%) | 0 (0.0%) |
| Administrative & Support | 42 (76.4%) | 13 (23.6%) |
| Educational Services | 3 (8.6%) | 32 (91.4%) |
| Health Care & Social Assistance | 6 (9.2%) | 59 (90.8%) |
| Arts, Entertainment & Recreation | 13 (61.9%) | 8 (38.1%) |
| Accommodation & Food Services | 28 (48.3%) | 30 (51.7%) |
| Public Administration | 38 (88.4%) | 5 (11.6%) |
| Total | 335 (44.3%) | 422 (55.7%) |
Education in Horse Shoe
School Enrollment in Horse Shoe
The most common levels of schooling among the 386 students in Horse Shoe are elementary school (115 | 29.8%), high school (65 | 16.8%), and nursery / preschool (59 | 15.3%).
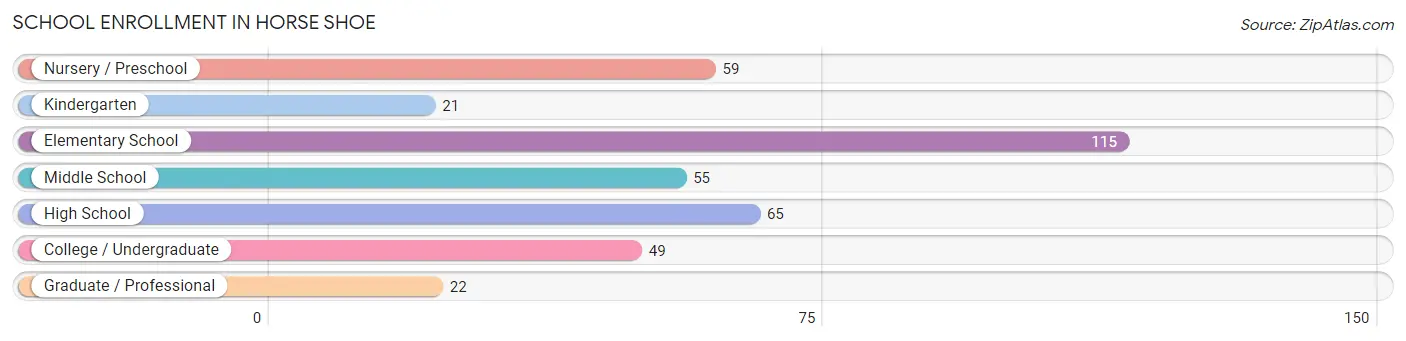
| School Level | # Students | % Students |
| Nursery / Preschool | 59 | 15.3% |
| Kindergarten | 21 | 5.4% |
| Elementary School | 115 | 29.8% |
| Middle School | 55 | 14.2% |
| High School | 65 | 16.8% |
| College / Undergraduate | 49 | 12.7% |
| Graduate / Professional | 22 | 5.7% |
| Total | 386 | 100.0% |
School Enrollment by Age by Funding Source in Horse Shoe
Out of a total of 386 students who are enrolled in schools in Horse Shoe, 49 (12.7%) attend a private institution, while the remaining 337 (87.3%) are enrolled in public schools. The age group of 3 to 4 year olds has the highest likelihood of being enrolled in private schools, with 33 (55.9% in the age bracket) enrolled. Conversely, the age group of 10 to 14 year olds has the lowest likelihood of being enrolled in a private school, with 69 (100.0% in the age bracket) attending a public institution.
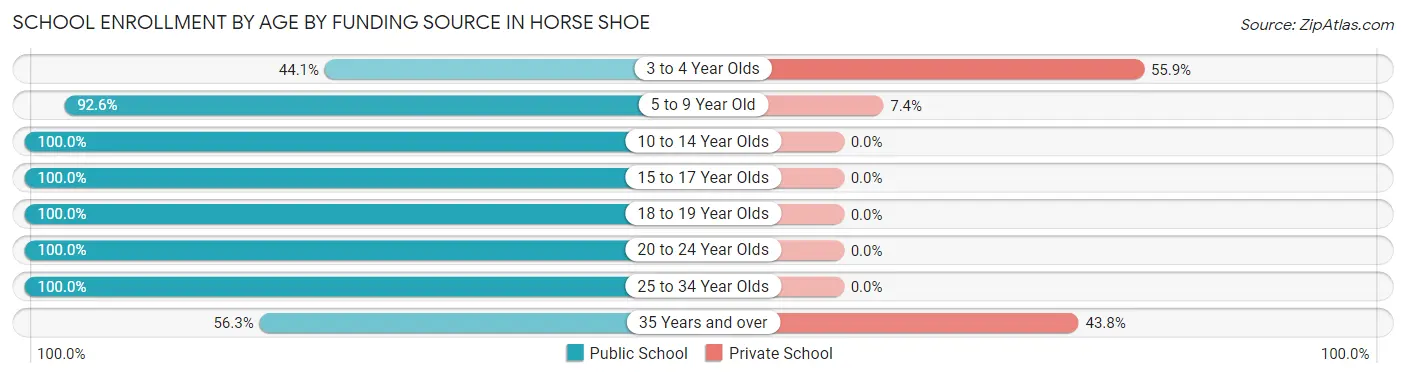
| Age Bracket | Public School | Private School |
| 3 to 4 Year Olds | 26 (44.1%) | 33 (55.9%) |
| 5 to 9 Year Old | 113 (92.6%) | 9 (7.4%) |
| 10 to 14 Year Olds | 69 (100.0%) | 0 (0.0%) |
| 15 to 17 Year Olds | 32 (100.0%) | 0 (0.0%) |
| 18 to 19 Year Olds | 33 (100.0%) | 0 (0.0%) |
| 20 to 24 Year Olds | 14 (100.0%) | 0 (0.0%) |
| 25 to 34 Year Olds | 41 (100.0%) | 0 (0.0%) |
| 35 Years and over | 9 (56.2%) | 7 (43.8%) |
| Total | 337 (87.3%) | 49 (12.7%) |
Educational Attainment by Field of Study in Horse Shoe
Education (90 | 12.1%), social sciences (82 | 11.0%), science & technology (82 | 11.0%), engineering (76 | 10.2%), and business (72 | 9.7%) are the most common fields of study among 746 individuals in Horse Shoe who have obtained a bachelor's degree or higher.
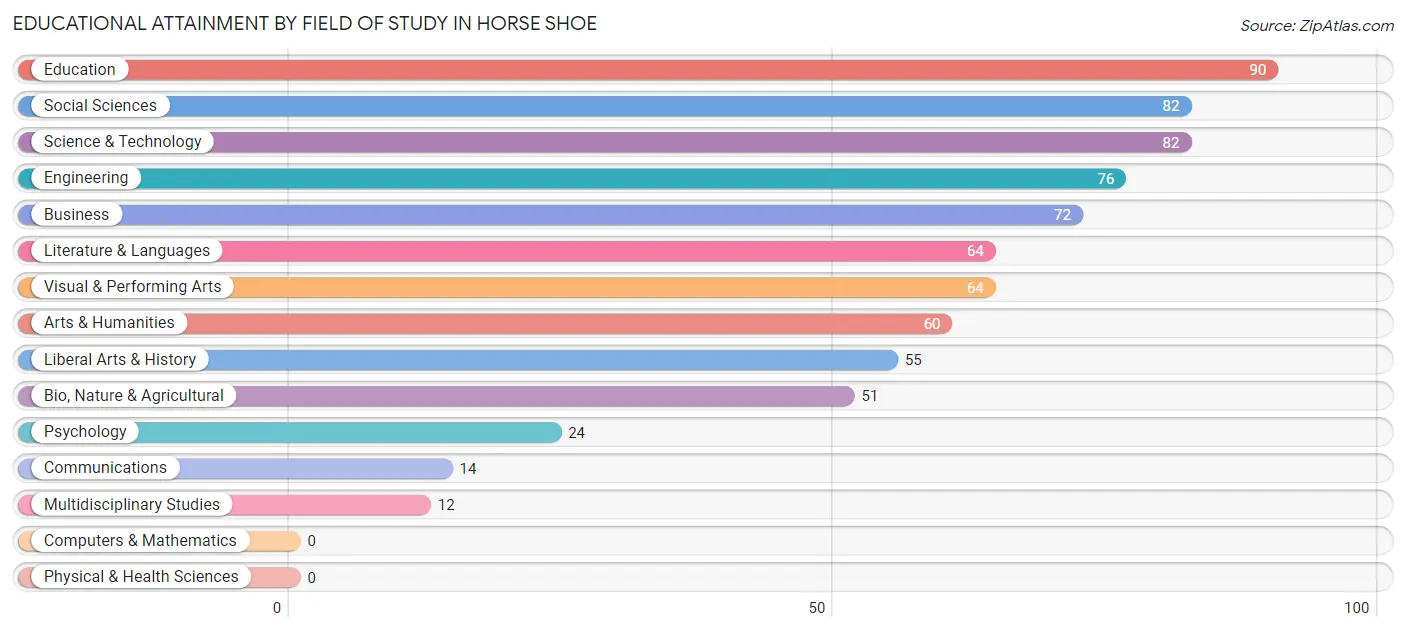
| Field of Study | # Graduates | % Graduates |
| Computers & Mathematics | 0 | 0.0% |
| Bio, Nature & Agricultural | 51 | 6.8% |
| Physical & Health Sciences | 0 | 0.0% |
| Psychology | 24 | 3.2% |
| Social Sciences | 82 | 11.0% |
| Engineering | 76 | 10.2% |
| Multidisciplinary Studies | 12 | 1.6% |
| Science & Technology | 82 | 11.0% |
| Business | 72 | 9.7% |
| Education | 90 | 12.1% |
| Literature & Languages | 64 | 8.6% |
| Liberal Arts & History | 55 | 7.4% |
| Visual & Performing Arts | 64 | 8.6% |
| Communications | 14 | 1.9% |
| Arts & Humanities | 60 | 8.0% |
| Total | 746 | 100.0% |
Transportation & Commute in Horse Shoe
Vehicle Availability by Sex in Horse Shoe
The most prevalent vehicle ownership categories in Horse Shoe are males with 2 vehicles (192, accounting for 55.5%) and females with 2 vehicles (238, making up 46.4%).
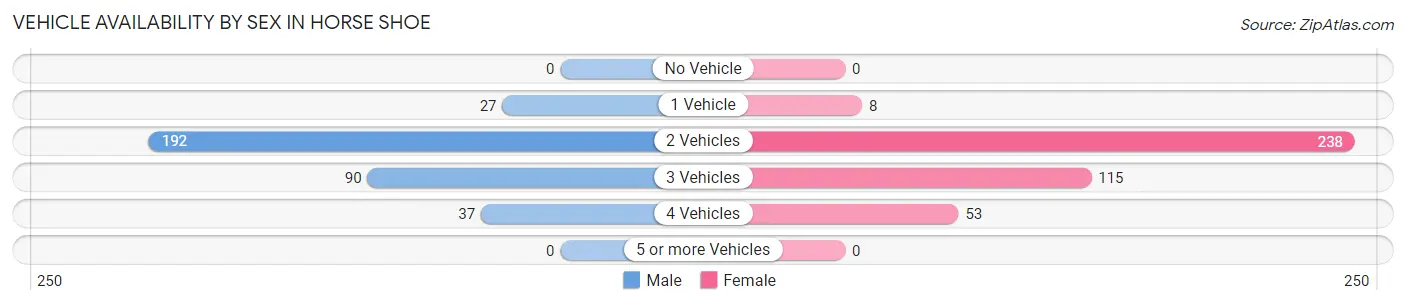
| Vehicles Available | Male | Female |
| No Vehicle | 0 (0.0%) | 0 (0.0%) |
| 1 Vehicle | 27 (7.8%) | 8 (1.9%) |
| 2 Vehicles | 192 (55.5%) | 238 (57.5%) |
| 3 Vehicles | 90 (26.0%) | 115 (27.8%) |
| 4 Vehicles | 37 (10.7%) | 53 (12.8%) |
| 5 or more Vehicles | 0 (0.0%) | 0 (0.0%) |
| Total | 346 (100.0%) | 414 (100.0%) |
Commute Time in Horse Shoe
The most frequently occuring commute durations in Horse Shoe are 15 to 19 minutes (131 commuters, 19.1%), 20 to 24 minutes (109 commuters, 15.9%), and 10 to 14 minutes (99 commuters, 14.4%).
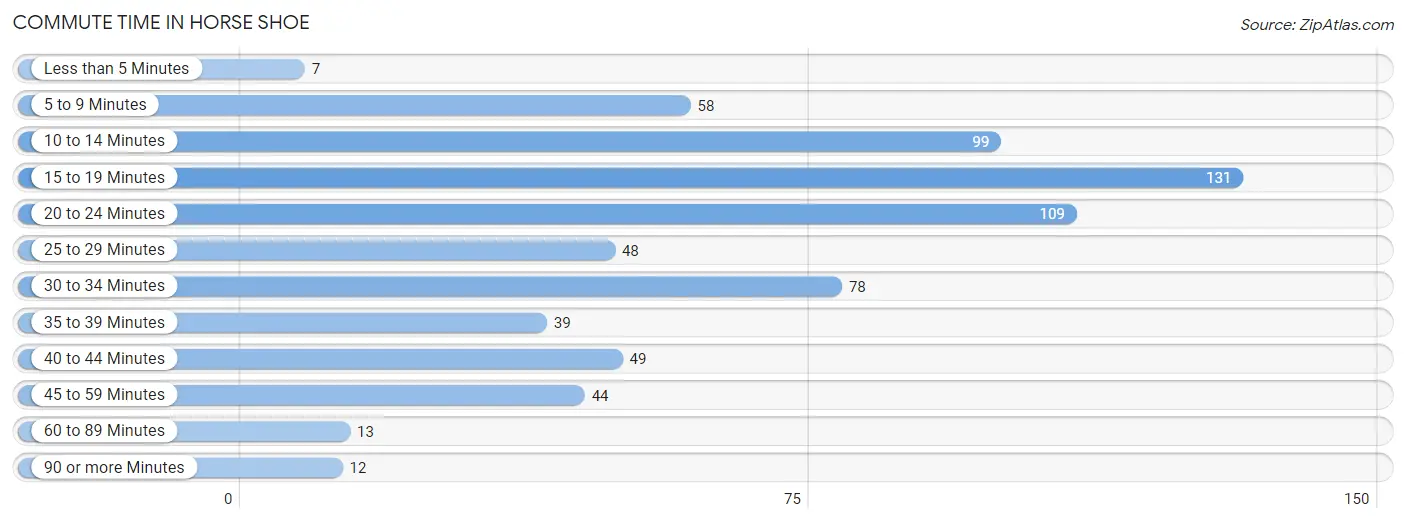
| Commute Time | # Commuters | % Commuters |
| Less than 5 Minutes | 7 | 1.0% |
| 5 to 9 Minutes | 58 | 8.4% |
| 10 to 14 Minutes | 99 | 14.4% |
| 15 to 19 Minutes | 131 | 19.1% |
| 20 to 24 Minutes | 109 | 15.9% |
| 25 to 29 Minutes | 48 | 7.0% |
| 30 to 34 Minutes | 78 | 11.4% |
| 35 to 39 Minutes | 39 | 5.7% |
| 40 to 44 Minutes | 49 | 7.1% |
| 45 to 59 Minutes | 44 | 6.4% |
| 60 to 89 Minutes | 13 | 1.9% |
| 90 or more Minutes | 12 | 1.8% |
Commute Time by Sex in Horse Shoe
The most common commute times in Horse Shoe are 15 to 19 minutes (49 commuters, 16.6%) for males and 15 to 19 minutes (82 commuters, 20.9%) for females.
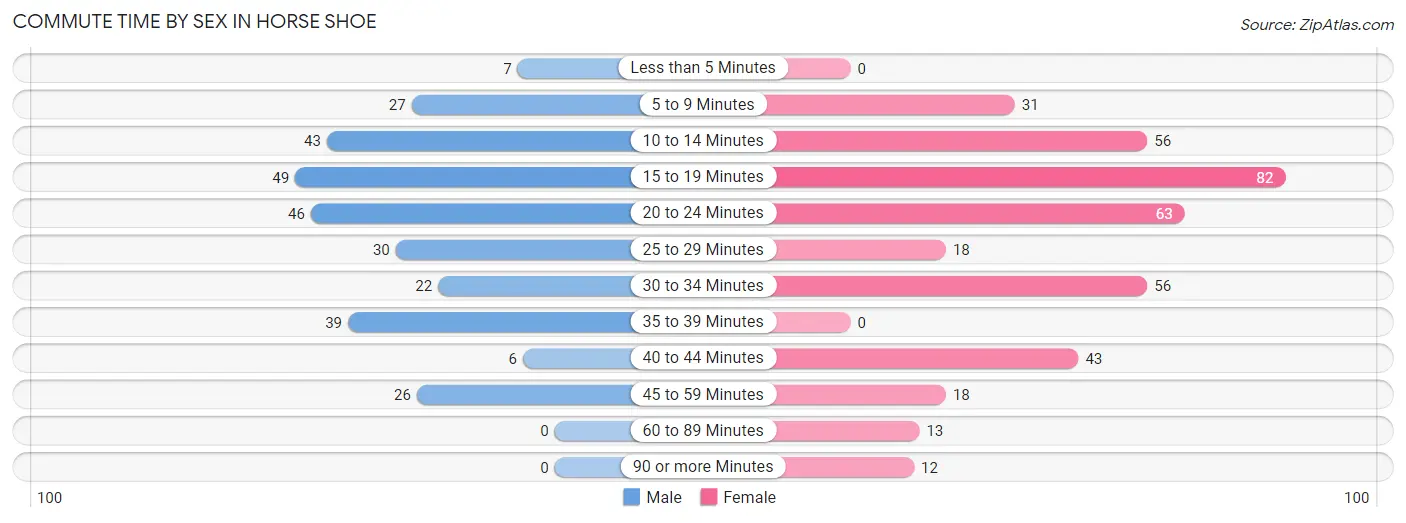
| Commute Time | Male | Female |
| Less than 5 Minutes | 7 (2.4%) | 0 (0.0%) |
| 5 to 9 Minutes | 27 (9.1%) | 31 (7.9%) |
| 10 to 14 Minutes | 43 (14.6%) | 56 (14.3%) |
| 15 to 19 Minutes | 49 (16.6%) | 82 (20.9%) |
| 20 to 24 Minutes | 46 (15.6%) | 63 (16.1%) |
| 25 to 29 Minutes | 30 (10.2%) | 18 (4.6%) |
| 30 to 34 Minutes | 22 (7.5%) | 56 (14.3%) |
| 35 to 39 Minutes | 39 (13.2%) | 0 (0.0%) |
| 40 to 44 Minutes | 6 (2.0%) | 43 (11.0%) |
| 45 to 59 Minutes | 26 (8.8%) | 18 (4.6%) |
| 60 to 89 Minutes | 0 (0.0%) | 13 (3.3%) |
| 90 or more Minutes | 0 (0.0%) | 12 (3.1%) |
Time of Departure to Work by Sex in Horse Shoe
The most frequent times of departure to work in Horse Shoe are 7:30 AM to 7:59 AM (61, 20.7%) for males and 7:00 AM to 7:29 AM (137, 34.9%) for females.
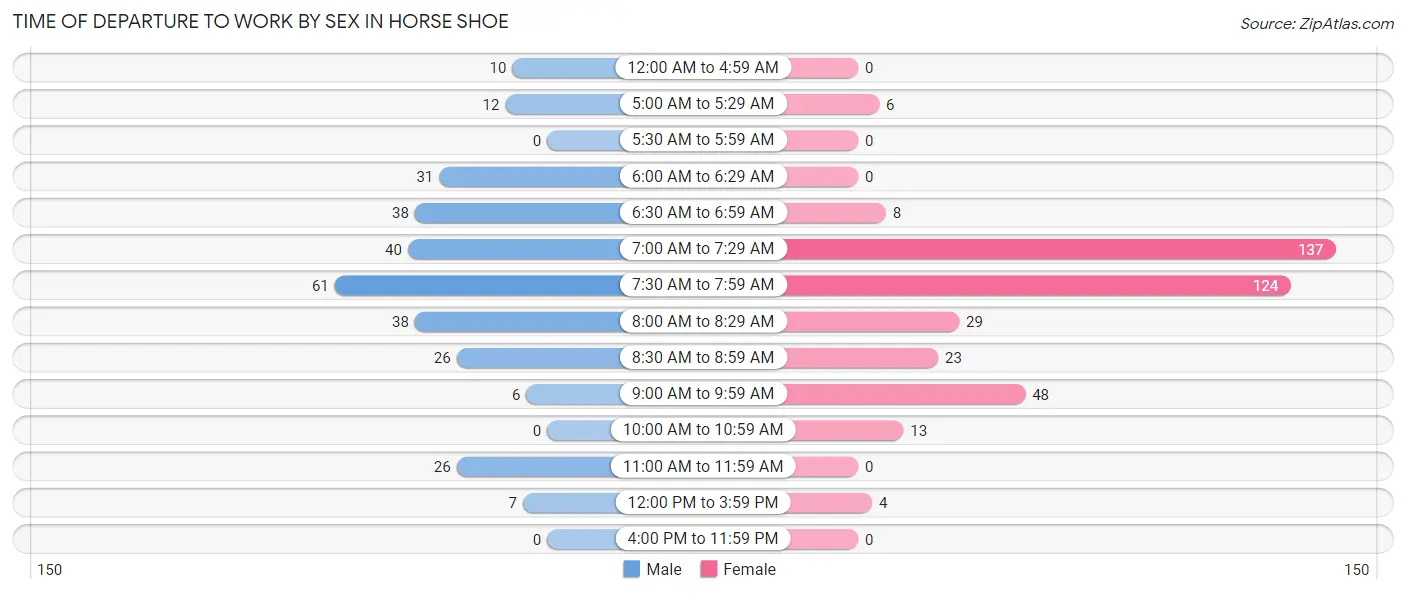
| Time of Departure | Male | Female |
| 12:00 AM to 4:59 AM | 10 (3.4%) | 0 (0.0%) |
| 5:00 AM to 5:29 AM | 12 (4.1%) | 6 (1.5%) |
| 5:30 AM to 5:59 AM | 0 (0.0%) | 0 (0.0%) |
| 6:00 AM to 6:29 AM | 31 (10.5%) | 0 (0.0%) |
| 6:30 AM to 6:59 AM | 38 (12.9%) | 8 (2.0%) |
| 7:00 AM to 7:29 AM | 40 (13.6%) | 137 (34.9%) |
| 7:30 AM to 7:59 AM | 61 (20.7%) | 124 (31.6%) |
| 8:00 AM to 8:29 AM | 38 (12.9%) | 29 (7.4%) |
| 8:30 AM to 8:59 AM | 26 (8.8%) | 23 (5.9%) |
| 9:00 AM to 9:59 AM | 6 (2.0%) | 48 (12.2%) |
| 10:00 AM to 10:59 AM | 0 (0.0%) | 13 (3.3%) |
| 11:00 AM to 11:59 AM | 26 (8.8%) | 0 (0.0%) |
| 12:00 PM to 3:59 PM | 7 (2.4%) | 4 (1.0%) |
| 4:00 PM to 11:59 PM | 0 (0.0%) | 0 (0.0%) |
| Total | 295 (100.0%) | 392 (100.0%) |
Housing Occupancy in Horse Shoe
Occupancy by Ownership in Horse Shoe
Of the total 786 dwellings in Horse Shoe, owner-occupied units account for 725 (92.2%), while renter-occupied units make up 61 (7.8%).
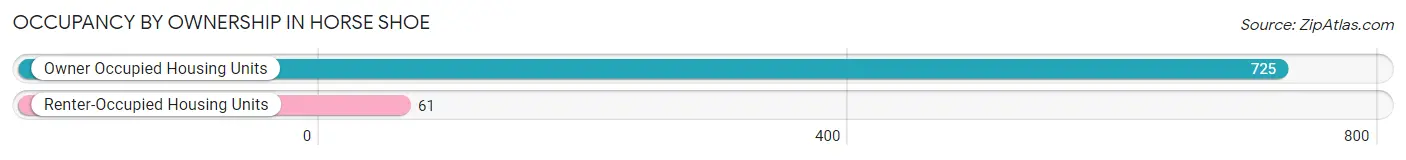
| Occupancy | # Housing Units | % Housing Units |
| Owner Occupied Housing Units | 725 | 92.2% |
| Renter-Occupied Housing Units | 61 | 7.8% |
| Total Occupied Housing Units | 786 | 100.0% |
Occupancy by Household Size in Horse Shoe
| Household Size | # Housing Units | % Housing Units |
| 1-Person Household | 125 | 15.9% |
| 2-Person Household | 460 | 58.5% |
| 3-Person Household | 83 | 10.6% |
| 4+ Person Household | 118 | 15.0% |
| Total Housing Units | 786 | 100.0% |
Occupancy by Ownership by Household Size in Horse Shoe
| Household Size | Owner-occupied | Renter-occupied |
| 1-Person Household | 110 (88.0%) | 15 (12.0%) |
| 2-Person Household | 414 (90.0%) | 46 (10.0%) |
| 3-Person Household | 83 (100.0%) | 0 (0.0%) |
| 4+ Person Household | 118 (100.0%) | 0 (0.0%) |
| Total Housing Units | 725 (92.2%) | 61 (7.8%) |
Occupancy by Educational Attainment in Horse Shoe
| Household Size | Owner-occupied | Renter-occupied |
| Less than High School | 7 (36.8%) | 12 (63.2%) |
| High School Diploma | 75 (83.3%) | 15 (16.7%) |
| College/Associate Degree | 236 (94.4%) | 14 (5.6%) |
| Bachelor's Degree or higher | 407 (95.3%) | 20 (4.7%) |
Occupancy by Age of Householder in Horse Shoe
| Age Bracket | # Households | % Households |
| Under 35 Years | 63 | 8.0% |
| 35 to 44 Years | 112 | 14.2% |
| 45 to 54 Years | 115 | 14.6% |
| 55 to 64 Years | 127 | 16.2% |
| 65 to 74 Years | 189 | 24.0% |
| 75 to 84 Years | 104 | 13.2% |
| 85 Years and Over | 76 | 9.7% |
| Total | 786 | 100.0% |
Housing Finances in Horse Shoe
Median Income by Occupancy in Horse Shoe
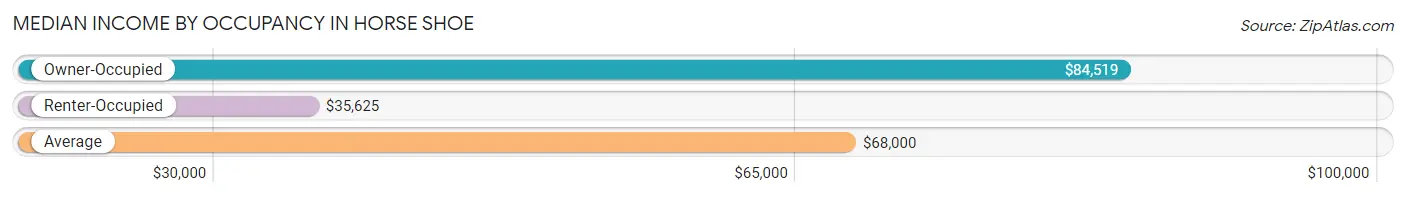
| Occupancy Type | # Households | Median Income |
| Owner-Occupied | 725 (92.2%) | $84,519 |
| Renter-Occupied | 61 (7.8%) | $35,625 |
| Average | 786 (100.0%) | $68,000 |
Occupancy by Householder Income Bracket in Horse Shoe
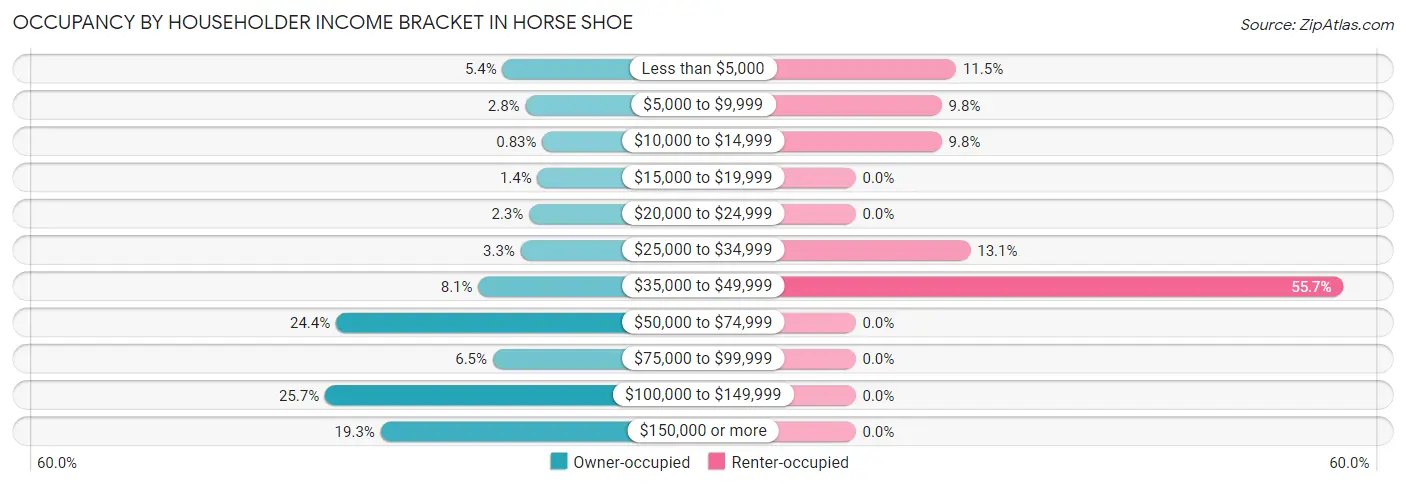
| Income Bracket | Owner-occupied | Renter-occupied |
| Less than $5,000 | 39 (5.4%) | 7 (11.5%) |
| $5,000 to $9,999 | 20 (2.8%) | 6 (9.8%) |
| $10,000 to $14,999 | 6 (0.8%) | 6 (9.8%) |
| $15,000 to $19,999 | 10 (1.4%) | 0 (0.0%) |
| $20,000 to $24,999 | 17 (2.3%) | 0 (0.0%) |
| $25,000 to $34,999 | 24 (3.3%) | 8 (13.1%) |
| $35,000 to $49,999 | 59 (8.1%) | 34 (55.7%) |
| $50,000 to $74,999 | 177 (24.4%) | 0 (0.0%) |
| $75,000 to $99,999 | 47 (6.5%) | 0 (0.0%) |
| $100,000 to $149,999 | 186 (25.7%) | 0 (0.0%) |
| $150,000 or more | 140 (19.3%) | 0 (0.0%) |
| Total | 725 (100.0%) | 61 (100.0%) |
Monthly Housing Cost Tiers in Horse Shoe
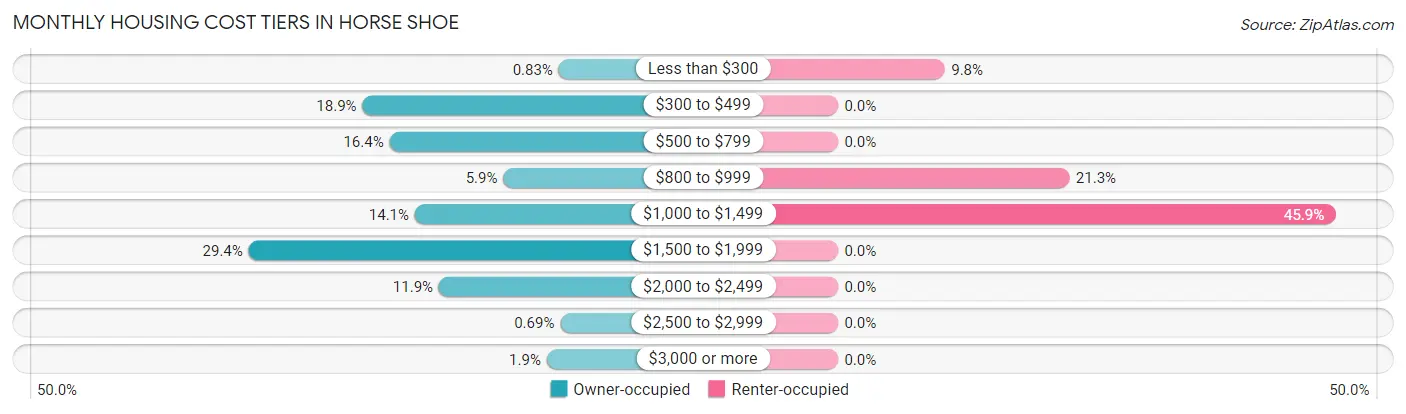
| Monthly Cost | Owner-occupied | Renter-occupied |
| Less than $300 | 6 (0.8%) | 6 (9.8%) |
| $300 to $499 | 137 (18.9%) | 0 (0.0%) |
| $500 to $799 | 119 (16.4%) | 0 (0.0%) |
| $800 to $999 | 43 (5.9%) | 13 (21.3%) |
| $1,000 to $1,499 | 102 (14.1%) | 28 (45.9%) |
| $1,500 to $1,999 | 213 (29.4%) | 0 (0.0%) |
| $2,000 to $2,499 | 86 (11.9%) | 0 (0.0%) |
| $2,500 to $2,999 | 5 (0.7%) | 0 (0.0%) |
| $3,000 or more | 14 (1.9%) | 0 (0.0%) |
| Total | 725 (100.0%) | 61 (100.0%) |
Physical Housing Characteristics in Horse Shoe
Housing Structures in Horse Shoe
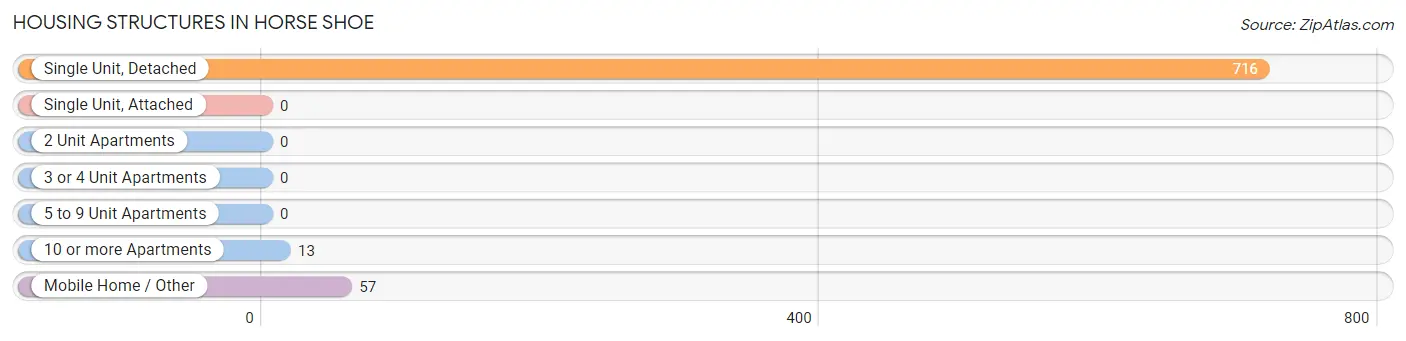
| Structure Type | # Housing Units | % Housing Units |
| Single Unit, Detached | 716 | 91.1% |
| Single Unit, Attached | 0 | 0.0% |
| 2 Unit Apartments | 0 | 0.0% |
| 3 or 4 Unit Apartments | 0 | 0.0% |
| 5 to 9 Unit Apartments | 0 | 0.0% |
| 10 or more Apartments | 13 | 1.7% |
| Mobile Home / Other | 57 | 7.2% |
| Total | 786 | 100.0% |
Housing Structures by Occupancy in Horse Shoe
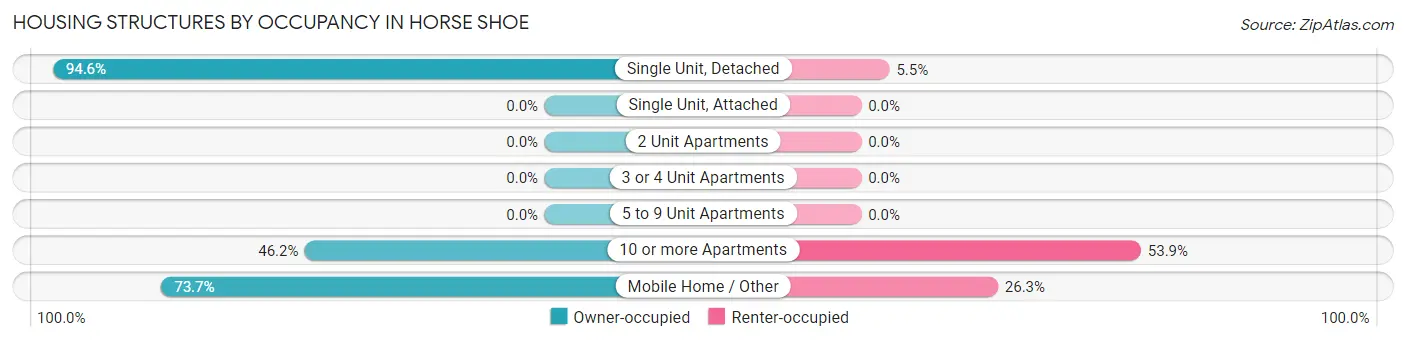
| Structure Type | Owner-occupied | Renter-occupied |
| Single Unit, Detached | 677 (94.6%) | 39 (5.4%) |
| Single Unit, Attached | 0 (0.0%) | 0 (0.0%) |
| 2 Unit Apartments | 0 (0.0%) | 0 (0.0%) |
| 3 or 4 Unit Apartments | 0 (0.0%) | 0 (0.0%) |
| 5 to 9 Unit Apartments | 0 (0.0%) | 0 (0.0%) |
| 10 or more Apartments | 6 (46.2%) | 7 (53.8%) |
| Mobile Home / Other | 42 (73.7%) | 15 (26.3%) |
| Total | 725 (92.2%) | 61 (7.8%) |
Housing Structures by Number of Rooms in Horse Shoe
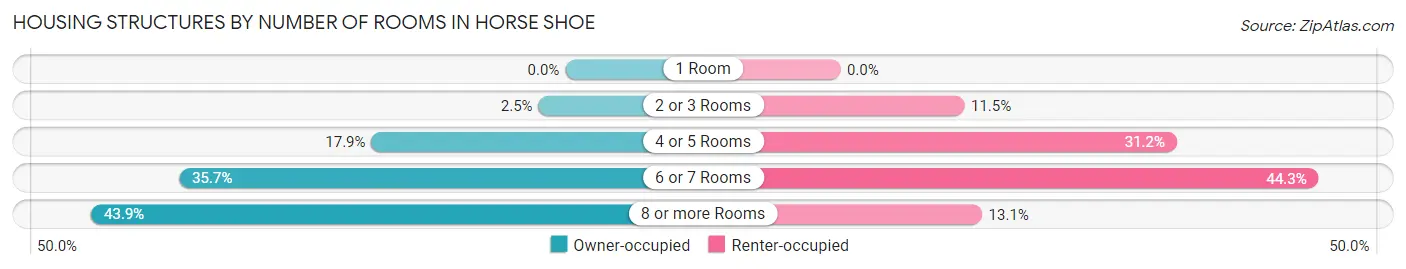
| Number of Rooms | Owner-occupied | Renter-occupied |
| 1 Room | 0 (0.0%) | 0 (0.0%) |
| 2 or 3 Rooms | 18 (2.5%) | 7 (11.5%) |
| 4 or 5 Rooms | 130 (17.9%) | 19 (31.1%) |
| 6 or 7 Rooms | 259 (35.7%) | 27 (44.3%) |
| 8 or more Rooms | 318 (43.9%) | 8 (13.1%) |
| Total | 725 (100.0%) | 61 (100.0%) |
Housing Structure by Heating Type in Horse Shoe
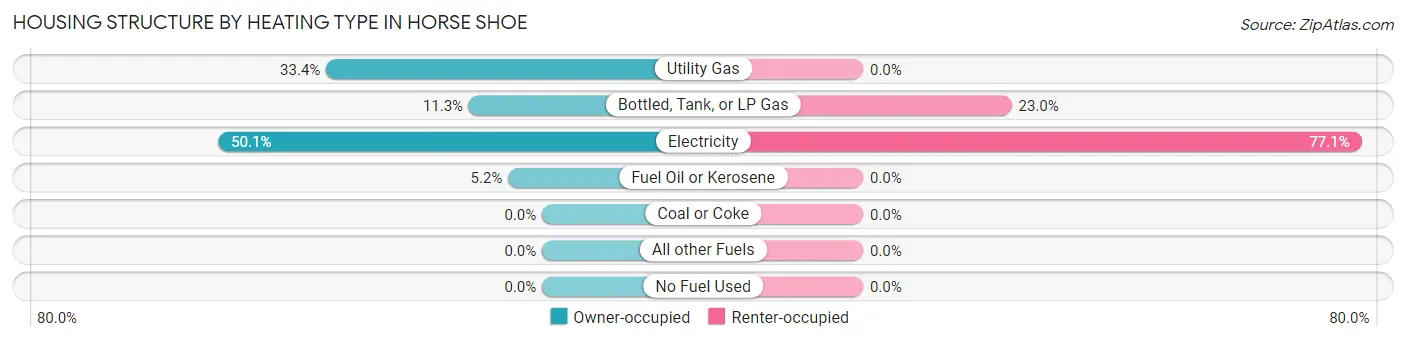
| Heating Type | Owner-occupied | Renter-occupied |
| Utility Gas | 242 (33.4%) | 0 (0.0%) |
| Bottled, Tank, or LP Gas | 82 (11.3%) | 14 (23.0%) |
| Electricity | 363 (50.1%) | 47 (77.0%) |
| Fuel Oil or Kerosene | 38 (5.2%) | 0 (0.0%) |
| Coal or Coke | 0 (0.0%) | 0 (0.0%) |
| All other Fuels | 0 (0.0%) | 0 (0.0%) |
| No Fuel Used | 0 (0.0%) | 0 (0.0%) |
| Total | 725 (100.0%) | 61 (100.0%) |
Household Vehicle Usage in Horse Shoe
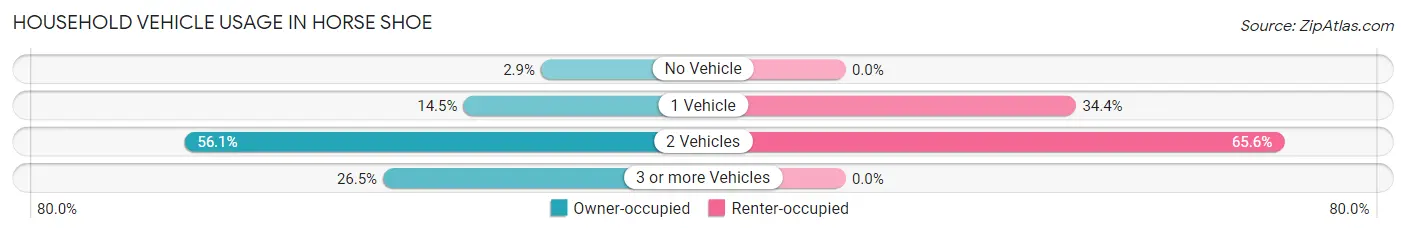
| Vehicles per Household | Owner-occupied | Renter-occupied |
| No Vehicle | 21 (2.9%) | 0 (0.0%) |
| 1 Vehicle | 105 (14.5%) | 21 (34.4%) |
| 2 Vehicles | 407 (56.1%) | 40 (65.6%) |
| 3 or more Vehicles | 192 (26.5%) | 0 (0.0%) |
| Total | 725 (100.0%) | 61 (100.0%) |
Real Estate & Mortgages in Horse Shoe
Real Estate and Mortgage Overview in Horse Shoe
| Characteristic | Without Mortgage | With Mortgage |
| Housing Units | 289 | 436 |
| Median Property Value | $388,300 | $357,000 |
| Median Household Income | $57,964 | $102 |
| Monthly Housing Costs | $504 | $14 |
| Real Estate Taxes | $2,350 | $6 |
Property Value by Mortgage Status in Horse Shoe
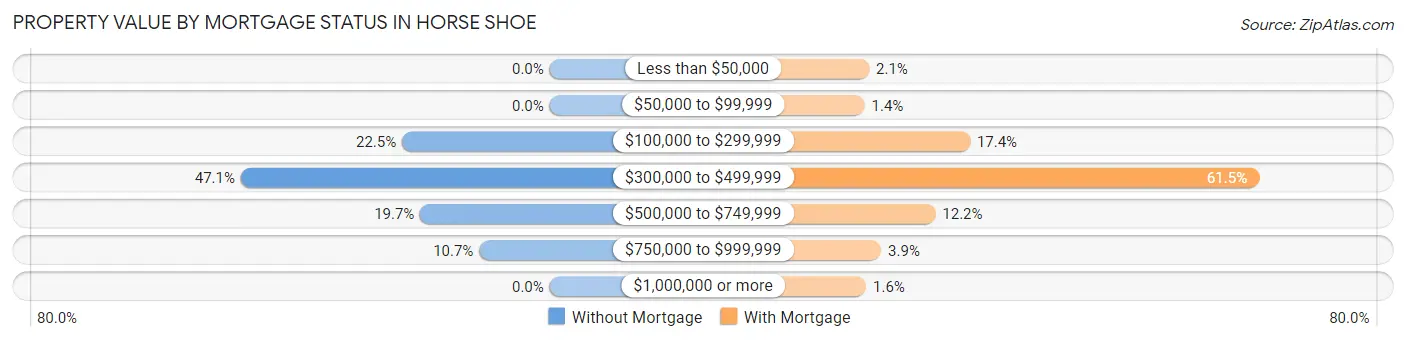
| Property Value | Without Mortgage | With Mortgage |
| Less than $50,000 | 0 (0.0%) | 9 (2.1%) |
| $50,000 to $99,999 | 0 (0.0%) | 6 (1.4%) |
| $100,000 to $299,999 | 65 (22.5%) | 76 (17.4%) |
| $300,000 to $499,999 | 136 (47.1%) | 268 (61.5%) |
| $500,000 to $749,999 | 57 (19.7%) | 53 (12.2%) |
| $750,000 to $999,999 | 31 (10.7%) | 17 (3.9%) |
| $1,000,000 or more | 0 (0.0%) | 7 (1.6%) |
| Total | 289 (100.0%) | 436 (100.0%) |
Household Income by Mortgage Status in Horse Shoe
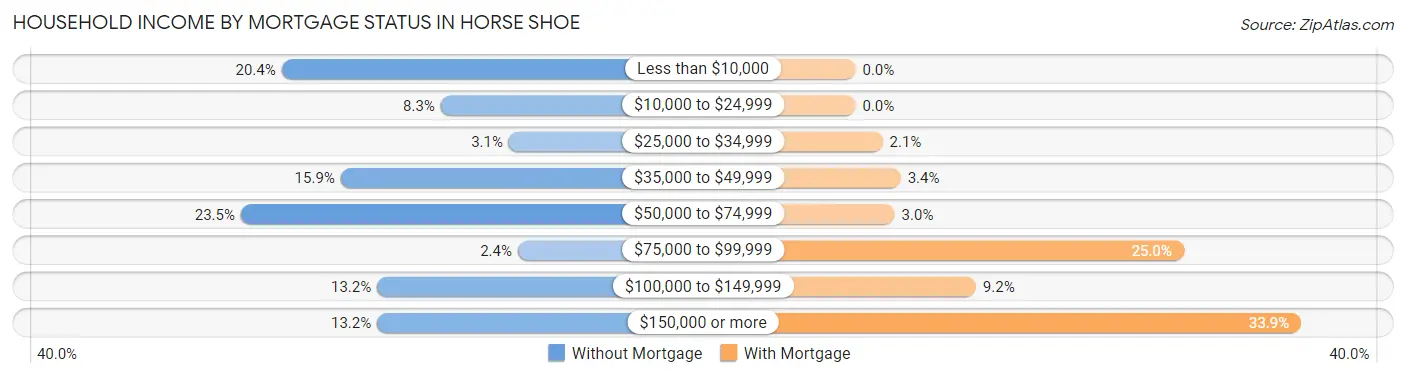
| Household Income | Without Mortgage | With Mortgage |
| Less than $10,000 | 59 (20.4%) | 0 (0.0%) |
| $10,000 to $24,999 | 24 (8.3%) | 0 (0.0%) |
| $25,000 to $34,999 | 9 (3.1%) | 9 (2.1%) |
| $35,000 to $49,999 | 46 (15.9%) | 15 (3.4%) |
| $50,000 to $74,999 | 68 (23.5%) | 13 (3.0%) |
| $75,000 to $99,999 | 7 (2.4%) | 109 (25.0%) |
| $100,000 to $149,999 | 38 (13.2%) | 40 (9.2%) |
| $150,000 or more | 38 (13.2%) | 148 (33.9%) |
| Total | 289 (100.0%) | 436 (100.0%) |
Property Value to Household Income Ratio in Horse Shoe
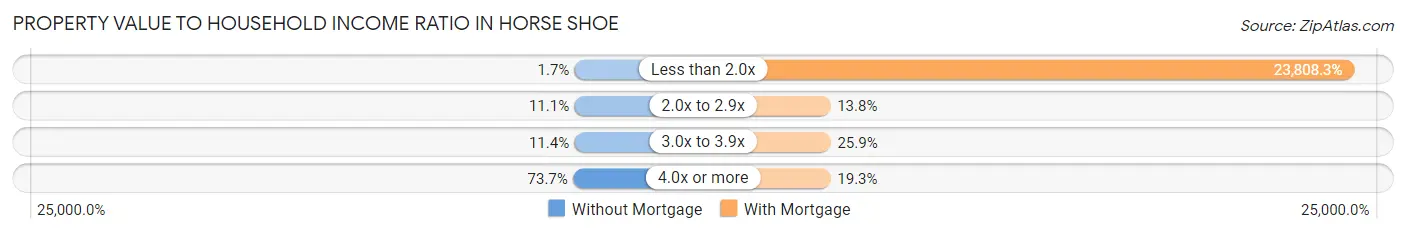
| Value-to-Income Ratio | Without Mortgage | With Mortgage |
| Less than 2.0x | 5 (1.7%) | 103,804 (23,808.3%) |
| 2.0x to 2.9x | 32 (11.1%) | 60 (13.8%) |
| 3.0x to 3.9x | 33 (11.4%) | 113 (25.9%) |
| 4.0x or more | 213 (73.7%) | 84 (19.3%) |
| Total | 289 (100.0%) | 436 (100.0%) |
Real Estate Taxes by Mortgage Status in Horse Shoe
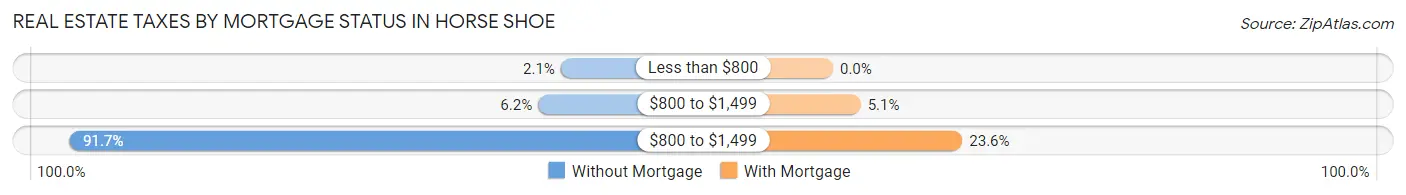
| Property Taxes | Without Mortgage | With Mortgage |
| Less than $800 | 6 (2.1%) | 0 (0.0%) |
| $800 to $1,499 | 18 (6.2%) | 22 (5.1%) |
| $800 to $1,499 | 265 (91.7%) | 103 (23.6%) |
| Total | 289 (100.0%) | 436 (100.0%) |
Health & Disability in Horse Shoe
Health Insurance Coverage by Age in Horse Shoe
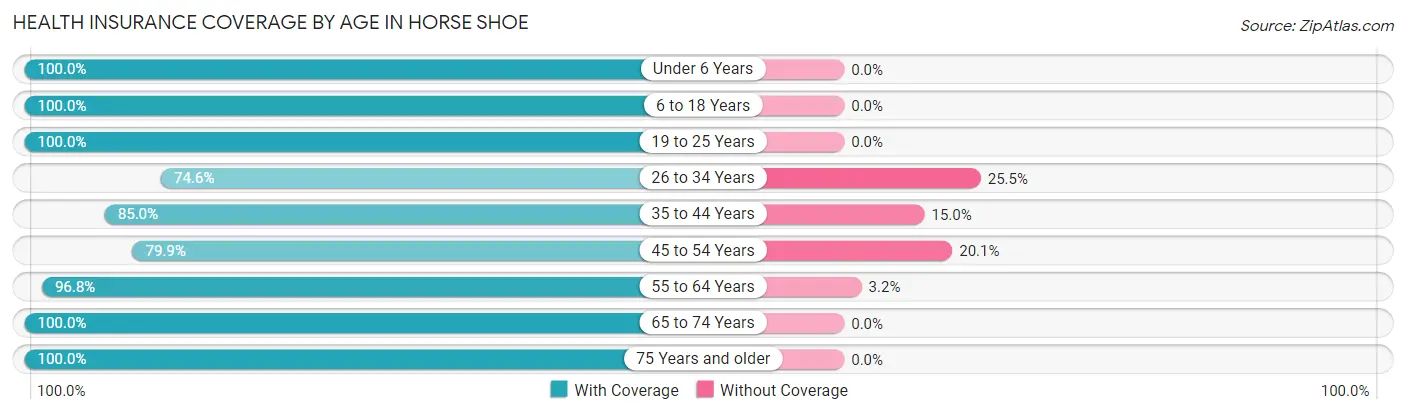
| Age Bracket | With Coverage | Without Coverage |
| Under 6 Years | 70 (100.0%) | 0 (0.0%) |
| 6 to 18 Years | 240 (100.0%) | 0 (0.0%) |
| 19 to 25 Years | 58 (100.0%) | 0 (0.0%) |
| 26 to 34 Years | 123 (74.6%) | 42 (25.5%) |
| 35 to 44 Years | 142 (85.0%) | 25 (15.0%) |
| 45 to 54 Years | 222 (79.9%) | 56 (20.1%) |
| 55 to 64 Years | 209 (96.8%) | 7 (3.2%) |
| 65 to 74 Years | 402 (100.0%) | 0 (0.0%) |
| 75 Years and older | 247 (100.0%) | 0 (0.0%) |
| Total | 1,713 (92.9%) | 130 (7.0%) |
Health Insurance Coverage by Citizenship Status in Horse Shoe
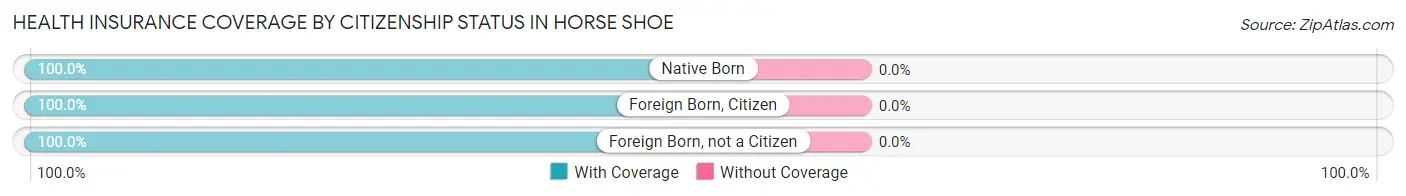
| Citizenship Status | With Coverage | Without Coverage |
| Native Born | 70 (100.0%) | 0 (0.0%) |
| Foreign Born, Citizen | 240 (100.0%) | 0 (0.0%) |
| Foreign Born, not a Citizen | 58 (100.0%) | 0 (0.0%) |
Health Insurance Coverage by Household Income in Horse Shoe
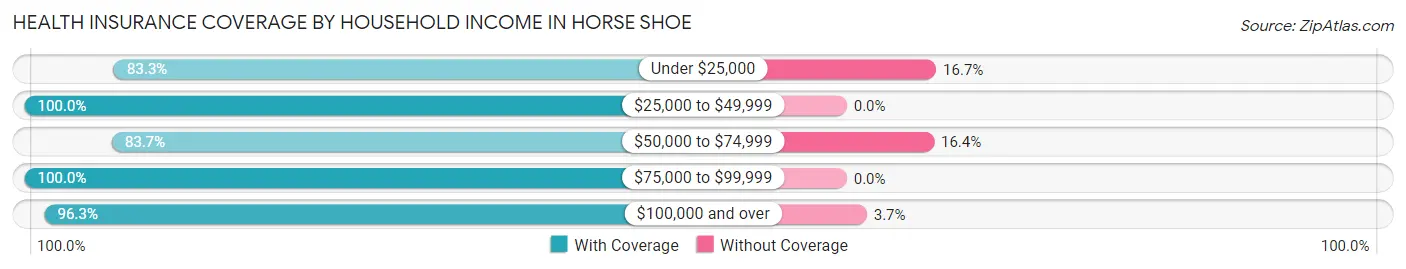
| Household Income | With Coverage | Without Coverage |
| Under $25,000 | 179 (83.3%) | 36 (16.7%) |
| $25,000 to $49,999 | 228 (100.0%) | 0 (0.0%) |
| $50,000 to $74,999 | 307 (83.7%) | 60 (16.4%) |
| $75,000 to $99,999 | 124 (100.0%) | 0 (0.0%) |
| $100,000 and over | 875 (96.3%) | 34 (3.7%) |
Public vs Private Health Insurance Coverage by Age in Horse Shoe
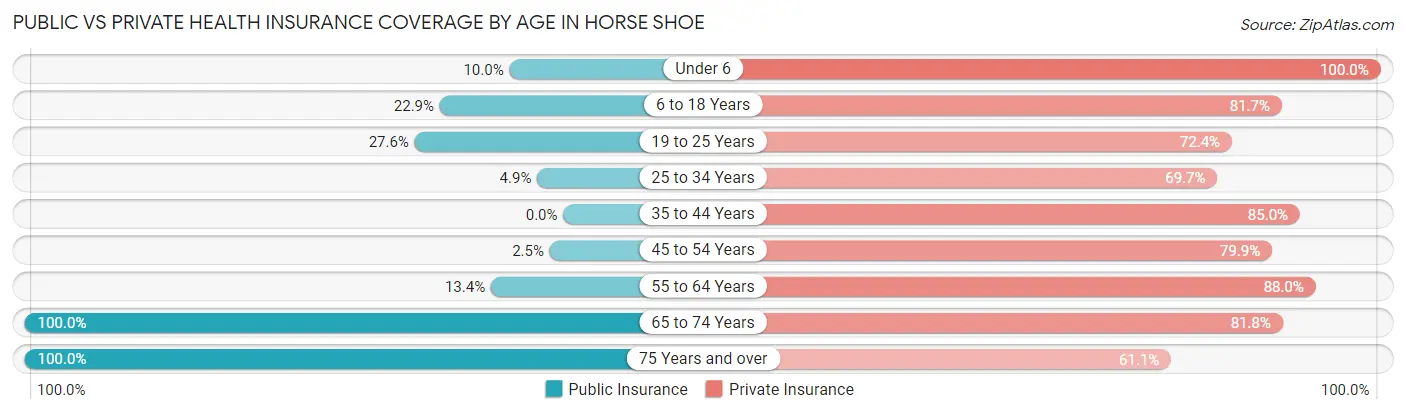
| Age Bracket | Public Insurance | Private Insurance |
| Under 6 | 7 (10.0%) | 70 (100.0%) |
| 6 to 18 Years | 55 (22.9%) | 196 (81.7%) |
| 19 to 25 Years | 16 (27.6%) | 42 (72.4%) |
| 25 to 34 Years | 8 (4.9%) | 115 (69.7%) |
| 35 to 44 Years | 0 (0.0%) | 142 (85.0%) |
| 45 to 54 Years | 7 (2.5%) | 222 (79.9%) |
| 55 to 64 Years | 29 (13.4%) | 190 (88.0%) |
| 65 to 74 Years | 402 (100.0%) | 329 (81.8%) |
| 75 Years and over | 247 (100.0%) | 151 (61.1%) |
| Total | 771 (41.8%) | 1,457 (79.1%) |
Disability Status by Sex by Age in Horse Shoe
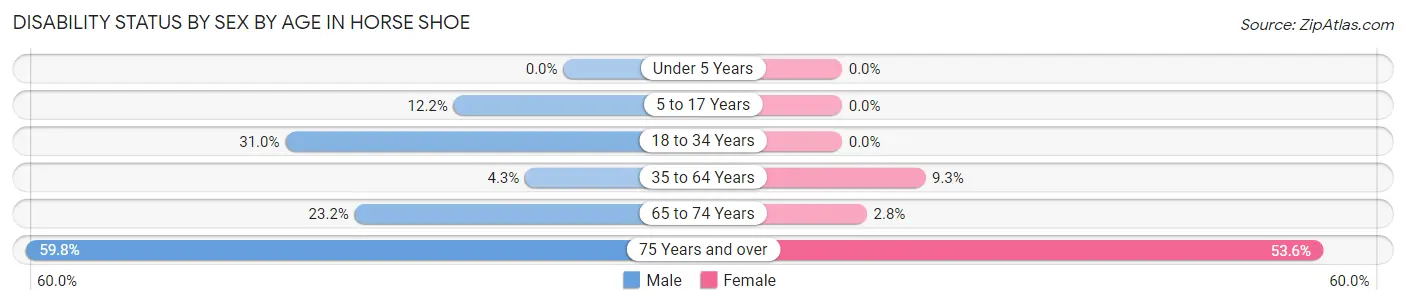
| Age Bracket | Male | Female |
| Under 5 Years | 0 (0.0%) | 0 (0.0%) |
| 5 to 17 Years | 11 (12.2%) | 0 (0.0%) |
| 18 to 34 Years | 35 (31.0%) | 0 (0.0%) |
| 35 to 64 Years | 13 (4.3%) | 33 (9.3%) |
| 65 to 74 Years | 43 (23.2%) | 6 (2.8%) |
| 75 Years and over | 64 (59.8%) | 75 (53.6%) |
Disability Class by Sex by Age in Horse Shoe
Disability Class: Hearing Difficulty
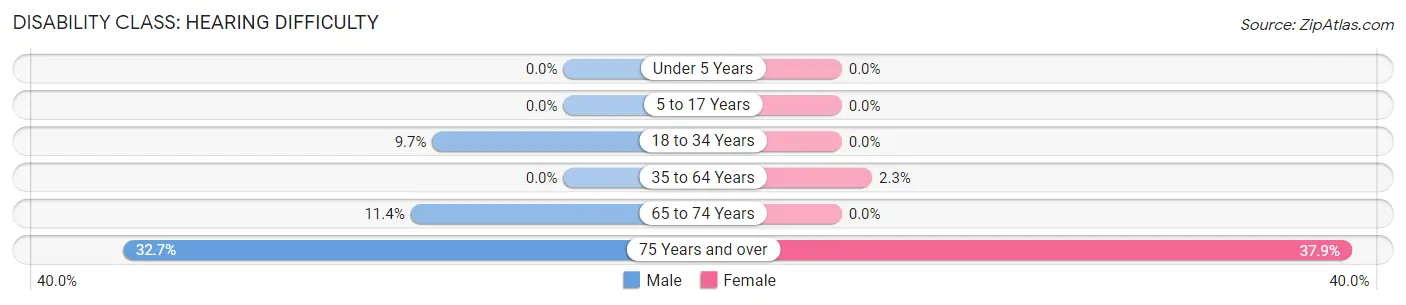
| Age Bracket | Male | Female |
| Under 5 Years | 0 (0.0%) | 0 (0.0%) |
| 5 to 17 Years | 0 (0.0%) | 0 (0.0%) |
| 18 to 34 Years | 11 (9.7%) | 0 (0.0%) |
| 35 to 64 Years | 0 (0.0%) | 8 (2.2%) |
| 65 to 74 Years | 21 (11.4%) | 0 (0.0%) |
| 75 Years and over | 35 (32.7%) | 53 (37.9%) |
Disability Class: Vision Difficulty
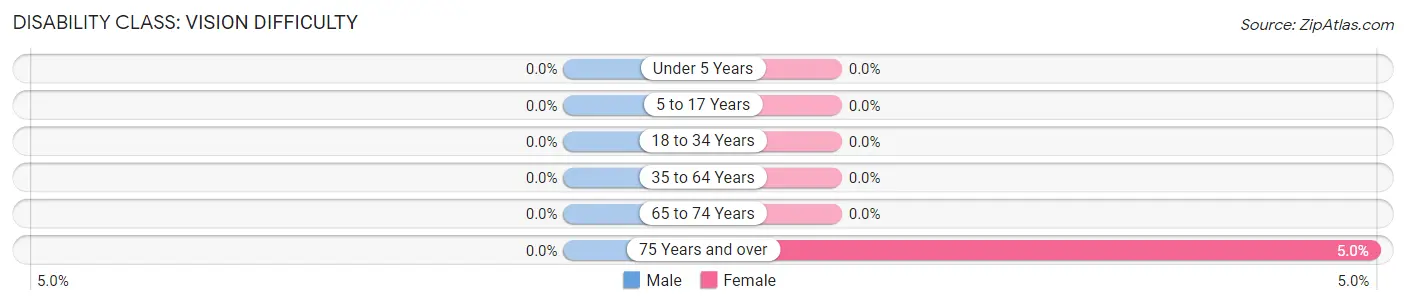
| Age Bracket | Male | Female |
| Under 5 Years | 0 (0.0%) | 0 (0.0%) |
| 5 to 17 Years | 0 (0.0%) | 0 (0.0%) |
| 18 to 34 Years | 0 (0.0%) | 0 (0.0%) |
| 35 to 64 Years | 0 (0.0%) | 0 (0.0%) |
| 65 to 74 Years | 0 (0.0%) | 0 (0.0%) |
| 75 Years and over | 0 (0.0%) | 7 (5.0%) |
Disability Class: Cognitive Difficulty
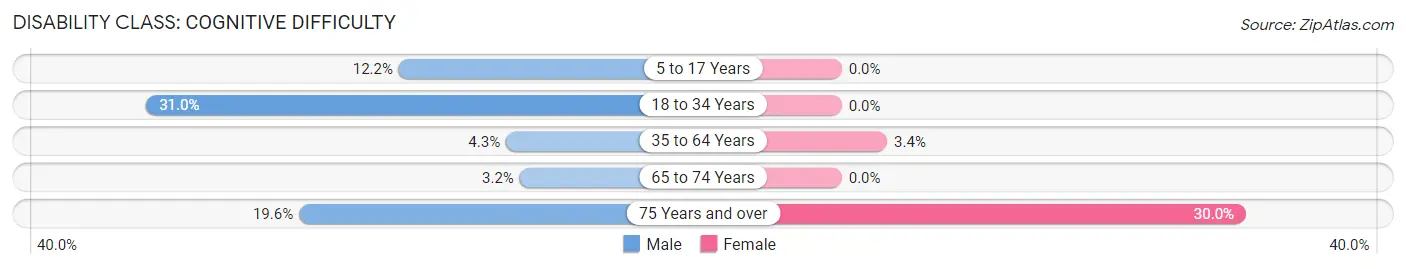
| Age Bracket | Male | Female |
| 5 to 17 Years | 11 (12.2%) | 0 (0.0%) |
| 18 to 34 Years | 35 (31.0%) | 0 (0.0%) |
| 35 to 64 Years | 13 (4.3%) | 12 (3.4%) |
| 65 to 74 Years | 6 (3.2%) | 0 (0.0%) |
| 75 Years and over | 21 (19.6%) | 42 (30.0%) |
Disability Class: Ambulatory Difficulty
| Age Bracket | Male | Female |
| 5 to 17 Years | 0 (0.0%) | 0 (0.0%) |
| 18 to 34 Years | 16 (14.2%) | 0 (0.0%) |
| 35 to 64 Years | 6 (2.0%) | 21 (5.9%) |
| 65 to 74 Years | 22 (11.9%) | 6 (2.8%) |
| 75 Years and over | 29 (27.1%) | 41 (29.3%) |
Disability Class: Self-Care Difficulty
| Age Bracket | Male | Female |
| 5 to 17 Years | 0 (0.0%) | 0 (0.0%) |
| 18 to 34 Years | 24 (21.2%) | 0 (0.0%) |
| 35 to 64 Years | 6 (2.0%) | 6 (1.7%) |
| 65 to 74 Years | 10 (5.4%) | 0 (0.0%) |
| 75 Years and over | 21 (19.6%) | 29 (20.7%) |
Technology Access in Horse Shoe
Computing Device Access in Horse Shoe
| Device Type | # Households | % Households |
| Desktop or Laptop | 734 | 93.4% |
| Smartphone | 729 | 92.7% |
| Tablet | 580 | 73.8% |
| No Computing Device | 33 | 4.2% |
| Total | 786 | 100.0% |
Internet Access in Horse Shoe
| Internet Type | # Households | % Households |
| Dial-Up Internet | 0 | 0.0% |
| Broadband Home | 674 | 85.8% |
| Cellular Data Only | 22 | 2.8% |
| Satellite Internet | 40 | 5.1% |
| No Internet | 78 | 9.9% |
| Total | 786 | 100.0% |
Horse Shoe Summary
Horse Shoe, North Carolina is a small unincorporated community located in Henderson County, North Carolina. It is situated in the Blue Ridge Mountains, approximately 20 miles south of Asheville. The community is named after the horseshoe-shaped bend in the French Broad River that runs through the area. Horse Shoe is a rural community with a population of approximately 1,000 people.
History
Horse Shoe was first settled in the late 1700s by a group of settlers from Virginia. The settlers were attracted to the area due to its fertile soil and abundant natural resources. The community was originally known as “Horse Shoe Bend” due to the horseshoe-shaped bend in the French Broad River. The name was eventually shortened to “Horse Shoe”.
The community grew slowly over the years and by the early 1900s, it had become a thriving agricultural community. The area was known for its production of apples, peaches, and other fruits and vegetables. The community also had several small businesses, including a general store, a blacksmith shop, and a grist mill.
In the late 1950s, the community began to decline as many of the younger residents moved away in search of better job opportunities. The population of Horse Shoe dropped to less than 500 by the early 2000s.
Geography
Horse Shoe is located in the Blue Ridge Mountains of western North Carolina. The community is situated in a valley surrounded by the Blue Ridge Mountains to the east and the Great Smoky Mountains to the west. The French Broad River runs through the area, creating a horseshoe-shaped bend that gives the community its name.
The climate in Horse Shoe is mild and temperate. Summers are warm and humid, while winters are cold and wet. The average annual temperature is around 60°F (15°C). The average annual precipitation is around 45 inches (114 cm).
Economy
Horse Shoe is a rural community with a small economy. The primary industries in the area are agriculture and tourism. The area is known for its production of apples, peaches, and other fruits and vegetables. The community also has several small businesses, including a general store, a blacksmith shop, and a grist mill.
Tourism is an important part of the local economy. The area is home to several popular attractions, including the Blue Ridge Parkway, the Great Smoky Mountains National Park, and the Biltmore Estate.
Demographics
As of the 2010 census, the population of Horse Shoe was 1,000. The racial makeup of the community was 97.2% White, 0.7% African American, 0.3% Native American, 0.2% Asian, and 1.6% from other races. The median household income was $37,500. The median age was 44.5 years.
Common Questions
What is Per Capita Income in Horse Shoe?
Per Capita income in Horse Shoe is $44,842.
What is the Median Family Income in Horse Shoe?
Median Family Income in Horse Shoe is $100,096.
What is the Median Household income in Horse Shoe?
Median Household Income in Horse Shoe is $68,000.
What is Income or Wage Gap in Horse Shoe?
Income or Wage Gap in Horse Shoe is 27.0%.
Women in Horse Shoe earn 73.0 cents for every dollar earned by a man.
What is Inequality or Gini Index in Horse Shoe?
Inequality or Gini Index in Horse Shoe is 0.47.
What is the Total Population of Horse Shoe?
Total Population of Horse Shoe is 1,854.
What is the Total Male Population of Horse Shoe?
Total Male Population of Horse Shoe is 850.
What is the Total Female Population of Horse Shoe?
Total Female Population of Horse Shoe is 1,004.
What is the Ratio of Males per 100 Females in Horse Shoe?
There are 84.66 Males per 100 Females in Horse Shoe.
What is the Ratio of Females per 100 Males in Horse Shoe?
There are 118.12 Females per 100 Males in Horse Shoe.
What is the Median Population Age in Horse Shoe?
Median Population Age in Horse Shoe is 51.6 Years.
What is the Average Family Size in Horse Shoe
Average Family Size in Horse Shoe is 2.6 People.
What is the Average Household Size in Horse Shoe
Average Household Size in Horse Shoe is 2.4 People.
How Large is the Labor Force in Horse Shoe?
There are 793 People in the Labor Forcein in Horse Shoe.
What is the Percentage of People in the Labor Force in Horse Shoe?
49.8% of People are in the Labor Force in Horse Shoe.
What is the Unemployment Rate in Horse Shoe?
Unemployment Rate in Horse Shoe is 3.2%.