Zip Codes with the Highest Percentage of Population Employed in Food Preparation & Serving in Fayetteville, NC
RELATED REPORTS & OPTIONS
Food Preparation & Serving
Fayetteville
Compare Zip Codes
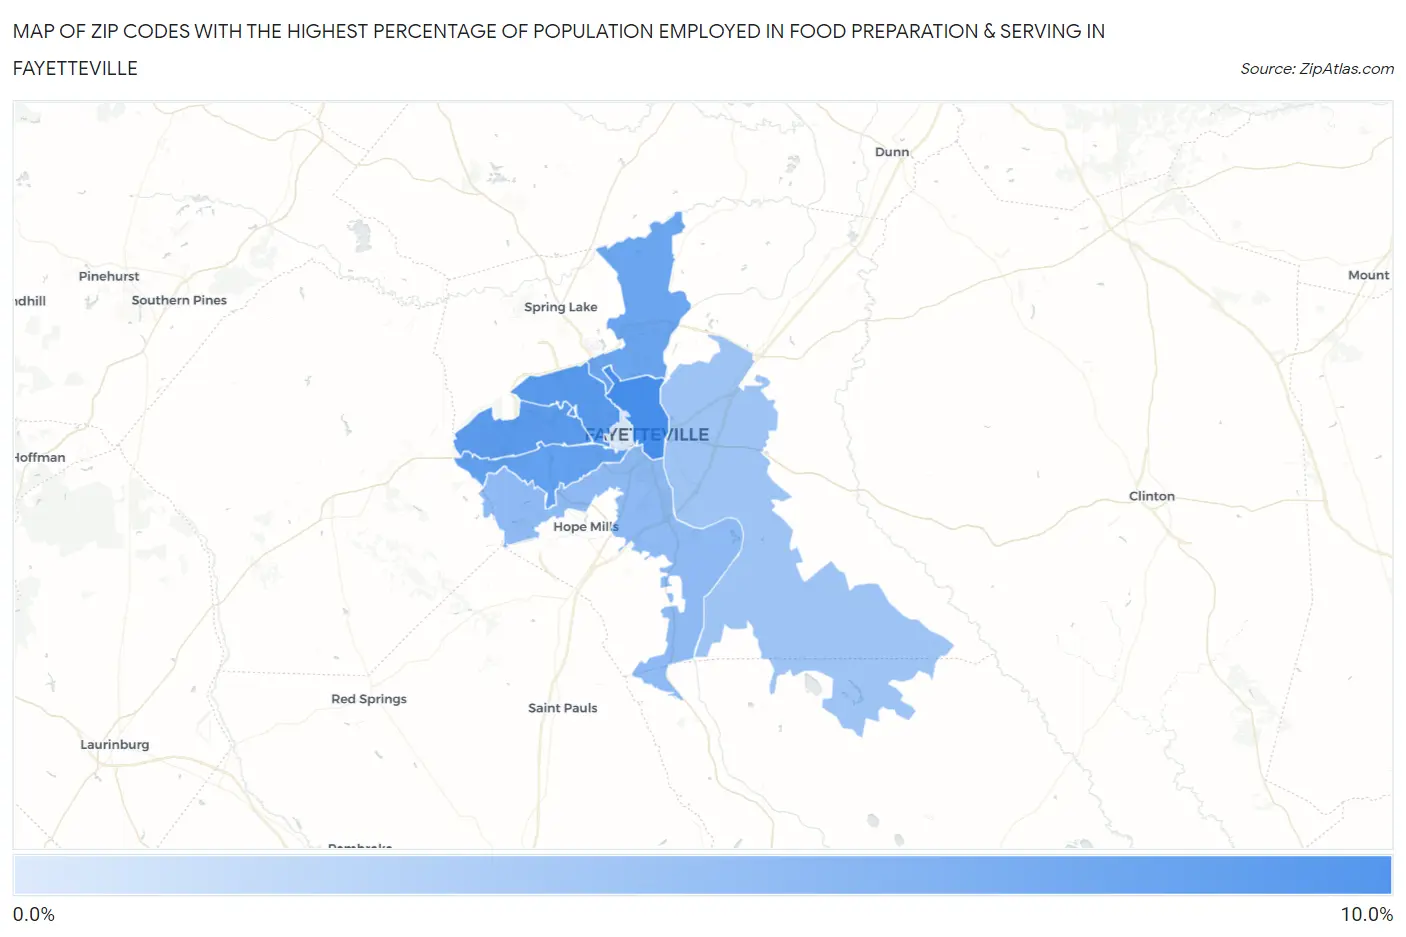
Map of Zip Codes with the Highest Percentage of Population Employed in Food Preparation & Serving in Fayetteville
1.9%
9.4%
Zip Codes with the Highest Percentage of Population Employed in Food Preparation & Serving in Fayetteville, NC
| Zip Code | % Employed | vs State | vs National | |
| 1. | 28301 | 9.4% | 5.3%(+4.12)#88 | 5.3%(+4.13)#3,126 |
| 2. | 28303 | 8.6% | 5.3%(+3.33)#111 | 5.3%(+3.33)#3,946 |
| 3. | 28314 | 8.5% | 5.3%(+3.22)#114 | 5.3%(+3.23)#4,055 |
| 4. | 28304 | 8.0% | 5.3%(+2.69)#128 | 5.3%(+2.69)#4,753 |
| 5. | 28311 | 7.5% | 5.3%(+2.18)#148 | 5.3%(+2.18)#5,614 |
| 6. | 28306 | 5.7% | 5.3%(+0.430)#277 | 5.3%(+0.435)#10,270 |
| 7. | 28312 | 5.0% | 5.3%(-0.331)#365 | 5.3%(-0.327)#13,114 |
| 8. | 28305 | 1.9% | 5.3%(-3.36)#662 | 5.3%(-3.36)#24,921 |
1
Common Questions
What are the Top 5 Zip Codes with the Highest Percentage of Population Employed in Food Preparation & Serving in Fayetteville, NC?
Top 5 Zip Codes with the Highest Percentage of Population Employed in Food Preparation & Serving in Fayetteville, NC are:
What zip code has the Highest Percentage of Population Employed in Food Preparation & Serving in Fayetteville, NC?
28301 has the Highest Percentage of Population Employed in Food Preparation & Serving in Fayetteville, NC with 9.4%.
What is the Percentage of Population Employed in Food Preparation & Serving in Fayetteville, NC?
Percentage of Population Employed in Food Preparation & Serving in Fayetteville is 7.8%.
What is the Percentage of Population Employed in Food Preparation & Serving in North Carolina?
Percentage of Population Employed in Food Preparation & Serving in North Carolina is 5.3%.
What is the Percentage of Population Employed in Food Preparation & Serving in the United States?
Percentage of Population Employed in Food Preparation & Serving in the United States is 5.3%.