Zip Codes with the Highest Percentage of Population Employed in Food Preparation & Serving in Lumberton, NC
RELATED REPORTS & OPTIONS
Food Preparation & Serving
Lumberton
Compare Zip Codes
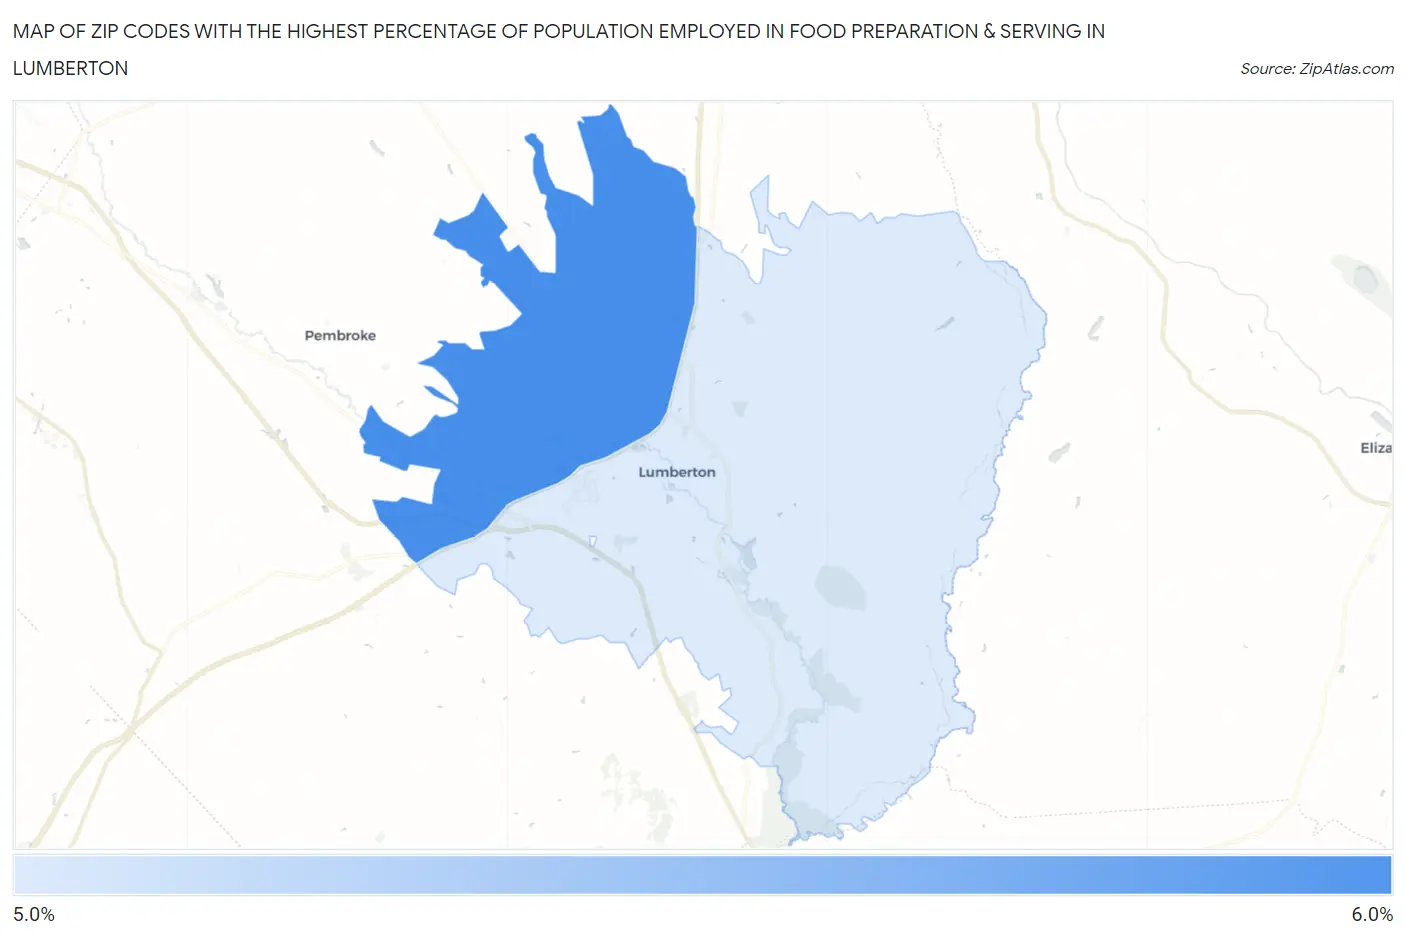
Map of Zip Codes with the Highest Percentage of Population Employed in Food Preparation & Serving in Lumberton
5.2%
5.5%
Zip Codes with the Highest Percentage of Population Employed in Food Preparation & Serving in Lumberton, NC
| Zip Code | % Employed | vs State | vs National | |
| 1. | 28360 | 5.5% | 5.3%(+0.224)#306 | 5.3%(+0.229)#11,023 |
| 2. | 28358 | 5.2% | 5.3%(-0.090)#337 | 5.3%(-0.086)#12,140 |
1
Common Questions
What are the Top Zip Codes with the Highest Percentage of Population Employed in Food Preparation & Serving in Lumberton, NC?
Top Zip Codes with the Highest Percentage of Population Employed in Food Preparation & Serving in Lumberton, NC are:
What zip code has the Highest Percentage of Population Employed in Food Preparation & Serving in Lumberton, NC?
28360 has the Highest Percentage of Population Employed in Food Preparation & Serving in Lumberton, NC with 5.5%.
What is the Percentage of Population Employed in Food Preparation & Serving in Lumberton, NC?
Percentage of Population Employed in Food Preparation & Serving in Lumberton is 6.1%.
What is the Percentage of Population Employed in Food Preparation & Serving in North Carolina?
Percentage of Population Employed in Food Preparation & Serving in North Carolina is 5.3%.
What is the Percentage of Population Employed in Food Preparation & Serving in the United States?
Percentage of Population Employed in Food Preparation & Serving in the United States is 5.3%.