Zip Codes with the Highest Percentage of Population Employed in Food Preparation & Serving in Matthews, NC
RELATED REPORTS & OPTIONS
Food Preparation & Serving
Matthews
Compare Zip Codes
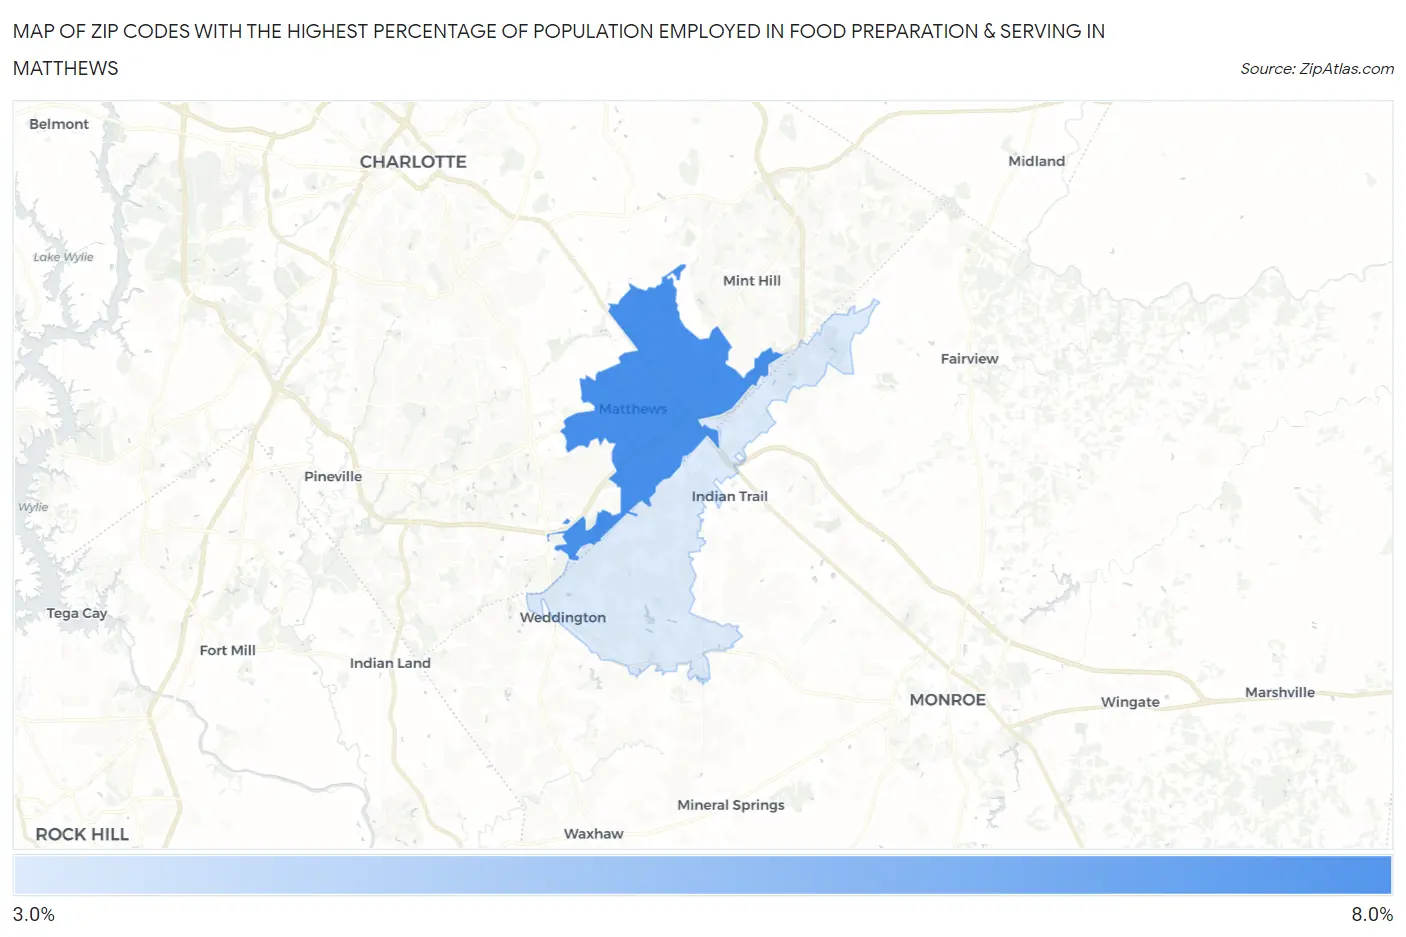
Map of Zip Codes with the Highest Percentage of Population Employed in Food Preparation & Serving in Matthews
3.7%
6.1%
Zip Codes with the Highest Percentage of Population Employed in Food Preparation & Serving in Matthews, NC
| Zip Code | % Employed | vs State | vs National | |
| 1. | 28105 | 6.1% | 5.3%(+0.833)#237 | 5.3%(+0.837)#8,948 |
| 2. | 28104 | 3.7% | 5.3%(-1.59)#502 | 5.3%(-1.59)#18,350 |
1
Common Questions
What are the Top Zip Codes with the Highest Percentage of Population Employed in Food Preparation & Serving in Matthews, NC?
Top Zip Codes with the Highest Percentage of Population Employed in Food Preparation & Serving in Matthews, NC are:
What zip code has the Highest Percentage of Population Employed in Food Preparation & Serving in Matthews, NC?
28105 has the Highest Percentage of Population Employed in Food Preparation & Serving in Matthews, NC with 6.1%.
What is the Percentage of Population Employed in Food Preparation & Serving in Matthews, NC?
Percentage of Population Employed in Food Preparation & Serving in Matthews is 5.8%.
What is the Percentage of Population Employed in Food Preparation & Serving in North Carolina?
Percentage of Population Employed in Food Preparation & Serving in North Carolina is 5.3%.
What is the Percentage of Population Employed in Food Preparation & Serving in the United States?
Percentage of Population Employed in Food Preparation & Serving in the United States is 5.3%.