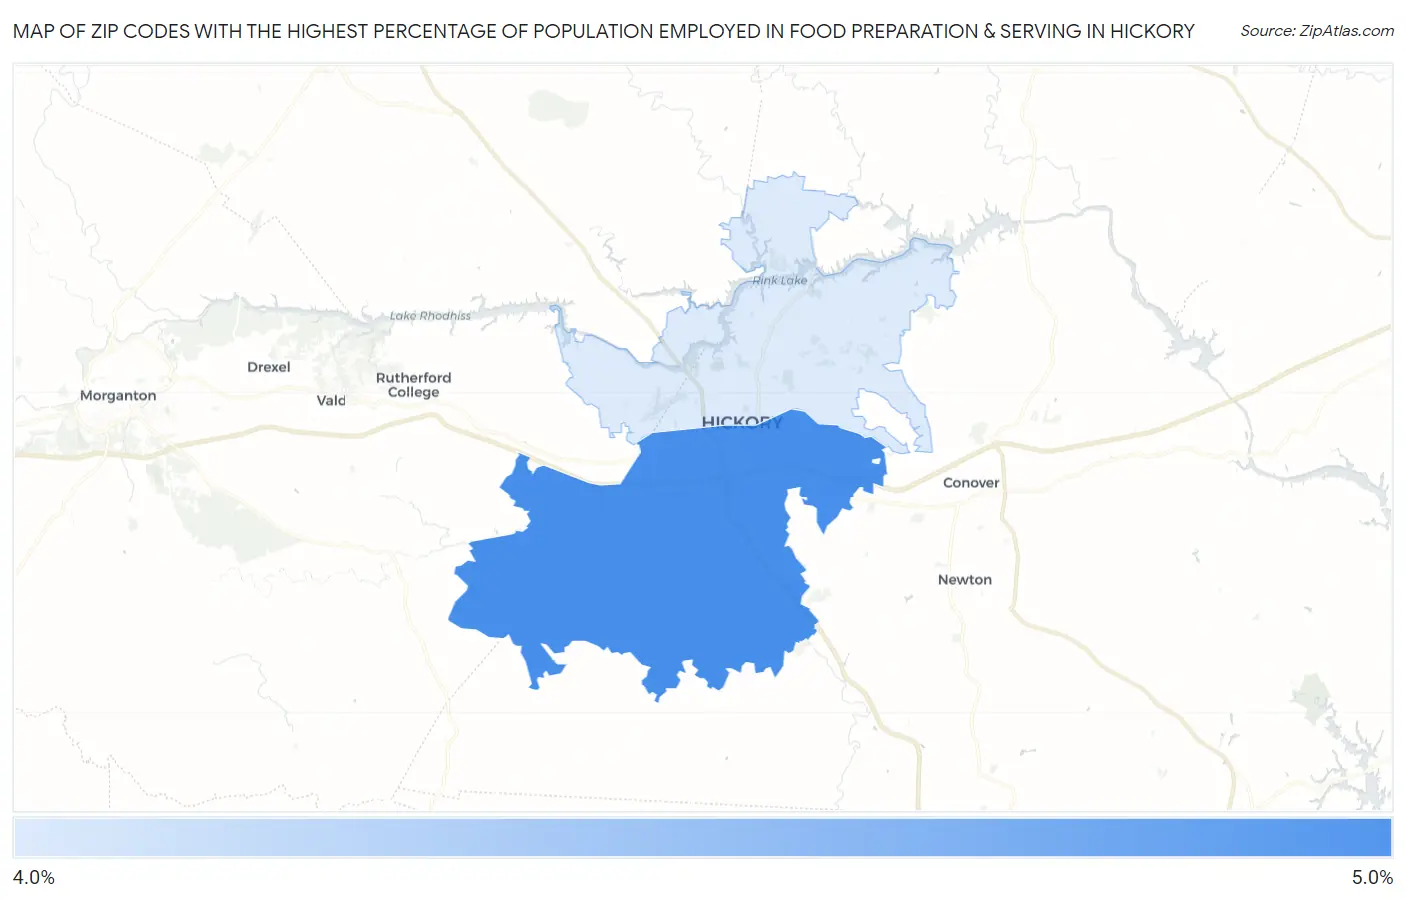
Zip Codes with the Highest Percentage of Population Employed in Food Preparation & Serving in Hickory, NC
RELATED REPORTS & OPTIONS
Food Preparation & Serving
Hickory
Compare Zip Codes
Map of Zip Codes with the Highest Percentage of Population Employed in Food Preparation & Serving in Hickory
4.7%
4.8%
Zip Codes with the Highest Percentage of Population Employed in Food Preparation & Serving in Hickory, NC
| Zip Code | % Employed | vs State | vs National | |
| 1. | 28602 | 4.8% | 5.3%(-0.515)#384 | 5.3%(-0.511)#13,842 |
| 2. | 28601 | 4.7% | 5.3%(-0.630)#398 | 5.3%(-0.626)#14,328 |
1
Common Questions
What are the Top Zip Codes with the Highest Percentage of Population Employed in Food Preparation & Serving in Hickory, NC?
Top Zip Codes with the Highest Percentage of Population Employed in Food Preparation & Serving in Hickory, NC are:
What zip code has the Highest Percentage of Population Employed in Food Preparation & Serving in Hickory, NC?
28602 has the Highest Percentage of Population Employed in Food Preparation & Serving in Hickory, NC with 4.8%.
What is the Percentage of Population Employed in Food Preparation & Serving in Hickory, NC?
Percentage of Population Employed in Food Preparation & Serving in Hickory is 4.2%.
What is the Percentage of Population Employed in Food Preparation & Serving in North Carolina?
Percentage of Population Employed in Food Preparation & Serving in North Carolina is 5.3%.
What is the Percentage of Population Employed in Food Preparation & Serving in the United States?
Percentage of Population Employed in Food Preparation & Serving in the United States is 5.3%.