Zip Codes with the Highest Percentage of Population Employed in Food Preparation & Serving in Rocky Mount, NC
RELATED REPORTS & OPTIONS
Food Preparation & Serving
Rocky Mount
Compare Zip Codes
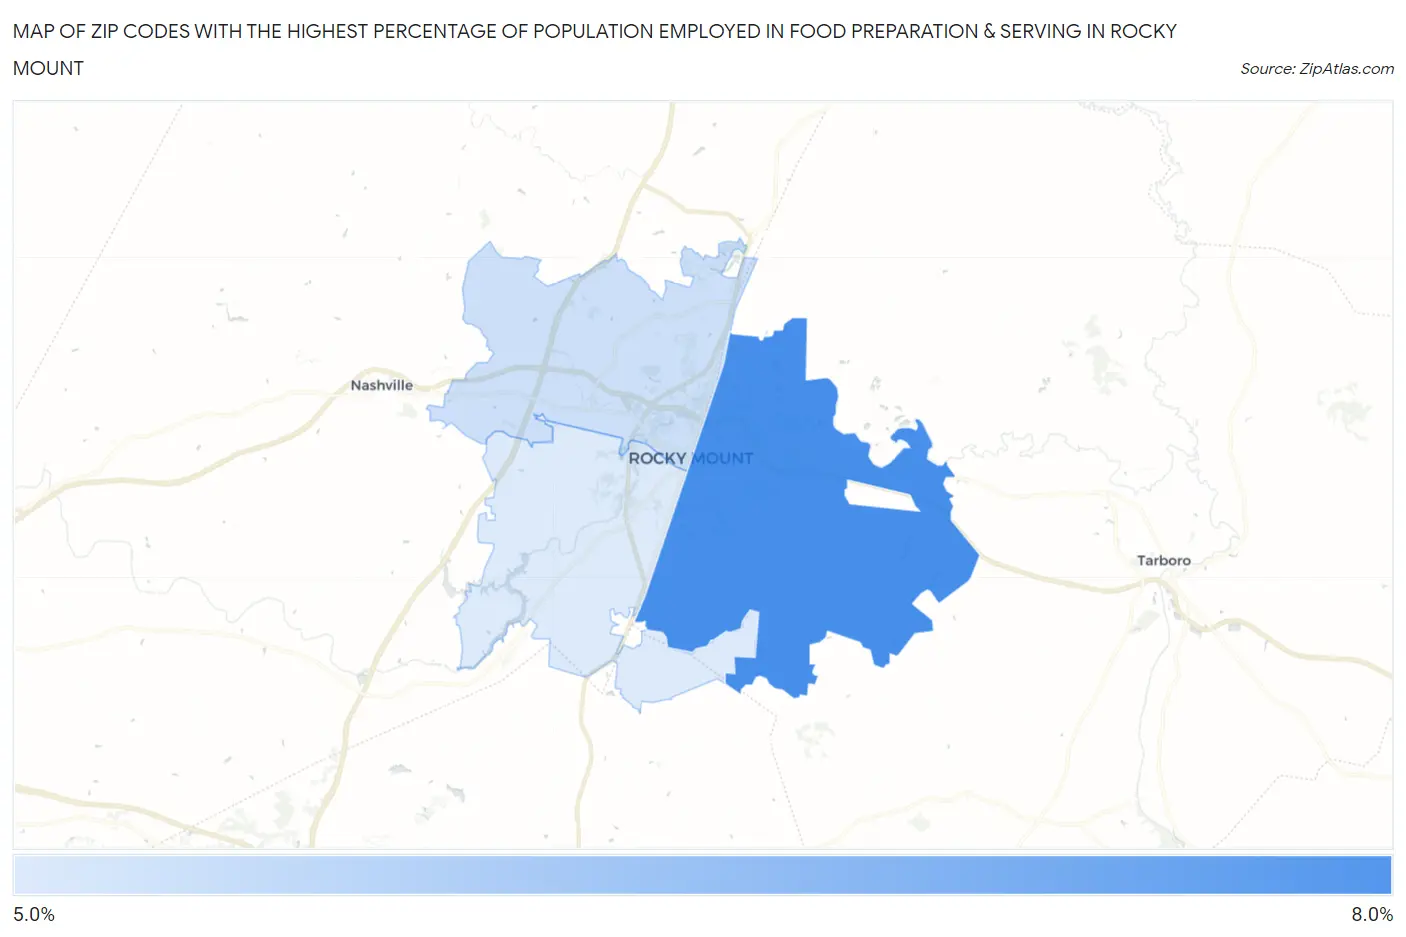
Map of Zip Codes with the Highest Percentage of Population Employed in Food Preparation & Serving in Rocky Mount
5.0%
6.8%
Zip Codes with the Highest Percentage of Population Employed in Food Preparation & Serving in Rocky Mount, NC
| Zip Code | % Employed | vs State | vs National | |
| 1. | 27801 | 6.8% | 5.3%(+1.48)#179 | 5.3%(+1.48)#7,160 |
| 2. | 27804 | 5.2% | 5.3%(-0.090)#336 | 5.3%(-0.085)#12,137 |
| 3. | 27803 | 5.0% | 5.3%(-0.288)#359 | 5.3%(-0.284)#12,936 |
1
Common Questions
What are the Top Zip Codes with the Highest Percentage of Population Employed in Food Preparation & Serving in Rocky Mount, NC?
Top Zip Codes with the Highest Percentage of Population Employed in Food Preparation & Serving in Rocky Mount, NC are:
What zip code has the Highest Percentage of Population Employed in Food Preparation & Serving in Rocky Mount, NC?
27801 has the Highest Percentage of Population Employed in Food Preparation & Serving in Rocky Mount, NC with 6.8%.
What is the Percentage of Population Employed in Food Preparation & Serving in Rocky Mount, NC?
Percentage of Population Employed in Food Preparation & Serving in Rocky Mount is 6.4%.
What is the Percentage of Population Employed in Food Preparation & Serving in North Carolina?
Percentage of Population Employed in Food Preparation & Serving in North Carolina is 5.3%.
What is the Percentage of Population Employed in Food Preparation & Serving in the United States?
Percentage of Population Employed in Food Preparation & Serving in the United States is 5.3%.