Zip Codes with the Highest Percentage of Population Employed in Food Preparation & Serving in Salisbury, NC
RELATED REPORTS & OPTIONS
Food Preparation & Serving
Salisbury
Compare Zip Codes
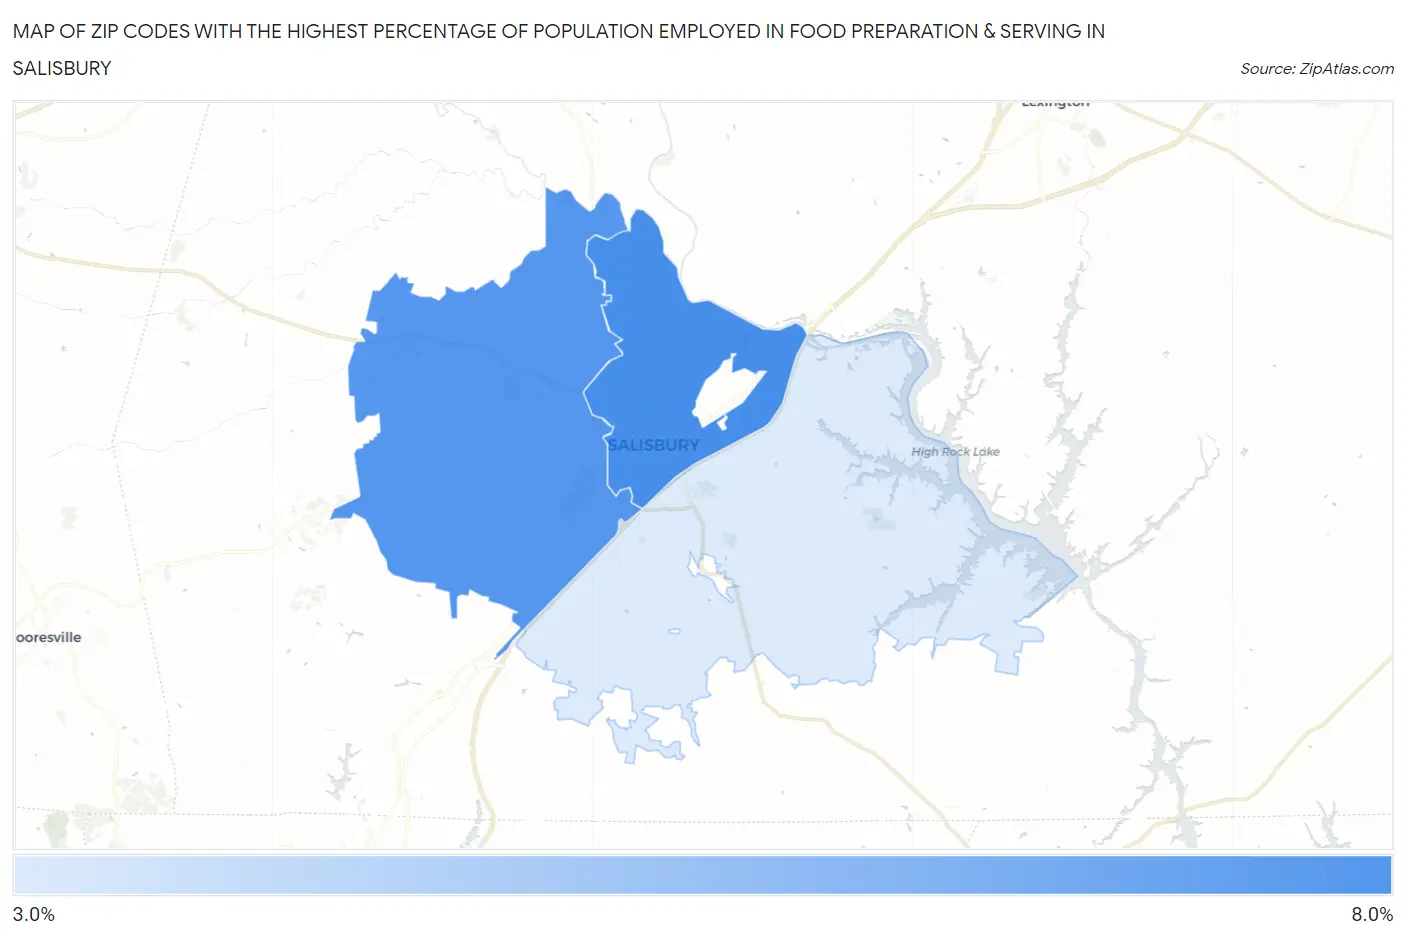
Map of Zip Codes with the Highest Percentage of Population Employed in Food Preparation & Serving in Salisbury
3.9%
6.4%
Zip Codes with the Highest Percentage of Population Employed in Food Preparation & Serving in Salisbury, NC
| Zip Code | % Employed | vs State | vs National | |
| 1. | 28144 | 6.4% | 5.3%(+1.15)#209 | 5.3%(+1.16)#8,030 |
| 2. | 28147 | 6.2% | 5.3%(+0.913)#233 | 5.3%(+0.917)#8,715 |
| 3. | 28146 | 3.9% | 5.3%(-1.39)#481 | 5.3%(-1.39)#17,538 |
1
Common Questions
What are the Top Zip Codes with the Highest Percentage of Population Employed in Food Preparation & Serving in Salisbury, NC?
Top Zip Codes with the Highest Percentage of Population Employed in Food Preparation & Serving in Salisbury, NC are:
What zip code has the Highest Percentage of Population Employed in Food Preparation & Serving in Salisbury, NC?
28144 has the Highest Percentage of Population Employed in Food Preparation & Serving in Salisbury, NC with 6.4%.
What is the Percentage of Population Employed in Food Preparation & Serving in Salisbury, NC?
Percentage of Population Employed in Food Preparation & Serving in Salisbury is 8.2%.
What is the Percentage of Population Employed in Food Preparation & Serving in North Carolina?
Percentage of Population Employed in Food Preparation & Serving in North Carolina is 5.3%.
What is the Percentage of Population Employed in Food Preparation & Serving in the United States?
Percentage of Population Employed in Food Preparation & Serving in the United States is 5.3%.