Foxfire, NC Map & Demographics
Foxfire Map
Foxfire Overview
$37,263
PER CAPITA INCOME
$88,472
AVG FAMILY INCOME
$69,782
AVG HOUSEHOLD INCOME
48.6%
WAGE / INCOME GAP [ % ]
51.4¢/ $1
WAGE / INCOME GAP [ $ ]
0.41
INEQUALITY / GINI INDEX
1,588
TOTAL POPULATION
738
MALE POPULATION
850
FEMALE POPULATION
86.82
MALES / 100 FEMALES
115.18
FEMALES / 100 MALES
38.7
MEDIAN AGE
3.2
AVG FAMILY SIZE
2.7
AVG HOUSEHOLD SIZE
591
LABOR FORCE [ PEOPLE ]
48.5%
PERCENT IN LABOR FORCE
1.2%
UNEMPLOYMENT RATE
Income in Foxfire
Income Overview in Foxfire
Per Capita Income in Foxfire is $37,263, while median incomes of families and households are $88,472 and $69,782 respectively.
| Characteristic | Number | Measure |
| Per Capita Income | 1,588 | $37,263 |
| Median Family Income | 443 | $88,472 |
| Mean Family Income | 443 | $117,380 |
| Median Household Income | 597 | $69,782 |
| Mean Household Income | 597 | $101,612 |
| Income Deficit | 443 | $0 |
| Wage / Income Gap (%) | 1,588 | 48.59% |
| Wage / Income Gap ($) | 1,588 | 51.41¢ per $1 |
| Gini / Inequality Index | 1,588 | 0.41 |
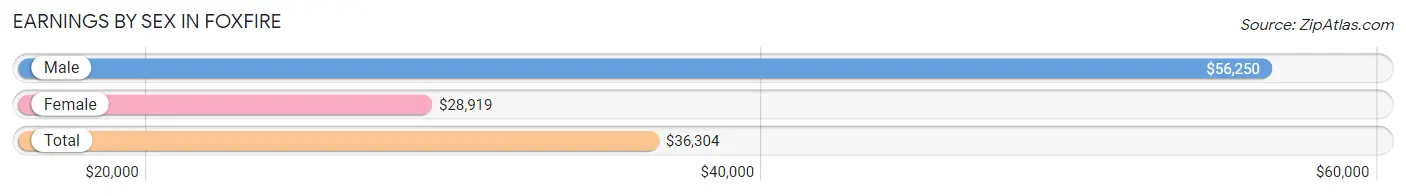
Earnings by Sex in Foxfire
Average Earnings in Foxfire are $36,304, $56,250 for men and $28,919 for women, a difference of 48.6%.
| Sex | Number | Average Earnings |
| Male | 328 (52.4%) | $56,250 |
| Female | 298 (47.6%) | $28,919 |
| Total | 626 (100.0%) | $36,304 |
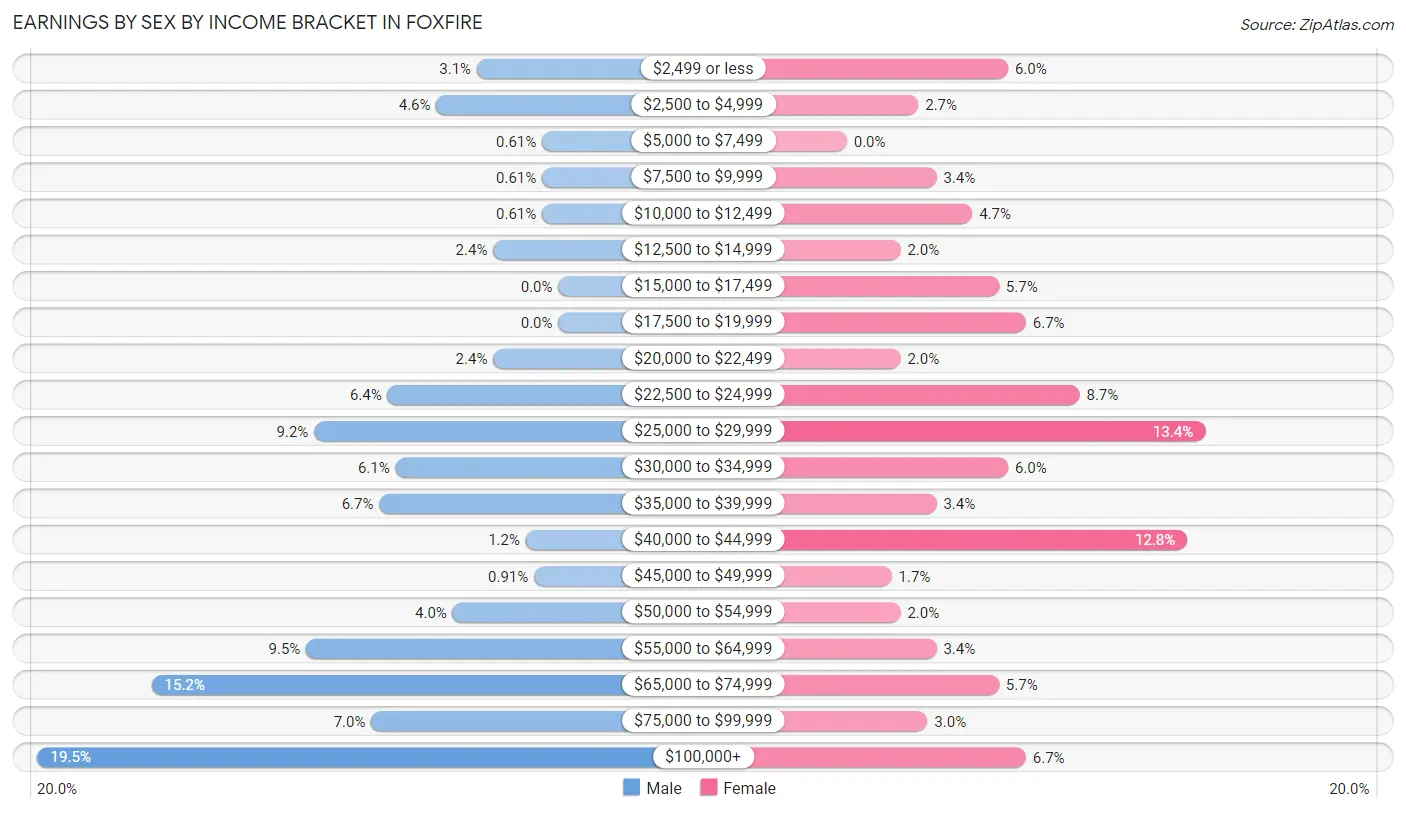
Earnings by Sex by Income Bracket in Foxfire
The most common earnings brackets in Foxfire are $100,000+ for men (64 | 19.5%) and $25,000 to $29,999 for women (40 | 13.4%).
| Income | Male | Female |
| $2,499 or less | 10 (3.0%) | 18 (6.0%) |
| $2,500 to $4,999 | 15 (4.6%) | 8 (2.7%) |
| $5,000 to $7,499 | 2 (0.6%) | 0 (0.0%) |
| $7,500 to $9,999 | 2 (0.6%) | 10 (3.4%) |
| $10,000 to $12,499 | 2 (0.6%) | 14 (4.7%) |
| $12,500 to $14,999 | 8 (2.4%) | 6 (2.0%) |
| $15,000 to $17,499 | 0 (0.0%) | 17 (5.7%) |
| $17,500 to $19,999 | 0 (0.0%) | 20 (6.7%) |
| $20,000 to $22,499 | 8 (2.4%) | 6 (2.0%) |
| $22,500 to $24,999 | 21 (6.4%) | 26 (8.7%) |
| $25,000 to $29,999 | 30 (9.1%) | 40 (13.4%) |
| $30,000 to $34,999 | 20 (6.1%) | 18 (6.0%) |
| $35,000 to $39,999 | 22 (6.7%) | 10 (3.4%) |
| $40,000 to $44,999 | 4 (1.2%) | 38 (12.8%) |
| $45,000 to $49,999 | 3 (0.9%) | 5 (1.7%) |
| $50,000 to $54,999 | 13 (4.0%) | 6 (2.0%) |
| $55,000 to $64,999 | 31 (9.5%) | 10 (3.4%) |
| $65,000 to $74,999 | 50 (15.2%) | 17 (5.7%) |
| $75,000 to $99,999 | 23 (7.0%) | 9 (3.0%) |
| $100,000+ | 64 (19.5%) | 20 (6.7%) |
| Total | 328 (100.0%) | 298 (100.0%) |
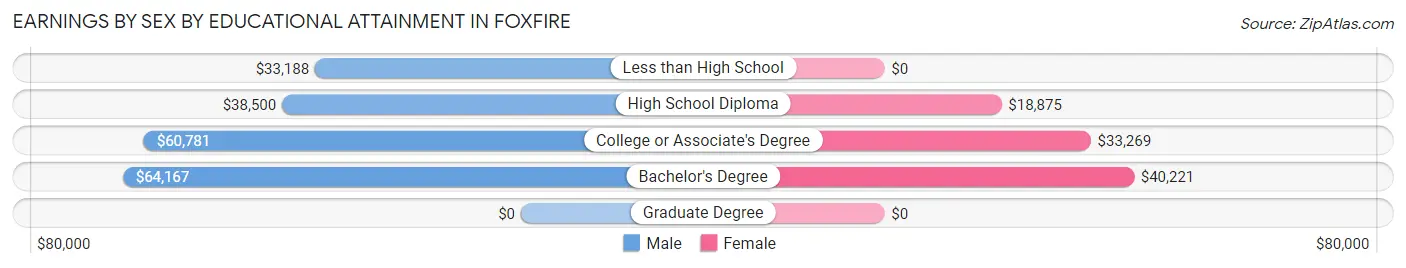
Earnings by Sex by Educational Attainment in Foxfire
Average earnings in Foxfire are $60,341 for men and $31,250 for women, a difference of 48.2%. Men with an educational attainment of bachelor's degree enjoy the highest average annual earnings of $64,167, while those with less than high school education earn the least with $33,188. Women with an educational attainment of bachelor's degree earn the most with the average annual earnings of $40,221, while those with high school diploma education have the smallest earnings of $18,875.
| Educational Attainment | Male Income | Female Income |
| Less than High School | $33,188 | $0 |
| High School Diploma | $38,500 | $18,875 |
| College or Associate's Degree | $60,781 | $33,269 |
| Bachelor's Degree | $64,167 | $40,221 |
| Graduate Degree | - | - |
| Total | $60,341 | $31,250 |
Family Income in Foxfire
Family Income Brackets in Foxfire
According to the Foxfire family income data, there are 120 families falling into the $50,000 to $74,999 income range, which is the most common income bracket and makes up 27.1% of all families.
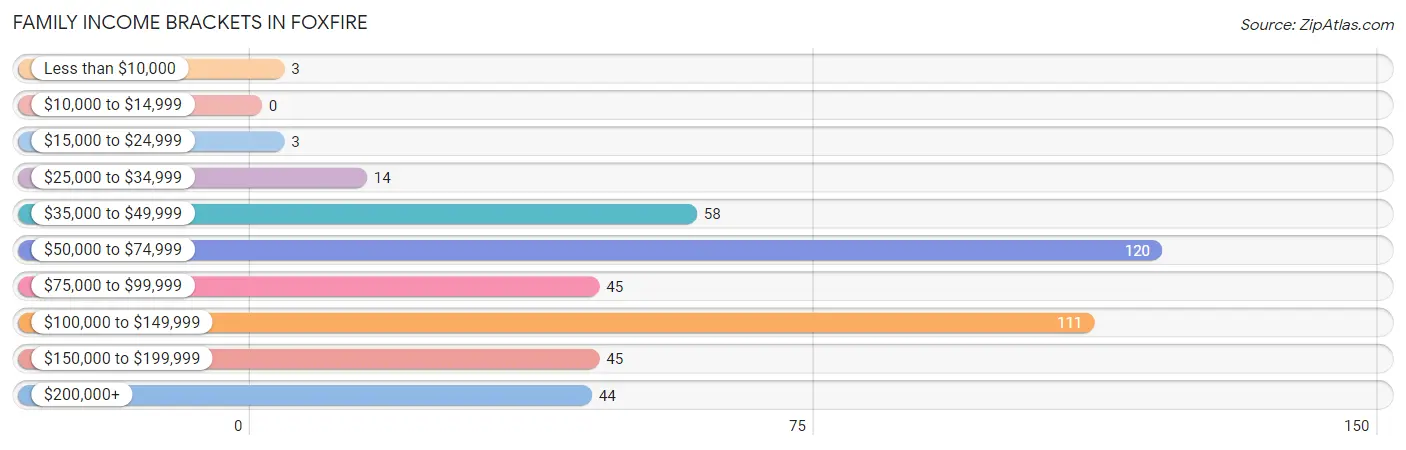
| Income Bracket | # Families | % Families |
| Less than $10,000 | 3 | 0.7% |
| $10,000 to $14,999 | 0 | 0.0% |
| $15,000 to $24,999 | 3 | 0.7% |
| $25,000 to $34,999 | 14 | 3.2% |
| $35,000 to $49,999 | 58 | 13.1% |
| $50,000 to $74,999 | 120 | 27.1% |
| $75,000 to $99,999 | 45 | 10.2% |
| $100,000 to $149,999 | 111 | 25.1% |
| $150,000 to $199,999 | 45 | 10.2% |
| $200,000+ | 44 | 9.9% |
Family Income by Famaliy Size in Foxfire
6-person families (24 | 5.4%) account for the highest median family income in Foxfire with $149,375 per family, while 2-person families (231 | 52.1%) have the highest median income of $47,344 per family member.
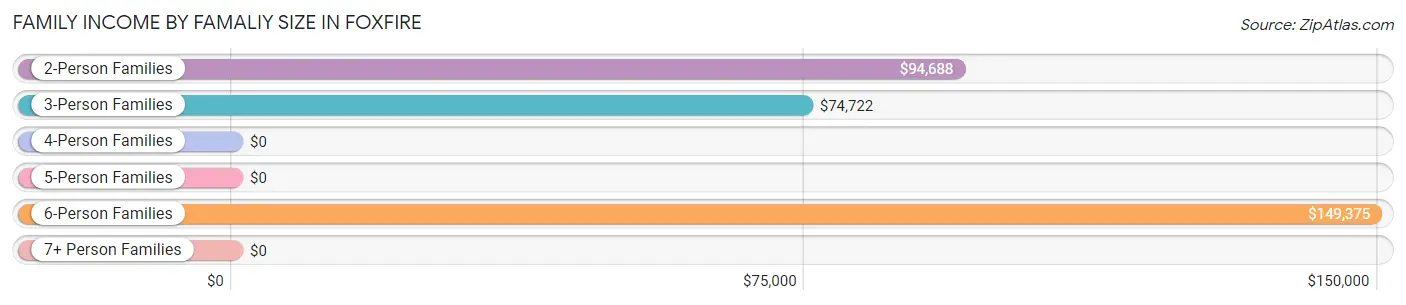
| Income Bracket | # Families | Median Income |
| 2-Person Families | 231 (52.1%) | $94,688 |
| 3-Person Families | 48 (10.8%) | $74,722 |
| 4-Person Families | 93 (21.0%) | $0 |
| 5-Person Families | 47 (10.6%) | $0 |
| 6-Person Families | 24 (5.4%) | $149,375 |
| 7+ Person Families | 0 (0.0%) | $0 |
| Total | 443 (100.0%) | $88,472 |
Family Income by Number of Earners in Foxfire
The median family income in Foxfire is $88,472, with families comprising 3+ earners (16) having the highest median family income of $210,833, while families with no earners (92) have the lowest median family income of $69,821, accounting for 3.6% and 20.8% of families, respectively.
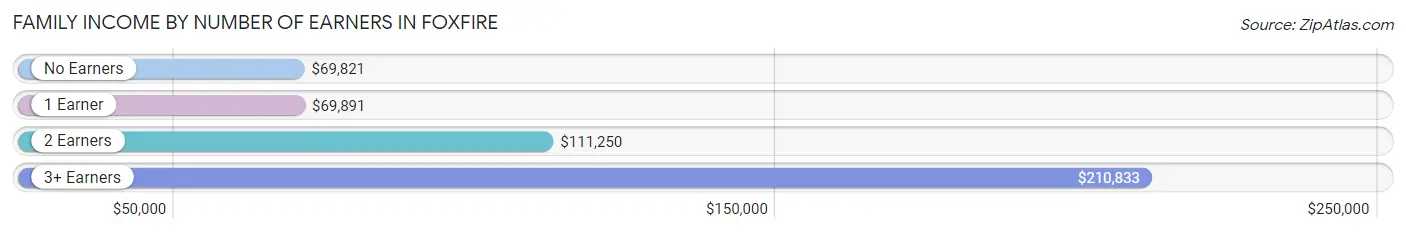
| Number of Earners | # Families | Median Income |
| No Earners | 92 (20.8%) | $69,821 |
| 1 Earner | 184 (41.5%) | $69,891 |
| 2 Earners | 151 (34.1%) | $111,250 |
| 3+ Earners | 16 (3.6%) | $210,833 |
| Total | 443 (100.0%) | $88,472 |
Household Income in Foxfire
Household Income Brackets in Foxfire
With 151 households falling in the category, the $50,000 to $74,999 income range is the most frequent in Foxfire, accounting for 25.3% of all households. In contrast, only 3 households (0.5%) fall into the less than $10,000 income bracket, making it the least populous group.
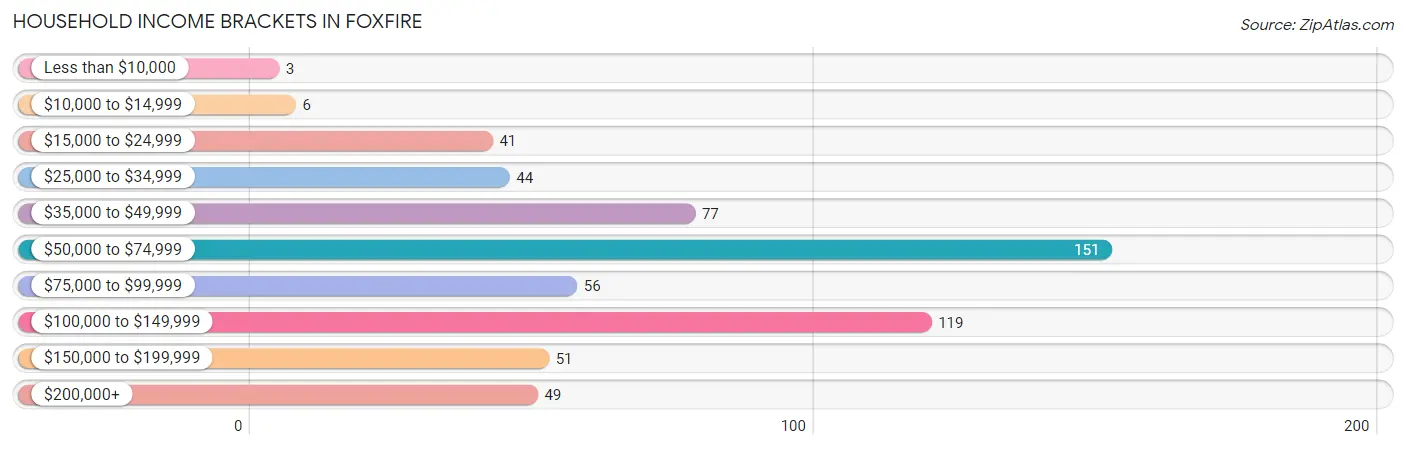
| Income Bracket | # Households | % Households |
| Less than $10,000 | 3 | 0.5% |
| $10,000 to $14,999 | 6 | 1.0% |
| $15,000 to $24,999 | 41 | 6.9% |
| $25,000 to $34,999 | 44 | 7.4% |
| $35,000 to $49,999 | 77 | 12.9% |
| $50,000 to $74,999 | 151 | 25.3% |
| $75,000 to $99,999 | 56 | 9.4% |
| $100,000 to $149,999 | 119 | 19.9% |
| $150,000 to $199,999 | 51 | 8.5% |
| $200,000+ | 49 | 8.2% |
Household Income by Householder Age in Foxfire
The median household income in Foxfire is $69,782, with the highest median household income of $111,250 found in the 45 to 64 years age bracket for the primary householder. A total of 200 households (33.5%) fall into this category. Meanwhile, the 15 to 24 years age bracket for the primary householder has the lowest median household income of $0, with 15 households (2.5%) in this group.
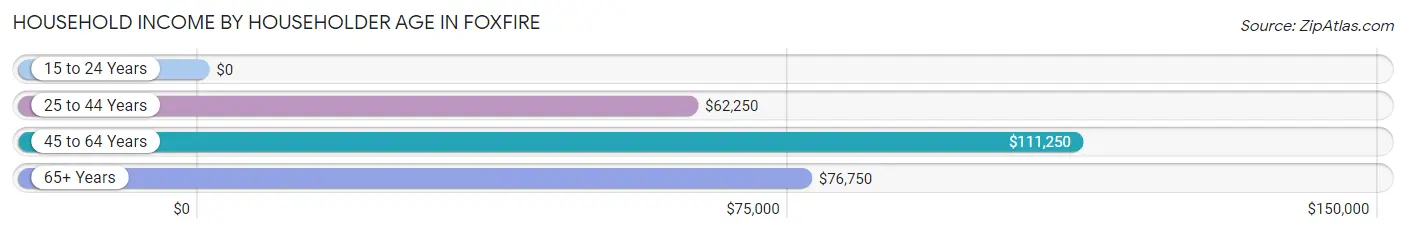
| Income Bracket | # Households | Median Income |
| 15 to 24 Years | 15 (2.5%) | $0 |
| 25 to 44 Years | 157 (26.3%) | $62,250 |
| 45 to 64 Years | 200 (33.5%) | $111,250 |
| 65+ Years | 225 (37.7%) | $76,750 |
| Total | 597 (100.0%) | $69,782 |
Poverty in Foxfire
Income Below Poverty by Sex and Age in Foxfire
With 1.6% poverty level for males and 1.1% for females among the residents of Foxfire, 12 to 14 year old males and 75 year old and over females are the most vulnerable to poverty, with 3 males (30.0%) and 3 females (4.2%) in their respective age groups living below the poverty level.
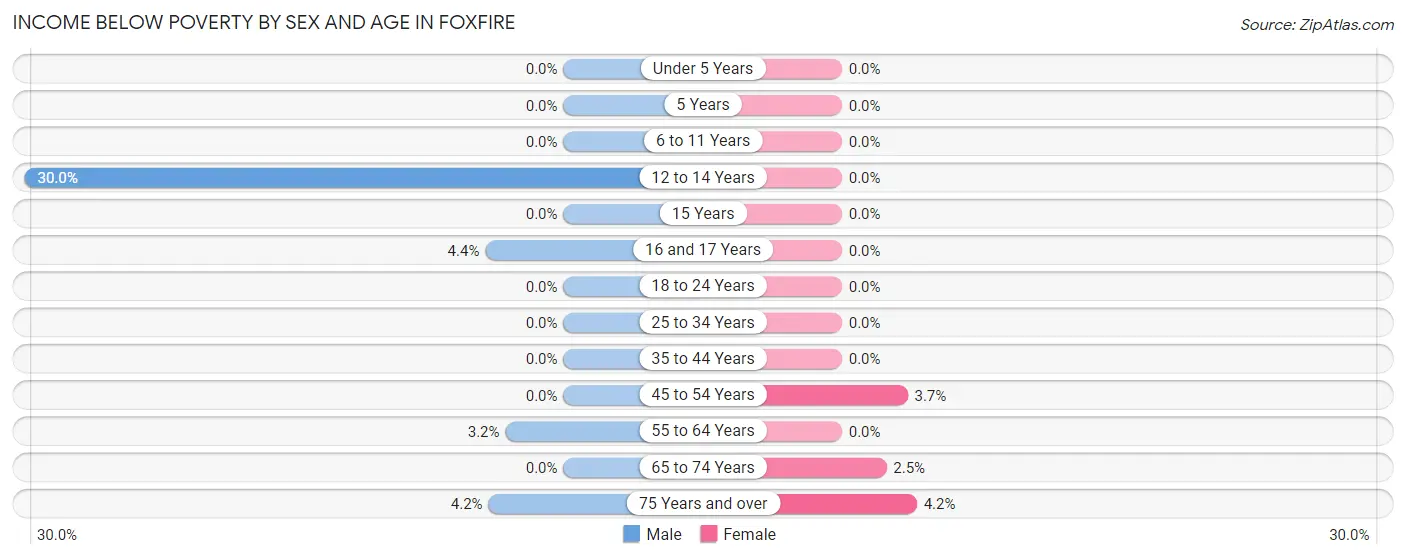
| Age Bracket | Male | Female |
| Under 5 Years | 0 (0.0%) | 0 (0.0%) |
| 5 Years | 0 (0.0%) | 0 (0.0%) |
| 6 to 11 Years | 0 (0.0%) | 0 (0.0%) |
| 12 to 14 Years | 3 (30.0%) | 0 (0.0%) |
| 15 Years | 0 (0.0%) | 0 (0.0%) |
| 16 and 17 Years | 3 (4.3%) | 0 (0.0%) |
| 18 to 24 Years | 0 (0.0%) | 0 (0.0%) |
| 25 to 34 Years | 0 (0.0%) | 0 (0.0%) |
| 35 to 44 Years | 0 (0.0%) | 0 (0.0%) |
| 45 to 54 Years | 0 (0.0%) | 3 (3.7%) |
| 55 to 64 Years | 3 (3.2%) | 0 (0.0%) |
| 65 to 74 Years | 0 (0.0%) | 3 (2.5%) |
| 75 Years and over | 3 (4.2%) | 3 (4.2%) |
| Total | 12 (1.6%) | 9 (1.1%) |
Income Above Poverty by Sex and Age in Foxfire
According to the poverty statistics in Foxfire, males aged under 5 years and females aged under 5 years are the age groups that are most secure financially, with 100.0% of males and 100.0% of females in these age groups living above the poverty line.
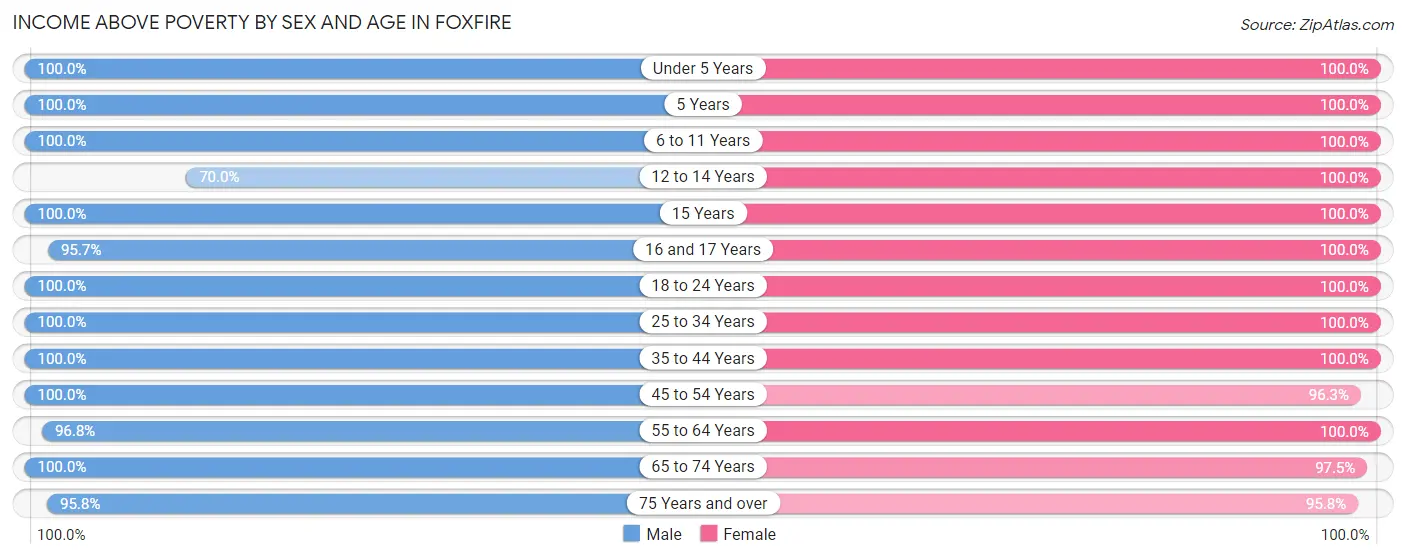
| Age Bracket | Male | Female |
| Under 5 Years | 86 (100.0%) | 25 (100.0%) |
| 5 Years | 8 (100.0%) | 9 (100.0%) |
| 6 to 11 Years | 31 (100.0%) | 95 (100.0%) |
| 12 to 14 Years | 7 (70.0%) | 95 (100.0%) |
| 15 Years | 8 (100.0%) | 3 (100.0%) |
| 16 and 17 Years | 66 (95.7%) | 11 (100.0%) |
| 18 to 24 Years | 36 (100.0%) | 47 (100.0%) |
| 25 to 34 Years | 52 (100.0%) | 59 (100.0%) |
| 35 to 44 Years | 111 (100.0%) | 130 (100.0%) |
| 45 to 54 Years | 64 (100.0%) | 79 (96.3%) |
| 55 to 64 Years | 90 (96.8%) | 101 (100.0%) |
| 65 to 74 Years | 98 (100.0%) | 118 (97.5%) |
| 75 Years and over | 69 (95.8%) | 69 (95.8%) |
| Total | 726 (98.4%) | 841 (98.9%) |
Income Below Poverty Among Married-Couple Families in Foxfire
The poverty statistics for married-couple families in Foxfire show that 1.6% or 6 of the total 366 families live below the poverty line. Families with 1 or 2 children have the highest poverty rate of 3.5%, comprising of 3 families. On the other hand, families with 3 or 4 children have the lowest poverty rate of 0.0%, which includes 0 families.

| Children | Above Poverty | Below Poverty |
| No Children | 229 (98.7%) | 3 (1.3%) |
| 1 or 2 Children | 83 (96.5%) | 3 (3.5%) |
| 3 or 4 Children | 48 (100.0%) | 0 (0.0%) |
| 5 or more Children | 0 (0.0%) | 0 (0.0%) |
| Total | 360 (98.4%) | 6 (1.6%) |
Income Below Poverty Among Single-Parent Households in Foxfire
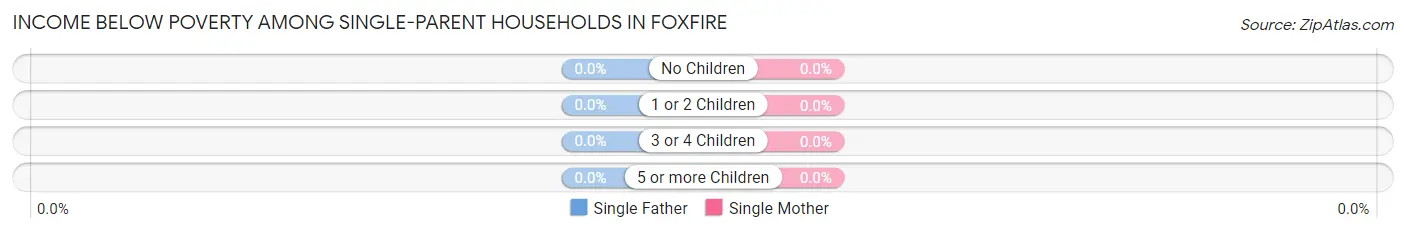
| Children | Single Father | Single Mother |
| No Children | 0 (0.0%) | 0 (0.0%) |
| 1 or 2 Children | 0 (0.0%) | 0 (0.0%) |
| 3 or 4 Children | 0 (0.0%) | 0 (0.0%) |
| 5 or more Children | 0 (0.0%) | 0 (0.0%) |
| Total | 0 (0.0%) | 0 (0.0%) |
Income Below Poverty Among Married-Couple vs Single-Parent Households in Foxfire
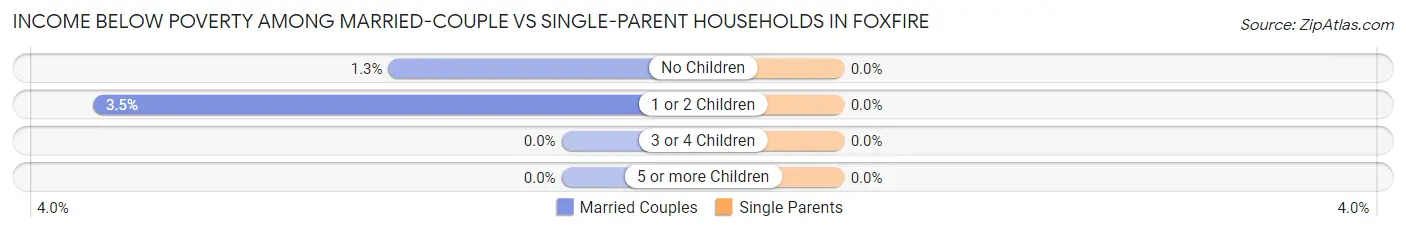
| Children | Married-Couple Families | Single-Parent Households |
| No Children | 3 (1.3%) | 0 (0.0%) |
| 1 or 2 Children | 3 (3.5%) | 0 (0.0%) |
| 3 or 4 Children | 0 (0.0%) | 0 (0.0%) |
| 5 or more Children | 0 (0.0%) | 0 (0.0%) |
| Total | 6 (1.6%) | 0 (0.0%) |
Race in Foxfire
The most populous races in Foxfire are White / Caucasian (1,267 | 79.8%), Two or more Races (144 | 9.1%), and Black / African American (137 | 8.6%).
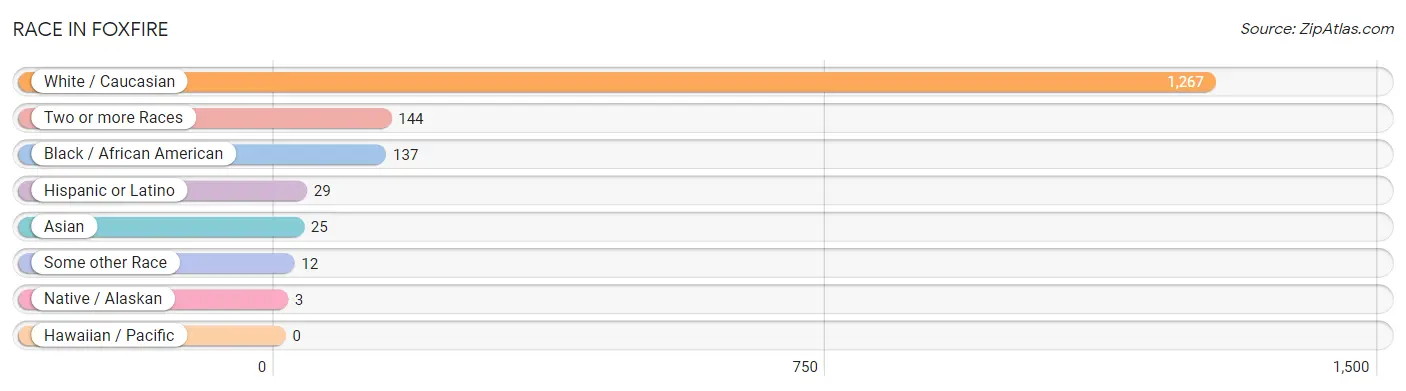
| Race | # Population | % Population |
| Asian | 25 | 1.6% |
| Black / African American | 137 | 8.6% |
| Hawaiian / Pacific | 0 | 0.0% |
| Hispanic or Latino | 29 | 1.8% |
| Native / Alaskan | 3 | 0.2% |
| White / Caucasian | 1,267 | 79.8% |
| Two or more Races | 144 | 9.1% |
| Some other Race | 12 | 0.8% |
| Total | 1,588 | 100.0% |
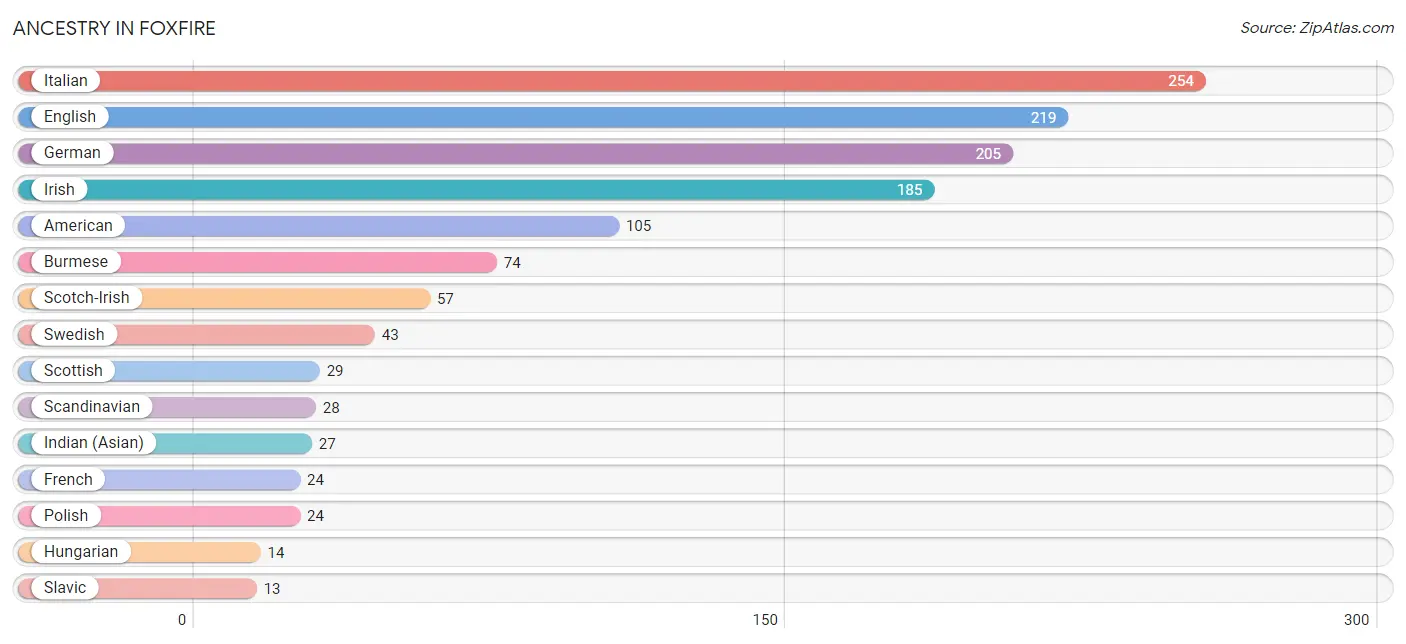
Ancestry in Foxfire
The most populous ancestries reported in Foxfire are Italian (254 | 16.0%), English (219 | 13.8%), German (205 | 12.9%), Irish (185 | 11.7%), and American (105 | 6.6%), together accounting for 61.0% of all Foxfire residents.
| Ancestry | # Population | % Population |
| African | 12 | 0.8% |
| American | 105 | 6.6% |
| Argentinean | 3 | 0.2% |
| Brazilian | 7 | 0.4% |
| British | 12 | 0.8% |
| Burmese | 74 | 4.7% |
| Central American | 6 | 0.4% |
| Cherokee | 3 | 0.2% |
| Cuban | 5 | 0.3% |
| English | 219 | 13.8% |
| European | 7 | 0.4% |
| French | 24 | 1.5% |
| French Canadian | 2 | 0.1% |
| German | 205 | 12.9% |
| Greek | 5 | 0.3% |
| Honduran | 6 | 0.4% |
| Hungarian | 14 | 0.9% |
| Indian (Asian) | 27 | 1.7% |
| Irish | 185 | 11.7% |
| Iroquois | 3 | 0.2% |
| Italian | 254 | 16.0% |
| Korean | 4 | 0.3% |
| Mexican | 6 | 0.4% |
| Norwegian | 11 | 0.7% |
| Polish | 24 | 1.5% |
| Puerto Rican | 6 | 0.4% |
| Scandinavian | 28 | 1.8% |
| Scotch-Irish | 57 | 3.6% |
| Scottish | 29 | 1.8% |
| Serbian | 2 | 0.1% |
| Slavic | 13 | 0.8% |
| South American | 3 | 0.2% |
| Spanish | 3 | 0.2% |
| Subsaharan African | 12 | 0.8% |
| Swedish | 43 | 2.7% |
| Swiss | 5 | 0.3% |
| Ukrainian | 3 | 0.2% |
| Welsh | 5 | 0.3% | View All 38 Rows |
Immigrants in Foxfire
The most numerous immigrant groups reported in Foxfire came from Asia (20 | 1.3%), India (20 | 1.3%), South Central Asia (20 | 1.3%), Europe (13 | 0.8%), and Latin America (11 | 0.7%), together accounting for 5.3% of all Foxfire residents.
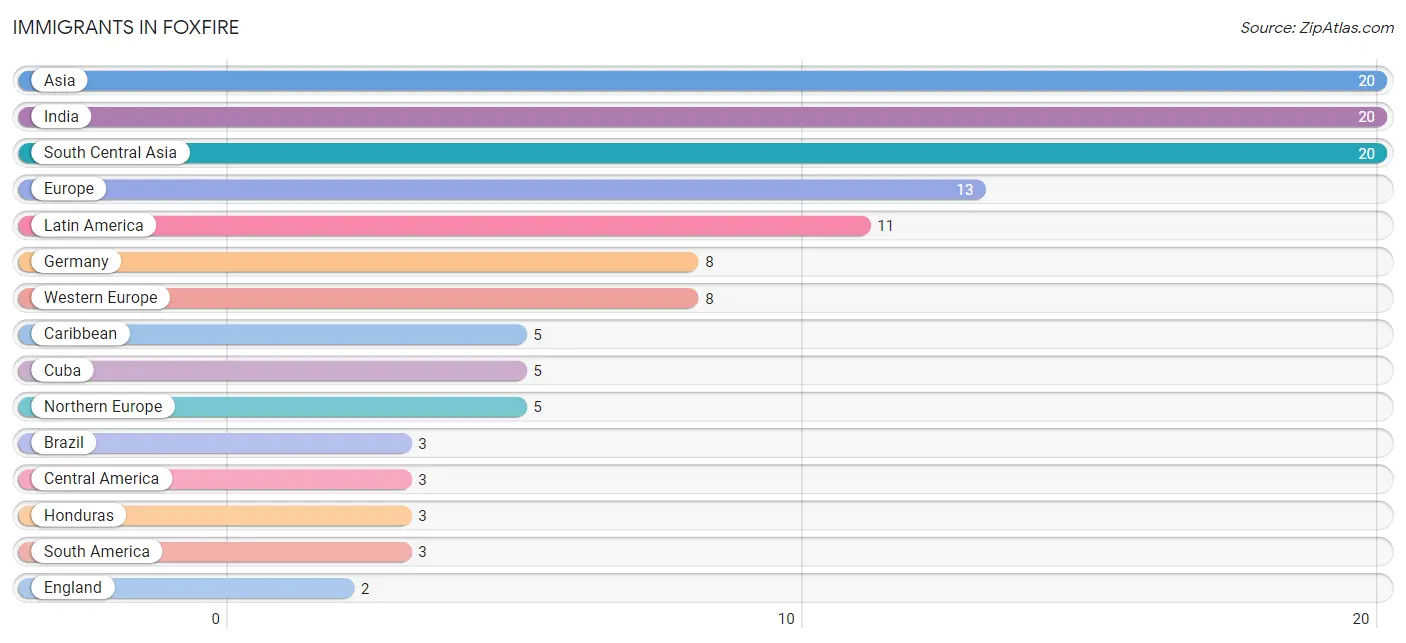
| Immigration Origin | # Population | % Population |
| Asia | 20 | 1.3% |
| Brazil | 3 | 0.2% |
| Caribbean | 5 | 0.3% |
| Central America | 3 | 0.2% |
| Cuba | 5 | 0.3% |
| England | 2 | 0.1% |
| Europe | 13 | 0.8% |
| Germany | 8 | 0.5% |
| Honduras | 3 | 0.2% |
| India | 20 | 1.3% |
| Latin America | 11 | 0.7% |
| Northern Europe | 5 | 0.3% |
| South America | 3 | 0.2% |
| South Central Asia | 20 | 1.3% |
| Western Europe | 8 | 0.5% | View All 15 Rows |
Sex and Age in Foxfire
Sex and Age in Foxfire
The most populous age groups in Foxfire are 15 to 19 Years (97 | 13.1%) for men and 10 to 14 Years (153 | 18.0%) for women.
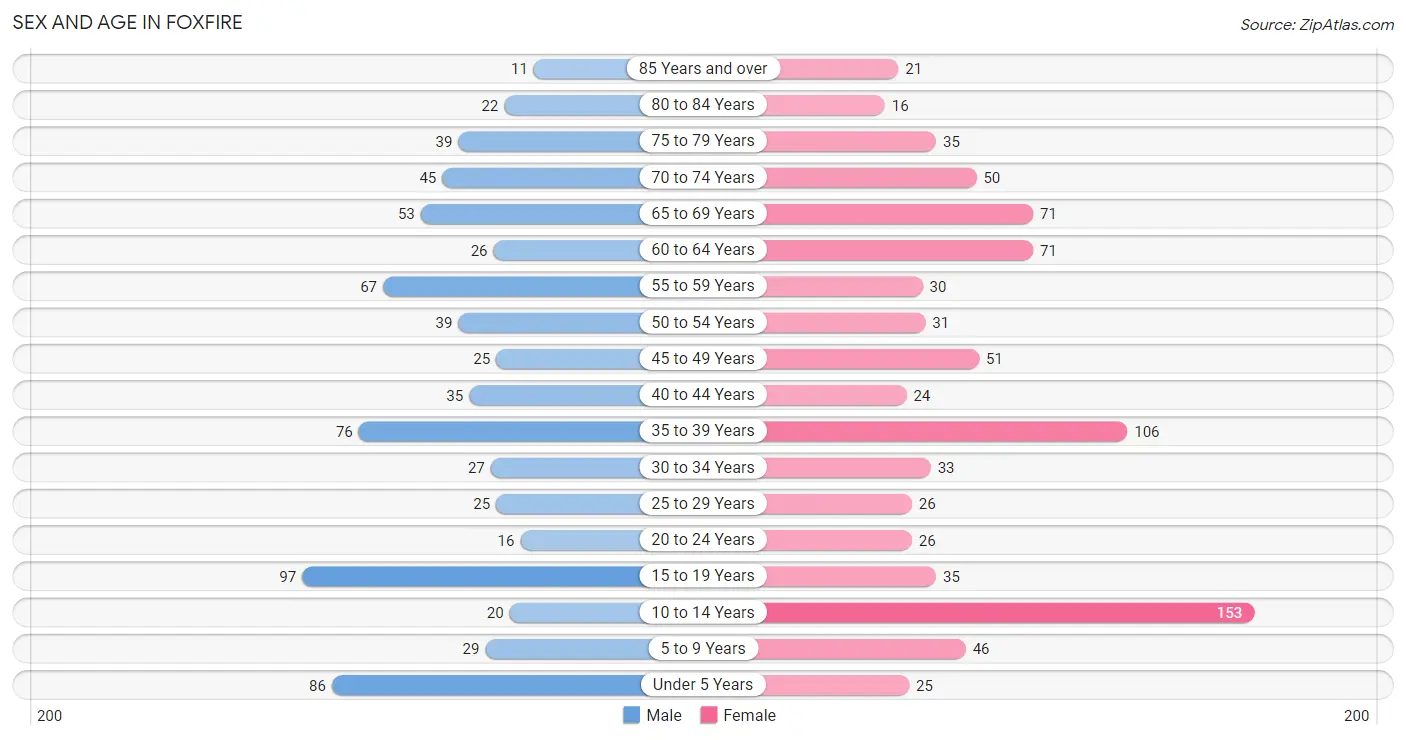
| Age Bracket | Male | Female |
| Under 5 Years | 86 (11.7%) | 25 (2.9%) |
| 5 to 9 Years | 29 (3.9%) | 46 (5.4%) |
| 10 to 14 Years | 20 (2.7%) | 153 (18.0%) |
| 15 to 19 Years | 97 (13.1%) | 35 (4.1%) |
| 20 to 24 Years | 16 (2.2%) | 26 (3.1%) |
| 25 to 29 Years | 25 (3.4%) | 26 (3.1%) |
| 30 to 34 Years | 27 (3.7%) | 33 (3.9%) |
| 35 to 39 Years | 76 (10.3%) | 106 (12.5%) |
| 40 to 44 Years | 35 (4.7%) | 24 (2.8%) |
| 45 to 49 Years | 25 (3.4%) | 51 (6.0%) |
| 50 to 54 Years | 39 (5.3%) | 31 (3.6%) |
| 55 to 59 Years | 67 (9.1%) | 30 (3.5%) |
| 60 to 64 Years | 26 (3.5%) | 71 (8.4%) |
| 65 to 69 Years | 53 (7.2%) | 71 (8.4%) |
| 70 to 74 Years | 45 (6.1%) | 50 (5.9%) |
| 75 to 79 Years | 39 (5.3%) | 35 (4.1%) |
| 80 to 84 Years | 22 (3.0%) | 16 (1.9%) |
| 85 Years and over | 11 (1.5%) | 21 (2.5%) |
| Total | 738 (100.0%) | 850 (100.0%) |
Families and Households in Foxfire
Median Family Size in Foxfire
The median family size in Foxfire is 3.18 persons per family, with single female/mother families (70 | 15.8%) accounting for the largest median family size of 3.37 persons per family. On the other hand, single male/father families (7 | 1.6%) represent the smallest median family size with 2.00 persons per family.
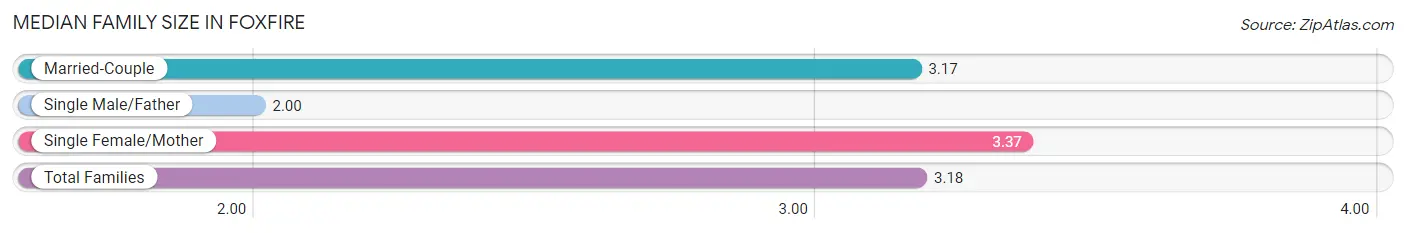
| Family Type | # Families | Family Size |
| Married-Couple | 366 (82.6%) | 3.17 |
| Single Male/Father | 7 (1.6%) | 2.00 |
| Single Female/Mother | 70 (15.8%) | 3.37 |
| Total Families | 443 (100.0%) | 3.18 |
Median Household Size in Foxfire
The median household size in Foxfire is 2.66 persons per household, with single female/mother households (70 | 11.7%) accounting for the largest median household size of 3.37 persons per household. non-family households (154 | 25.8%) represent the smallest median household size with 1.14 persons per household.
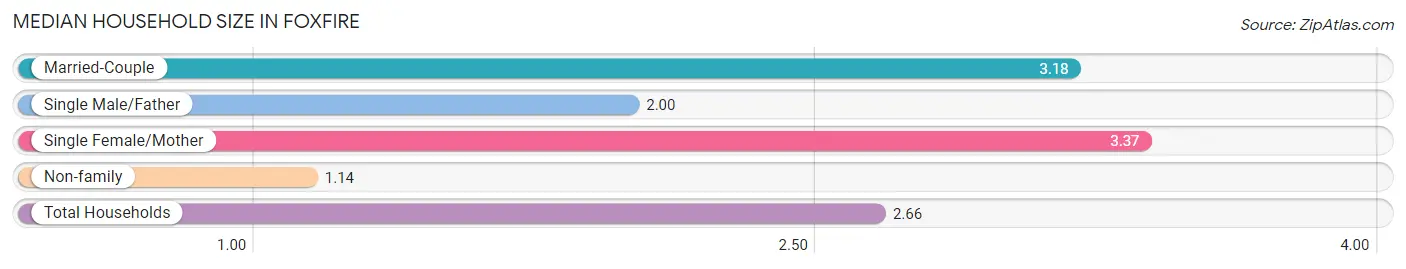
| Household Type | # Households | Household Size |
| Married-Couple | 366 (61.3%) | 3.18 |
| Single Male/Father | 7 (1.2%) | 2.00 |
| Single Female/Mother | 70 (11.7%) | 3.37 |
| Non-family | 154 (25.8%) | 1.14 |
| Total Households | 597 (100.0%) | 2.66 |
Household Size by Marriage Status in Foxfire
Out of a total of 597 households in Foxfire, 443 (74.2%) are family households, while 154 (25.8%) are nonfamily households. The most numerous type of family households are 2-person households, comprising 229, and the most common type of nonfamily households are 1-person households, comprising 128.
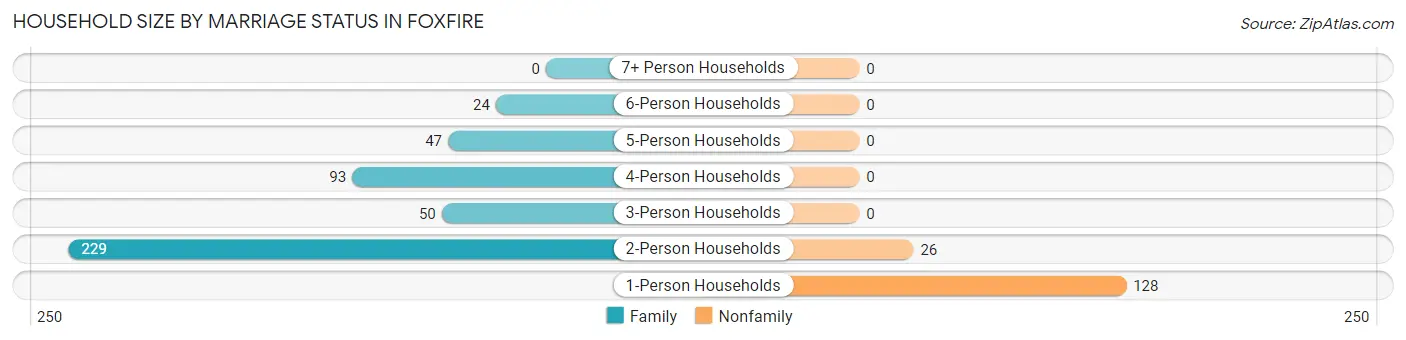
| Household Size | Family Households | Nonfamily Households |
| 1-Person Households | - | 128 (21.4%) |
| 2-Person Households | 229 (38.4%) | 26 (4.4%) |
| 3-Person Households | 50 (8.4%) | 0 (0.0%) |
| 4-Person Households | 93 (15.6%) | 0 (0.0%) |
| 5-Person Households | 47 (7.9%) | 0 (0.0%) |
| 6-Person Households | 24 (4.0%) | 0 (0.0%) |
| 7+ Person Households | 0 (0.0%) | 0 (0.0%) |
| Total | 443 (74.2%) | 154 (25.8%) |
Female Fertility in Foxfire
Fertility by Age in Foxfire
Average fertility rate in Foxfire is 26.0 births per 1,000 women. Women in the age bracket of 20 to 34 years have the highest fertility rate with 94.0 births per 1,000 women. Women in the age bracket of 20 to 34 years acount for 100.0% of all women with births.
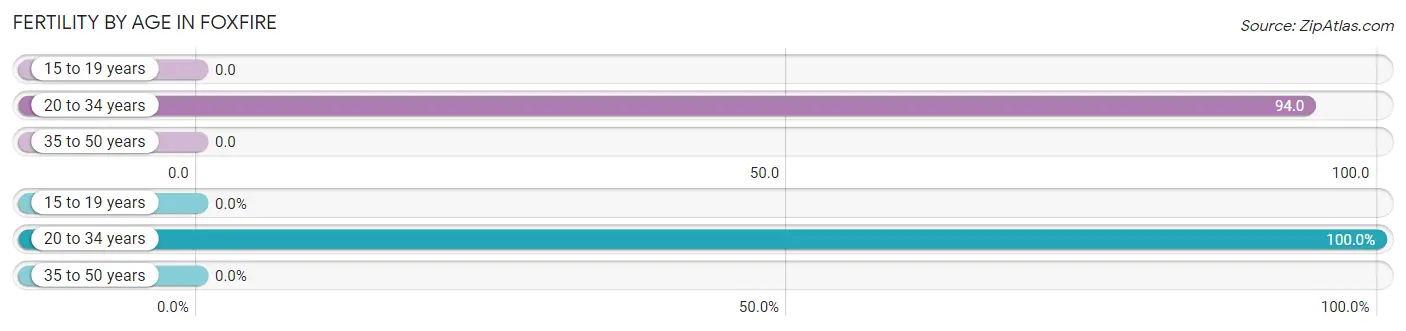
| Age Bracket | Women with Births | Births / 1,000 Women |
| 15 to 19 years | 0 (0.0%) | 0.0 |
| 20 to 34 years | 8 (100.0%) | 94.0 |
| 35 to 50 years | 0 (0.0%) | 0.0 |
| Total | 8 (100.0%) | 26.0 |
Fertility by Age by Marriage Status in Foxfire
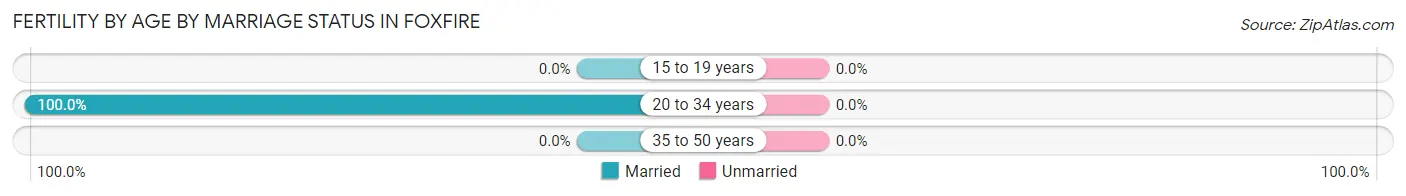
| Age Bracket | Married | Unmarried |
| 15 to 19 years | 0 (0.0%) | 0 (0.0%) |
| 20 to 34 years | 8 (100.0%) | 0 (0.0%) |
| 35 to 50 years | 0 (0.0%) | 0 (0.0%) |
| Total | 8 (100.0%) | 0 (0.0%) |
Fertility by Education in Foxfire
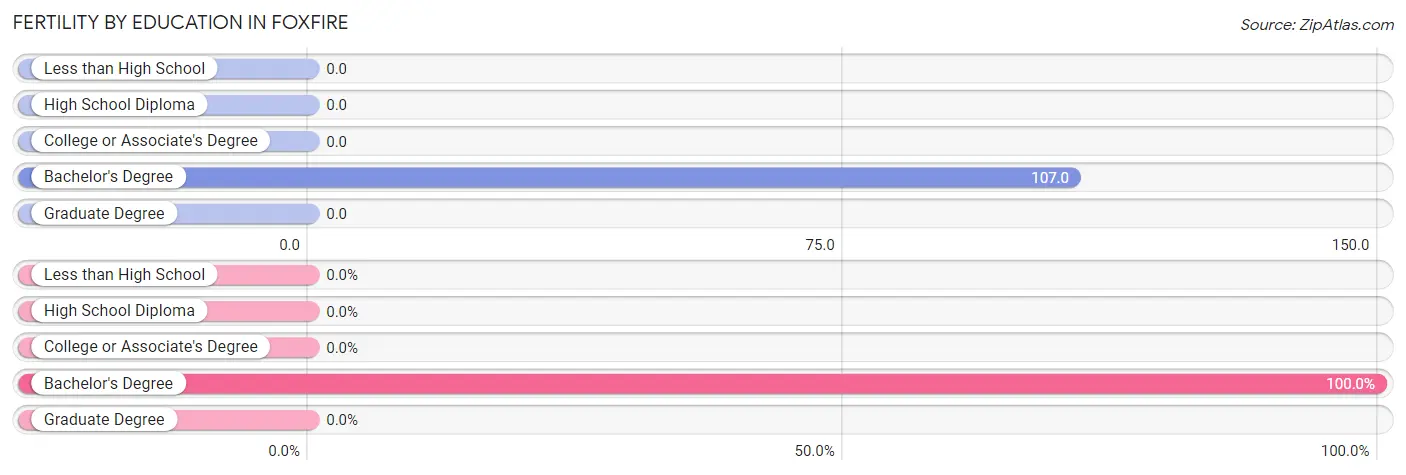
| Educational Attainment | Women with Births | Births / 1,000 Women |
| Less than High School | 0 (0.0%) | 0.0 |
| High School Diploma | 0 (0.0%) | 0.0 |
| College or Associate's Degree | 0 (0.0%) | 0.0 |
| Bachelor's Degree | 8 (100.0%) | 107.0 |
| Graduate Degree | 0 (0.0%) | 0.0 |
| Total | 8 (100.0%) | 26.0 |
Fertility by Education by Marriage Status in Foxfire
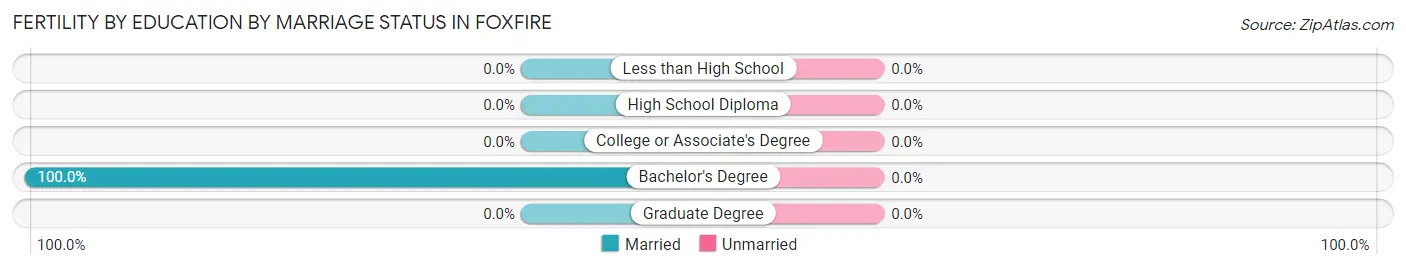
| Educational Attainment | Married | Unmarried |
| Less than High School | 0 (0.0%) | 0 (0.0%) |
| High School Diploma | 0 (0.0%) | 0 (0.0%) |
| College or Associate's Degree | 0 (0.0%) | 0 (0.0%) |
| Bachelor's Degree | 8 (100.0%) | 0 (0.0%) |
| Graduate Degree | 0 (0.0%) | 0 (0.0%) |
| Total | 8 (100.0%) | 0 (0.0%) |
Employment Characteristics in Foxfire
Employment by Class of Employer in Foxfire
Among the 564 employed individuals in Foxfire, private company employees (391 | 69.3%), not-for-profit organizations (53 | 9.4%), and local government employees (37 | 6.6%) make up the most common classes of employment.
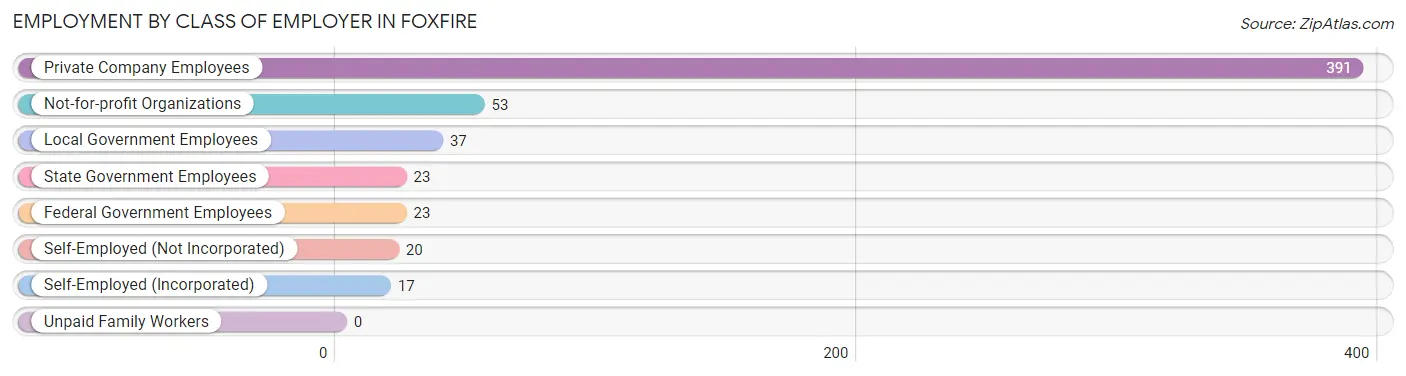
| Employer Class | # Employees | % Employees |
| Private Company Employees | 391 | 69.3% |
| Self-Employed (Incorporated) | 17 | 3.0% |
| Self-Employed (Not Incorporated) | 20 | 3.5% |
| Not-for-profit Organizations | 53 | 9.4% |
| Local Government Employees | 37 | 6.6% |
| State Government Employees | 23 | 4.1% |
| Federal Government Employees | 23 | 4.1% |
| Unpaid Family Workers | 0 | 0.0% |
| Total | 564 | 100.0% |
Employment Status by Age in Foxfire
According to the labor force statistics for Foxfire, out of the total population over 16 years of age (1,218), 48.5% or 591 individuals are in the labor force, with 1.2% or 7 of them unemployed. The age group with the highest labor force participation rate is 30 to 34 years, with 86.7% or 52 individuals in the labor force. Within the labor force, the 25 to 29 years age range has the highest percentage of unemployed individuals, with 8.3% or 3 of them being unemployed.
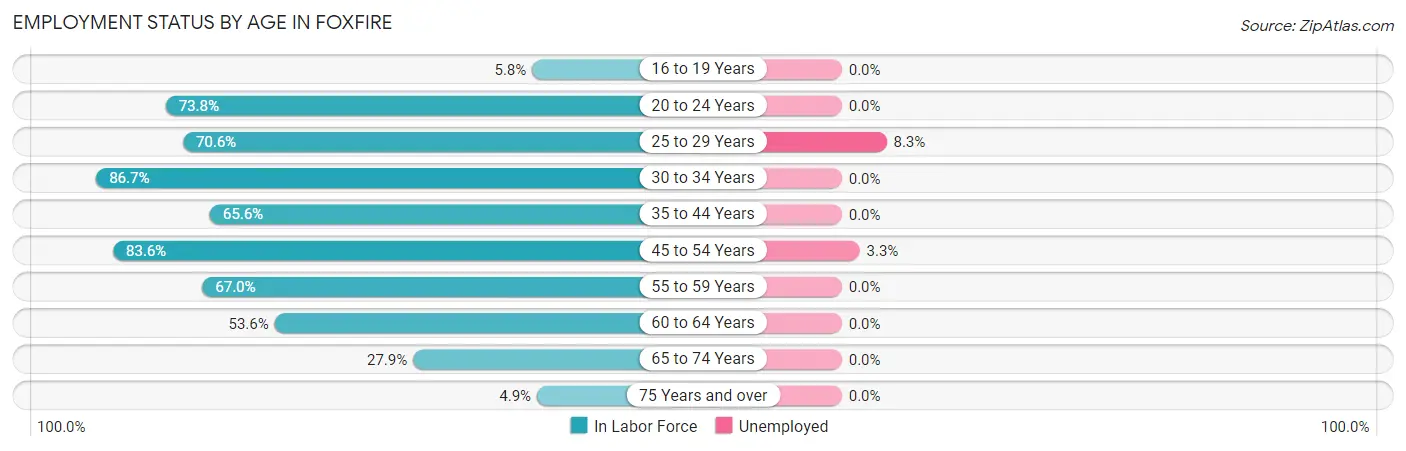
| Age Bracket | In Labor Force | Unemployed |
| 16 to 19 Years | 7 (5.8%) | 0 (0.0%) |
| 20 to 24 Years | 31 (73.8%) | 0 (0.0%) |
| 25 to 29 Years | 36 (70.6%) | 3 (8.3%) |
| 30 to 34 Years | 52 (86.7%) | 0 (0.0%) |
| 35 to 44 Years | 158 (65.6%) | 0 (0.0%) |
| 45 to 54 Years | 122 (83.6%) | 4 (3.3%) |
| 55 to 59 Years | 65 (67.0%) | 0 (0.0%) |
| 60 to 64 Years | 52 (53.6%) | 0 (0.0%) |
| 65 to 74 Years | 61 (27.9%) | 0 (0.0%) |
| 75 Years and over | 7 (4.9%) | 0 (0.0%) |
| Total | 591 (48.5%) | 7 (1.2%) |
Employment Status by Educational Attainment in Foxfire
According to labor force statistics for Foxfire, 70.1% of individuals (485) out of the total population between 25 and 64 years of age (692) are in the labor force, with 1.5% or 7 of them being unemployed. The group with the highest labor force participation rate are those with the educational attainment of bachelor's degree or higher, with 81.6% or 204 individuals in the labor force. Within the labor force, individuals with bachelor's degree or higher education have the highest percentage of unemployment, with 2.0% or 4 of them being unemployed.
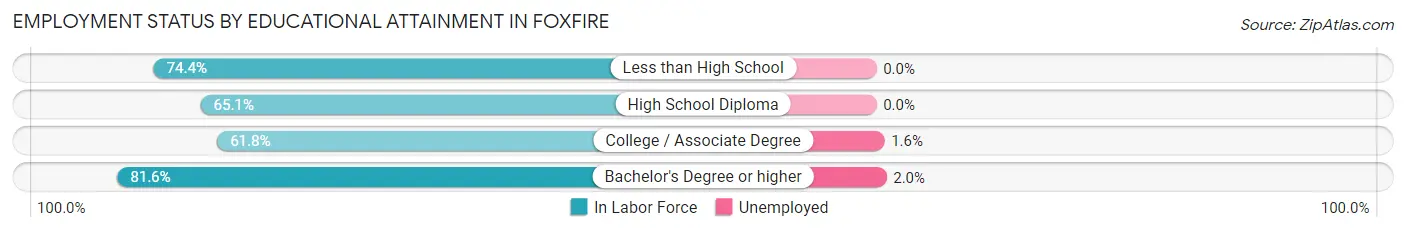
| Educational Attainment | In Labor Force | Unemployed |
| Less than High School | 29 (74.4%) | 0 (0.0%) |
| High School Diploma | 56 (65.1%) | 0 (0.0%) |
| College / Associate Degree | 196 (61.8%) | 5 (1.6%) |
| Bachelor's Degree or higher | 204 (81.6%) | 5 (2.0%) |
| Total | 485 (70.1%) | 10 (1.5%) |
Employment Occupations by Sex in Foxfire
Management, Business, Science and Arts Occupations
The most common Management, Business, Science and Arts occupations in Foxfire are Management (142 | 24.5%), Health Diagnosing & Treating (71 | 12.3%), Health Technologists (51 | 8.8%), Community & Social Service (48 | 8.3%), and Computers, Engineering & Science (37 | 6.4%).
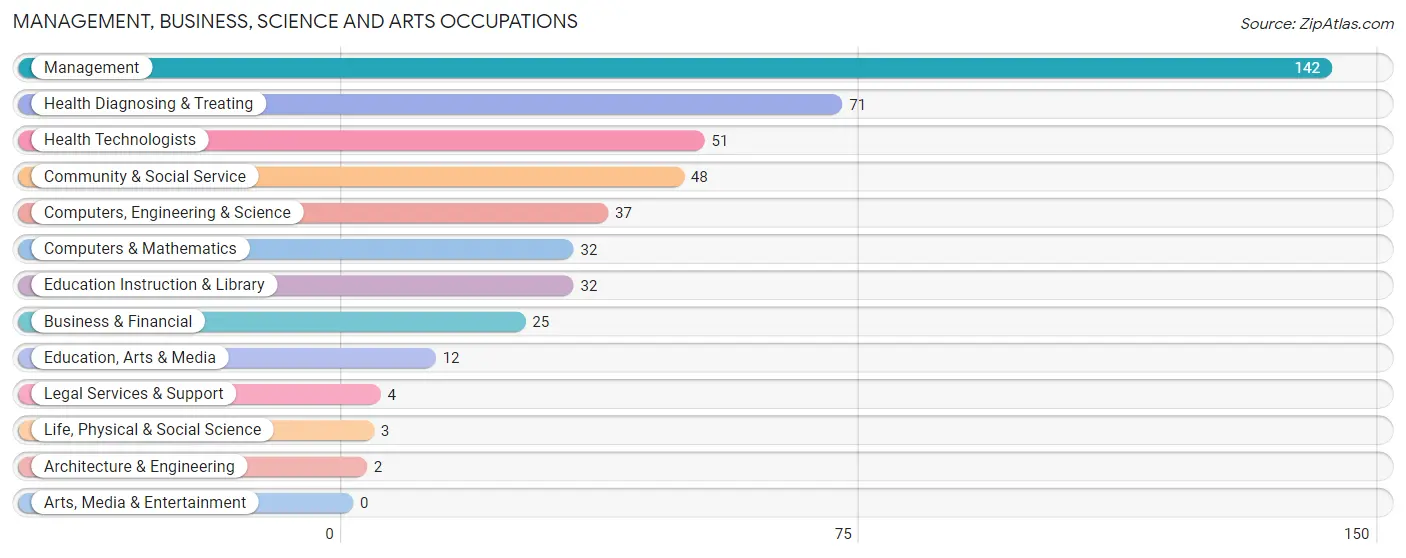
Management, Business, Science and Arts Occupations by Sex
Within the Management, Business, Science and Arts occupations in Foxfire, the most male-oriented occupations are Architecture & Engineering (100.0%), Life, Physical & Social Science (100.0%), and Education, Arts & Media (100.0%), while the most female-oriented occupations are Legal Services & Support (100.0%), Education Instruction & Library (87.5%), and Health Diagnosing & Treating (73.2%).
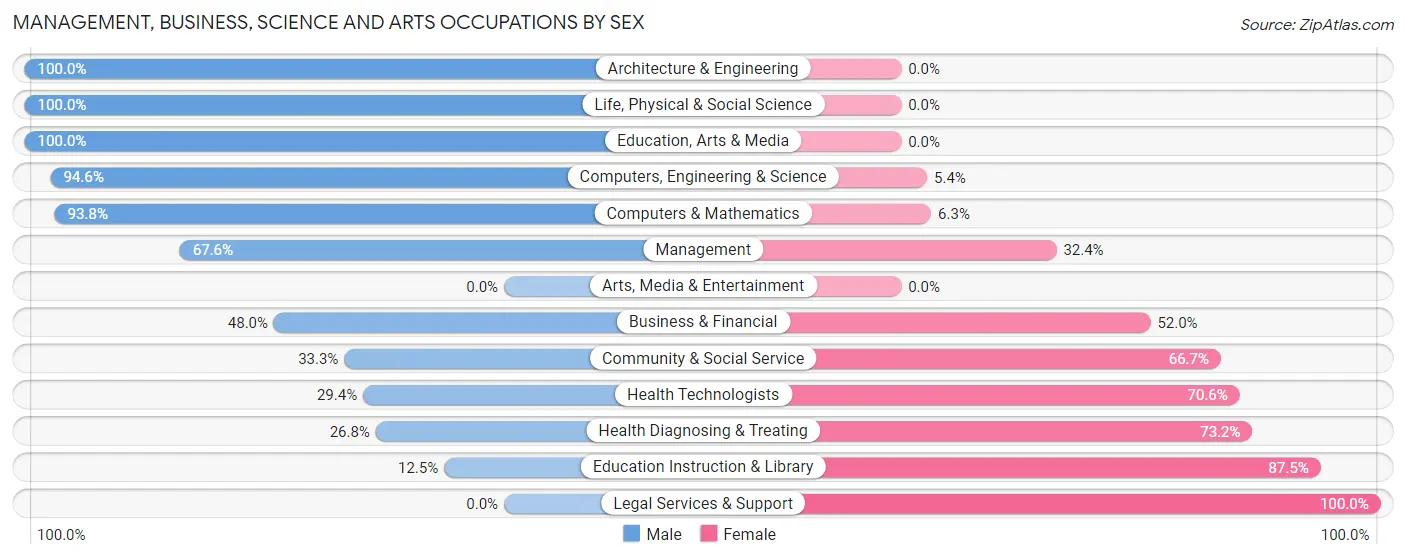
| Occupation | Male | Female |
| Management | 96 (67.6%) | 46 (32.4%) |
| Business & Financial | 12 (48.0%) | 13 (52.0%) |
| Computers, Engineering & Science | 35 (94.6%) | 2 (5.4%) |
| Computers & Mathematics | 30 (93.8%) | 2 (6.2%) |
| Architecture & Engineering | 2 (100.0%) | 0 (0.0%) |
| Life, Physical & Social Science | 3 (100.0%) | 0 (0.0%) |
| Community & Social Service | 16 (33.3%) | 32 (66.7%) |
| Education, Arts & Media | 12 (100.0%) | 0 (0.0%) |
| Legal Services & Support | 0 (0.0%) | 4 (100.0%) |
| Education Instruction & Library | 4 (12.5%) | 28 (87.5%) |
| Arts, Media & Entertainment | 0 (0.0%) | 0 (0.0%) |
| Health Diagnosing & Treating | 19 (26.8%) | 52 (73.2%) |
| Health Technologists | 15 (29.4%) | 36 (70.6%) |
| Total (Category) | 178 (55.1%) | 145 (44.9%) |
| Total (Overall) | 317 (54.7%) | 262 (45.3%) |
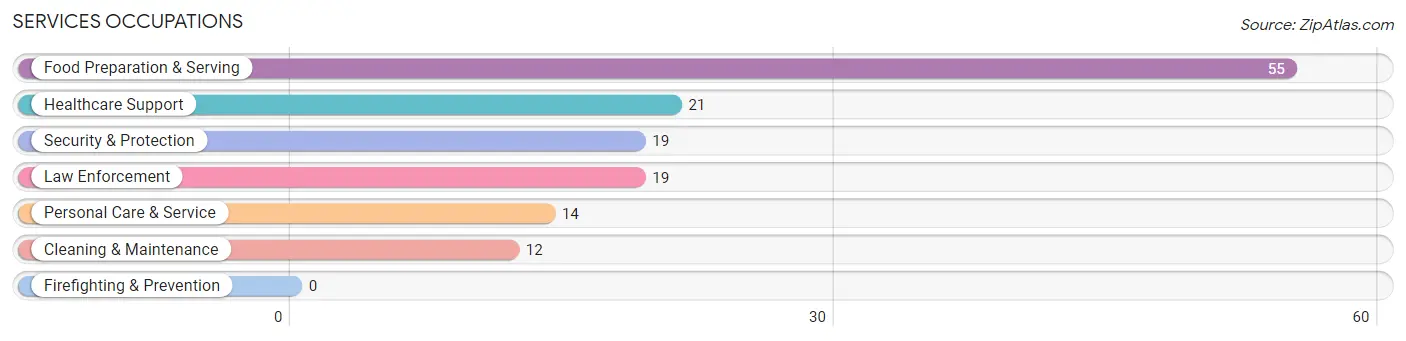
Services Occupations
The most common Services occupations in Foxfire are Food Preparation & Serving (55 | 9.5%), Healthcare Support (21 | 3.6%), Security & Protection (19 | 3.3%), Law Enforcement (19 | 3.3%), and Personal Care & Service (14 | 2.4%).
Services Occupations by Sex
Within the Services occupations in Foxfire, the most male-oriented occupations are Cleaning & Maintenance (100.0%), Personal Care & Service (100.0%), and Food Preparation & Serving (30.9%), while the most female-oriented occupations are Healthcare Support (80.9%), Security & Protection (78.9%), and Law Enforcement (78.9%).
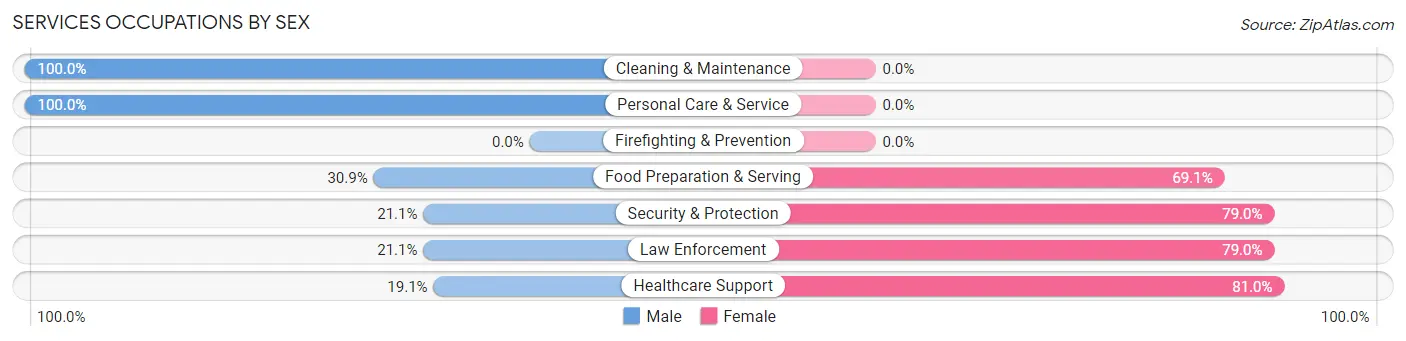
| Occupation | Male | Female |
| Healthcare Support | 4 (19.1%) | 17 (80.9%) |
| Security & Protection | 4 (21.0%) | 15 (78.9%) |
| Firefighting & Prevention | 0 (0.0%) | 0 (0.0%) |
| Law Enforcement | 4 (21.0%) | 15 (78.9%) |
| Food Preparation & Serving | 17 (30.9%) | 38 (69.1%) |
| Cleaning & Maintenance | 12 (100.0%) | 0 (0.0%) |
| Personal Care & Service | 14 (100.0%) | 0 (0.0%) |
| Total (Category) | 51 (42.1%) | 70 (57.9%) |
| Total (Overall) | 317 (54.7%) | 262 (45.3%) |
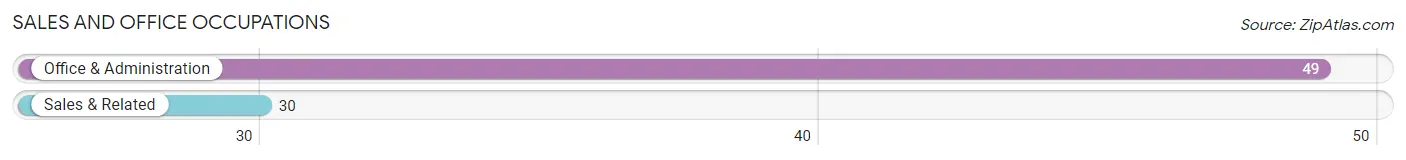
Sales and Office Occupations
The most common Sales and Office occupations in Foxfire are Office & Administration (49 | 8.5%), and Sales & Related (30 | 5.2%).
Sales and Office Occupations by Sex
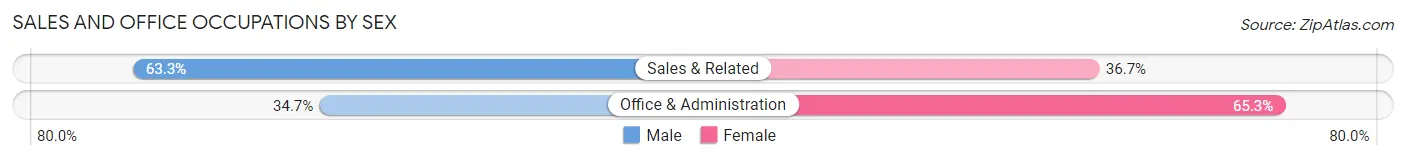
| Occupation | Male | Female |
| Sales & Related | 19 (63.3%) | 11 (36.7%) |
| Office & Administration | 17 (34.7%) | 32 (65.3%) |
| Total (Category) | 36 (45.6%) | 43 (54.4%) |
| Total (Overall) | 317 (54.7%) | 262 (45.3%) |
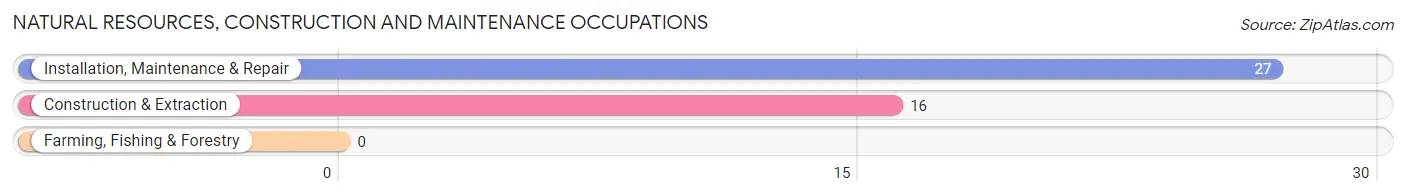
Natural Resources, Construction and Maintenance Occupations
The most common Natural Resources, Construction and Maintenance occupations in Foxfire are Installation, Maintenance & Repair (27 | 4.7%), and Construction & Extraction (16 | 2.8%).
Natural Resources, Construction and Maintenance Occupations by Sex
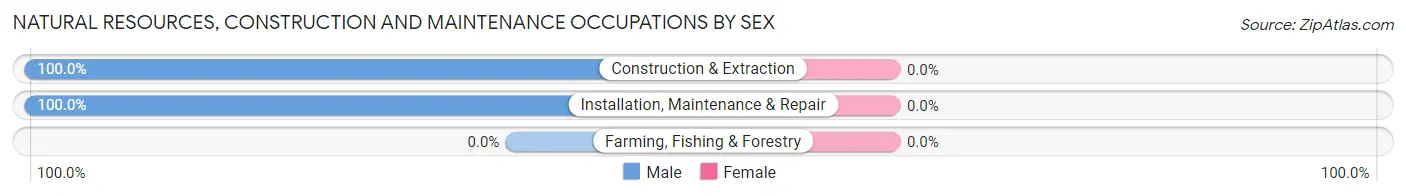
| Occupation | Male | Female |
| Farming, Fishing & Forestry | 0 (0.0%) | 0 (0.0%) |
| Construction & Extraction | 16 (100.0%) | 0 (0.0%) |
| Installation, Maintenance & Repair | 27 (100.0%) | 0 (0.0%) |
| Total (Category) | 43 (100.0%) | 0 (0.0%) |
| Total (Overall) | 317 (54.7%) | 262 (45.3%) |
Production, Transportation and Moving Occupations
The most common Production, Transportation and Moving occupations in Foxfire are Material Moving (6 | 1.0%), Production (4 | 0.7%), and Transportation (3 | 0.5%).
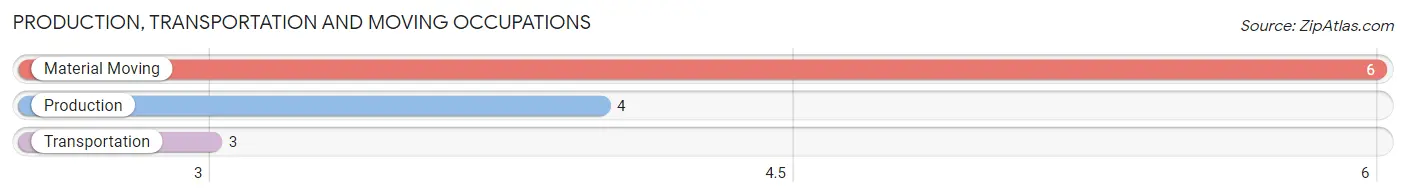
Production, Transportation and Moving Occupations by Sex
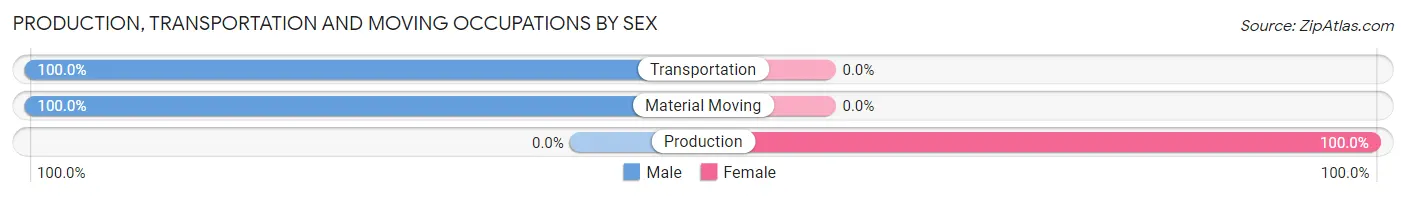
| Occupation | Male | Female |
| Production | 0 (0.0%) | 4 (100.0%) |
| Transportation | 3 (100.0%) | 0 (0.0%) |
| Material Moving | 6 (100.0%) | 0 (0.0%) |
| Total (Category) | 9 (69.2%) | 4 (30.8%) |
| Total (Overall) | 317 (54.7%) | 262 (45.3%) |
Employment Industries by Sex in Foxfire
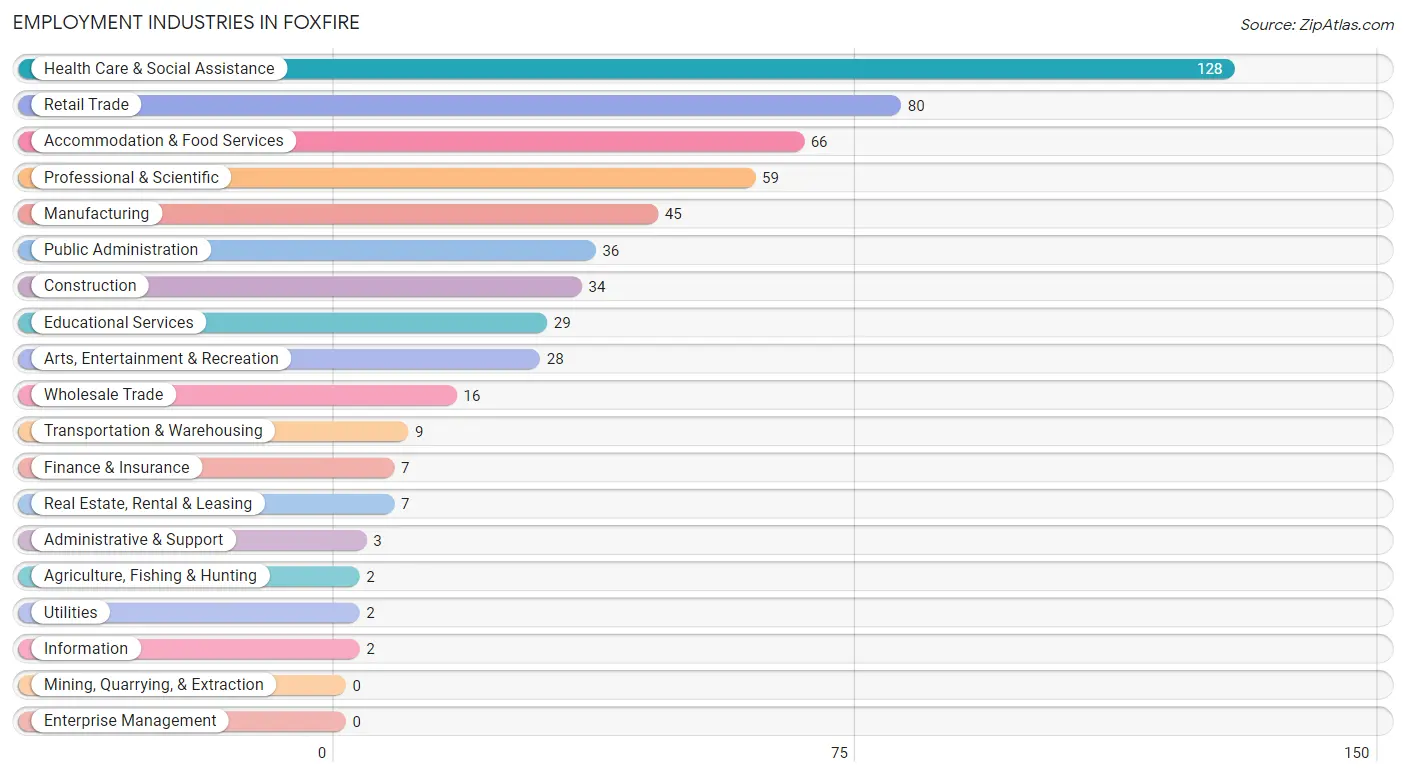
Employment Industries in Foxfire
The major employment industries in Foxfire include Health Care & Social Assistance (128 | 22.1%), Retail Trade (80 | 13.8%), Accommodation & Food Services (66 | 11.4%), Professional & Scientific (59 | 10.2%), and Manufacturing (45 | 7.8%).
Employment Industries by Sex in Foxfire
The Foxfire industries that see more men than women are Agriculture, Fishing & Hunting (100.0%), Transportation & Warehousing (100.0%), and Utilities (100.0%), whereas the industries that tend to have a higher number of women are Information (100.0%), Real Estate, Rental & Leasing (100.0%), and Educational Services (86.2%).
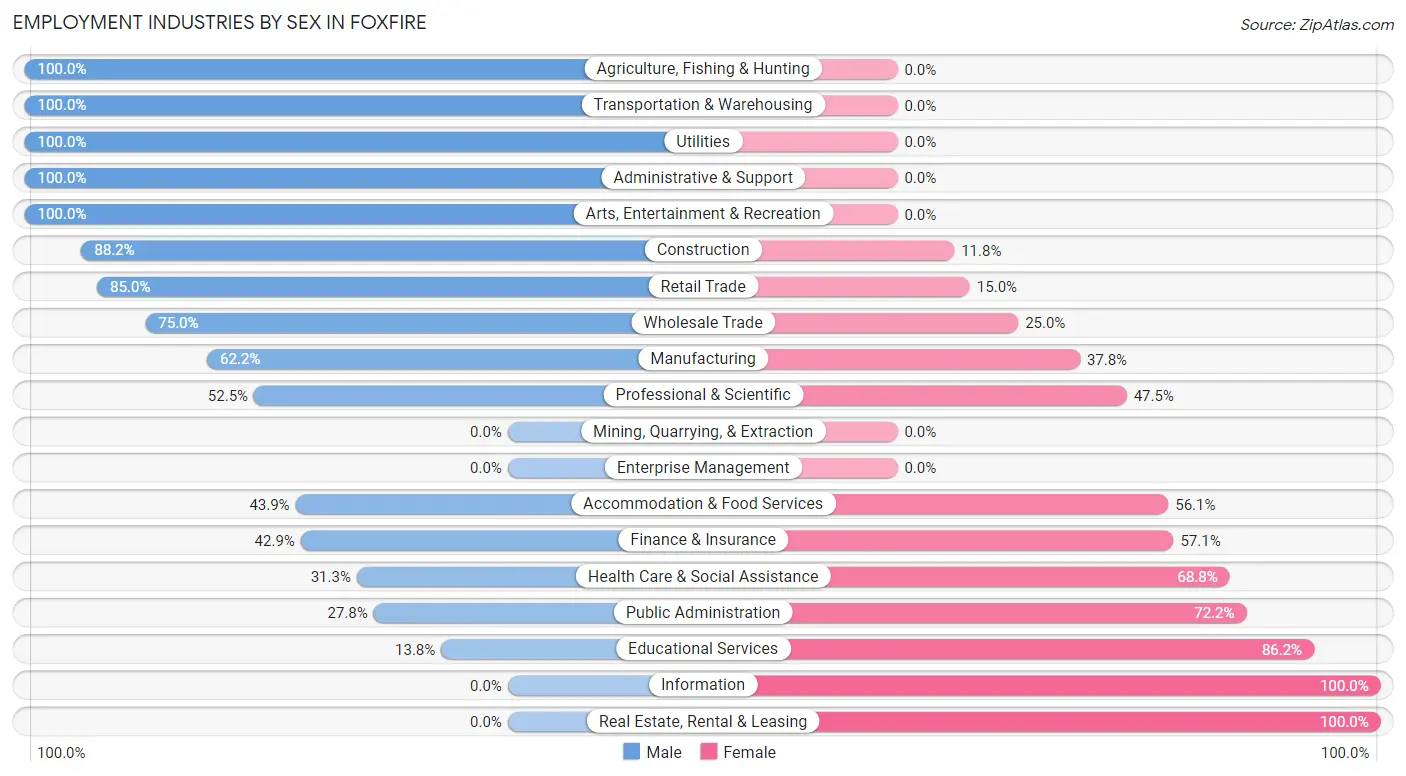
| Industry | Male | Female |
| Agriculture, Fishing & Hunting | 2 (100.0%) | 0 (0.0%) |
| Mining, Quarrying, & Extraction | 0 (0.0%) | 0 (0.0%) |
| Construction | 30 (88.2%) | 4 (11.8%) |
| Manufacturing | 28 (62.2%) | 17 (37.8%) |
| Wholesale Trade | 12 (75.0%) | 4 (25.0%) |
| Retail Trade | 68 (85.0%) | 12 (15.0%) |
| Transportation & Warehousing | 9 (100.0%) | 0 (0.0%) |
| Utilities | 2 (100.0%) | 0 (0.0%) |
| Information | 0 (0.0%) | 2 (100.0%) |
| Finance & Insurance | 3 (42.9%) | 4 (57.1%) |
| Real Estate, Rental & Leasing | 0 (0.0%) | 7 (100.0%) |
| Professional & Scientific | 31 (52.5%) | 28 (47.5%) |
| Enterprise Management | 0 (0.0%) | 0 (0.0%) |
| Administrative & Support | 3 (100.0%) | 0 (0.0%) |
| Educational Services | 4 (13.8%) | 25 (86.2%) |
| Health Care & Social Assistance | 40 (31.2%) | 88 (68.8%) |
| Arts, Entertainment & Recreation | 28 (100.0%) | 0 (0.0%) |
| Accommodation & Food Services | 29 (43.9%) | 37 (56.1%) |
| Public Administration | 10 (27.8%) | 26 (72.2%) |
| Total | 317 (54.7%) | 262 (45.3%) |
Education in Foxfire
School Enrollment in Foxfire
The most common levels of schooling among the 453 students in Foxfire are middle school (174 | 38.4%), high school (115 | 25.4%), and college / undergraduate (70 | 15.4%).
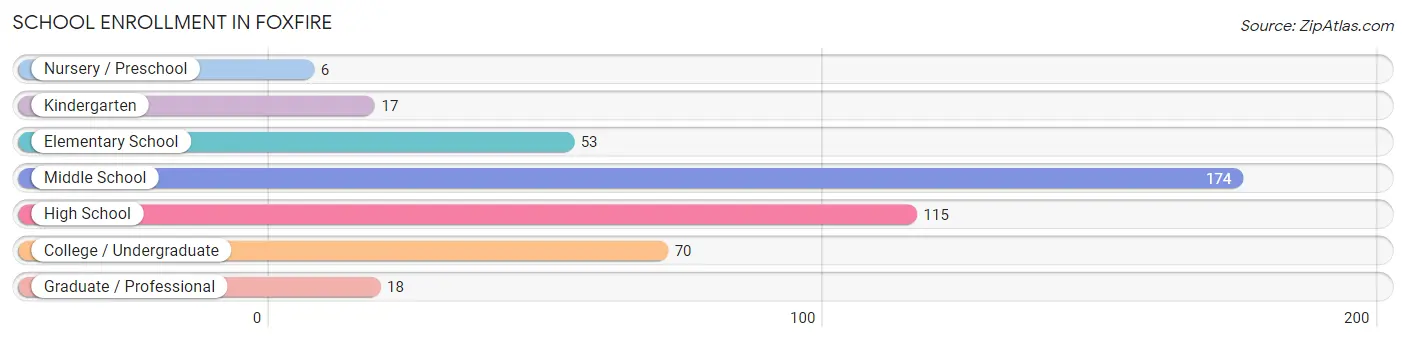
| School Level | # Students | % Students |
| Nursery / Preschool | 6 | 1.3% |
| Kindergarten | 17 | 3.7% |
| Elementary School | 53 | 11.7% |
| Middle School | 174 | 38.4% |
| High School | 115 | 25.4% |
| College / Undergraduate | 70 | 15.4% |
| Graduate / Professional | 18 | 4.0% |
| Total | 453 | 100.0% |
School Enrollment by Age by Funding Source in Foxfire
Out of a total of 453 students who are enrolled in schools in Foxfire, 46 (10.2%) attend a private institution, while the remaining 407 (89.8%) are enrolled in public schools. The age group of 3 to 4 year olds has the highest likelihood of being enrolled in private schools, with 4 (66.7% in the age bracket) enrolled. Conversely, the age group of 20 to 24 year olds has the lowest likelihood of being enrolled in a private school, with 15 (100.0% in the age bracket) attending a public institution.
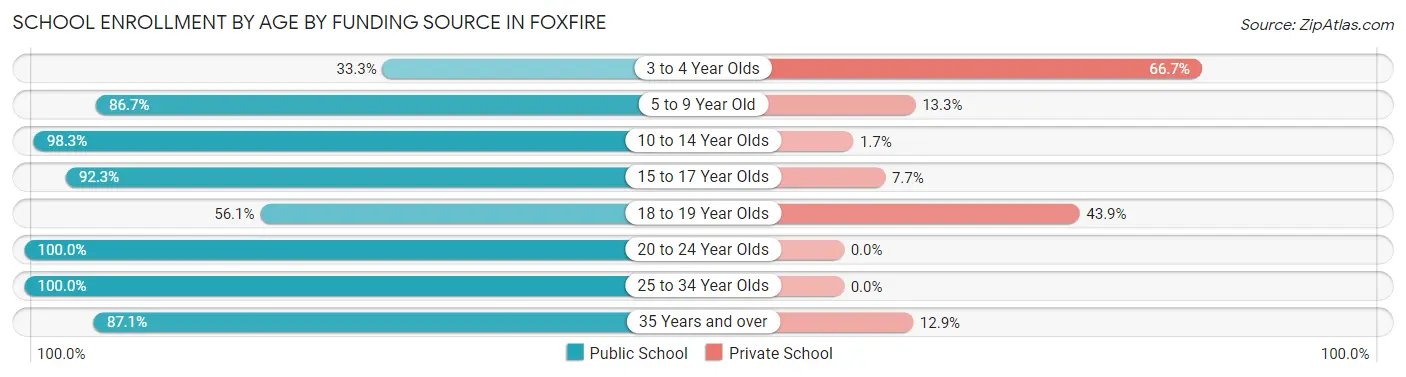
| Age Bracket | Public School | Private School |
| 3 to 4 Year Olds | 2 (33.3%) | 4 (66.7%) |
| 5 to 9 Year Old | 65 (86.7%) | 10 (13.3%) |
| 10 to 14 Year Olds | 170 (98.3%) | 3 (1.7%) |
| 15 to 17 Year Olds | 84 (92.3%) | 7 (7.7%) |
| 18 to 19 Year Olds | 23 (56.1%) | 18 (43.9%) |
| 20 to 24 Year Olds | 15 (100.0%) | 0 (0.0%) |
| 25 to 34 Year Olds | 21 (100.0%) | 0 (0.0%) |
| 35 Years and over | 27 (87.1%) | 4 (12.9%) |
| Total | 407 (89.8%) | 46 (10.2%) |
Educational Attainment by Field of Study in Foxfire
Education (65 | 16.0%), science & technology (61 | 15.0%), business (50 | 12.3%), physical & health sciences (42 | 10.3%), and engineering (34 | 8.4%) are the most common fields of study among 407 individuals in Foxfire who have obtained a bachelor's degree or higher.
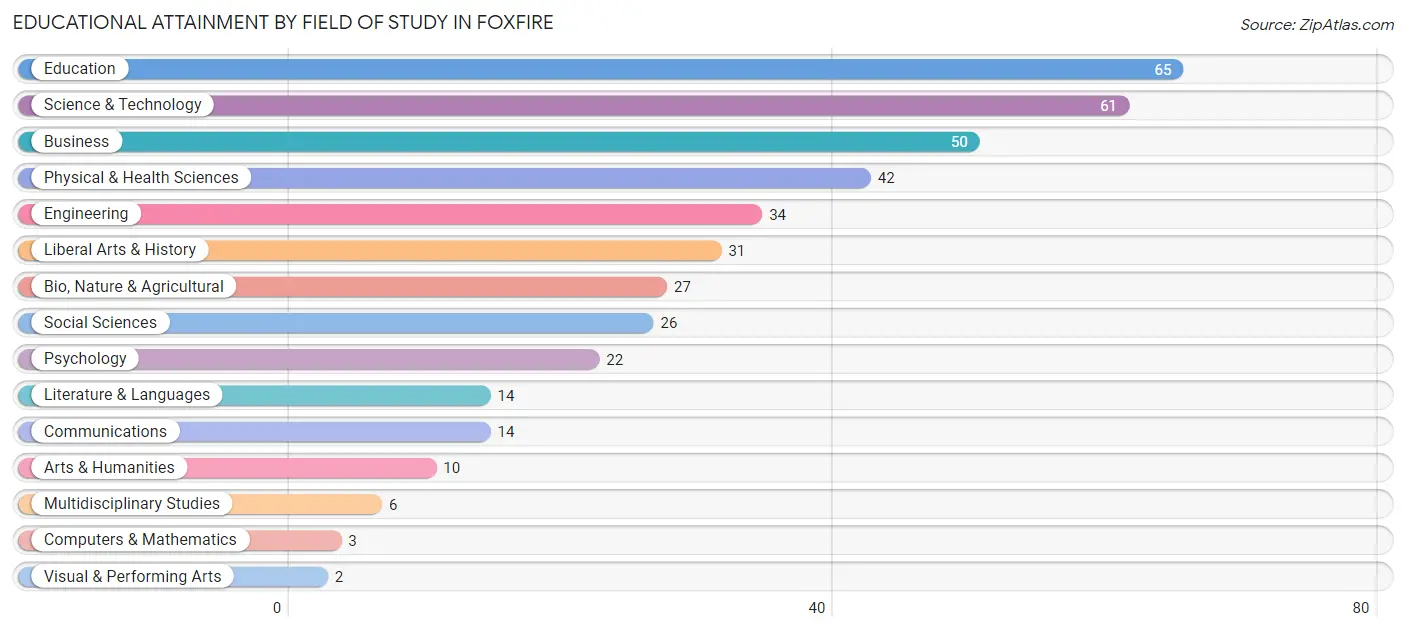
| Field of Study | # Graduates | % Graduates |
| Computers & Mathematics | 3 | 0.7% |
| Bio, Nature & Agricultural | 27 | 6.6% |
| Physical & Health Sciences | 42 | 10.3% |
| Psychology | 22 | 5.4% |
| Social Sciences | 26 | 6.4% |
| Engineering | 34 | 8.4% |
| Multidisciplinary Studies | 6 | 1.5% |
| Science & Technology | 61 | 15.0% |
| Business | 50 | 12.3% |
| Education | 65 | 16.0% |
| Literature & Languages | 14 | 3.4% |
| Liberal Arts & History | 31 | 7.6% |
| Visual & Performing Arts | 2 | 0.5% |
| Communications | 14 | 3.4% |
| Arts & Humanities | 10 | 2.5% |
| Total | 407 | 100.0% |
Transportation & Commute in Foxfire
Vehicle Availability by Sex in Foxfire
The most prevalent vehicle ownership categories in Foxfire are males with 2 vehicles (132, accounting for 43.7%) and females with 2 vehicles (81, making up 50.4%).
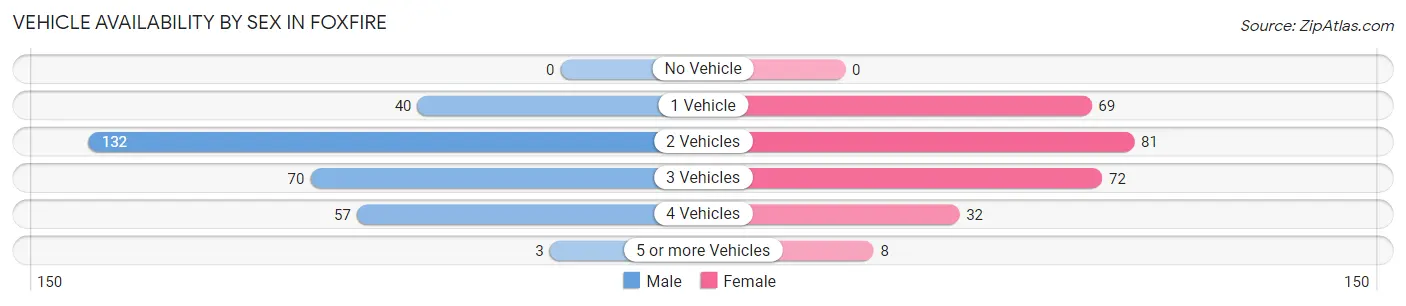
| Vehicles Available | Male | Female |
| No Vehicle | 0 (0.0%) | 0 (0.0%) |
| 1 Vehicle | 40 (13.3%) | 69 (26.3%) |
| 2 Vehicles | 132 (43.7%) | 81 (30.9%) |
| 3 Vehicles | 70 (23.2%) | 72 (27.5%) |
| 4 Vehicles | 57 (18.9%) | 32 (12.2%) |
| 5 or more Vehicles | 3 (1.0%) | 8 (3.0%) |
| Total | 302 (100.0%) | 262 (100.0%) |
Commute Time in Foxfire
The most frequently occuring commute durations in Foxfire are 20 to 24 minutes (120 commuters, 23.8%), 15 to 19 minutes (109 commuters, 21.6%), and 10 to 14 minutes (95 commuters, 18.8%).
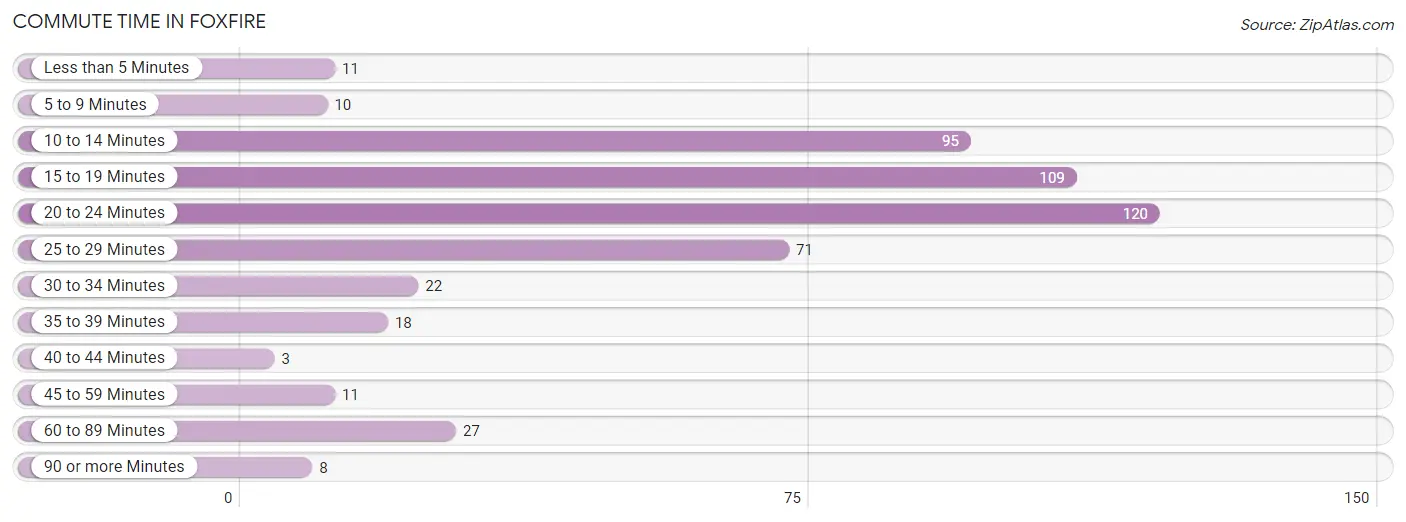
| Commute Time | # Commuters | % Commuters |
| Less than 5 Minutes | 11 | 2.2% |
| 5 to 9 Minutes | 10 | 2.0% |
| 10 to 14 Minutes | 95 | 18.8% |
| 15 to 19 Minutes | 109 | 21.6% |
| 20 to 24 Minutes | 120 | 23.8% |
| 25 to 29 Minutes | 71 | 14.1% |
| 30 to 34 Minutes | 22 | 4.4% |
| 35 to 39 Minutes | 18 | 3.6% |
| 40 to 44 Minutes | 3 | 0.6% |
| 45 to 59 Minutes | 11 | 2.2% |
| 60 to 89 Minutes | 27 | 5.3% |
| 90 or more Minutes | 8 | 1.6% |
Commute Time by Sex in Foxfire
The most common commute times in Foxfire are 25 to 29 minutes (69 commuters, 25.1%) for males and 20 to 24 minutes (73 commuters, 31.7%) for females.
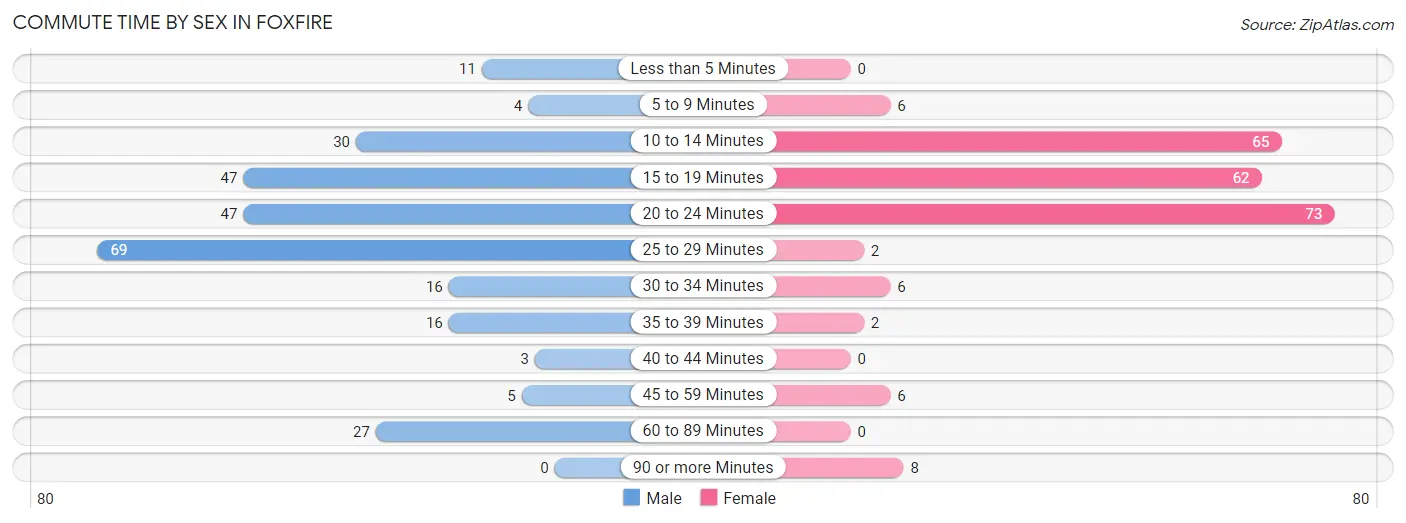
| Commute Time | Male | Female |
| Less than 5 Minutes | 11 (4.0%) | 0 (0.0%) |
| 5 to 9 Minutes | 4 (1.5%) | 6 (2.6%) |
| 10 to 14 Minutes | 30 (10.9%) | 65 (28.3%) |
| 15 to 19 Minutes | 47 (17.1%) | 62 (27.0%) |
| 20 to 24 Minutes | 47 (17.1%) | 73 (31.7%) |
| 25 to 29 Minutes | 69 (25.1%) | 2 (0.9%) |
| 30 to 34 Minutes | 16 (5.8%) | 6 (2.6%) |
| 35 to 39 Minutes | 16 (5.8%) | 2 (0.9%) |
| 40 to 44 Minutes | 3 (1.1%) | 0 (0.0%) |
| 45 to 59 Minutes | 5 (1.8%) | 6 (2.6%) |
| 60 to 89 Minutes | 27 (9.8%) | 0 (0.0%) |
| 90 or more Minutes | 0 (0.0%) | 8 (3.5%) |
Time of Departure to Work by Sex in Foxfire
The most frequent times of departure to work in Foxfire are 8:00 AM to 8:29 AM (63, 22.9%) for males and 7:30 AM to 7:59 AM (70, 30.4%) for females.
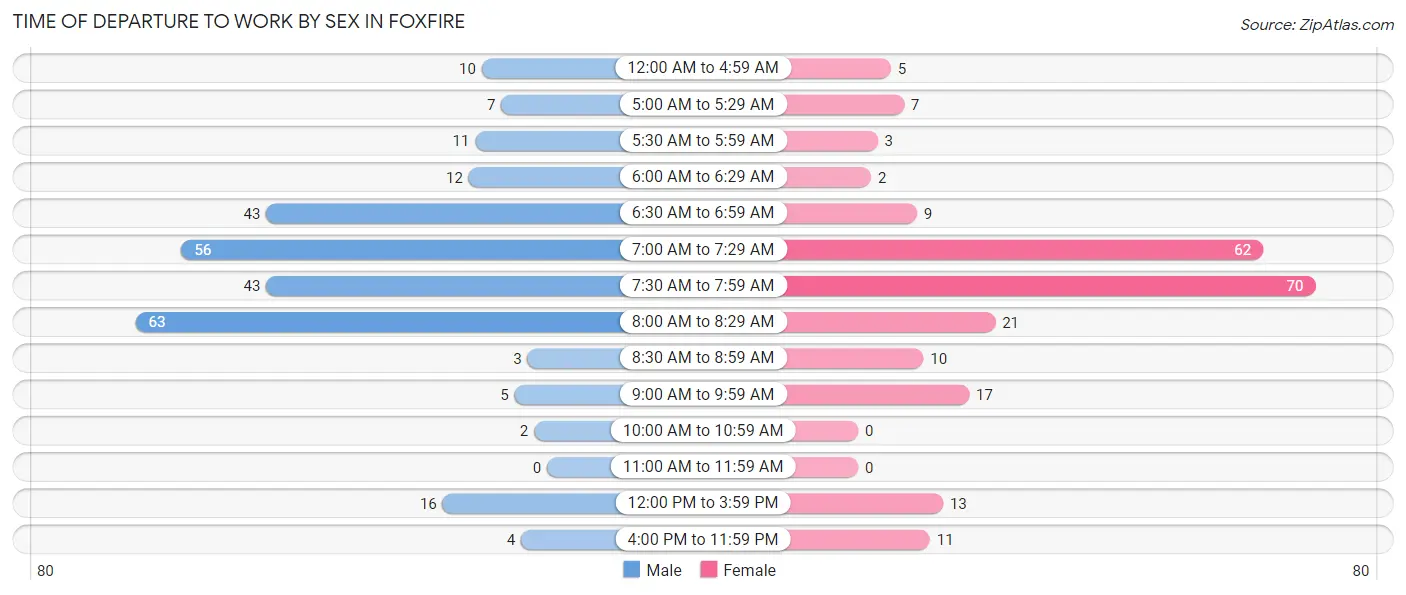
| Time of Departure | Male | Female |
| 12:00 AM to 4:59 AM | 10 (3.6%) | 5 (2.2%) |
| 5:00 AM to 5:29 AM | 7 (2.5%) | 7 (3.0%) |
| 5:30 AM to 5:59 AM | 11 (4.0%) | 3 (1.3%) |
| 6:00 AM to 6:29 AM | 12 (4.4%) | 2 (0.9%) |
| 6:30 AM to 6:59 AM | 43 (15.6%) | 9 (3.9%) |
| 7:00 AM to 7:29 AM | 56 (20.4%) | 62 (27.0%) |
| 7:30 AM to 7:59 AM | 43 (15.6%) | 70 (30.4%) |
| 8:00 AM to 8:29 AM | 63 (22.9%) | 21 (9.1%) |
| 8:30 AM to 8:59 AM | 3 (1.1%) | 10 (4.3%) |
| 9:00 AM to 9:59 AM | 5 (1.8%) | 17 (7.4%) |
| 10:00 AM to 10:59 AM | 2 (0.7%) | 0 (0.0%) |
| 11:00 AM to 11:59 AM | 0 (0.0%) | 0 (0.0%) |
| 12:00 PM to 3:59 PM | 16 (5.8%) | 13 (5.7%) |
| 4:00 PM to 11:59 PM | 4 (1.5%) | 11 (4.8%) |
| Total | 275 (100.0%) | 230 (100.0%) |
Housing Occupancy in Foxfire
Occupancy by Ownership in Foxfire
Of the total 597 dwellings in Foxfire, owner-occupied units account for 469 (78.6%), while renter-occupied units make up 128 (21.4%).
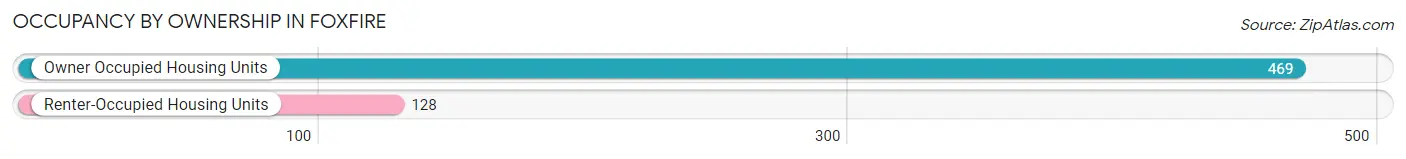
| Occupancy | # Housing Units | % Housing Units |
| Owner Occupied Housing Units | 469 | 78.6% |
| Renter-Occupied Housing Units | 128 | 21.4% |
| Total Occupied Housing Units | 597 | 100.0% |
Occupancy by Household Size in Foxfire
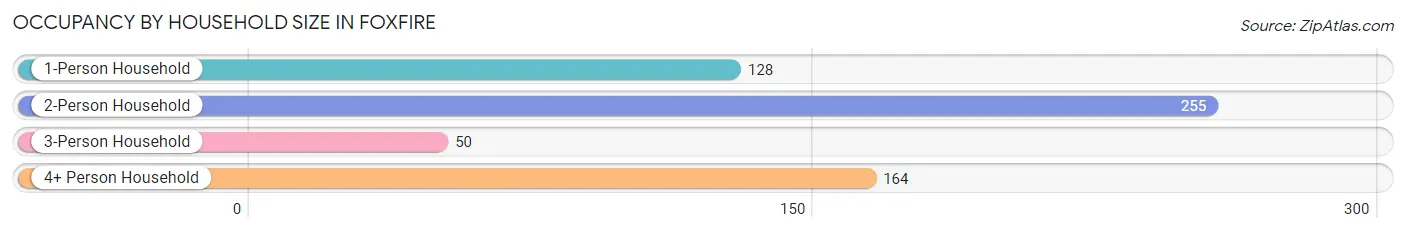
| Household Size | # Housing Units | % Housing Units |
| 1-Person Household | 128 | 21.4% |
| 2-Person Household | 255 | 42.7% |
| 3-Person Household | 50 | 8.4% |
| 4+ Person Household | 164 | 27.5% |
| Total Housing Units | 597 | 100.0% |
Occupancy by Ownership by Household Size in Foxfire
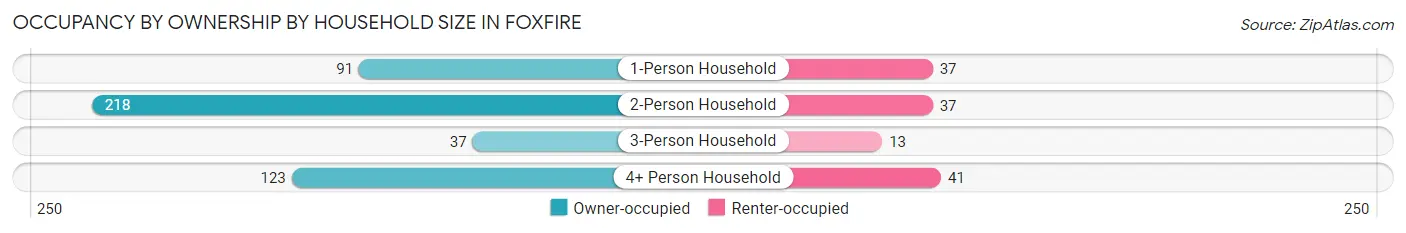
| Household Size | Owner-occupied | Renter-occupied |
| 1-Person Household | 91 (71.1%) | 37 (28.9%) |
| 2-Person Household | 218 (85.5%) | 37 (14.5%) |
| 3-Person Household | 37 (74.0%) | 13 (26.0%) |
| 4+ Person Household | 123 (75.0%) | 41 (25.0%) |
| Total Housing Units | 469 (78.6%) | 128 (21.4%) |
Occupancy by Educational Attainment in Foxfire
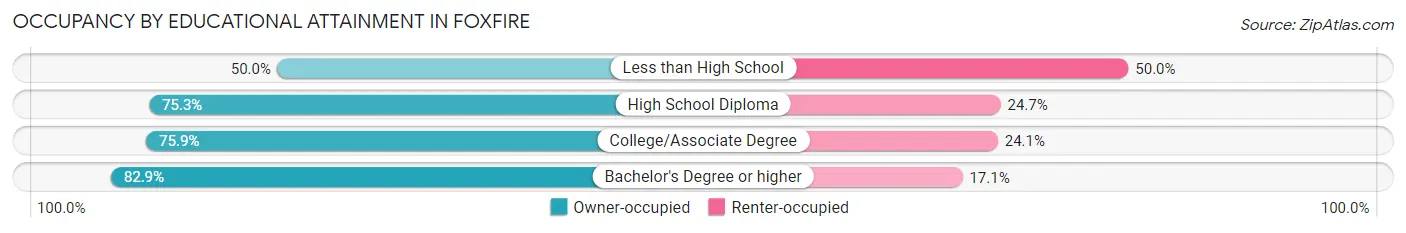
| Household Size | Owner-occupied | Renter-occupied |
| Less than High School | 4 (50.0%) | 4 (50.0%) |
| High School Diploma | 55 (75.3%) | 18 (24.7%) |
| College/Associate Degree | 192 (75.9%) | 61 (24.1%) |
| Bachelor's Degree or higher | 218 (82.9%) | 45 (17.1%) |
Occupancy by Age of Householder in Foxfire
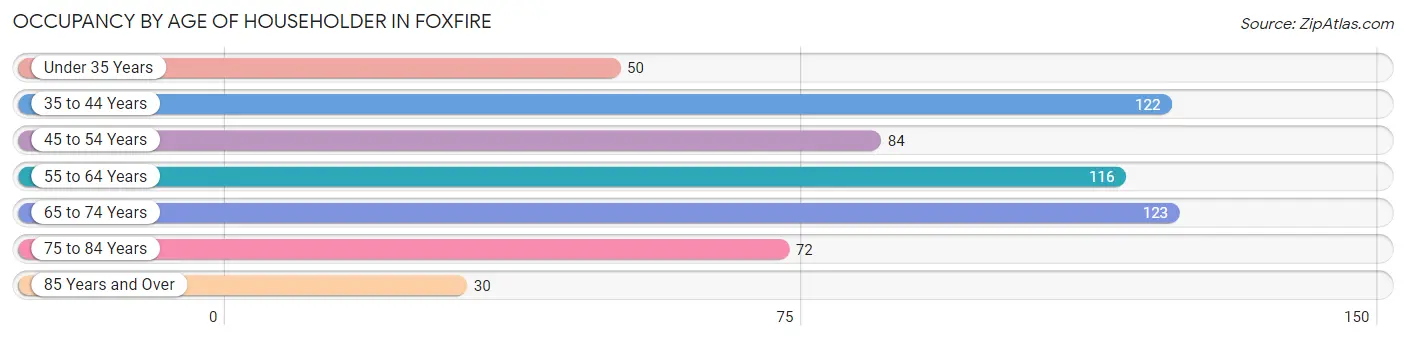
| Age Bracket | # Households | % Households |
| Under 35 Years | 50 | 8.4% |
| 35 to 44 Years | 122 | 20.4% |
| 45 to 54 Years | 84 | 14.1% |
| 55 to 64 Years | 116 | 19.4% |
| 65 to 74 Years | 123 | 20.6% |
| 75 to 84 Years | 72 | 12.1% |
| 85 Years and Over | 30 | 5.0% |
| Total | 597 | 100.0% |
Housing Finances in Foxfire
Median Income by Occupancy in Foxfire
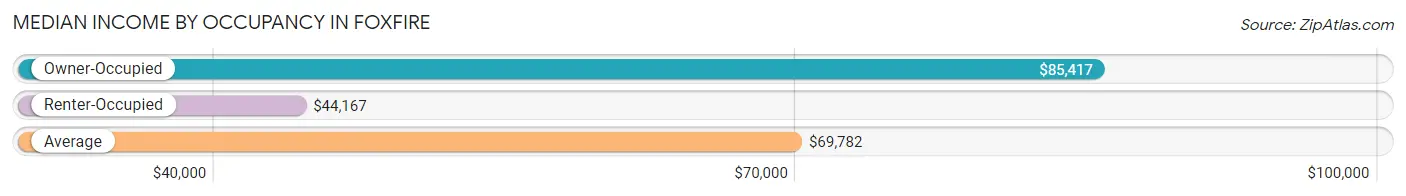
| Occupancy Type | # Households | Median Income |
| Owner-Occupied | 469 (78.6%) | $85,417 |
| Renter-Occupied | 128 (21.4%) | $44,167 |
| Average | 597 (100.0%) | $69,782 |
Occupancy by Householder Income Bracket in Foxfire
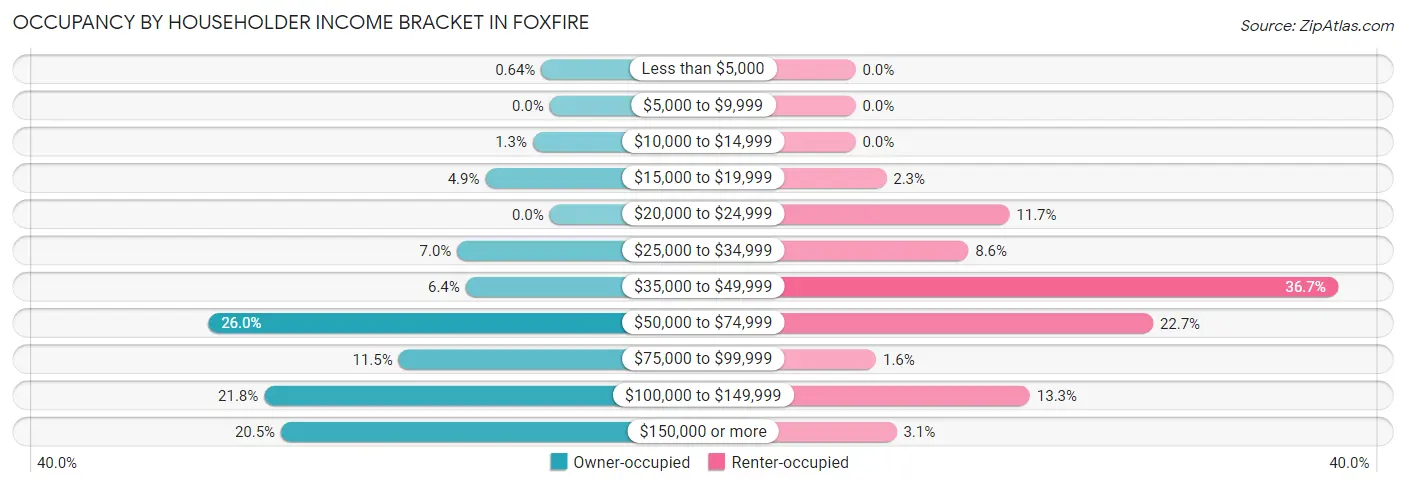
| Income Bracket | Owner-occupied | Renter-occupied |
| Less than $5,000 | 3 (0.6%) | 0 (0.0%) |
| $5,000 to $9,999 | 0 (0.0%) | 0 (0.0%) |
| $10,000 to $14,999 | 6 (1.3%) | 0 (0.0%) |
| $15,000 to $19,999 | 23 (4.9%) | 3 (2.3%) |
| $20,000 to $24,999 | 0 (0.0%) | 15 (11.7%) |
| $25,000 to $34,999 | 33 (7.0%) | 11 (8.6%) |
| $35,000 to $49,999 | 30 (6.4%) | 47 (36.7%) |
| $50,000 to $74,999 | 122 (26.0%) | 29 (22.7%) |
| $75,000 to $99,999 | 54 (11.5%) | 2 (1.6%) |
| $100,000 to $149,999 | 102 (21.7%) | 17 (13.3%) |
| $150,000 or more | 96 (20.5%) | 4 (3.1%) |
| Total | 469 (100.0%) | 128 (100.0%) |
Monthly Housing Cost Tiers in Foxfire
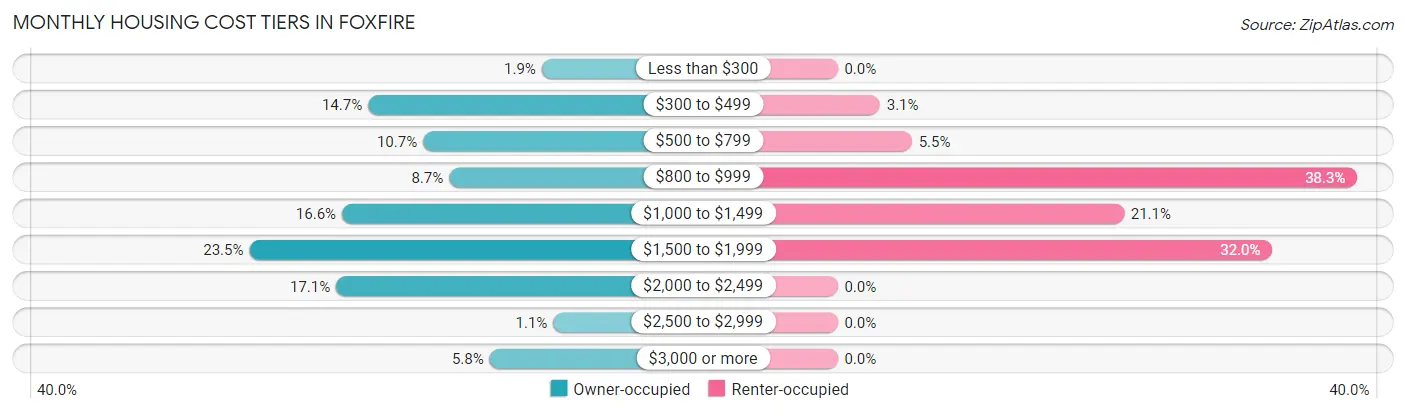
| Monthly Cost | Owner-occupied | Renter-occupied |
| Less than $300 | 9 (1.9%) | 0 (0.0%) |
| $300 to $499 | 69 (14.7%) | 4 (3.1%) |
| $500 to $799 | 50 (10.7%) | 7 (5.5%) |
| $800 to $999 | 41 (8.7%) | 49 (38.3%) |
| $1,000 to $1,499 | 78 (16.6%) | 27 (21.1%) |
| $1,500 to $1,999 | 110 (23.4%) | 41 (32.0%) |
| $2,000 to $2,499 | 80 (17.1%) | 0 (0.0%) |
| $2,500 to $2,999 | 5 (1.1%) | 0 (0.0%) |
| $3,000 or more | 27 (5.8%) | 0 (0.0%) |
| Total | 469 (100.0%) | 128 (100.0%) |
Physical Housing Characteristics in Foxfire
Housing Structures in Foxfire
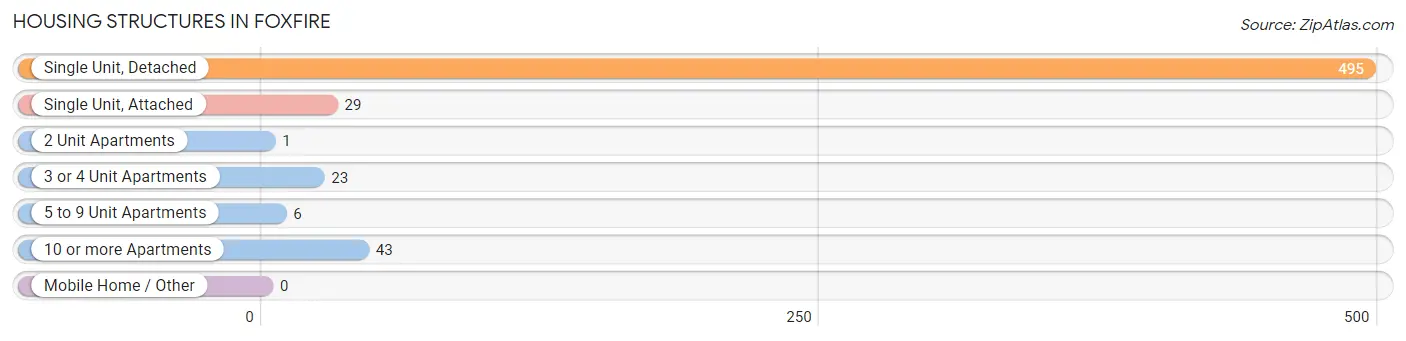
| Structure Type | # Housing Units | % Housing Units |
| Single Unit, Detached | 495 | 82.9% |
| Single Unit, Attached | 29 | 4.9% |
| 2 Unit Apartments | 1 | 0.2% |
| 3 or 4 Unit Apartments | 23 | 3.8% |
| 5 to 9 Unit Apartments | 6 | 1.0% |
| 10 or more Apartments | 43 | 7.2% |
| Mobile Home / Other | 0 | 0.0% |
| Total | 597 | 100.0% |
Housing Structures by Occupancy in Foxfire
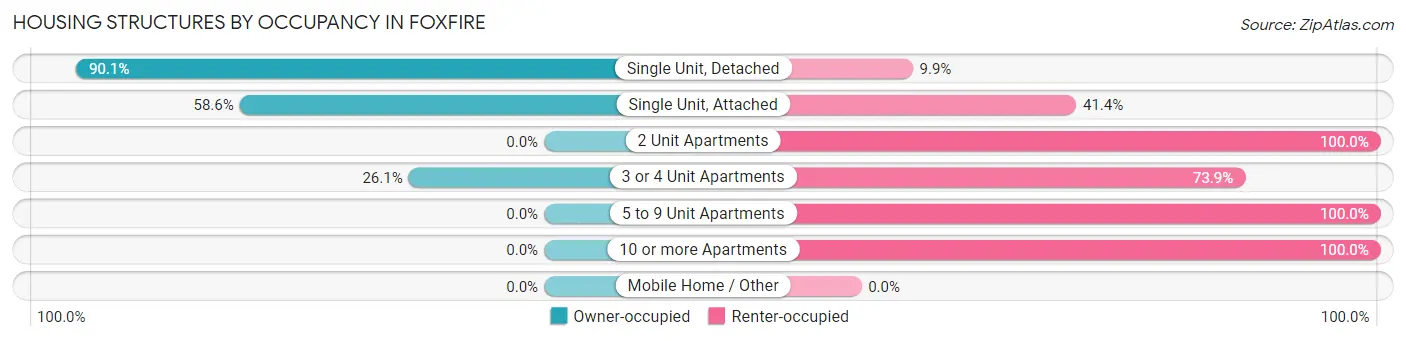
| Structure Type | Owner-occupied | Renter-occupied |
| Single Unit, Detached | 446 (90.1%) | 49 (9.9%) |
| Single Unit, Attached | 17 (58.6%) | 12 (41.4%) |
| 2 Unit Apartments | 0 (0.0%) | 1 (100.0%) |
| 3 or 4 Unit Apartments | 6 (26.1%) | 17 (73.9%) |
| 5 to 9 Unit Apartments | 0 (0.0%) | 6 (100.0%) |
| 10 or more Apartments | 0 (0.0%) | 43 (100.0%) |
| Mobile Home / Other | 0 (0.0%) | 0 (0.0%) |
| Total | 469 (78.6%) | 128 (21.4%) |
Housing Structures by Number of Rooms in Foxfire
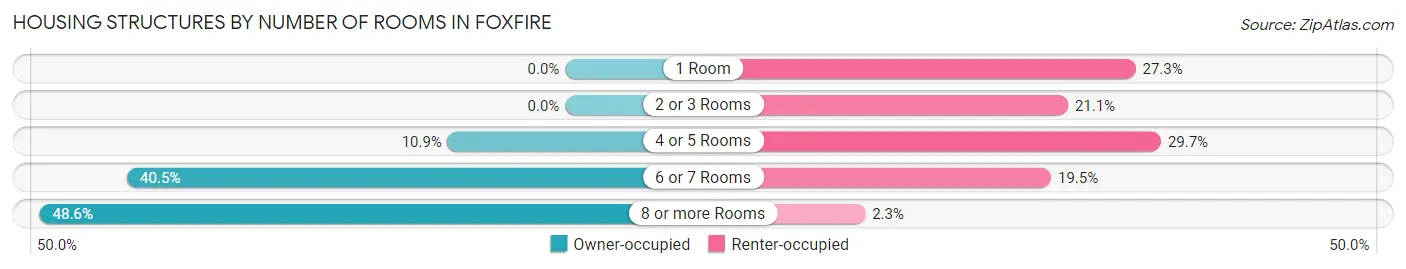
| Number of Rooms | Owner-occupied | Renter-occupied |
| 1 Room | 0 (0.0%) | 35 (27.3%) |
| 2 or 3 Rooms | 0 (0.0%) | 27 (21.1%) |
| 4 or 5 Rooms | 51 (10.9%) | 38 (29.7%) |
| 6 or 7 Rooms | 190 (40.5%) | 25 (19.5%) |
| 8 or more Rooms | 228 (48.6%) | 3 (2.3%) |
| Total | 469 (100.0%) | 128 (100.0%) |
Housing Structure by Heating Type in Foxfire
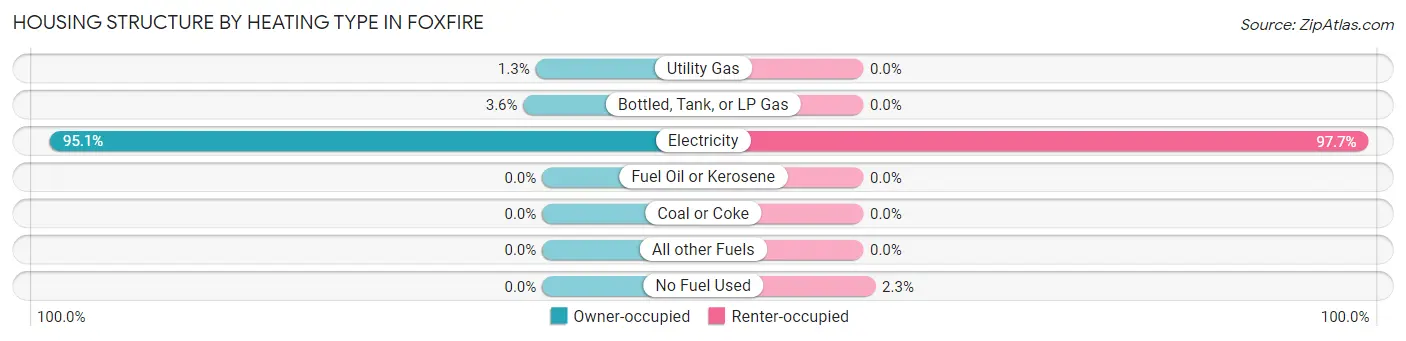
| Heating Type | Owner-occupied | Renter-occupied |
| Utility Gas | 6 (1.3%) | 0 (0.0%) |
| Bottled, Tank, or LP Gas | 17 (3.6%) | 0 (0.0%) |
| Electricity | 446 (95.1%) | 125 (97.7%) |
| Fuel Oil or Kerosene | 0 (0.0%) | 0 (0.0%) |
| Coal or Coke | 0 (0.0%) | 0 (0.0%) |
| All other Fuels | 0 (0.0%) | 0 (0.0%) |
| No Fuel Used | 0 (0.0%) | 3 (2.3%) |
| Total | 469 (100.0%) | 128 (100.0%) |
Household Vehicle Usage in Foxfire
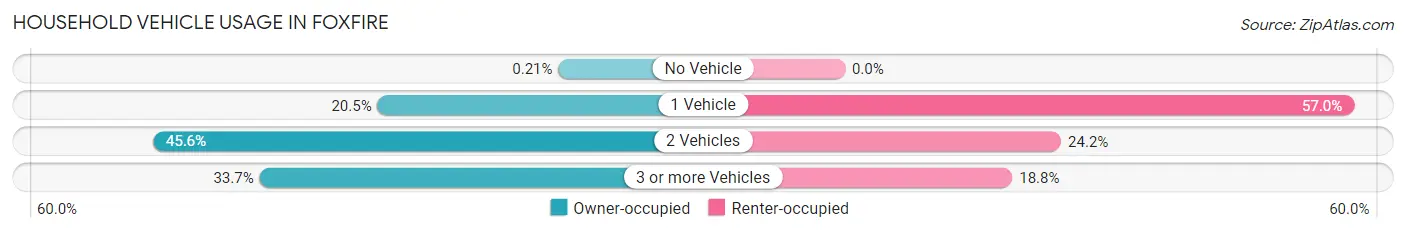
| Vehicles per Household | Owner-occupied | Renter-occupied |
| No Vehicle | 1 (0.2%) | 0 (0.0%) |
| 1 Vehicle | 96 (20.5%) | 73 (57.0%) |
| 2 Vehicles | 214 (45.6%) | 31 (24.2%) |
| 3 or more Vehicles | 158 (33.7%) | 24 (18.8%) |
| Total | 469 (100.0%) | 128 (100.0%) |
Real Estate & Mortgages in Foxfire
Real Estate and Mortgage Overview in Foxfire
| Characteristic | Without Mortgage | With Mortgage |
| Housing Units | 166 | 303 |
| Median Property Value | $336,200 | $338,600 |
| Median Household Income | $95,357 | $75 |
| Monthly Housing Costs | $520 | $27 |
| Real Estate Taxes | $2,395 | $5 |
Property Value by Mortgage Status in Foxfire
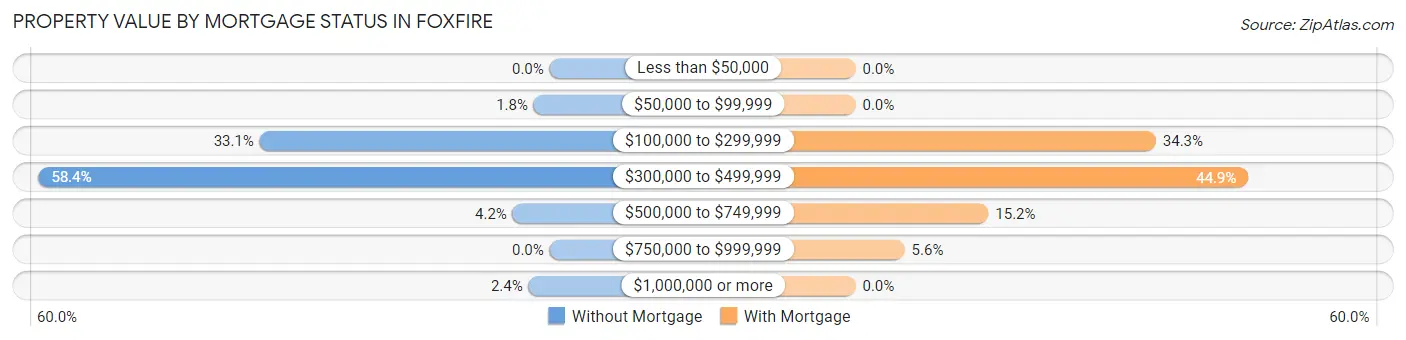
| Property Value | Without Mortgage | With Mortgage |
| Less than $50,000 | 0 (0.0%) | 0 (0.0%) |
| $50,000 to $99,999 | 3 (1.8%) | 0 (0.0%) |
| $100,000 to $299,999 | 55 (33.1%) | 104 (34.3%) |
| $300,000 to $499,999 | 97 (58.4%) | 136 (44.9%) |
| $500,000 to $749,999 | 7 (4.2%) | 46 (15.2%) |
| $750,000 to $999,999 | 0 (0.0%) | 17 (5.6%) |
| $1,000,000 or more | 4 (2.4%) | 0 (0.0%) |
| Total | 166 (100.0%) | 303 (100.0%) |
Household Income by Mortgage Status in Foxfire
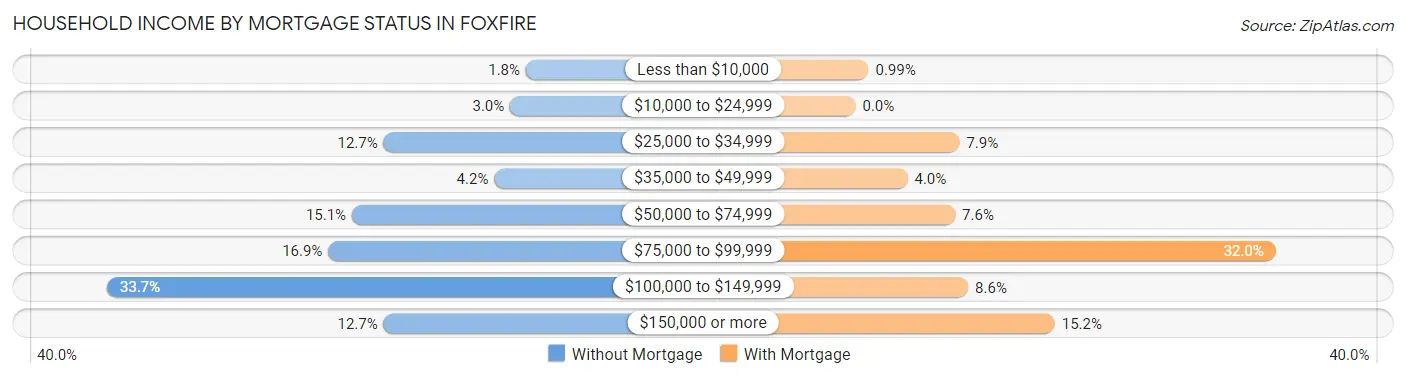
| Household Income | Without Mortgage | With Mortgage |
| Less than $10,000 | 3 (1.8%) | 3 (1.0%) |
| $10,000 to $24,999 | 5 (3.0%) | 0 (0.0%) |
| $25,000 to $34,999 | 21 (12.7%) | 24 (7.9%) |
| $35,000 to $49,999 | 7 (4.2%) | 12 (4.0%) |
| $50,000 to $74,999 | 25 (15.1%) | 23 (7.6%) |
| $75,000 to $99,999 | 28 (16.9%) | 97 (32.0%) |
| $100,000 to $149,999 | 56 (33.7%) | 26 (8.6%) |
| $150,000 or more | 21 (12.7%) | 46 (15.2%) |
| Total | 166 (100.0%) | 303 (100.0%) |
Property Value to Household Income Ratio in Foxfire
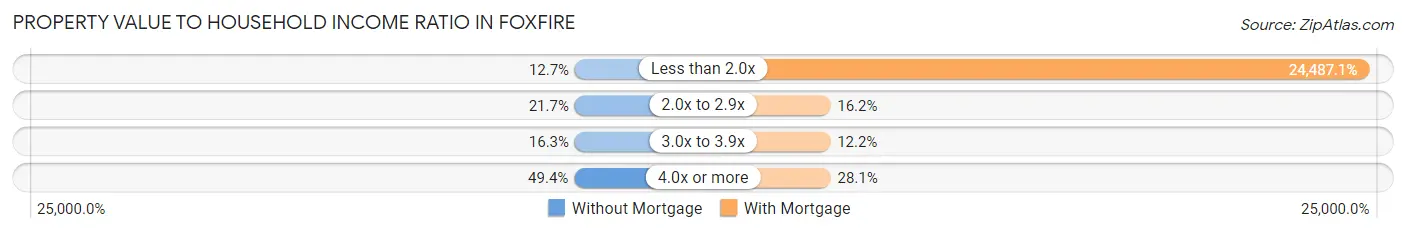
| Value-to-Income Ratio | Without Mortgage | With Mortgage |
| Less than 2.0x | 21 (12.7%) | 74,196 (24,487.1%) |
| 2.0x to 2.9x | 36 (21.7%) | 49 (16.2%) |
| 3.0x to 3.9x | 27 (16.3%) | 37 (12.2%) |
| 4.0x or more | 82 (49.4%) | 85 (28.1%) |
| Total | 166 (100.0%) | 303 (100.0%) |
Real Estate Taxes by Mortgage Status in Foxfire
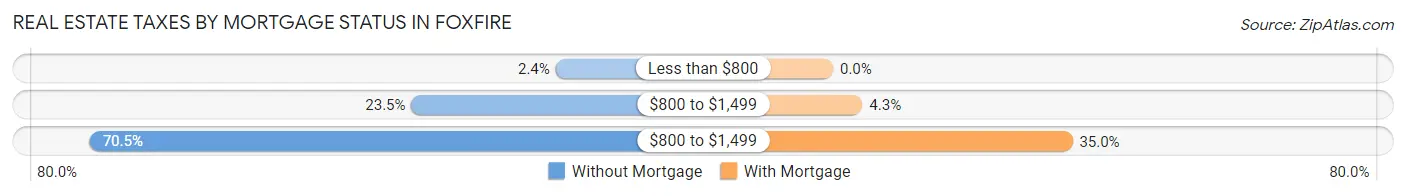
| Property Taxes | Without Mortgage | With Mortgage |
| Less than $800 | 4 (2.4%) | 0 (0.0%) |
| $800 to $1,499 | 39 (23.5%) | 13 (4.3%) |
| $800 to $1,499 | 117 (70.5%) | 106 (35.0%) |
| Total | 166 (100.0%) | 303 (100.0%) |
Health & Disability in Foxfire
Health Insurance Coverage by Age in Foxfire
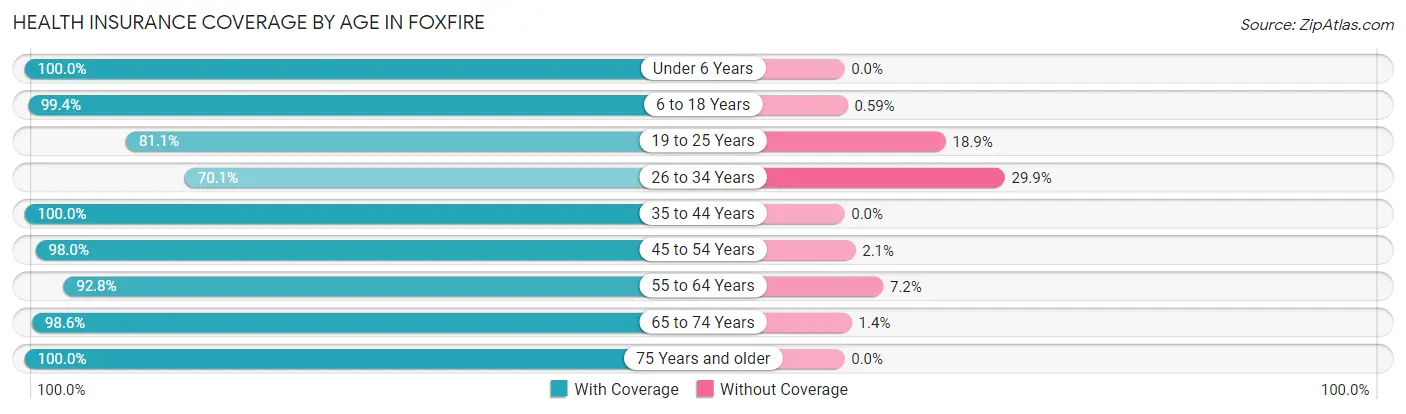
| Age Bracket | With Coverage | Without Coverage |
| Under 6 Years | 128 (100.0%) | 0 (0.0%) |
| 6 to 18 Years | 337 (99.4%) | 2 (0.6%) |
| 19 to 25 Years | 73 (81.1%) | 17 (18.9%) |
| 26 to 34 Years | 61 (70.1%) | 26 (29.9%) |
| 35 to 44 Years | 236 (100.0%) | 0 (0.0%) |
| 45 to 54 Years | 143 (98.0%) | 3 (2.1%) |
| 55 to 64 Years | 180 (92.8%) | 14 (7.2%) |
| 65 to 74 Years | 216 (98.6%) | 3 (1.4%) |
| 75 Years and older | 144 (100.0%) | 0 (0.0%) |
| Total | 1,518 (95.9%) | 65 (4.1%) |
Health Insurance Coverage by Citizenship Status in Foxfire
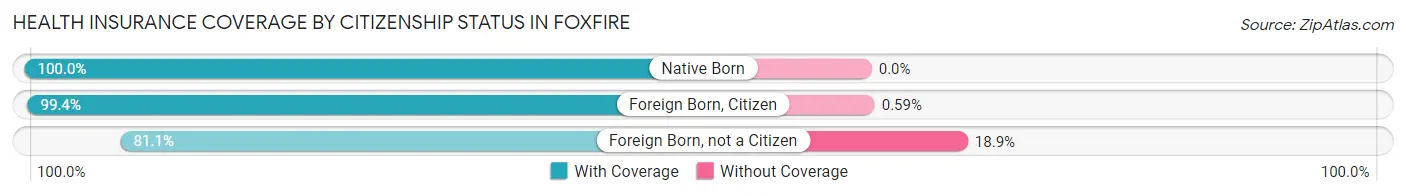
| Citizenship Status | With Coverage | Without Coverage |
| Native Born | 128 (100.0%) | 0 (0.0%) |
| Foreign Born, Citizen | 337 (99.4%) | 2 (0.6%) |
| Foreign Born, not a Citizen | 73 (81.1%) | 17 (18.9%) |
Health Insurance Coverage by Household Income in Foxfire
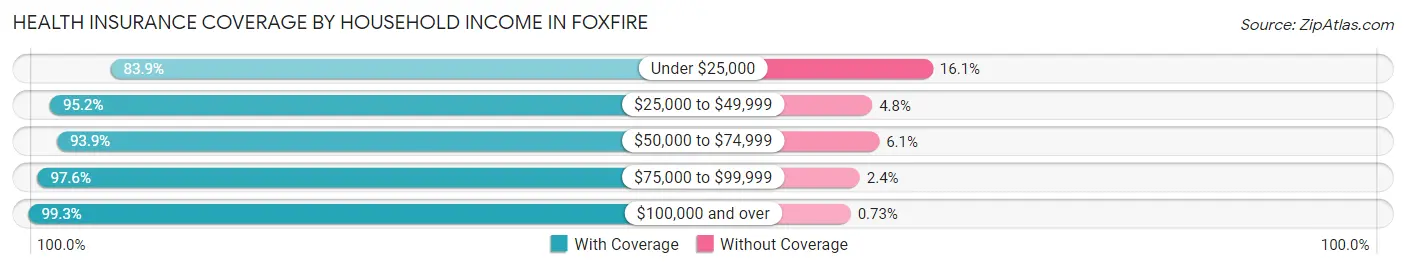
| Household Income | With Coverage | Without Coverage |
| Under $25,000 | 52 (83.9%) | 10 (16.1%) |
| $25,000 to $49,999 | 260 (95.2%) | 13 (4.8%) |
| $50,000 to $74,999 | 542 (93.9%) | 35 (6.1%) |
| $75,000 to $99,999 | 120 (97.6%) | 3 (2.4%) |
| $100,000 and over | 544 (99.3%) | 4 (0.7%) |
Public vs Private Health Insurance Coverage by Age in Foxfire
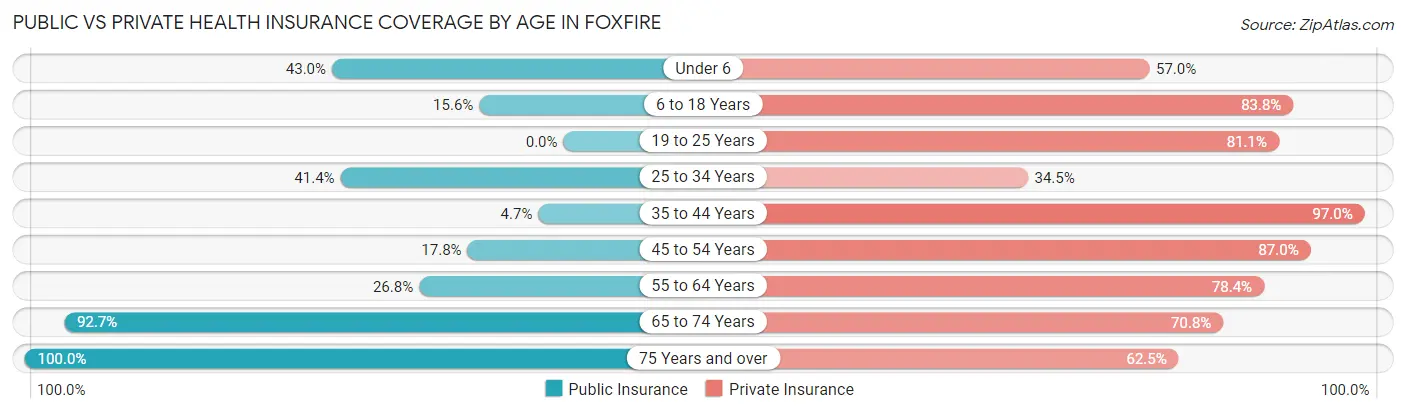
| Age Bracket | Public Insurance | Private Insurance |
| Under 6 | 55 (43.0%) | 73 (57.0%) |
| 6 to 18 Years | 53 (15.6%) | 284 (83.8%) |
| 19 to 25 Years | 0 (0.0%) | 73 (81.1%) |
| 25 to 34 Years | 36 (41.4%) | 30 (34.5%) |
| 35 to 44 Years | 11 (4.7%) | 229 (97.0%) |
| 45 to 54 Years | 26 (17.8%) | 127 (87.0%) |
| 55 to 64 Years | 52 (26.8%) | 152 (78.3%) |
| 65 to 74 Years | 203 (92.7%) | 155 (70.8%) |
| 75 Years and over | 144 (100.0%) | 90 (62.5%) |
| Total | 580 (36.6%) | 1,213 (76.6%) |
Disability Status by Sex by Age in Foxfire
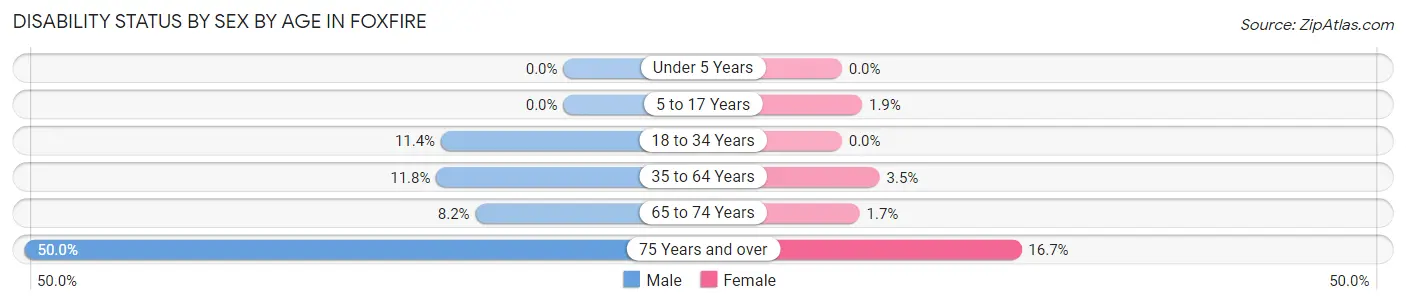
| Age Bracket | Male | Female |
| Under 5 Years | 0 (0.0%) | 0 (0.0%) |
| 5 to 17 Years | 0 (0.0%) | 4 (1.9%) |
| 18 to 34 Years | 10 (11.4%) | 0 (0.0%) |
| 35 to 64 Years | 31 (11.8%) | 11 (3.5%) |
| 65 to 74 Years | 8 (8.2%) | 2 (1.7%) |
| 75 Years and over | 36 (50.0%) | 12 (16.7%) |
Disability Class by Sex by Age in Foxfire
Disability Class: Hearing Difficulty
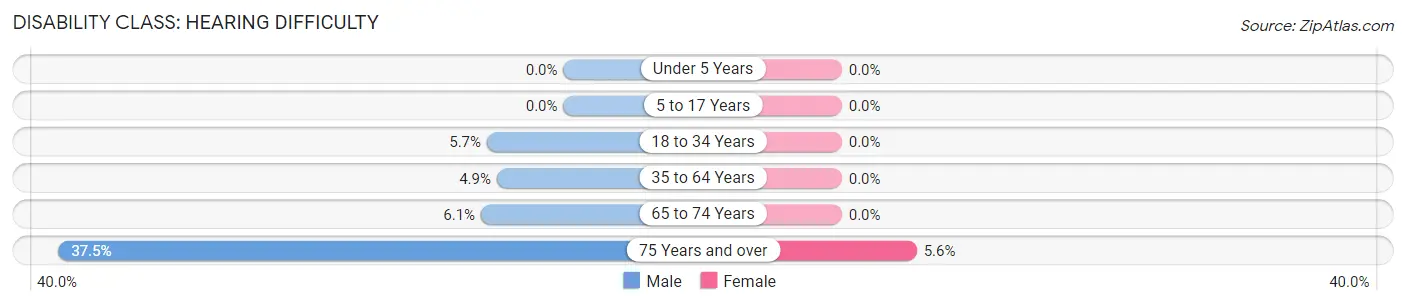
| Age Bracket | Male | Female |
| Under 5 Years | 0 (0.0%) | 0 (0.0%) |
| 5 to 17 Years | 0 (0.0%) | 0 (0.0%) |
| 18 to 34 Years | 5 (5.7%) | 0 (0.0%) |
| 35 to 64 Years | 13 (4.9%) | 0 (0.0%) |
| 65 to 74 Years | 6 (6.1%) | 0 (0.0%) |
| 75 Years and over | 27 (37.5%) | 4 (5.6%) |
Disability Class: Vision Difficulty
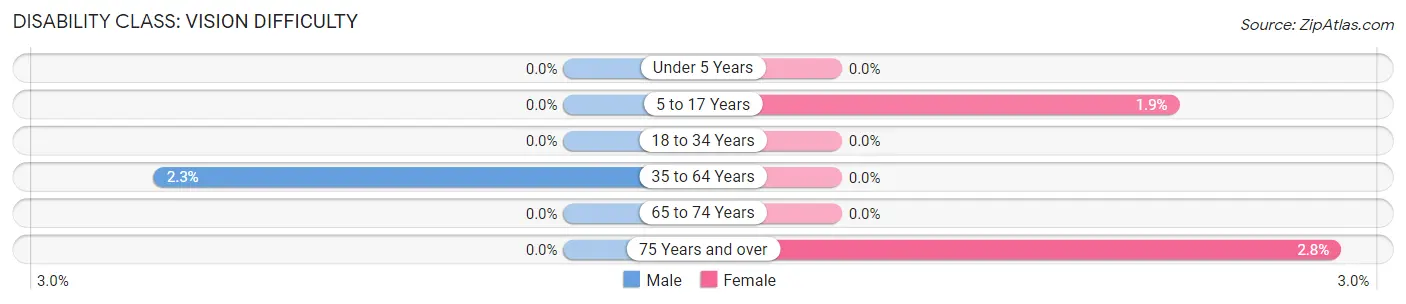
| Age Bracket | Male | Female |
| Under 5 Years | 0 (0.0%) | 0 (0.0%) |
| 5 to 17 Years | 0 (0.0%) | 4 (1.9%) |
| 18 to 34 Years | 0 (0.0%) | 0 (0.0%) |
| 35 to 64 Years | 6 (2.3%) | 0 (0.0%) |
| 65 to 74 Years | 0 (0.0%) | 0 (0.0%) |
| 75 Years and over | 0 (0.0%) | 2 (2.8%) |
Disability Class: Cognitive Difficulty
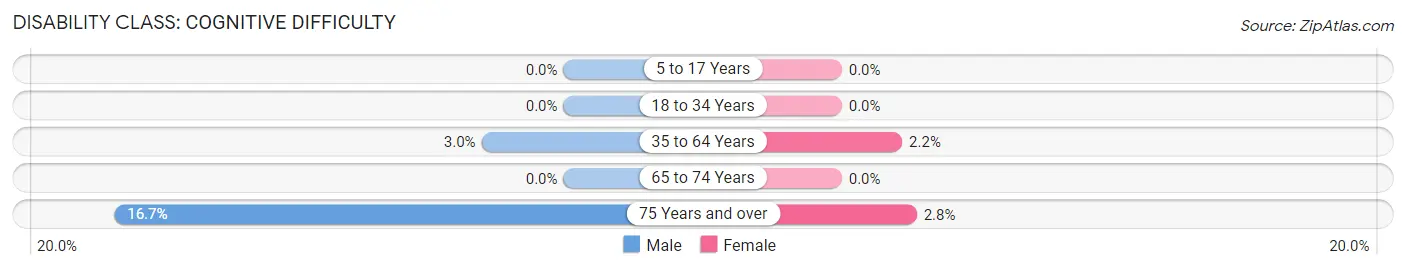
| Age Bracket | Male | Female |
| 5 to 17 Years | 0 (0.0%) | 0 (0.0%) |
| 18 to 34 Years | 0 (0.0%) | 0 (0.0%) |
| 35 to 64 Years | 8 (3.0%) | 7 (2.2%) |
| 65 to 74 Years | 0 (0.0%) | 0 (0.0%) |
| 75 Years and over | 12 (16.7%) | 2 (2.8%) |
Disability Class: Ambulatory Difficulty
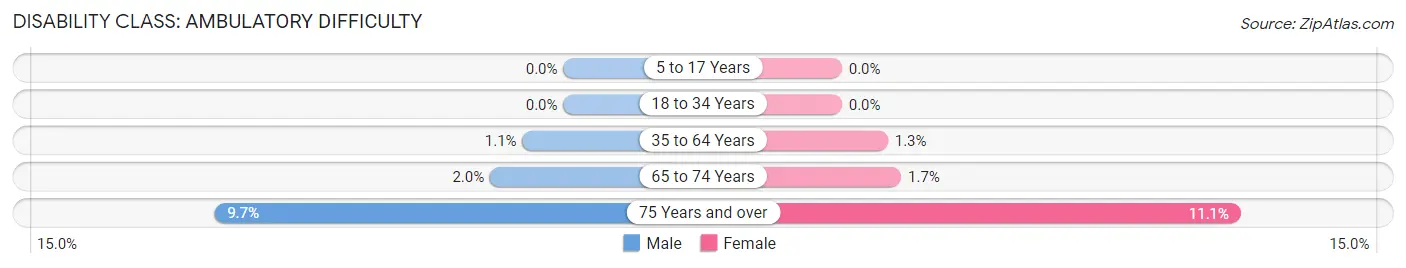
| Age Bracket | Male | Female |
| 5 to 17 Years | 0 (0.0%) | 0 (0.0%) |
| 18 to 34 Years | 0 (0.0%) | 0 (0.0%) |
| 35 to 64 Years | 3 (1.1%) | 4 (1.3%) |
| 65 to 74 Years | 2 (2.0%) | 2 (1.7%) |
| 75 Years and over | 7 (9.7%) | 8 (11.1%) |
Disability Class: Self-Care Difficulty
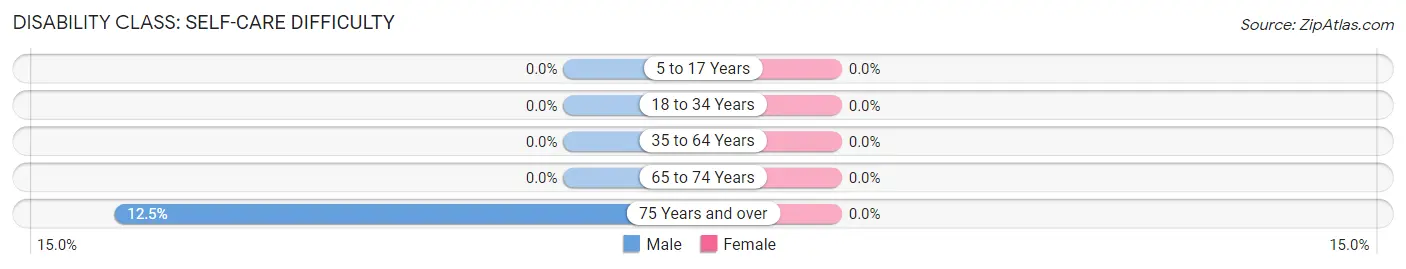
| Age Bracket | Male | Female |
| 5 to 17 Years | 0 (0.0%) | 0 (0.0%) |
| 18 to 34 Years | 0 (0.0%) | 0 (0.0%) |
| 35 to 64 Years | 0 (0.0%) | 0 (0.0%) |
| 65 to 74 Years | 0 (0.0%) | 0 (0.0%) |
| 75 Years and over | 9 (12.5%) | 0 (0.0%) |
Technology Access in Foxfire
Computing Device Access in Foxfire
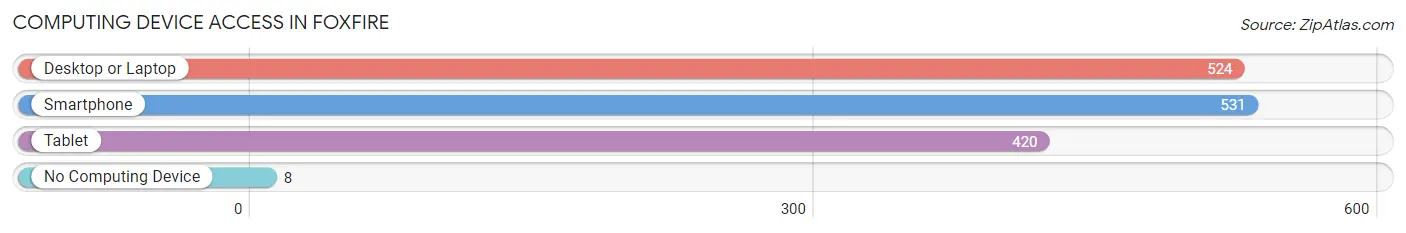
| Device Type | # Households | % Households |
| Desktop or Laptop | 524 | 87.8% |
| Smartphone | 531 | 88.9% |
| Tablet | 420 | 70.4% |
| No Computing Device | 8 | 1.3% |
| Total | 597 | 100.0% |
Internet Access in Foxfire
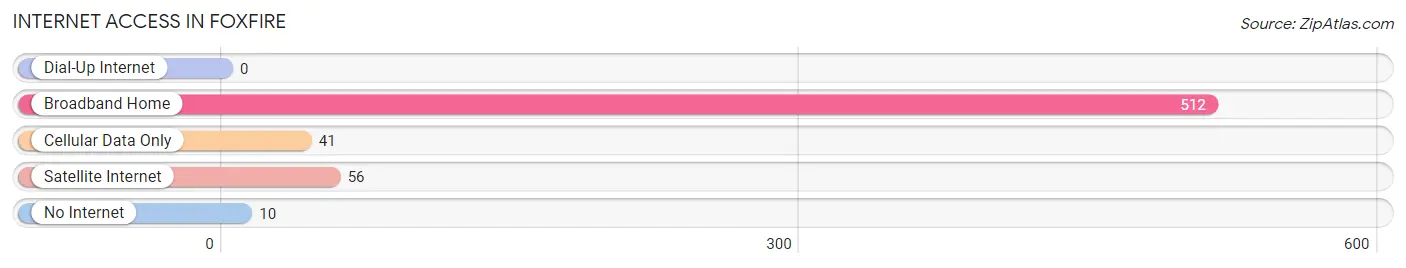
| Internet Type | # Households | % Households |
| Dial-Up Internet | 0 | 0.0% |
| Broadband Home | 512 | 85.8% |
| Cellular Data Only | 41 | 6.9% |
| Satellite Internet | 56 | 9.4% |
| No Internet | 10 | 1.7% |
| Total | 597 | 100.0% |
Foxfire Summary
Firefox, NC is a small town located in the foothills of the Blue Ridge Mountains in western North Carolina. The town was founded in 1887 and is home to approximately 1,500 people. The town is located in the heart of the Appalachian Mountains and is surrounded by lush forests and rolling hills.
Geography
Firefox, NC is located in the foothills of the Blue Ridge Mountains in western North Carolina. The town is situated in the Appalachian Mountains and is surrounded by lush forests and rolling hills. The town is located in the Piedmont region of North Carolina and is approximately 30 miles from Asheville, NC. The town is located at an elevation of 1,400 feet and is situated on the banks of the French Broad River. The town is located in the Pisgah National Forest and is home to numerous hiking trails, waterfalls, and other outdoor activities.
Economy
The economy of Firefox, NC is largely based on tourism and agriculture. The town is home to numerous small businesses, including restaurants, shops, and galleries. The town is also home to a number of farms, which produce a variety of fruits and vegetables. The town is also home to a number of craft breweries, wineries, and distilleries. The town is also home to a number of outdoor recreation activities, including hiking, fishing, and camping.
Demographics
As of the 2010 census, the population of Firefox, NC was 1,500. The town is predominantly white, with approximately 95% of the population being Caucasian. The town is also home to a small Hispanic population, with approximately 4% of the population being of Hispanic or Latino origin. The town is also home to a small African American population, with approximately 1% of the population being African American. The median household income in Firefox, NC is approximately $35,000.
Conclusion
Firefox, NC is a small town located in the foothills of the Blue Ridge Mountains in western North Carolina. The town is home to approximately 1,500 people and is largely based on tourism and agriculture. The town is predominantly white, with approximately 95% of the population being Caucasian. The town is also home to a small Hispanic population, with approximately 4% of the population being of Hispanic or Latino origin. The town is also home to a small African American population, with approximately 1% of the population being African American. The median household income in Firefox, NC is approximately $35,000. The town is home to numerous small businesses, farms, craft breweries, wineries, and distilleries. The town is also home to a number of outdoor recreation activities, including hiking, fishing, and camping.
Common Questions
What is Per Capita Income in Foxfire?
Per Capita income in Foxfire is $37,263.
What is the Median Family Income in Foxfire?
Median Family Income in Foxfire is $88,472.
What is the Median Household income in Foxfire?
Median Household Income in Foxfire is $69,782.
What is Income or Wage Gap in Foxfire?
Income or Wage Gap in Foxfire is 48.6%.
Women in Foxfire earn 51.4 cents for every dollar earned by a man.
What is Inequality or Gini Index in Foxfire?
Inequality or Gini Index in Foxfire is 0.41.
What is the Total Population of Foxfire?
Total Population of Foxfire is 1,588.
What is the Total Male Population of Foxfire?
Total Male Population of Foxfire is 738.
What is the Total Female Population of Foxfire?
Total Female Population of Foxfire is 850.
What is the Ratio of Males per 100 Females in Foxfire?
There are 86.82 Males per 100 Females in Foxfire.
What is the Ratio of Females per 100 Males in Foxfire?
There are 115.18 Females per 100 Males in Foxfire.
What is the Median Population Age in Foxfire?
Median Population Age in Foxfire is 38.7 Years.
What is the Average Family Size in Foxfire
Average Family Size in Foxfire is 3.2 People.
What is the Average Household Size in Foxfire
Average Household Size in Foxfire is 2.7 People.
How Large is the Labor Force in Foxfire?
There are 591 People in the Labor Forcein in Foxfire.
What is the Percentage of People in the Labor Force in Foxfire?
48.5% of People are in the Labor Force in Foxfire.
What is the Unemployment Rate in Foxfire?
Unemployment Rate in Foxfire is 1.2%.